THE RELIABILITY OF MYSTERY SHOPPING REPORTSessay.utwente.nl/71703/1/DUURLAND_MA_BMS.pdf · Mystery...
46
1 Master thesis February 2017 THE RELIABILITY OF MYSTERY SHOPPING REPORTS An experimental study investigating the accuracy of the mystery shopper, the possible presence of halo effects in mystery shopping methodology and the influence of time delay between observation and reporting. Wendy Duurland - s1110829 FACULTY OF BEHAVIOURAL, MANAGEMENT AND SOCIAL SCIENCES MASTER COMMUNICATION STUDIES EXAMINATION COMMITTEE: Dr. J.J. van Hoof Dr. J.F. Gosselt
Transcript of THE RELIABILITY OF MYSTERY SHOPPING REPORTSessay.utwente.nl/71703/1/DUURLAND_MA_BMS.pdf · Mystery...

1
Master thesis February 2017
THE RELIABILITY OF MYSTERY SHOPPING REPORTS An experimental study investigating the accuracy of the mystery shopper, the possible presence of halo effects in mystery shopping methodology and the influence of time delay between observation and reporting. Wendy Duurland - s1110829 FACULTY OF BEHAVIOURAL, MANAGEMENT AND SOCIAL SCIENCES MASTER COMMUNICATION STUDIES EXAMINATION COMMITTEE: Dr. J.J. van Hoof Dr. J.F. Gosselt

2
ABSTRACT
Objectives: This study evaluates the reliability of the mystery shopping method by testing the
accuracy of the mystery shopper when reporting facts and investigating the possible presence of
halo effects in mystery shopping reports. Furthermore, this study evaluates the influence of time
delay between observation and reporting on the accuracy of mystery shopping reports and the
possible relationship between time delay and halo effects.
Method: A 2*3 experimental design was set up (employee with sufficient expertise vs. employee
without sufficient expertise and no time delay vs. 1 hour time delay vs. 24 hours time delay). 94
mystery shoppers visited a service desk thinking they were investigating the service quality of that
service desk. If fact, the behavior of the mystery shopper was the subject of the study and the
participants did not know the situation was set up. To test the accuracy of mystery shoppers, the
mystery shoppers observed six factual environmental factors which they could report either
correctly or incorrectly afterwards. To test possible halo effects, the behavior of the employee was
negatively manipulated. When a mystery shopper encountered an employee without sufficient
expertise, it was tested if other constructs (physical environment, policies & proficiencies, overall
evaluation) were also evaluated more negatively, which indicates a halo effect. To test the
influence of time delay, the mystery shoppers had to fill in the questionnaire corresponding to one
of the three time delay conditions.
Results: The current study indicates that mystery shoppers are for 71% accurate when they do
not work under time pressure. When mystery shoppers do experience time pressure, they are only
for 48% accurate. Having previous mystery shopping experience also influences the accuracy of
mystery shoppers positively. At least nine mystery shopping visits per service outlet are necessary
to obtain accurate mystery shopping results. Halo effects were found within the employee
construct and on two policy & proficiencies items. No halo effects on the physical environment
construct and on the four other policy & proficiencies items were found. Besides, time delay
between observation and reporting (until 24 hours) does neither influence the accuracy of mystery
shoppers, nor does it increase halo effects in mystery shopping reports.
Discussion: The current study shows that mystery shoppers do not always provide accurate data.
To increase the reliability of mystery shopping, this study suggests that mystery shoppers should
not work under time pressure, experienced mystery shoppers should be hired and at least 9
mystery shopping visits per outlet should be executed. Furthermore, halo effects could be present
in mystery shopping reports, especially within the employee construct, though they do not seem
very threatening. No halo effects were found on the physical environment, so mystery shopping
data on this subject is reliable. Time delay between observation and reporting (until 24 hours) does
not threaten the reliability of mystery shopping reports, since no differences were found within the
three time delay conditions regarding accuracy and halo effects.
Keywords: Mystery Shopping Reports. Accuracy, Halo Effects, Time Delay, Reliability

3
INDEX
ABSTRACT ___________________________________________________________________ 2
INDEX ________________________________________________________________________ 3
1. INTRODUCTION ___________________________________________________________ 4
2. THEORETICAL FRAMEWORK ________________________________________________ 6
2.1 Measuring service quality .............................................................................................................. 6
2.2 Mystery shopping .......................................................................................................................... 7
2.3 Halo Effects ................................................................................................................................... 8
2.4 Time delay ................................................................................................................................... 10
2.5 Research questions ..................................................................................................................... 12
3. METHOD ________________________________________________________________ 13
3.1 Research design.......................................................................................................................... 13
3.2 Research procedure .................................................................................................................... 13
3.3 Research instrument ................................................................................................................... 15
3.4 Pre-tests ...................................................................................................................................... 17
3.5 Participants .................................................................................................................................. 18
4. RESULTS ________________________________________________________________ 20
4.2 Characteristics influencing accuracy ........................................................................................... 20
4.3 Amount of necessary visits to obtain accurate reports ............................................................... 21
4.4. Halo effects in mystery shopping reports ................................................................................... 22
4.5 Influence of time delay on accuracy of mystery shopping reports .............................................. 24
4.6 Influence of time delay on the presence of halo effects .............................................................. 26
5. DISCUSSION _____________________________________________________________ 31
5.1. Accuracy of mystery shoppers when measuring facts ............................................................... 31
5.2. Halo effects in mystery shopping reports ................................................................................... 32
5.3. Influence of time delay ............................................................................................................... 33
5.4. Managerial implications .............................................................................................................. 34
5.5. Limitations .................................................................................................................................. 34
5.6. Future research .......................................................................................................................... 35
5.7. Conclusions ................................................................................................................................ 36
REFERENCES ________________________________________________________________ 37
ATTACHMENT 1 – MYSTERY SHOPPER BRIEFING _________________________________ 40
ATTACHMENT 2 – INFORMED CONSENT _________________________________________ 41
ATTACHMENT 3 – CHECKLIST __________________________________________________ 45
ATTACHMENT 4 – QUESTIONNAIRE _____________________________________________ 46

4
1. INTRODUCTION
Mystery shopping is a research method whereby researchers act as customers or potential
customers in order to evaluate service outcomes. Examples of those service outcomes are service
quality or compliance with legislation (Wilson, 1998). Mystery shopping is a booming business. It is
currently a 1.5 billion dollar industry worldwide (MSPA, 2014) and is becoming a more and more
popular instrument to measure service quality. A reason for this increase in popularity is that
retailers are becoming increasingly aware of the customer’s need for a great service experience.
Since online shopping is continuously growing, retailers need to persuade customers to go to a
physical store instead of going shopping online. As the article of The Guardian states, retailers
need to provide ‘A service and experience they can’t get online’.
Mystery shopping is of course not the only way to measure service quality. Another popular
method to measure service quality and customer satisfaction is for example by means of customer
surveys. However, the mystery shopping method offers several advantages in comparison with
customer surveys. While traditional customer surveys measure mostly the outcomes of a service
encounter, the mystery shopping approach also measures the process (Wilson, 2001).
Furthermore, using the mystery shopping approach it is possible to measure whether procedures
are followed instead of gathering opinions about the service experience (Wilson, 2001). Lowndes
and Dawes (2001) state that customer surveys are by definition subjective since two customers
can experience the same service in a different way. By using the mystery shopping approach, it is
possible to collect more objective experiences about a service encounter.
Besides the advantages mystery shopping has to offer, the method might also have some
drawbacks. The fact that the mystery shopper is an essential part of the research instrument could
threaten the reliability of the research. There is a great reliance on the memory of the mystery
shopper, as the elements that need to be evaluated need to be learned by heart before the
mystery shopping visit takes place. Also, all observations during the mystery shopping visit need to
“The customer next to you in the queue looks innocent enough. But instead of a shopping list,
you notice she's carrying handwritten notes about the appearance and cleanliness of the store.
She's been timing the progression of the queue on her phone… and is that a tiny camera lens
peeking out from her purse? There's no trenchcoat in sight, but odds are, you've just spotted a
mystery shopper. There are approximately 50.000 mystery shopping trips carried out every
month in the UK, according to the Mystery Shopping Providers Association (MSPA), and as
more and more spending takes place online, the demand for mystery shoppers is growing.
"Retailers are becoming increasingly aware that shoppers who are prepared to set foot in a
physical store want a service and an experience they can't get online," says Simon Boydell,
spokesman for Marketforce, which has more than 300,000 mystery shoppers on its books. "Our
clients want to measure how well their stores are delivering on that experience." (The
Guardian, 2014)
5
be remembered correctly and reported in an objective way afterwards (Morrison, 1997). Although it
is known that the mystery shopping method faces some reliability threats, there are only a few
academic studies which investigate the reliability of the method. This is remarkable, considering
the popularity and possible impact of the method. Therefore, the current study focuses on the
reliability of the mystery shopping method.
This study examines several aspects of the reliability of mystery shopping. First, it will be
investigated whether mystery shoppers are capable of reporting facts accurately. Second, it will be
measured whether halo effects are present in mystery shopping reports. When a manager for
example wants to know which elements of the service quality are good and which elements need
improvement, it is important that the mystery shopper evaluates different elements of the service
quality separately. However, research in other contexts (for example psychology) demonstrates
that people are not always able to evaluate different attributes separately but rather evaluate
attributes as a whole. When the evaluation of specific attributes is influenced by a dominant
attribute or general impressions, it is possible that the results are influenced by halo effects and
are therefore less accurate (Nisbett & Wilson, 1977). Another possible reliability threat that will be
addressed during this study is the effect of time delay between observation of the outlet and
reporting of the results. Research in the context of performance ratings show that halo effects are
even bigger when there is time delay between observation and reporting (Ostrognay, & Langan-
Fox, 1996; Kozlowski & Ford, 1991; Murphy & Reynolds; 1988; Nathan & Lord, 1983). Additionally,
it is likely that time delay between observation and reporting also causes less accurate reports,
because mystery shoppers simply forget details over time. This will also be investigated during this
study.
Knowing whether mystery shoppers report accurately and whether halo effects are present in
mystery shopping reports is important, since both a lack of accuracy as well as halo effects could
threaten the reliability of mystery shopping reports. When mystery shopping reports are not
reliable, wrong conclusions could be drawn. Besides, it is important to know whether time delay
influences the accuracy of mystery shopping reports and the presence of halo effects, since it is
not always possible to report the observations right after the visit.
The main research question of the current study is:
To what extent is mystery shopping a reliable research method when it concerns the accuracy of
mystery shoppers, the presence of halo effects and the influence of time delay between
observation and reporting?
6
2. THEORETICAL FRAMEWORK
This chapter contains the theoretical framework on which the study is based. First, the subject
service quality will be discussed. A way to measure service quality is by means of mystery
shopping, which is the next subject that will be discussed. Then the presence of halo effects in the
context of mystery shopping will be addressed. Last, the effects of time delay between observation
and reporting in the context of mystery shopping will be discussed.
2.1 Measuring service quality
Service quality is referred to as the realization of meeting customers’ needs, wants and
expectations (Strawderman & Koubek, 2008). Meeting these needs, wants and expectations is
important as customers are looking for service experiences that fit their lifestyle and they are
willing to pay for that (Smith and Wheeler, 2002). Customers are inclined to pay more for products
or services when the service environment is perceived as pleasant (Smith and Wheeler, 2002).
Wirtz & Bateson (1995) state that the customer’s experience during the service delivery is just as
important as the benefit that the service provides. As a consequence, it is important to measure
service quality. When service quality is being measured, it can be found out if the level of service
quality meets the desired standards and which elements of the service quality need to be
improved in order to create a pleasant service environment. However, service quality is not easy to
measure. Services are intangible, inseparable, heterogeneous (Strawderman & Koubek, 2008)
and the production and consumption of a service happen at the same time. Besides, services are
immaterial, which means they have no physical manifestation (Strawderman & Koubek, 2008).
2.1.1. Underlying levels of service quality
To make different aspects of service quality measurable, several authors tried to define underlying
dimensions of service quality, but a lack of consensus exists between authors. Render (2014) set
up a generalized conceptualization of underlying service quality levels based on existing literature.
The following underlying dimensions of service quality were defined:
1. Physical environment. The physical environment dimension includes all factors which
concern the presence, quality or appearance of physical factors in and around the store
and the comfort those factors provide for the customers. Examples are the cleanliness and
beauty of the store.
2. Employees. The employee dimension comprises all factors which are linked to the
employee-customer interaction or the employees’ characteristics. Examples are the
friendliness or employee’s expertise.
3. Policies and proficiencies. This dimension includes items concerning the handled policies
of the service provider and its proficiencies. Examples are compliances, administration,
corporate social responsibility and customer treatment.
7
4. Overall service evaluation. This level includes the overall feeling about the service
provision and the emotional outcomes. This level is the outcome of the evaluations of the
physical environment, the employees and the policies and proficiencies.
Smith and Wheeler (2002) state that the only way to create positive customer experiences is to
create balance between all underlying levels of service quality. A method to measure this is by
means of the mystery shopping method.
2.2 Mystery shopping
Mystery shopping is a research technique which uses researchers to act as customers or potential
customers in order to evaluate service quality (Wilson, 1998). The most typical characteristic of
mystery shopping is that subjects are not aware of their participation in the study, since their
awareness can lead to atypical behavior, which can lead to less valid results (ESOMAR, 2005).
The mystery shopping method is used in a wide range of branches such as financial services,
retailing, hotels, public utilities and government departments (Wilson, 2001).
According to Wilson (1998), results from mystery shopping studies are used for three main
purposes:
1. Mystery shopping research can be used as a diagnostic tool to identify weak elements in
an organization’s service delivery.
2. Mystery shopping research can be used to encourage, develop and motivate service
personnel.
3. Mystery shopping research can be used to evaluate the competitiveness of an
organization’s service provision by benchmarking it against the service provision of
competitors in an industry.
2.2.1 Design of a mystery shopping study
Van der Wiele, Hesselink & Van Waarden (2005) defined different steps in the design of a mystery
shopping study.
1. When designing a mystery shopping study, the first step is to define goals. These goals
can be used as input for the checklists on which the elements that need to be evaluated
are defined. The checklist should be created by going through the process of the service
delivery and by paying attention to potential failure points. Also, the underlying dimensions
of service quality, which are discussed earlier, can be useful for creating a checklist.
2. When the checklist is created, the second step in the design of a mystery shopping study
is data gathering. The gathered data should cover the applicable service quality
dimensions and the key performance indicators defined by the organization. These key
performance indicators are related to the vision and mission of the organization. The
mystery shoppers who gather the data need to be independent, critical, objective and
anonymous (Van der Wiele et al., 2005).
8
3. The final step in the design of a mystery shopping study is the reporting of results. First,
the gathered data should be analyzed objectively. Then the data should be reported in a
clear and transparent way and presented to responsible managers as soon as possible
after the visits (Van der Wiele et al., 2005).
2.2.2. Advantages and limitations of the mystery shopping approach
According to Strawderman and Koubek (2008), a service consists of two outcomes: a technical
outcome and a functional outcome. The technical outcome is that which is delivered to the
customer, the result of the service encounter. The functional outcome comprises the service
delivery process. While customer surveys most of the times only measure the technical outcomes,
the mystery shopping method also measures the functional outcome, so the whole process
(Wilson, 2001). In addition, mystery shopping provides more objective data than customer surveys
(Wilson, 2001). Overall, Wilson (2001) states that only mystery shopping has the potential to
directly measure service quality across the full range of predetermined service quality standards,
including actual behavioral elements of service performance.
Besides the advantages of mystery shopping, the method also faces some limitations. The most
important limitations concern the generalizability and reliability of the method. Although Finn and
Kayandé (1999) found that individual mystery shoppers provided higher quality data than
customers do, they also found that it takes more than 3.5 mystery shopping reports (the average
amount of mystery shopping visits per outlet) to make a generalizable judgment about the service
quality. Their study suggests that generalizable information through mystery shopping could only
be obtained by collecting data from at least forty mystery shopping visits per outlet. This indicates
that mystery shopping is a labor intensive and therefore also a costly research method.
In addition to generalizability, the reliability of the method might also be a limitation, since there is
a great reliance on the memory of the mystery shopper. Mystery shoppers might forget to check
some items on the list, since the items that need to be evaluated need to be learned by heart
before the mystery shopping visit takes place (Morrison et al., 1997). Another challenge on the
side of the mystery shopper is to remember all evaluations and report them correctly on the
evaluation form (Morrison et al., 1997) and to evaluate all items on the checklist objectively.
2.3 Halo Effects
Concerning the objectivity of mystery shopping reports, it is important that mystery shoppers
evaluate all items separately instead of basing the evaluation of the items on a general opinion.
Dissatisfaction with one element or dimension of service quality can lead to overall customer
dissatisfaction. By identifying the cause of the overall dissatisfaction, managers know which
elements of the service provision need to be improved in order to let the overall customer
satisfaction increase (Wirtz & Bateson, 1995). This is only possible when mystery shoppers
evaluate all elements on the list separately. However, studies in other contexts, like customer
satisfaction surveys, suggest that people are not always able to evaluate specific attributes

9
separately (Nisbett & Wilson, 1977; Van Doorn, 2008; Wirtz, 2000). When the evaluation of
specific attributes is influenced by the evaluation of a dominant attribute or a general impressions,
it is possible that the results are influenced by halo effects (Nisbett & Wilson, 1977) and are
therefore less accurate.
The first person who defined the halo effect was Thorndike in 1920. Thorndike believed that
people are unable to resist the affective influence of global evaluation on evaluation of specific
attributes (Nisbett & Wilson, 1977). Nisbett and Wilson (1977) proved that halo effects are strong,
because they found that global evaluations alter evaluations of specific attributes, even when the
individual has sufficient information to fulfill an independent assessment. The research of Nisbett
and Wilson (1977) was conducted at a psychological level (the participants had to evaluate
personality characteristics), but further research showed that halo effects were also present in
other contexts, like customer satisfaction research. Surveys in customer satisfaction research are
often based on multi-attribute models. When using multi-attribute models, the level of satisfaction
is measured by evaluating salient attributes separately (Wirtz & Bateson, 1995), but a frequently
reported problem regarding the use of multi-attribute models are halo effects. (Wirtz & Bateson,
1995). Two main forms of halo effects are discussed in literature:
1. The evaluation of a specific attribute can be influenced by an overall or general impression
(Beckwirth et al, 1978). A strong liking or disliking of a service provider can for example
influence the evaluation of all specific attributes of the service quality.
2. The evaluation of specific attributes can be influenced by a dominant attribute (Nisbett &
Wilson, 1977). When for example one specific attribute is very positive or negative, this
dominant attribute can influence the evaluation of the other attributes. In this case, halo
effects are caused by the tendency of people to maintain cognitive consistency (Holbrook,
1983).
This study will focus on the second form of halo effects, when the evaluation of specific attributes
is influenced by a dominant attribute.
2.3.1. Halo effects in mystery shopping
Evaluating service quality by means of mystery shopping is most often also based on multi-
attribute models. In mystery shopping, the goal is to evaluate salient attributes of service quality
separately. To define those salient attributes, the underlying dimensions of service quality defined
by Render (2014) could for example be useful. Strikingly, there hardly exists any research about
halo effects in the context of mystery shopping. At one hand it could be expected that halo effects
are also present in mystery shopping, as according to Thorndike (1920), people are unable to
resist the affective influence of global evaluation on the evaluation of specific attributes. On the
other hand, mystery shoppers are specifically trained to evaluate those attributes separately.
The only study in which the presence of halo effects is investigated in a mystery shopping context
has been executed by Render (2014). Render (2014) investigated if there were halo effects

10
between the underlying dimensions of service quality in the context of mystery shopping. A
marginally significant halo effect of Level 2 on Level 3 was found, which showed that the mystery
shoppers’ opinion about the employee could affect the mystery shoppers’ opinion about policies
and proficiencies. Render (2014) concluded that halo effects did not influence the accuracy of
mystery shopping reports that much, but that extensive further research is needed to make well-
founded statements about the reliability of the mystery shopping method. That is why this research
is again focusing on halo effects in mystery shopping research, but this time also in combination
with time delay between observation and reporting.
2.4 Time delay
Murphy and Reynolds (1988) state that halo effects are not stable but rather increase over time.
Hence, the more time there is between the observation and evaluation, the bigger the chance of
presence of halo effects is. A reason for this increase of halo in delayed conditions may be the fact
that raters give the greatest weight to pieces of information most easily retrievable from memory
(DeNisi, Cafferty & Meglino, 1984). As time delay causes memory loss, it seems logical that
people tend to recall general impressions or exceptional attributes. The more time delay there is
between observation and evaluation, the more memory loss there is on the side of the observer.
The influence of time delay between observation and evaluation has never been investigated in
the context of mystery shopping, but it might seem plausible that memory loss could also increase
the presence of halo effects in the context of mystery shopping.
Although there are hardly any studies on the effects of time delay between observation and
reporting in the context of mystery shopping, the subject has been investigated in other contexts,
for example in performance appraisal. According to Kozlowski and Ford (1991), people make
stimulus-based judgments when relevant information is immediately available to the rater at the
time of rating. The judgment is made in real time. People make memory based judgments when
the rater must recall information that has been acquired, organized and encoded into memory. It
appeared that when people make memory-based judgments, people mostly recall general
information, while specific information is largely unavailable (Ilgen & Feldman, 1983; Kozlowski
and Ford, 1991). Also other studies (Ostrognay & Langan-Fox, 1996; Murphy & Reynolds, 1988;
Nathan & Lord, 1983) showed that time delay between observation and evaluation could cause
memory loss and could therefore lead to less accurate ratings because people base their ratings
on general impressions instead of specific information. In Table 1, different studies in the context
of performance appraisal regarding the effect of time delay between observation and rating are
presented.

11
Table 1: Previous studies concerning time delay and halo effects
Researchers Context Summary relevant results Time delays
Ostrognay & Langan-Fox (1996)
Performance appraisal (observer rates the job performance of an employee)
The overall evaluation of the performance influenced the rating of specific elements of the performance when time delay was introduced.
No delay One week delay
Kozlowski & Ford (1991).
Performance appraisal (rating personnel files)
Raters in delayed conditions recalled their already formed overall evaluation and searched for attributes to confirm their prior judgment.
No delay One day Four days Seven days
Murphy & Reynolds (1988)
Performance ratings (assessment of lectures)
Halo effects are smaller when the time between the observation and the evaluation is minimized, because it decreases the possibility that mystery shoppers rely on general impressions in making attribute-specific judgments.
No delay Seven days
Nathan & Lord (1983)
Performance ratings (assessment of lectures)
In delayed conditions, raters tend to make errors in later recall of lecturing incidents consistent with subject’s general impression.
No delay Two days
Based on the existing research in Table 1, it can be concluded that in delayed conditions people
base their judgment on general impressions instead of attribute-specific elements. When the
evaluation of specific attributes is influenced by the evaluation of a dominant attribute or a general
impression, it is possible that the results are influenced by the halo effect (Nisbett & Wilson, 1977)
and are less accurate. Murphy and Reynolds (1988) state that the observed halo is not stable but
rather increases over time, so it can be expected that the more time there is between the
observation and evaluation, the bigger halo effects are. It has not been investigated yet whether
this also is the case in the context of mystery shopping. This will be investigated in the current
study.
2.4.1 Time Delay and Accuracy
As stated before, it is possible that time delay between observation and evaluation increases the
presence of halo effects in the context of mystery shopping. But it is likely that halo effects are not
the only consequence of time delay between observation and evaluation. Another possibility is that
time delay causes less accurate reports because mystery shoppers simply forget specific factual
items. Items that require no interpretation or the opinion of the mystery shopper. Examples of such
questions are “did the employee wear a name tag?” or “were the opening hours displayed on the
door?”. The current research will also investigate whether mystery shoppers are able to remember

12
factual items correctly and what the influence is of time delay on the accuracy of the reporting of
these items.
2.5 Research questions
In this study, the reliability of the mystery shopping method will be investigated. The current study
is focusing on the possible presence of halo effects in mystery shopping reports, the accuracy of
the mystery shopper and the influence of time delay between observation of the service outlet and
the reporting on the reliability of mystery shopping reports. The following research question has
been formulated:
To what extent is mystery shopping a reliable research method when it concerns the accuracy of
mystery shoppers, the presence of halo effects and the influence of time delay between
observation and reporting?
To answer this research question, five sub-questions have been defined:
1. To what extent do mystery shoppers report accurately?
2. What mystery shopper and observation characteristics influence the accuracy of mystery
shoppers?
3. To what extent do halo effects occur in mystery shopping methodology?
4. To what extent does time delay between observation and reporting influence the accuracy
of mystery shoppers?
5. To what extent does time delay between observation and reporting influences the
presence of halo effects in mystery shopping reports?

13
3. METHOD
The goal of this study was investigating the reliability of the mystery shopping method, the
presence of halo effects in mystery shopping methodology and the influence of time delay
between observation and reporting on the reliability of mystery shopping reports. To execute this
research, an experimental mystery shopping study was set up at a service desk located at the
University of Twente, a university in the east of The Netherlands. For the participants, it seemed
like a normal mystery shopping study and they thought they were evaluating the service quality of
the service desk. However, the behavior of the mystery shopper was the subject of the study and
the employees working at the service desk participated as actors.
3.1 Research design
The focus of this study was on the form of halo effects in which the evaluation of specific attributes
was influenced by a dominant attribute. To test whether halo effects are present in mystery
shopping methodology, one aspect of the underlying dimensions of service quality as defined by
Render (2014), namely Level 2 ‘employee’ was manipulated in order to become dominant. The
expertise of the service desk employee was manipulated, for in some cases the employee acted
as to have enough expertise to answer the question, while in other cases the employee acted not
having expertise. When mystery shoppers who encountered an employee without sufficient
expertise also evaluated other constructs like the physical environment and policies & proficiencies
lower, this would indicate a halo effect. Besides manipulation of the employee’s expertise, three
levels of time delay were introduced to the experiment in order to test the influence of time delay
between observation and reporting. To conclude, this study used the following 2x3 experimental
design, which was approved by the ethical committee of the University of Twente.
Table 2: The 2x3 experimental design
No time delay 1 hour time delay 1 day time delay
Employee with sufficient expertise (no dominant attribute)
Experimental group 1 Sufficient expertise and no time delay
Experimental group 2 Sufficient expertise and 1 hour time delay
Experimental group 3 Sufficient expertise and 1 day time delay
Employee without sufficient expertise (dominant attribute)
Experimental group 4 Not sufficient expertise and no time delay
Experimental group 5 Not sufficient expertise and 1 hour time delay
Experimental group 6 Not sufficient expertise and 1 day time delay
3.2 Research procedure
The research context of the study was the service desk of Student Services at the University of
Twente. Student Services is responsible for the administrative part of studying. At Student
Services, students can arrange for example issues about their admission, the collection of tuition
fee, the distribution of student cards and the enrolment and de-enrolment at the university.
14
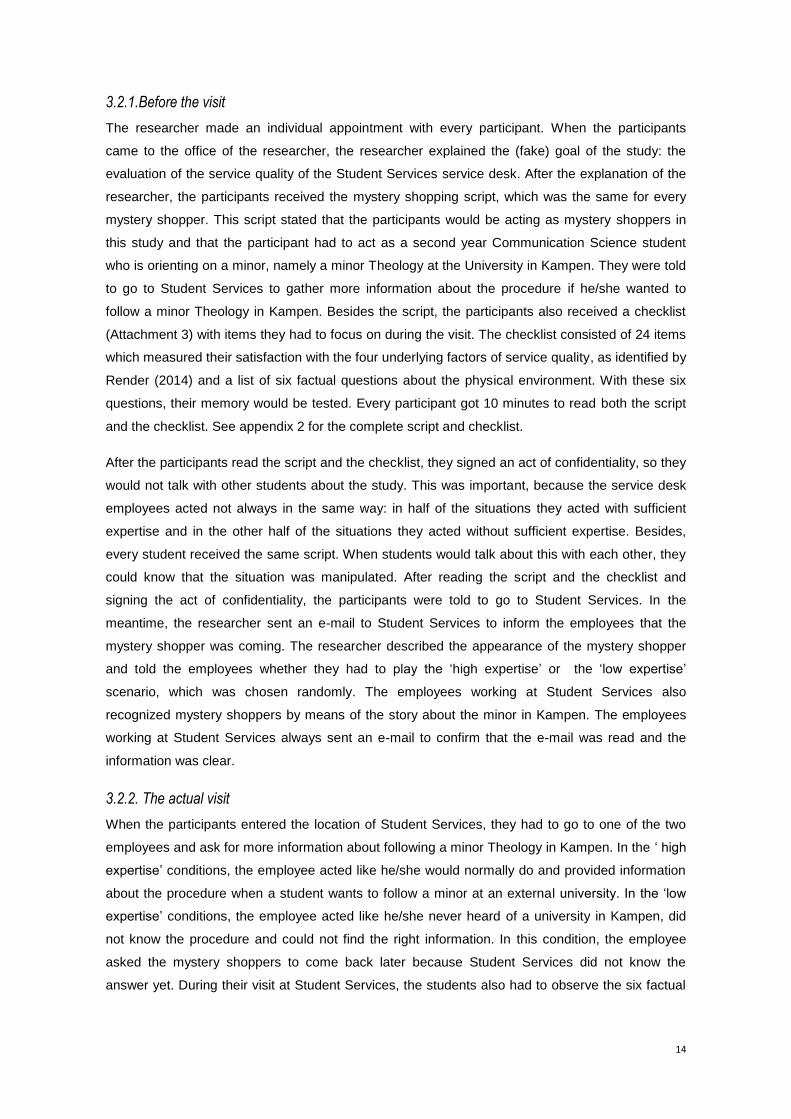
3.2.1.Before the visit
The researcher made an individual appointment with every participant. When the participants
came to the office of the researcher, the researcher explained the (fake) goal of the study: the
evaluation of the service quality of the Student Services service desk. After the explanation of the
researcher, the participants received the mystery shopping script, which was the same for every
mystery shopper. This script stated that the participants would be acting as mystery shoppers in
this study and that the participant had to act as a second year Communication Science student
who is orienting on a minor, namely a minor Theology at the University in Kampen. They were told
to go to Student Services to gather more information about the procedure if he/she wanted to
follow a minor Theology in Kampen. Besides the script, the participants also received a checklist
(Attachment 3) with items they had to focus on during the visit. The checklist consisted of 24 items
which measured their satisfaction with the four underlying factors of service quality, as identified by
Render (2014) and a list of six factual questions about the physical environment. With these six
questions, their memory would be tested. Every participant got 10 minutes to read both the script
and the checklist. See appendix 2 for the complete script and checklist.
After the participants read the script and the checklist, they signed an act of confidentiality, so they
would not talk with other students about the study. This was important, because the service desk
employees acted not always in the same way: in half of the situations they acted with sufficient
expertise and in the other half of the situations they acted without sufficient expertise. Besides,
every student received the same script. When students would talk about this with each other, they
could know that the situation was manipulated. After reading the script and the checklist and
signing the act of confidentiality, the participants were told to go to Student Services. In the
meantime, the researcher sent an e-mail to Student Services to inform the employees that the
mystery shopper was coming. The researcher described the appearance of the mystery shopper
and told the employees whether they had to play the ‘high expertise’ or the ‘low expertise’
scenario, which was chosen randomly. The employees working at Student Services also
recognized mystery shoppers by means of the story about the minor in Kampen. The employees
working at Student Services always sent an e-mail to confirm that the e-mail was read and the
information was clear.
3.2.2. The actual visit
When the participants entered the location of Student Services, they had to go to one of the two
employees and ask for more information about following a minor Theology in Kampen. In the ‘ high
expertise’ conditions, the employee acted like he/she would normally do and provided information
about the procedure when a student wants to follow a minor at an external university. In the ‘low
expertise’ conditions, the employee acted like he/she never heard of a university in Kampen, did
not know the procedure and could not find the right information. In this condition, the employee
asked the mystery shoppers to come back later because Student Services did not know the
answer yet. During their visit at Student Services, the students also had to observe the six factual
15
items about the physical environment on the checklist. When the conversation with the service
desk employee was done, the participants had to go back to the office of the researcher.
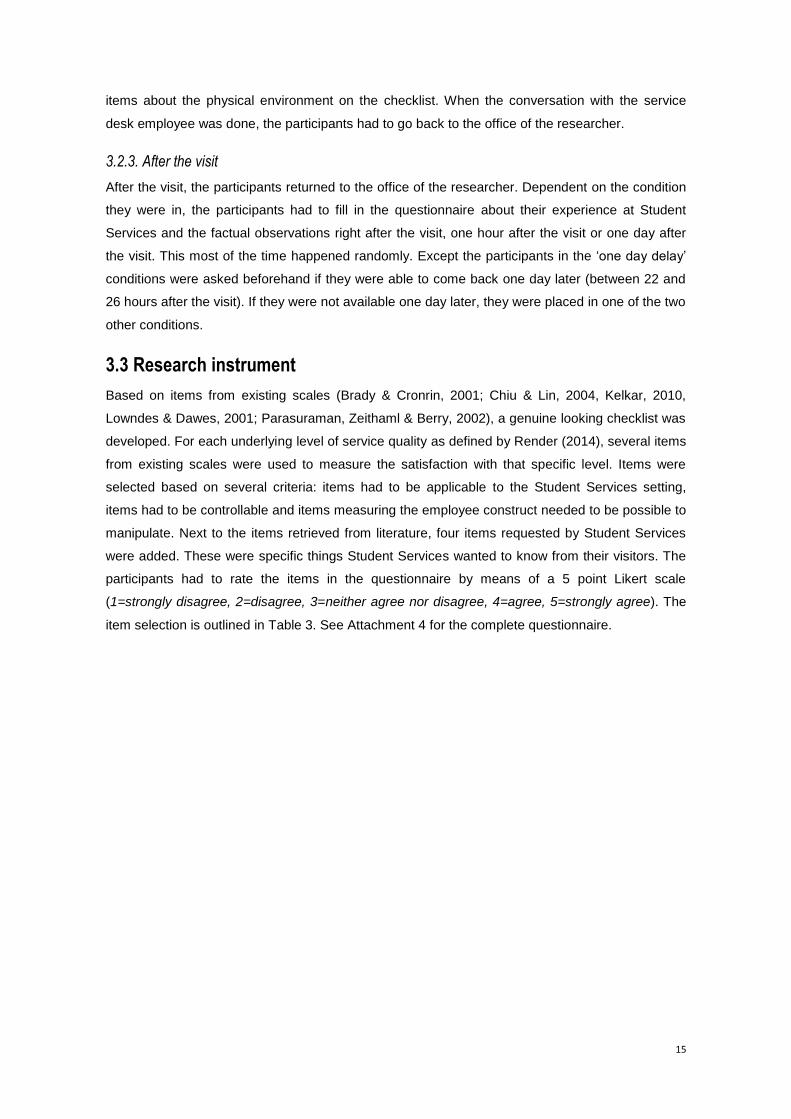
3.2.3. After the visit
After the visit, the participants returned to the office of the researcher. Dependent on the condition
they were in, the participants had to fill in the questionnaire about their experience at Student
Services and the factual observations right after the visit, one hour after the visit or one day after
the visit. This most of the time happened randomly. Except the participants in the ‘one day delay’
conditions were asked beforehand if they were able to come back one day later (between 22 and
26 hours after the visit). If they were not available one day later, they were placed in one of the two
other conditions.
3.3 Research instrument
Based on items from existing scales (Brady & Cronrin, 2001; Chiu & Lin, 2004, Kelkar, 2010,
Lowndes & Dawes, 2001; Parasuraman, Zeithaml & Berry, 2002), a genuine looking checklist was
developed. For each underlying level of service quality as defined by Render (2014), several items
from existing scales were used to measure the satisfaction with that specific level. Items were
selected based on several criteria: items had to be applicable to the Student Services setting,
items had to be controllable and items measuring the employee construct needed to be possible to
manipulate. Next to the items retrieved from literature, four items requested by Student Services
were added. These were specific things Student Services wanted to know from their visitors. The
participants had to rate the items in the questionnaire by means of a 5 point Likert scale
(1=strongly disagree, 2=disagree, 3=neither agree nor disagree, 4=agree, 5=strongly agree). The
item selection is outlined in Table 3. See Attachment 4 for the complete questionnaire.

16
Table 3: Item selection
Level of SQ References N items Cronbach’s α Example item
Physical
environment
Kelkar, 2010;
Lowndes & Dawes,
2001; Parasuraman,
Zeithaml & Berry,
2002
Literature:
(n=4)
Input Student
Services: (n=2)
.70 (one item
deleted)
‘The room of
Student Services
was neat and
clean.’
Employees Brady & Cronin, 2001;
Chiu & Lin, 2004;
Kelkar, 2010;
Lowndes & Dawes,
2001; Parasuraman,
Zeithaml & Berry,
2002
Literature:
(n=5)
Input Student
Services: (n=1)
.85 ‘The employee
working at Student
Services was polite’
Policies and
Proficiencies
Brady & Cronin, 2001;
Chiu & Lin, 2004;
Kelkar, 2010;
Parasuraman,
Zeithaml & Berry,
2002
Literature:
(n=6)
.37 ‘Student Services
keeps its records
accurately’
Overall
service
evaluation
Brady & Cronin, 2001;
Kelkar, 2010;
Parasuraman,
Zeithaml & Berry,
2002;
Literature:
(n=5)
Input Student
Services: (n=1)
.94 ‘I believe Student
Service offers
excellent service’
3.3.1. Internal consistency of the constructs in the questionnaire
The internal consistency of the different constructs/underlying levels of service quality was
measured by means of calculating the Cronbach’s Alpha for each construct. At first, the
Cronbach’s Alpha for the physical environment construct (Level 1) was α = .64. Deletion of the
item ‘Student Services is located on a convenient location’ delivered a Cronbach’s Alpha of exactly
the acceptance level of α = .70, so that item was deleted. The Cronbach’s Alpha for the policies
construct (Level 3) was α = .37. Deletion of items did not deliver an Alpha above the acceptance
level of α = .70. That is why these six items will not be used as a construct but as separate items in
the data analysis. As Table 3 shows, the employee construct (Level 2) and the overall evaluation
construct (Level 4) both delivered an alpha above the acceptance level of α = .70.
3.3.2. Measuring the accuracy of the mystery shopper
To measure whether mystery shoppers are able to report accurately, six factual questions about
the physical environment were added to the questionnaire. These six items were chosen in
cooperation with the Student Services employees, because the items had to meet a few
requirements. The items had to be observable by looking around at Student Services and had to
be factual, which means they did not require interpretation from the mystery shopper. Further,
these environmental factors had to stay the same during the whole study. The following questions
about the physical environment were formulated:

17
How many bells are placed on the desk?
Which opening times are written on the wall at the entrance?
How many crutches are placed in the area of Student Services?
What brand were the screens hanging on the wall?
What is written on the ground at the entrance?
What kind of decoration is standing in the right corner?
3.4 Pre-tests
3.4.1 Pre-test 1: Manipulation check – evaluating acting skills
To evaluate whether the employees working at Student Services were able to play the ‘high
expertise’ scenario and the ‘low expertise’ scenario in a convincing way, a pre-test was executed.
Another goal of this pre-test was to practice the research procedure and check whether the
mystery shopping briefing (Attachment 1) was clear to the participants. Four mystery shoppers
participated in this pre-test. They received the briefing and went to Student Services following the
same script as the regular mystery shoppers had to follow, later on in the main study. After the visit
they filled out the questionnaire and were interviewed by the researcher. The mystery shoppers
were asked whether the service desk employees acted in a credible way and what they could do
better. Besides, they were asked whether the procedure and checklist were clear and if they had
suggestions for improvement.
Based on these interviews, the following adjustments were made:
The service desk employee was instructed to avoid asking the mystery shoppers a lot of
questions, because that made them feel uncomfortable.
To the participant briefing was added that if the mystery shoppers did not know an answer
to a question asked by the Student Services employee, they were allowed to make up an
answer.
The question ‘did you have enough time to observe all items on the list?’ was added to
the questionnaire. It became apparent that when the mystery shoppers were helped
directly, they had less time to observe than when the mystery shoppers had to wait.
3.4.2 Pre-test 2: Manipulation check – expertise employee
The questionnaire included six items which measured the opinion of the participants concerning
the employees working at Student Services. Three out of six items concerning the employee were
related to the employee’s expertise. The other three items were related to the friendliness of the
employee, the neatness of the employee and the degree to which the employee was well
organized. A manipulation check was executed to test whether the manipulated items (the items
measuring the employee’s expertise) were actually rated lower in the ‘low expertise’ conditions
than in the ‘high expertise’ conditions. On average, participants in the “low expertise” conditions (n
= 48) rated the ‘employee expertise’ construct lower (M = 2.68, SD = 0.76) than participants in the
‘high expertise’ conditions (n = 46), (M = 4.43, SD = 0.44). This difference, was significant t(92) =

18
13.51, p < .01. It can be concluded that the manipulation of the employee’s expertise was
successful.
3.4.3 Pre-test 3: Categorization of the items
Another pre-test was executed to test whether the items actually represented one of the four levels
of service quality. Four people and the researcher conducted a categorization task and had to
categorize the different items into the right level. Each level contained six items.
Table 4: Division of categorization items
Physical
environment
Employee Policies Overall evaluation
Physical environment 30 0 0 0
Employee 0 29 1 0
Policies 0 1 29 0
Overall evaluation 0 0 0 30
κ= .98
As Table 4 shows, one rater confused an employee item with a policies item, but the overall
Cohen’s Kappa between all raters was κ = .98, which is considered as a high degree of inter-rater
reliability.
3.5 Participants
In total, 94 mystery shoppers participated in this study. All participants were students recruited at
the University of Twente. Students who participated in the study received 1.5 study credit
(psychology and communication science students at this university need to earn 15 credits during
their bachelor by means of participating in scientific studies) or a cinema coupon worth €10,-.
In total, 49 men and 45 women participated in this study (average age = 21.52 years). Most of the
participants were communication science students (n = 46). Also psychology students (n = 20) and
students who were following another study (n = 28) at the University of Twente participated in the
study. Most of the participants (n = 76) had no previous mystery shopping experience. 36 mystery
shoppers had never been at the Student Services desk before. 31 mystery shoppers had been at
Student Services 1-2 times, 19 mystery shoppers had been at Student Services 3-4 times and 8
mystery shoppers had been at Student Services more than 5 times in the past. Table 5 shows a
complete overview of the participants.
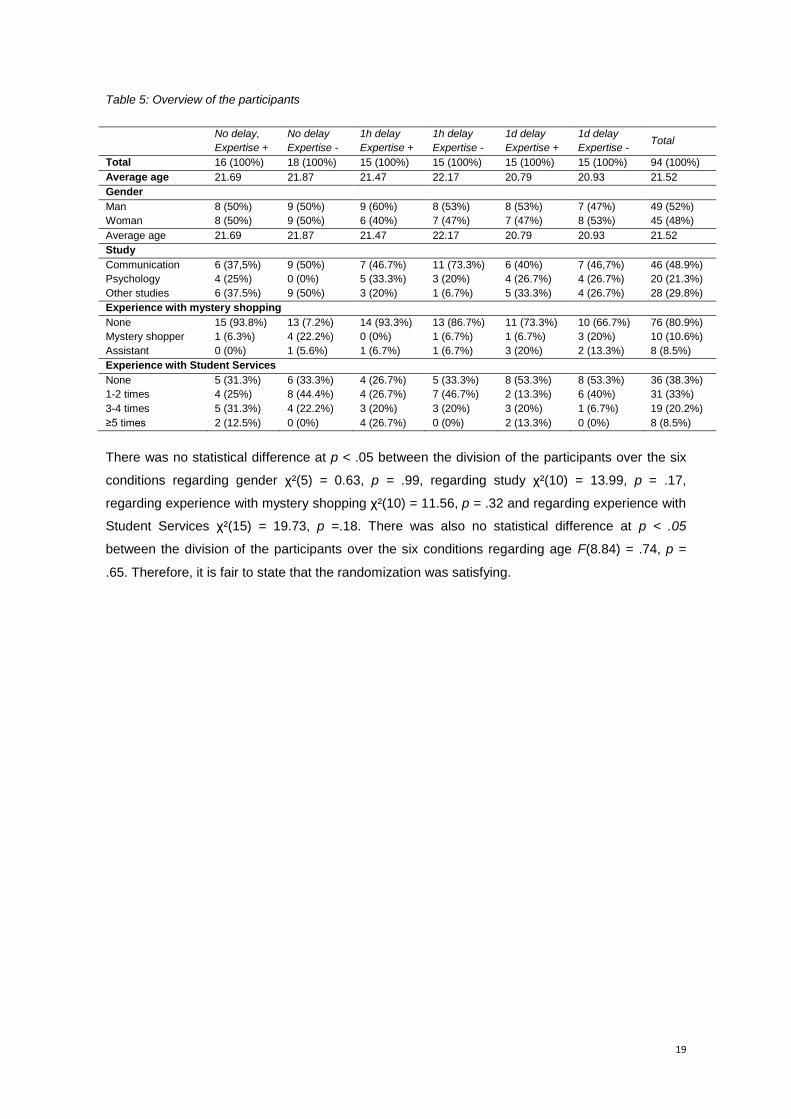
19
Table 5: Overview of the participants
No delay,
Expertise +
No delay
Expertise -
1h delay
Expertise +
1h delay
Expertise -
1d delay
Expertise +
1d delay
Expertise - Total
Total 16 (100%) 18 (100%) 15 (100%) 15 (100%) 15 (100%) 15 (100%) 94 (100%)
Average age 21.69 21.87 21.47 22.17 20.79 20.93 21.52
Gender
Man 8 (50%) 9 (50%) 9 (60%) 8 (53%) 8 (53%) 7 (47%) 49 (52%)
Woman 8 (50%) 9 (50%) 6 (40%) 7 (47%) 7 (47%) 8 (53%) 45 (48%)
Average age 21.69 21.87 21.47 22.17 20.79 20.93 21.52
Study
Communication 6 (37,5%) 9 (50%) 7 (46.7%) 11 (73.3%) 6 (40%) 7 (46,7%) 46 (48.9%)
Psychology 4 (25%) 0 (0%) 5 (33.3%) 3 (20%) 4 (26.7%) 4 (26.7%) 20 (21.3%)
Other studies 6 (37.5%) 9 (50%) 3 (20%) 1 (6.7%) 5 (33.3%) 4 (26.7%) 28 (29.8%)
Experience with mystery shopping
None 15 (93.8%) 13 (7.2%) 14 (93.3%) 13 (86.7%) 11 (73.3%) 10 (66.7%) 76 (80.9%)
Mystery shopper 1 (6.3%) 4 (22.2%) 0 (0%) 1 (6.7%) 1 (6.7%) 3 (20%) 10 (10.6%)
Assistant 0 (0%) 1 (5.6%) 1 (6.7%) 1 (6.7%) 3 (20%) 2 (13.3%) 8 (8.5%)
Experience with Student Services
None 5 (31.3%) 6 (33.3%) 4 (26.7%) 5 (33.3%) 8 (53.3%) 8 (53.3%) 36 (38.3%)
1-2 times 4 (25%) 8 (44.4%) 4 (26.7%) 7 (46.7%) 2 (13.3%) 6 (40%) 31 (33%)
3-4 times 5 (31.3%) 4 (22.2%) 3 (20%) 3 (20%) 3 (20%) 1 (6.7%) 19 (20.2%)
≥5 times 2 (12.5%) 0 (0%) 4 (26.7%) 0 (0%) 2 (13.3%) 0 (0%) 8 (8.5%)
There was no statistical difference at p < .05 between the division of the participants over the six
conditions regarding gender χ²(5) = 0.63, p = .99, regarding study χ²(10) = 13.99, p = .17,
regarding experience with mystery shopping χ²(10) = 11.56, p = .32 and regarding experience with
Student Services χ²(15) = 19.73, p =.18. There was also no statistical difference at p < .05
between the division of the participants over the six conditions regarding age F(8.84) = .74, p =
.65. Therefore, it is fair to state that the randomization was satisfying.

20
4. RESULTS
This chapter will contain the statistical results of the mystery shopping study. For each sub
question, the results will be discussed separately.
4.1. Accuracy of mystery shoppers
In order to measure the accuracy of mystery shoppers, a total of six questions (representing six
correct observations of the environment) were added to the questionnaire. In the data analysis, the
average percentage of correct reported answers was calculated for each mystery shopper, which
resulted in a score between 0 (all observations were reported incorrectly) and 1 (all observations
were reported correctly). On average, participants (n = 94) reported 3.71 out of 6 observations
correctly (M = .62, SD = .24).
4.2 Characteristics influencing accuracy
In the data analysis, it appeared that there were mystery shopper and observation characteristics
which influenced the accuracy of the mystery shopper. These characteristics will be outlined in this
paragraph.
4.2.1. Influence of having enough time to observe
Some participants reported not having enough time to observe all six items on the checklist
because there was nobody else at Student Services and they were helped by the employees
directly. On average, participants who reported having enough time to observe (n = 58), reported
more correct observations (M = .71, SD = 0.2) than participants who reported having not have
enough time to observe (n = 36), (M = .48, SD = 0.23). This difference was significant t(92) = 5.08,
p = < .001, with participants who had enough time to observe reporting more correct answers than
participants who did not have enough time to observe.
It can be concluded that having more time to observe influences the amount of correct
observations positively.
4.2.2. Influence of having mystery shopping experience
Several participants with previous mystery shopping experience participated as a mystery shopper
in the current study. On average, participants who reported having previous mystery shopping
experience (either as a mystery shopper or research assistant) (n = 18), reported more correct
answers (M = .75, SD = .27), than those who reported not having any previous mystery shopping
experience (n = 76), (M = .59, SD = .22). This difference was significant t(92) = -2.66, p = <.01,
with participants who had previous mystery shopping experience reporting more correct answers
than participants without having previous mystery shopping experience.
It can be concluded that having mystery shopping experience influences the amount of correct
observations positively.

21
4.2.3. Influence of having visited Student Services before
In the questionnaire was asked whether the participants had visited Student Services before. They
could choose between never, 1-2 times, 3-4 times or more than 5 times. At first, all participants
who visited Student Services before were taken together into one group and an Independent
Sample T-test was executed. Participants who had been at Student Services before (n = 58)
reported on average 3.96 out of 6 correct answers (M = .66, SD = .22) while participants who had
never been at Student Services before (n = 36) reported on average 3.36 out of 6 correct answers
(M = .56, SD = .24). However, this difference was not significant t(92) = -1.89, p = .06.
A one way ANOVA test was executed to test whether the amount of times the mystery shopper
visited Student Services before was influencing the amount of correct reported answers. It
appeared that there was no significant effect of the amount of times participants visited Student
Services before, F(3,90) = 1.52, p = .21.
4.3 Amount of necessary visits to obtain accurate reports
Since mystery shoppers report, even when they do not work under time pressure, a considerable
amount of observations incorrectly, it was calculated how many mystery shopping visits are
necessary to be for 90% sure that an observation made by mystery shoppers is correct. Because
this was an experimental study, the researcher knew beforehand which factual observations
reported by the mystery shoppers were correct and which observations reported by the mystery
shoppers were incorrect. In real life, this is not the case. In a real mystery shopping study, the
researcher does not know the answers to those kind of factual questions, that is of course the
reason why mystery shoppers are sent out to the service outlet. In the current study, it appeared
that mystery shoppers report 71% of the observations correctly, as long as they have enough time
to observe. By means of calculation of probability, it was calculated how many mystery shopping
visits are necessary to be for more than 90% sure that a correct observation is reported. To
calculate this, it is assumed that when the majority of the mystery shoppers report a specific
observation, this will be considered as a correct observation by the researcher.
Table 6: Calculation of how many mystery shopping visits are necessary to be for more than 90% sure that a
correct observation is reported
Correct observation (Chance=0.71)
Incorrect observation (Chance=0.29)
Possible combinations
Chance of 1 combination
Total chance (possible combinations * chance of 1 combination)
9 0 1 0.045848501 0.045848501 8 1 9 0.018726852 0.168541672 7 2 36 0.007648996 0.275363858 6 3 84 0.003124238 0.262435977 5 4 126 0.001276097 0.16078824
4 5 126 0.000521223 0.06567407 3 6 84 0.000212894 0.01788308 2 7 36 8.69566E-05 0.003130439 1 8 9 3.55175E-05 0.000319657 0 9 1 1.45071E-05 1.45071E-05
22
To calculate the chance of 1 specific combination, the chance of a correct observation needs to
be calculated to the power of the amount of correct observations and the chance of an incorrect
observation needs to be calculated to the power of the amount of incorrect observations. Those
numbers need to be multiplied with each other in order to calculate the chance of 1 specific
combination.
The total chance of a combination is calculated by multiplying the chance of 1 specific combination
with the total amount of possible combinations. To give an example, the chance of 5 correct
observations and 4 incorrect observations can by calculated by:
((0.71^5)*(0.29^4))*126=0.16
It is assumed that when the majority of the mystery shoppers report a specific observation, this will
be reported by the researcher as a correct observation. This is the case with the combinations
above the line in the table. The total chances of those combinations are added up which leads to a
total chance of 91.3% of having one of the 5 combinations where more correct observations than
incorrect observations are reported. This is the case when having 9 mystery shopping reports.
When having less mystery shopping reports, the chance increases than as incorrect observation is
reported in the end as a correct observation by the researcher.
4.4. Halo effects in mystery shopping reports
To test whether halo effects occur in mystery shopping methodology, the ratings of the participants
in the ‘high expertise’ and ‘low expertise’ scenario were compared for each level of service quality
(the different constructs). When the participants in the ‘low expertise’ scenario rated the specific
(non-manipulated) construct significantly lower than participants in the ‘high expertise’ scenario, it
can be concluded that there is a halo effect of the employee’s expertise on that specific construct.
4.4.1 Halo effects within the employee construct
To investigate whether there is a halo effect within Level 2 (the employee construct), the means of
the non-manipulated items within the employee construct were compared. On average,
participants in the ‘high expertise’ conditions (n = 46), rated the non manipulated employee
characteristics higher (M = 4.43, SD = .48) than the participants in the ‘low expertise’ conditions (n
= 48), (M = 3.66, SD = .66). This difference was significant t(92) = 6.59, p = <.01.
It can be concluded that there is a halo effect within the employee construct. Participants who
encountered an employee without sufficient expertise rated also other aspects of the employee,
namely the friendliness, the neatness and the degree to which the employee was organized lower
than the participants who encountered an employee with sufficient expertise to help them with their
question.

23
4.4.2. Halo effects between the employee’s expertise and physical environment construct
To investigate whether there is a halo effect between the employee’s expertise and Level 1
(physical environment construct), it was investigated whether participants who encountered an
employee without sufficient expertise rated the physical environment construct lower than
participants who encountered an employee with sufficient expertise. On average, participants in
the ‘high expertise’ conditions (n = 46), gave the physical environment 3.88 out of 5 points (M =
3.88, SD = 0.47) and participants in the ‘low expertise’ conditions (n = 48) gave the physical
environment 3.78 out of 5 points (M = 3.78, SD = 0.57). This difference was not significant t(92) =
0.96, p = .34.
It can be concluded that there are no halo effects of the employee’s expertise on the physical
environment construct (Level 1).
4.4.3. Halo effects of the employee’s expertise on the policy items
Because the internal consistency of Level 3, the ‘policies and proficiencies’ construct (α = .37) was
below the acceptance level of α = .7, the items measuring the satisfaction concerning the policies
and proficiencies were treated as separate items instead of a construct during the analysis.
A significant effect of the employee’s expertise on the rating of the policies and proficiencies was
found at two items. The first item was ‘Student Services is receptive to remarks of customers’. On
average, participants in the ‘high expertise’ conditions (n = 46), rated this item higher (M = 3.7, SD
= 0.66) than participants in the ‘low expertise’ conditions (n = 48), (M = 3.4, SD = 0.79). This
difference was significant t(92) = 1.99, p < .05.
The second item was “Student Services keeps its records accurately”. On average, participants in
the ‘high expertise’ conditions (n = 46) rated this item higher (M = 3.5, SD = 0.59) than participants
in the ‘low expertise’ conditions (n = 48), (M = 3.04, SD = 0.99). This difference was significant
t(92) = 2.72, p < .01.
No significant effects were found of the employee’s expertise on the other items measuring the
underlying level of service quality ‘policies and proficiencies’ (Student Services strives for short
waiting times, Student Services has good working conditions, Student Services thinks about the
environment, Student Services thinks about the privacy of its customers).
4.4.4. Halo effects of the employee’s expertise on the overall evaluation
To investigate whether the employee’s expertise influences the overall evaluation construct (Level
4), it was analyzed whether participants who encountered an employee without sufficient expertise
rated the overall evaluation construct lower than participants who encountered an employee with
sufficient expertise.
Because Levene’s Test for Equality of Variances was statistically significant (p = .00), it can be
assumed that group variances are unequal in the population. To correct this violation, the data in

24
the row equal variances not assumed provided by SPSS was used. This means that the
calculations uses un-pooled variances and a correction to the degrees of freedom.
On average, participants in the ‘high expertise’ conditions (n = 46) rated the overall evaluation
construct higher (M = 4.08, SD = 0.43) than participants in the ‘low expertise’ conditions (n = 48),
(M = 3.05, SD = 0.83). This difference was significant t(71.62) = 7.65, p <.001.
It can be concluded that in the overall evaluation is rated lower in the ‘low expertise’ conditions
than in the ‘high expertise’ conditions.
4.4.5 Summary of the results
Significant halo effects were found of the employee’s expertise on the other items measuring the
satisfaction with the employee, of the employee’s expertise on the two policy & proficiencies items
‘Student Services is receptive to remarks of customers’ and ‘Student Services keeps its records
accurately’ and of the employee’s expertise on the overall evaluation of Student Services.
4.5 Influence of time delay on accuracy of mystery shopping reports
In order to test the accuracy of the mystery shoppers, all mystery shoppers had to observe six
factual items in the service environment, which they had to report in the questionnaire afterwards.
To answer this sub question, the average percentage of correctly reported answers for each
participant was used as dependent variable.
4.5.1 All participants
In Table 7, the average percentage of correct answers of all participants in the ‘no time delay’, the
‘1 hour time delay’ and the ’1 day time delay’ conditions are presented.
Table 7: Average percentages of correct answers over the three time delay conditions
No time delay n participants 34 Average % of correct answers 66%
1 hour time delay n participants 30 Average % of correct answers 58%
1 day time delay n participants 30 Average % of correct answers 61%
A One-Way ANOVA test was executed to investigate whether the amount of time between
observation of the environmental factors and reporting of the results was of significant influence on
the percentage of correctly reported answers. It appeared that there was no significant influence of
time between observation and reporting on the percentage of correctly reported answers, F(2,91)
= 0.996, p = .37.
4.5.2 Influence of having enough time to observe
In the first sub question it became apparent that whether the participants did have enough time to
observe the factual environmental factors (according to their own perspective) was of significant
positive influence on the percentage of correctly reported answers. That is why the average
25
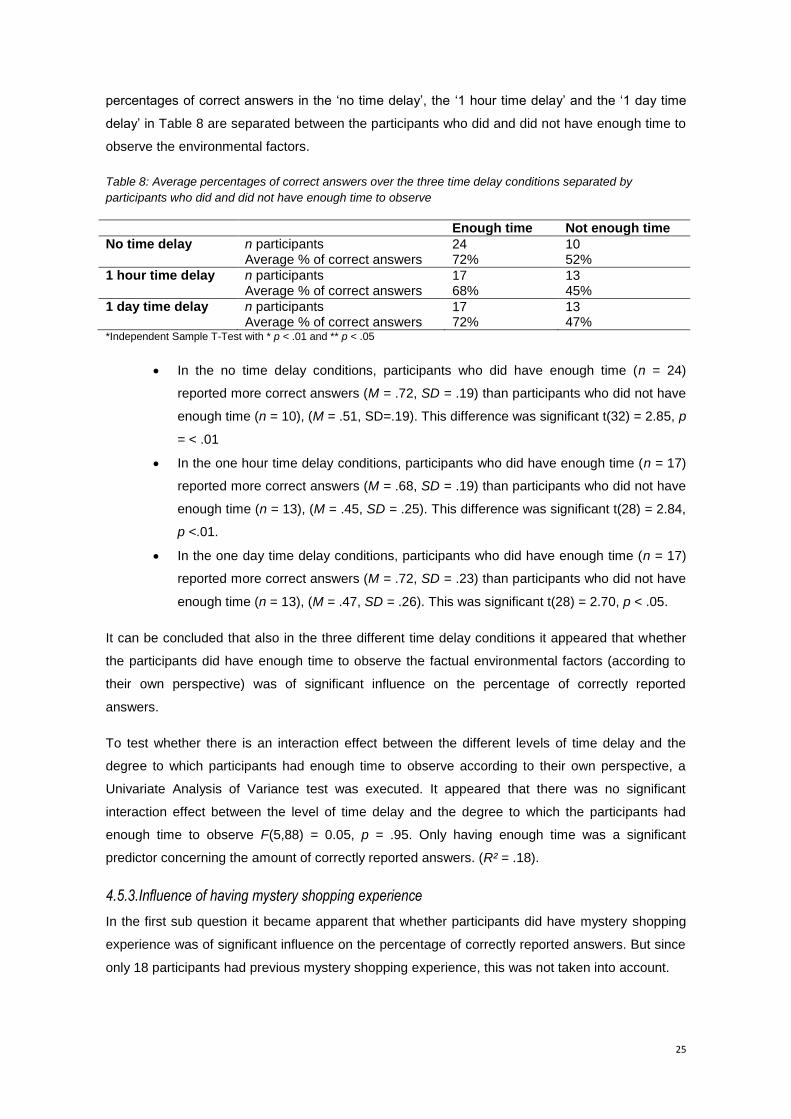
percentages of correct answers in the ‘no time delay’, the ‘1 hour time delay’ and the ‘1 day time
delay’ in Table 8 are separated between the participants who did and did not have enough time to
observe the environmental factors.
Table 8: Average percentages of correct answers over the three time delay conditions separated by
participants who did and did not have enough time to observe
Enough time Not enough time
No time delay n participants 24 10 Average % of correct answers 72% 52%
1 hour time delay n participants 17 13 Average % of correct answers 68% 45%
1 day time delay n participants 17 13 Average % of correct answers 72% 47% *Independent Sample T-Test with * p < .01 and ** p < .05
In the no time delay conditions, participants who did have enough time (n = 24)
reported more correct answers (M = .72, SD = .19) than participants who did not have
enough time (n = 10), (M = .51, SD=.19). This difference was significant t(32) = 2.85, p
= < .01
In the one hour time delay conditions, participants who did have enough time (n = 17)
reported more correct answers (M = .68, SD = .19) than participants who did not have
enough time (n = 13), (M = .45, SD = .25). This difference was significant t(28) = 2.84,
p <.01.
In the one day time delay conditions, participants who did have enough time (n = 17)
reported more correct answers (M = .72, SD = .23) than participants who did not have
enough time (n = 13), (M = .47, SD = .26). This was significant t(28) = 2.70, p < .05.
It can be concluded that also in the three different time delay conditions it appeared that whether
the participants did have enough time to observe the factual environmental factors (according to
their own perspective) was of significant influence on the percentage of correctly reported
answers.
To test whether there is an interaction effect between the different levels of time delay and the
degree to which participants had enough time to observe according to their own perspective, a
Univariate Analysis of Variance test was executed. It appeared that there was no significant
interaction effect between the level of time delay and the degree to which the participants had
enough time to observe F(5,88) = 0.05, p = .95. Only having enough time was a significant
predictor concerning the amount of correctly reported answers. (R² = .18).
4.5.3.Influence of having mystery shopping experience
In the first sub question it became apparent that whether participants did have mystery shopping
experience was of significant influence on the percentage of correctly reported answers. But since
only 18 participants had previous mystery shopping experience, this was not taken into account.

26
4.5.4. Summary of the results
It appeared that time delays until 24 hours between observation and reporting did not influence the
amount of correctly reported answers.
4.6 Influence of time delay on the presence of halo effects
To investigate whether time delay between observation and reporting influences the presence of
halo effects in mystery shopping reports, the presence of halo effects between the three levels of
time delay will be compared for each construct.
4.6.1 Halo effects within the employee construct
To investigate whether there is a halo effect within the employee construct, the means of the non-
manipulated items within the employee construct are again compared between the high and the
low expertise scenario, but now separately over the three time delay conditions. Table 9 shows the
means of the non-manipulated employee items, separated between the three time delay
conditions and the two expertise conditions.
Table 9: Halo effects between the three time delay conditions within the employee construct
Halo effects within the employee construct
n M SD M-dif t p
No time delay** High expertise scenario 16 4.33 0.42 0.76 4.86 0.000
Low expertise scenario 18 3.47 0.48
1 hour time delay* High expertise scenario 15 4.56 0.33 0.73 3.78 0.001
Low expertise scenario 15 3.83 0.68
1 day time delay * High expertise scenario 15 4.42 0.64 0.84 3.17 0.004
Low expertise scenario 15 3.58 0.81 *Independent Sample T-Test with * p < .01 and ** p < .001.
As Table 9 shows, significant halo effects of the employee’s expertise on the other items
measuring the satisfaction with the employee were found in all three time delay conditions. Since
halo effects were found in all three time delay conditions, it can be concluded that time delay does
not influence the presence of halo effects within the employee construct.
4.6.2. Halo effects between the employee’s expertise and physical environment construct
To investigate whether there is a halo effect between the employee’s expertise and the physical
environment construct, it was again investigated whether participants who encountered an
employee without sufficient expertise rated the physical environment construct lower than
participants who encountered an employee with sufficient expertise, but now separately over the
three time delay conditions.
27
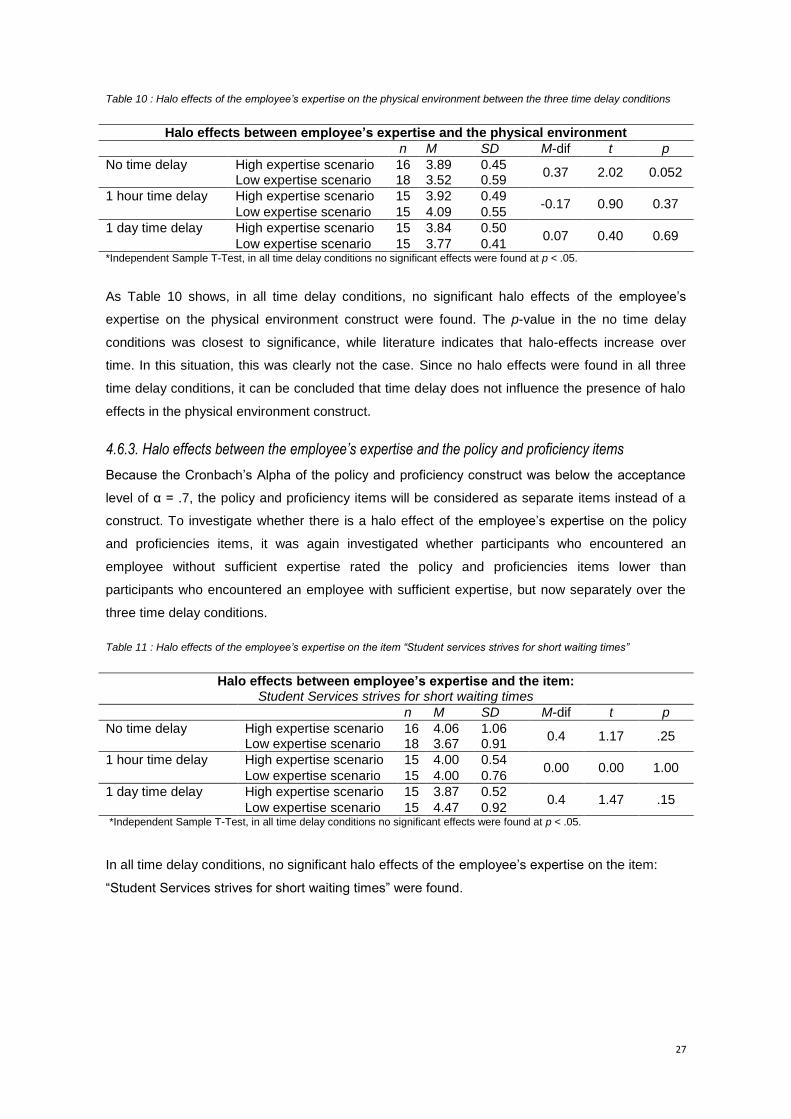
Table 10 : Halo effects of the employee’s expertise on the physical environment between the three time delay conditions
Halo effects between employee’s expertise and the physical environment
n M SD M-dif t p
No time delay High expertise scenario 16 3.89 0.45 0.37 2.02 0.052
Low expertise scenario 18 3.52 0.59
1 hour time delay High expertise scenario 15 3.92 0.49 -0.17 0.90 0.37
Low expertise scenario 15 4.09 0.55
1 day time delay High expertise scenario 15 3.84 0.50 0.07 0.40 0.69
Low expertise scenario 15 3.77 0.41 *Independent Sample T-Test, in all time delay conditions no significant effects were found at p < .05.
As Table 10 shows, in all time delay conditions, no significant halo effects of the employee’s
expertise on the physical environment construct were found. The p-value in the no time delay
conditions was closest to significance, while literature indicates that halo-effects increase over
time. In this situation, this was clearly not the case. Since no halo effects were found in all three
time delay conditions, it can be concluded that time delay does not influence the presence of halo
effects in the physical environment construct.
4.6.3. Halo effects between the employee’s expertise and the policy and proficiency items
Because the Cronbach’s Alpha of the policy and proficiency construct was below the acceptance
level of α = .7, the policy and proficiency items will be considered as separate items instead of a
construct. To investigate whether there is a halo effect of the employee’s expertise on the policy
and proficiencies items, it was again investigated whether participants who encountered an
employee without sufficient expertise rated the policy and proficiencies items lower than
participants who encountered an employee with sufficient expertise, but now separately over the
three time delay conditions.
Table 11 : Halo effects of the employee’s expertise on the item “Student services strives for short waiting times”
Halo effects between employee’s expertise and the item: Student Services strives for short waiting times
n M SD M-dif t p
No time delay High expertise scenario 16 4.06 1.06 0.4 1.17 .25
Low expertise scenario 18 3.67 0.91
1 hour time delay High expertise scenario 15 4.00 0.54 0.00 0.00 1.00
Low expertise scenario 15 4.00 0.76
1 day time delay High expertise scenario 15 3.87 0.52 0.4 1.47 .15
Low expertise scenario 15 4.47 0.92 *Independent Sample T-Test, in all time delay conditions no significant effects were found at p < .05.
In all time delay conditions, no significant halo effects of the employee’s expertise on the item:
“Student Services strives for short waiting times” were found.

28
Table 12 : Halo effects of the employee’s expertise on the item:”Student Services has good working conditions”
Halo effects between employee’s expertise and the item: Student Services has good working conditions
n M SD M-dif t p
No time delay High expertise scenario 16 3.75 0.78 -0.3 -0.13 .90
Low expertise scenario 18 3.78 0.43
1 hour time delay High expertise scenario 15 3.93 0.36 -0.67 -0.37 .72
Low expertise scenario 15 4.00 0.66
1 day time delay High expertise scenario 15 3.73 0.59 -0.07 0.34 .74
Low expertise scenario 15 3.67 0.49 *Independent Sample T-Test, in all time delay conditions no significant effects were found at p < .05.
In all time delay conditions, no significant halo effects of the employee’s expertise on the item:
“Student Services has good working conditions” were found.
Table 13 : Halo effects of the employee’s expertise on the item: “Student Services is receptive to remarks of customers”
Halo effects between employee’s expertise and the item: Student Services is receptive to remarks of customers
n M SD M-dif t p
No time delay High expertise scenario 16 3.63 0.62 0.18 0.70 .49
Low expertise scenario 18 3.44 0.86
1 hour time delay High expertise scenario 15 3.80 0.68 0.47 1.52 .14
Low expertise scenario 15 3.33 0.98
1 day time delay High expertise scenario 15 3.67 0.72 0.27 1.17 .25
Low expertise scenario 15 3.4 0.51 *Independent Sample T-Test, in all time delay conditions no significant effects were found at p < .05.
In all time delay conditions, no significant halo effects of the employee’s expertise on the item:
“Student Services is receptive to remarks of customers” were found.
Table 14 : Halo effects of the employee’s expertise on the item: Student Services thinks about the environment
Halo effects between employee’s expertise and the item: Student Services thinks about the environment
n M SD M-dif t p
No time delay High expertise scenario 16 3.19 0.40 0.08 0.44 -.66
Low expertise scenario 18 3.11 0.58
1 hour time delay High expertise scenario 15 2.93 0.46 -0.33 -1.72 .10
Low expertise scenario 15 3.27 0.59
1 day time delay High expertise scenario 15 3.00 0.38 0.07 0.56 .58
Low expertise scenario 15 2.93 0.26 *Independent Sample T-Test, in all time delay conditions no significant effects were found at p < .05.
In all time delay conditions, no significant halo effects of the employee’s expertise on the item:
“Student Services thinks about the environment” were found.

29
Table 15 : Halo effects of the employee’s expertise on the item: Student Services thinks about the privacy of its customers
Halo effects between employee’s expertise and the item: Student Services thinks about the privacy of its customers
n M SD M-dif t p
No time delay High expertise scenario 16 3.44 1.15 -0.01 -0.02 .99
Low expertise scenario 18 3.44 0.92
1 hour time delay High expertise scenario 15 3.53 0.99 0.40 1.11 .28
Low expertise scenario 15 3.13 0.99
1 day time delay High expertise scenario 15 3.47 0.99 0.40 1.08 .29
Low expertise scenario 15 3.07 1.04 *Independent Sample T-Test, in all time delay conditions no significant effects were found at p < .05.
In all time delay conditions, no significant halo effects of the employee’s expertise on the item:
“Student Services thinks about the privacy of its customers” were found.
Table 16 : Halo effects of the employee’s expertise on the item: Student Services keeps its records accurately
Halo effects between employee’s expertise and the item: Student Services keeps its records accurately
n M SD M-dif t p
No time delay High expertise scenario 16 3.31 0.48 0.54 1.94 .06
Low expertise scenario 18 2.78 1.00
1 hour time delay High expertise scenario 15 3.53 0.64 0.33 1.03 .31
Low expertise scenario 15 3.20 1.08
1 day time delay High expertise scenario 15 3.67 0.62 0.47 1.71 .10
Low expertise scenario 15 3.20 0.86 *Independent Sample T-Test, in all time delay conditions no significant effects were found at p < .05.
In all time delay conditions, no significant halo effects of the employee’s expertise and the item:
“Student Services keeps its records accurately” were found.
When evaluating all items separately over the time delay conditions, no halo effects at all were
found on any policy & proficiency items. When not taking time delay into account, significant halo
effects were found on the two policy items “Student Services is receptive to remarks of customers”
and “Student Services keeps its records accurately”. The reason no halo effects occur in this case
is because of the smaller sample sizes. It can be concluded that time delay does not influence the
presence of halo effects in all policy & proficiencies items, since there were no differences
between the three time delay conditions.
4.6.4. Halo effects of the employee’s expertise on the overall evaluation
To investigate whether there is a halo effect of the employee’s expertise on the overall evaluation
construct, it was investigated whether participants who encountered an employee without sufficient
expertise rated the overall evaluation construct lower than participants who encountered an
employee with sufficient expertise, but again separately over the three time delay conditions.

30
Table 17 : Halo effects of the employee’s expertise on the overall evaluation between the three time delay conditions
Halo effects between employee’s expertise and the overall evaluation
n M SD M-dif t p
No time delay** High expertise scenario 16 4.18 0.41 1.46 6.60 .00
Low expertise scenario 18 2.71 0.84
1 hour time delay** High expertise scenario 15 4.07 0.27 0.93 4.51 .00
Low expertise scenario 15 3.13 0.75
1 day time delay* High expertise scenario 15 4.00 0.58 0.64 2.53 .02
Low expertise scenario 15 3.36 0.80 *Independent Sample T-Test with * p < .05 and ** p < .001.
In the no time delay and the 1 hour time delay conditions, Levene’s test for Equality of Variances
was significant. To correct this violation, the data in the row equal variances not assumed provided
by SPSS was used. This means that the calculations uses un-pooled variances and a correction to
the degrees of freedom.
As Table 16 shows, in all time delay conditions, halo effects of the employee’s expertise on the
overall evaluation of Student Services were found. Since halo effects were found in all three time
delay conditions, it can be concluded that time delay does not influence the presence of halo
effects in the overall evaluation construct.
4.6.5. Summary of the results
It appeared that time delay between observation and reporting did not influence the presence of
halo effects in mystery shopping reports. In none of the constructs or items, a difference in
presence of halo effects between the three different levels of time delay was found.
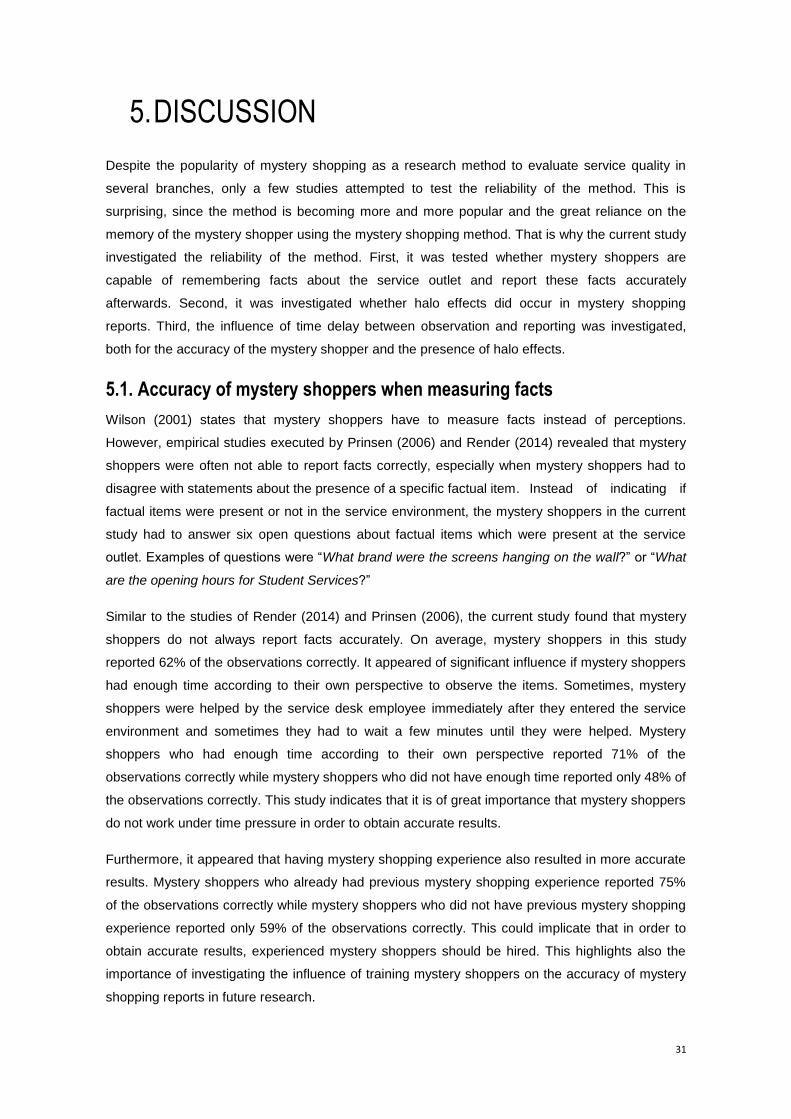
31
5. DISCUSSION
Despite the popularity of mystery shopping as a research method to evaluate service quality in
several branches, only a few studies attempted to test the reliability of the method. This is
surprising, since the method is becoming more and more popular and the great reliance on the
memory of the mystery shopper using the mystery shopping method. That is why the current study
investigated the reliability of the method. First, it was tested whether mystery shoppers are
capable of remembering facts about the service outlet and report these facts accurately
afterwards. Second, it was investigated whether halo effects did occur in mystery shopping
reports. Third, the influence of time delay between observation and reporting was investigated,
both for the accuracy of the mystery shopper and the presence of halo effects.
5.1. Accuracy of mystery shoppers when measuring facts
Wilson (2001) states that mystery shoppers have to measure facts instead of perceptions.
However, empirical studies executed by Prinsen (2006) and Render (2014) revealed that mystery
shoppers were often not able to report facts correctly, especially when mystery shoppers had to
disagree with statements about the presence of a specific factual item. Instead of indicating if
factual items were present or not in the service environment, the mystery shoppers in the current
study had to answer six open questions about factual items which were present at the service
outlet. Examples of questions were “What brand were the screens hanging on the wall?” or “What
are the opening hours for Student Services?”
Similar to the studies of Render (2014) and Prinsen (2006), the current study found that mystery
shoppers do not always report facts accurately. On average, mystery shoppers in this study
reported 62% of the observations correctly. It appeared of significant influence if mystery shoppers
had enough time according to their own perspective to observe the items. Sometimes, mystery
shoppers were helped by the service desk employee immediately after they entered the service
environment and sometimes they had to wait a few minutes until they were helped. Mystery
shoppers who had enough time according to their own perspective reported 71% of the
observations correctly while mystery shoppers who did not have enough time reported only 48% of
the observations correctly. This study indicates that it is of great importance that mystery shoppers
do not work under time pressure in order to obtain accurate results.
Furthermore, it appeared that having mystery shopping experience also resulted in more accurate
results. Mystery shoppers who already had previous mystery shopping experience reported 75%
of the observations correctly while mystery shoppers who did not have previous mystery shopping
experience reported only 59% of the observations correctly. This could implicate that in order to
obtain accurate results, experienced mystery shoppers should be hired. This highlights also the
importance of investigating the influence of training mystery shoppers on the accuracy of mystery
shopping reports in future research.

32
Because this study found that mystery shoppers report a considerable percentage of answers
incorrect, it is important to not draw conclusions out of reports of one or two mystery shoppers.
Finn and Kayandé (1999) state that it takes at least forty mystery shopping visits per outlet to
obtain generalizable results, while the average amount of mystery shopping visits is 3.5. In the
current study it was calculated that (as long as mystery shoppers have enough time to observe), it
takes at least 9 visits to be for more than 90% sure that a specific observation made by mystery
shoppers is correct.
5.2. Halo effects in mystery shopping reports Another possible reliability threat of the mystery shopping method that was investigated during this
study is the possible presence of halo effects in mystery shopping reports. Research in other
contexts, like for example customer satisfaction research, proved that people are not always able
to resist the influence of global evaluation or dominant attributes on the evaluation of specific items
(Nisbett & Wilson, 1977). This is called the halo effect, and when this happens it becomes
impossible for managers to know which elements of the service provision need to be improved.
This is important for managers to know, because dissatisfaction with one element of service
quality can lead to overall customer dissatisfaction (Wirtz & Bateson, 1995). However, the possible
presence of halo effects in mystery shopping methodology has hardly been investigated.
In the current study, the employee’s expertise (Level 2) was manipulated to test whether this
influenced the evaluation of the other aspects of service quality (physical environment, policies &
proficiencies, overall service evaluation and other employee aspects). It appeared that there was a
significant halo effect of the employee’s expertise on other items measuring the satisfaction with
the employee (friendliness, neatness and the degree to which the employee was well-organized).
This can be explained by the assumption that people try to maintain cognitive consistency and that
people are not always able to evaluate different attributes separately but rather as a whole (Wirtz
& Bateson, 1995). The significant halo effect of the employee’s expertise on the other items
measuring the satisfaction with the employee could thus be explained by the assumption that
mystery shoppers evaluated the employee as a whole instead of evaluating the different attributes
of the employee separately.
Because the Cronbach’s Alpha of the policy & proficiencies construct was below the acceptance
level of α = .7, the policy & proficiencies items were analyzed separately instead of as a construct.
Significant halo effects of the employee’s expertise on two policy & proficiency items were found,
namely “Student Services is receptive to remarks of customers” and “Student Services keeps its
records accurately”. This matches the results of the study of Render (2014) which indicated a
marginally significant effect of Level 2 on Level 3. Nevertheless, the significant halo effect on the
item “Student Services keeps its records accurately” could probably also be explained by the script
that the employee played in the ‘low expertise’ scenario. In the ‘low expertise’ scenario, the
employee acted as he/she never heard about the specific university the question was about and
could not find the right information, although the employee acted as if he/she tried to find it by
flipping through the pages of a file. A possible logical conclusion of mystery shoppers could be that
33
if the employee cannot find the right answer by flipping through a file, Student Services does not
keep its records accurately.
Additionally, a significant effect of the employee’s expertise on the overall evaluation (Level 4) was
found. It appeared that the overall evaluation was significantly rated lower when mystery shoppers
encountered an employee without sufficient expertise. This matches the results of Wirtz and
Bateson (1995), since they state that dissatisfaction with one element of service quality can lead to
overall customer dissatisfaction. It could be questioned if the influence of the employee’s expertise
on the overall evaluation is actually a halo effect, since the overall evaluation partially consist of
the evaluation of Level 2 (Render, 2014). Those are not two separate constructs, since the overall
evaluation is dependent on the evaluation of the other constructs.
No halo effects were found of the employee’s expertise on the physical environment, which
indicates that the evaluation of the physical environment is reliable. Also no halo effects were
found of the employee’s expertise on the other 4 items measuring the satisfaction with the policies
& proficiencies (Student Services strives for short waiting times, Student Services has good
working conditions, Student Services thinks about the environment, Student Services thinks about
the privacy of its customers).
Overall, it can be concluded that since no halo effects were found on the physical environment
construct (Level 1) and no halo effects were found on most of the policy and proficiencies items
(Level 2), it seems that mystery shoppers are most of the times able to evaluate the different levels
of service quality separately. However, since halo effects were found within the employee
construct (Level 2), it seems harder for mystery shoppers to evaluate items within a topic
separately.
Since mystery shoppers are most of the times capable of evaluating different levels of service
quality separately in contrast to for example customer satisfaction research, this study supports
the statements of Finn and Kayandé (1999) and Wilson (2001) that mystery shopping is a valuable
research method in order to measure service quality.
5.3. Influence of time delay This study also investigated the influence of time delay on the presence of halo effects and the
accuracy of the mystery shopper. Several studies in the context of performance ratings indicated
that halo effects increase when there is time delay between observation of the service outlet and
reporting of the results (Ostrognay & Langan, 1996; Murphy & Reynolds, 1988; Nathan & Lord,
1983). It was investigated if this was also the case in the context of mystery shopping. Previous
research also showed that time delay causes memory loss and people forget details as time goes
by (DeNisi, Cafferty & Meglino, 1984). This was not investigated earlier in the context of mystery
shopping, so this was also taken into account. Dependent on the condition the mystery shoppers
were in, the participants had to fill in the questionnaire immediately after the visit, 1 hour after the
visit or 24 hours after the visit.

34
Time delay between observation and reporting did not influence the amount of correctly reported
answers. An explanation for this finding could be that in the current study, time delays of 1 hour
and 24 hours were used. When larger time delays are used, such as in other studies (Ostrognay &
Langan, 1996; Murphy & Reynolds, 1988; Nathan & Lord, 1983), it could be the case that memory
loss increases which could result in less accurate mystery shopping reports. However, it might not
be very useful to investigate this further since it does not represent reality (in a mystery shopping
research it does not seem logical that a mystery shopper waits a few days before filling in the
questionnaire).
Time delay between observation and reporting did also not increase halo effects in mystery
shopping reports. No significant differences regarding the presence of halo effects were found
between the three time delay conditions. In the context of performance ratings, people base their
judgment on general impressions instead of attribute-specific elements in delayed conditions
(Ostrognay & Langan, 1996; Murphy & Reynolds, 1988; Nathan & Lord, 1983). A reason that this
was not the case in the current study could be that the mystery shoppers were specifically
instructed to give a reliable judgment about the service quality. Mystery shoppers could therefore
be more motivated to evaluate the different levels of service quality separately, but further
research is needed to draw conclusions. Another reason that halo effects did not increase over
time, could again be that the time delays were smaller than in previous studies (Ostrognay &
Langan, 1996; Murphy & Reynolds, 1988; Nathan & Lord, 1983).
5.4. Managerial implications The current study showed that when mystery shoppers do not work under time pressure, mystery
shoppers report 71% of the observations correctly. Because mystery shoppers report a
considerable amount of observations wrong, an important implication of the current study is to
avoid drawing conclusions from of one or two mystery shopping visits. Each outlet needs to be
visited at least nine times in order to be 90% sure that results are accurate. Another important
managerial implication is that in order to obtain accurate results, experienced mystery shoppers
should be hired or that mystery shoppers should be well trained in order to become more
experienced. The current study also implicated that mystery shoppers should not work under time
pressure, as this leads to less accurate results (decrease of accuracy to 48%).
Another implication of this study is corresponding to the implications of the study of Render (2014)
and Wall & Berry (2007), which states that Level 2 (employee) is an important predictor of the
evaluation of the overall service quality. Service managers should therefore train their employees
in order to assure high levels of expertise and social skills to gain a satisfactory overall service
evaluation.
5.5. Limitations This study faces some limitations which now will be discussed. First, the items measuring the
underlying levels of service quality were mostly based on existing service scales, but the
composition of the scale itself was new. The validity of the scale was pre-tested beforehand, but

35
with a considerably small sample size of five people, since this study focused on the reliability of
the mystery shopping method. More research is needed to test the validity of the scale. During the
statistical analysis it also appeared that the internal consistency of the items measuring Level 3
were below the acceptance level of κ = .7, so Level 3 could not be treated as a construct.
Therefore, all items were used separately and as a result, no firm conclusions about halo effects
on Level 3 can be drawn after this study.
A second limitation is the order of the items on the checklist. All items measuring Level 1 were
placed under the title ‘physical environment’, all items measuring Level 2 were placed under the
title ‘employees’, all items measuring Level 3 were placed under the title ‘policies and proficiencies’
and all items measuring Level 4 were placed under the title ‘overall evaluation’. For this reason, it
was clear for the participants which topic they were evaluating during reporting of the results.
When all items would be ordered randomly (which was not the case in the current study), it could
be possible that halo effect are larger. Because in the current study, the items were ordered per
subject, it could namely also be possible that mystery shoppers evaluated each construct as a
whole instead of the whole service quality as a whole (which causes halo effects). When mystery
shoppers do not exactly know which items are measuring which subject, this is probably less
likely, but further research is necessary to draw conclusions.
Lastly, there was a great reliance on the confidentiality of the participants. It was important that
they would not talk about the study with fellow students. Every participant received the same script
and the employee did not always react in the same way to the question the participants had to ask.
When participants would have this information beforehand, they could know that the situation was
manipulated. To obviate this, the researcher let every participant sign an act of confidentiality
(Attachment 2) which stated that it was not allowed to talk with fellow students about the study.
The researcher received no signals that participants knew that the study was manipulated, which
decreased the chances that the reliability of the study was influenced.
5.6. Future research Since mystery shopping is becoming more and more popular as research method and there is
hardly any research on the reliability and validity of the method, future research is important. A
subject that should be addressed in future research is the accuracy of the mystery shopper. The
current study used only six factual items that had to be remembered by the mystery shopper. In
future research, the amount of factual items that the mystery shopper needs to remember could be
extended. Subsequently it could be calculated how many observations a mystery shopper is able
to remember. The effects of training mystery shoppers on the accuracy of mystery shoppers is
another topic that could be addressed in future research.
Furthermore, the influence of halo effects on the reliability of mystery shopping should be further
addressed in future research. In the current study, only halo effects of Level 2 on the other levels
of service quality were addressed. In future research, also Level 1 and Level 3 should be
manipulated in order to investigate if these levels influence the evaluation of the other levels

36
through halo effects. In the current study, the employee’s expertise was manipulated in order to
become a dominant attribute. Also the friendliness of the employee could be manipulated in future
research, to investigate if this causes other results.
To test the influence of time delay on the accuracy of mystery shoppers and the presence of halo
effects, larger time delays could be used in future research, for example one day, four days, and
one week. It could be that the time delays in the current study were not big enough to investigate if
time delay causes memory loss. However, is is questionable if this will be useful to investigate,
since in reality it is not likely that a mystery shopper waits more than one day before reporting the
results.
Another recommendation for future research is to investigate the presence of halo effects in
mystery shopping reports by using a questionnaire where the items are randomly organized
instead of placed under a certain topic. When mystery shoppers do not know exactly which item is
measuring which level of service quality, it could be harder for them to evaluate all items
separately.
5.7. Conclusions The main research question of this study was: To what extent is mystery shopping a reliable
research method when it concerns the accuracy of mystery shoppers, the presence of halo effects
and the influence of time delay between observation and reporting? The current study indicates
that mystery shoppers report only 71% of the observations correctly when they have enough time
to observe. This indicates that least nine visits per outlet are necessary to obtain reliable results.
Furthermore, mystery shoppers should not work under time pressure and experienced mystery
shoppers should be hired, since this increases the accuracy of mystery shopping reports.
Furthermore, this study indicates that halo effects could be present in mystery shopping reports,
especially within the employee construct, though they do not seem very threatening. No halo
effects were found on the physical environment and on most of the policy and proficiencies items,
which indicates that mystery shopping data on these levels of service quality is reliable. This
indicates that mystery shopping is a reliable research method when it concerns halo effects,
though it must be kept in mind that mystery shoppers might be not able to evaluate different items
within a construct (representing a level of service quality) separately.
Additionally, time delay until one day between observation and reporting does not threaten the
reliability of mystery shopping reports. Mystery shopping reports were not less accurate when time
delay was introduced. Also halo effects of the employee’s expertise on all other constructs did not
increase when time delay was introduced.

37
REFERENCES
Beckwith, N. E., Kassarjian, H. H., & Lehmann, D. R. (1978). Halo effects in marketing research: ~
Review and prognosis. Advances in consumer research,5(1), 465-467.
Brady, M. K., & Cronin Jr, J. J. (2001). Some new thoughts on conceptualizing perceived service
quality: a hierarchical approach. Journal of marketing, 65(3), 34-49.
Chiu, H. C., & Lin, N. P. (2004). A service quality measurement derived from the theory of
needs. The Service Industries Journal, 24(1), 187-204.
DeNisi, A. S., Cafferty, T. P., & Meglino, B. M. (1984). A cognitive view of the performance
appraisal process: A model and research propositions. Organizational behavior and
human performance, 33(3), 360-396.
Van Doorn, J. (2008). Is there a halo effect in satisfaction formation in business-to-business
services?. Journal of Service Research, 11(2), 124-141.
ESOMAR. (2005). ESOMAR World research codes & guidelines: Mystery Shopping. Retrieved
from: http://www.esomar.org/uploads/pdf/ESOMAR_Codes&Guidelines_
MysteryShopping.pdf.
Finn, A., & Kayandé, U. (1999). Unmasking a phantom: a psychometric assessment of mystery
shopping. Journal of retailing, 75(2), 195-217.
Ferguson, D. (2014). The Secrets of the Mystery Shopper. The Guardian. Retrieved from:
http://www.theguardian.com/money/2014/mar/11/secrets-mystery-shopper
Holbrook, M. B. (1983). Using a structural model of halo effect to assess perceptual distortion due
to affective overtones. Journal of Consumer Research, 10(2), 247-252.
Ilgen, D. R., & Feldman, J. M. (1983). Performance appraisal: A process focus. Research in
organizational behavior, 5, 141-197.
Kelkar, M. (2010). SERVDIV: A Vedic approach to measurement of service quality. Services
Marketing Quarterly, 31(4), 420-433.
Kozlowski, S. W., & Ford, J. K. (1991). Rater information acquisition processes: Tracing the effects
of prior knowledge, performance level, search constraint, and memory
demand. Organizational behavior and human decision processes, 49(2), 282-301.
Lowndes, M., & Dawes, J. (2001). Do distinct SERVQUAL dimensions emerge from mystery
shopping data? A test of convergent validity. Canadian Journal of Program
Evaluation, 16(2), 41-54.

38
Morrison, L. J., Colman, A. M., & Preston, C. C. (1997). Mystery customer research: Cognitive
processes affecting accuracy. Journal of the Market Research Society, 39, 349-361.
Mystery Shopper Providers Association. (2014). http://www.mysteryshop.org.
Murphy, K. R., & Reynolds, D. H. (1988). Does true halo affect observed halo?.Journal of Applied
Psychology, 73(2), 235.
Nathan, B. R., & Lord, R. G. (1983). Cognitive categorization and dimensional schemata: A
process approach to the study of halo in performance ratings. Journal of Applied
Psychology, 68(1), 102.
Nisbett, R. E., & Wilson, T. D. (1977). The halo effect: Evidence for unconscious alteration of
judgments. Journal of personality and social psychology, 35(4), 250.
Ostrognay, G. M., & Langan-Fox, J. (1996). Moderating Effects of Processing Objective, Question
Order and Delay on Memory and Judgement. International Journal of Selection and
Assessment, 4(4), 195-214.
Parasuraman, A., Zeithaml, V. A., & Berry, L. L. (1988). Servqual: A multiple-item scale for
measuring consumer perc. Journal of retailing, 64(1), 12-40.
Prinsen, S., Gosselt, F. J., Van Hoof, J. J., & De Jong, M. D. (2006). De mystery shopper
bespioneerd. Tijdschrift voor Marketing, 40(11), 4‐5.
Render, D. (2014). Spying on the mystery shopper (Unpublished master’s thesis). Universiteit
Twente, Enschede.
Strawderman, L., & Koubek, R. (2008). Human factors and usability in service quality
measurement. Human Factors and Ergonomics in Manufacturing & Service
Industries, 18(4), 454-463.
Smith, S., & Wheeler, J. (2002). Managing the customer experience: Turning customers into
advocates. Pearson Education.
Wall, E. A., & Berry, L. L. (2007). The Combined Effects of the Physical Environment and
Employee Behavior on Customer Perception of Restaurant Service Quality. Cornell Hotel
and Restaurant Administration Quarterly, 48(1), 59‐69.
Wiele, T. V. D., Hesselink, M., & Waarden, J. V. (2005). Mystery shopping: A tool to develop
insight into customer service provision. Total Quality Management, 16(4), 529-541.
Wilson, A. M. (1998). The use of mystery shopping in the measurement of service
delivery. Service Industries Journal, 18(3), 148-163.

39
Wilson, A. M. (2001). Mystery Shopping: Using Deception to Measure Service Performance.
Psychology and Marketing, 18(7), 721-734.
Wirtz, J., & Bateson, J. E. (1995). An experimental investigation of halo effects in satisfaction
measures of service attributes. International Journal of Service Industry
Management, 6(3), 84-102.
Wirtz, J. (2000). An examination of the presence, magnitude and impact of halo on consumer
satisfaction measures. Journal of Retailing and Consumer Services, 7(2), 89-99.

40
ATTACHMENT 1 – MYSTERY SHOPPER BRIEFING
Bedankt dat je mee wil werken aan dit onderzoek! In dit deel van het onderzoek is het de
bedoeling dat de kwaliteit van de dienstverlening van Student Services zal worden onderzocht.
Student Services is een balie in de Vrijhof waar je allerlei administratieve dingen met betrekking tot
het studeren kunt regelen. Voorbeelden hiervan zijn je inschrijving, het betalen van collegegeld,
het volgen van minoren en je studentenkaart. Jij zult als mysteryshopper Student Services gaan
bezoeken. Mysteryshoppers zijn en blijven altijd anoniem. Gedraag je daarom zoveel mogelijk als
een gewone student.
Het bezoek
Het is de bedoeling dat je zo naar Student Services toe gaat. Student Services bevindt zich in
Vrijhof 239B (trap op richting de UB, boven aan de trap de hoek om). Je krijgt zo een checklist te
zien met dingen waar je op moet letten tijdens je bezoek. Je krijgt 10 minuten om dit door te lezen.
Daarnaast is het de bedoeling dat je de dienstverlening van een medewerker evalueert. Hiervoor
stap je op de mannelijke medewerker met donker haar en bril. Alleen wanneer deze medewerker
niet beschikbaar is stap je op de andere medewerk(st)er af. Je volgt het volgende script:
Je bent op dit moment tweedejaars student Communicatiewetenschap aan de Universiteit Twente
en je bent je aan het oriënteren op een minor. Je wil je kennis verbreden en bent geïnteresseerd in
het geloof. Daarom zit je eraan te denken een minor te volgen aan de Theologische Universiteit in
Kampen. Je kunt hier een vrije minor volgen die je samenstelt met vakken uit de bachelor
Theologie. Echter ken je niemand die dit eerder heeft gedaan en je vraagt je daarom af wat de
mogelijkheden zijn. Je gaat naar Student Services en vraagt wat de mogelijkheden zijn als je een
minor wil volgen aan de Theologische Universiteit in Kampen. Je bent benieuwd wat de procedure
is. Mocht de medewerker vragen terug gaan stellen dan mag je meespelen en een zelf
antwoorden op die vragen bedenken.
Tijdens het bezoek probeer je alle onderdelen van de checklist zo goed mogelijk te evalueren
zodat je na het bezoek een betrouwbaar oordeel kunt geven.
Om de kwaliteit van de geleverde service nog beter te kunnen meten zal je een ipad hoesje
meenemen met opnameapparatuur. Deze apparatuur staat al aan, hier hoef je dus verder niks
mee te doen. Bij het bezoek aan Student Services leg je de tas op de balie, op deze manier is de
geluidskwaliteit het beste.
Na het bezoek
Na het bezoek kom je weer terug naar dit lokaal. Je geeft de tas met opnameapparatuur weer
terug en wacht op verdere instructies van de onderzoeksleider.
41
ATTACHMENT 2 – INFORMED CONSENT
Alle data in dit onderzoek zal anoniem worden behandeld. Deelname aan dit onderzoek is op
vrijwillige basis, je kunt te alle tijden stoppen met het onderzoek als dit gewenst is. In verband met
privacy en copyright rechten is het belangrijk dat er géén foto’s of video’s van dit document of
Student Services te maken. Ook mogen er géén aantekeningen tijdens of na het mysteryshop
bezoek worden gemaakt. Om de betrouwbaarheid van het onderzoek te kunnen garanderen is het
belangrijk dat er niet met medestudenten over de inhoud van het onderzoek gepraat wordt.
Door hier te tekenen verklaar ik:
Niet met medestudenten over de inhoud van dit onderzoek te praten.
Géén foto’s of video’s van dit document of Student Services te maken.
Geen aantekeningen te maken
Vrijwillig mee te werken aan dit onderzoek
Naam
Datum
Handtekening’
Wil je na afloop van het onderzoek op de hoogte worden gebracht van de resultaten? Laat dan
hieronder je e-mailadres achter.

42
ATTACHMENT 3 – CHECKLIST
De ruimte
De ruimte van Student Services is schoon
De ruimte van Student Services ziet er aantrekkelijk uit
De ruimte van Student Services is groot genoeg
De ruimte van Student Services is uitnodigend
Het interieur van Student Services is van deze tijd
De balie van Student Services zit op een handige locatie
Medewerkers
De medewerker behandelde mij vriendelijk
De medewerker kon mijn vragen beantwoorden
De medewerker had voldoende competenties om mij te kunnen helpen
De medewerker begreep wat ik bedoelde
De medewerker zag er netjes uit
De medewerker was georganiseerd
Policies
Student Services streeft naar korte wachttijden
Er zijn goede werkomstandigheden bij Student Services
Student Services staat open voor op of aanmerkingen van haar klanten
Student Services denkt aan het milieu
Student Services denkt aan de privacy van haar klanten
Student Services houdt haar administratie accuraat bij
Algemene evaluatie
Student Services verleent excellente service
Student Services heeft een goede indruk op mij achtergelaten
Het bezoek aan Student Services was voor mij een goede ervaring
Ik heb vertrouwen in Student Services
Ik zou Student Services aanbevelen aan andere studenten om er dingen te regelen
Het bezoek aan Student Services stelt me op mijn gemak
Overige omgevingsvragen
Hoeveel bellen staan er op de balie?
Welke openingstijden staan er op de wand bij de ingang?
Hoeveel krukken/poefs staan er bij Student Services?
Van welk merk zijn de beeldschermen die aan de wand hangen?
Wat staat er op de grond bij binnenkomst?
Wat voor aankleding van de ruimte staat er bij binnenkomst rechts in de hoek?

43
ATTACHMENT 4 – QUESTIONNAIRE
Nummer mysteryshopper:
Dag van de week:
□ Maandag
□ Dinsdag
□ Woensdag
□ Donderdag
□ Vrijdag
Tijdstip bezoek:
□ 10u-12u
□ 12u-14u
□ 14u-16u
Er volgen nu een aantal stellingen waarin je mening wordt gevraagd over je bezoek aan Student
Services. Geef bij elke stelling je mening, je kunt daarbij kiezen uit: helemaal oneens, oneens, niet
oneens/niet eens, eens en helemaal eens. Je moet bij elke stelling iets invullen. Als je denkt dat je
de vraag niet goed kunt beoordelen of het antwoord niet meer precies weet, vul je het antwoord in
waarvan je denkt dat dat het meest van toepassing is. Het is belangrijk dat je antwoorden geeft
gebaseerd op het bezoek aan Student Services als mysteryshopper, niet op basis van eventuele
eerdere bezoeken aan Student Services.
Ruimte Hele-maal oneens
Oneens Niet oneens/ niet eens
Eens Hele-maal eens
De ruimte van student Services is schoon □ □ □ □ □
De ruimte van Student Services ziet er aantrekkelijk uit
□ □ □ □ □
De ruimte van Student Services is groot genoeg
□ □ □ □ □
De ruimte van Student Services is uitnodigend
□ □ □ □ □
Het interieur van Student Services is van deze tijd
□ □ □ □ □
De balie van Student Services zit op een handige locatie
□ □ □ □ □

44
Medewerker Hele-maal oneens
Oneens Niet oneens/ niet eens
Eens Hele-maal eens
De medewerker behandelde mij vriendelijk □ □ □ □ □
De medewerker kon mijn vragen beantwoorden
□ □ □ □ □
De medewerker had voldoende competenties om mij te kunnen helpen
□ □ □ □ □
De medewerker begreep wat ik bedoelde □ □ □ □ □
De medewerker zag er netjes uit □ □ □ □ □
De medewerker was georganiseerd □ □ □ □ □
Policies Hele-maal oneens
Oneens Niet oneens/ niet eens
Eens Hele-maal eens
Student Services streeft naar korte wachttijden
□ □ □ □ □
Er zijn goede werkomstandigheden bij Student Services
□ □ □ □ □
Student Services staat open voor op of aanmerkingen van haar klanten
□ □ □ □ □
Student Services denkt aan het milieu □ □ □ □ □
Student Services denkt aan de privacy van haar klanten
□ □ □ □ □
Student Services houdt haar administratie accuraat bij
□ □ □ □ □
Algemene indruk Hele-maal oneens
Oneens Niet oneens/ niet eens
Eens Hele-maal eens
Student Services verleent excellente service □ □ □ □ □
Student Services heeft een goede indruk op mij achtergelaten
□ □ □ □ □
Het bezoek aan Student Services was voor mij een goede ervaring
□ □ □ □ □
Ik heb vertrouwen in Student Services □ □ □ □ □
Ik zou Student Services aanbevelen aan andere studenten om er dingen te regelen
□ □ □ □ □
Het bezoek aan Student Services stelde me op mijn gemak
□ □ □ □ □
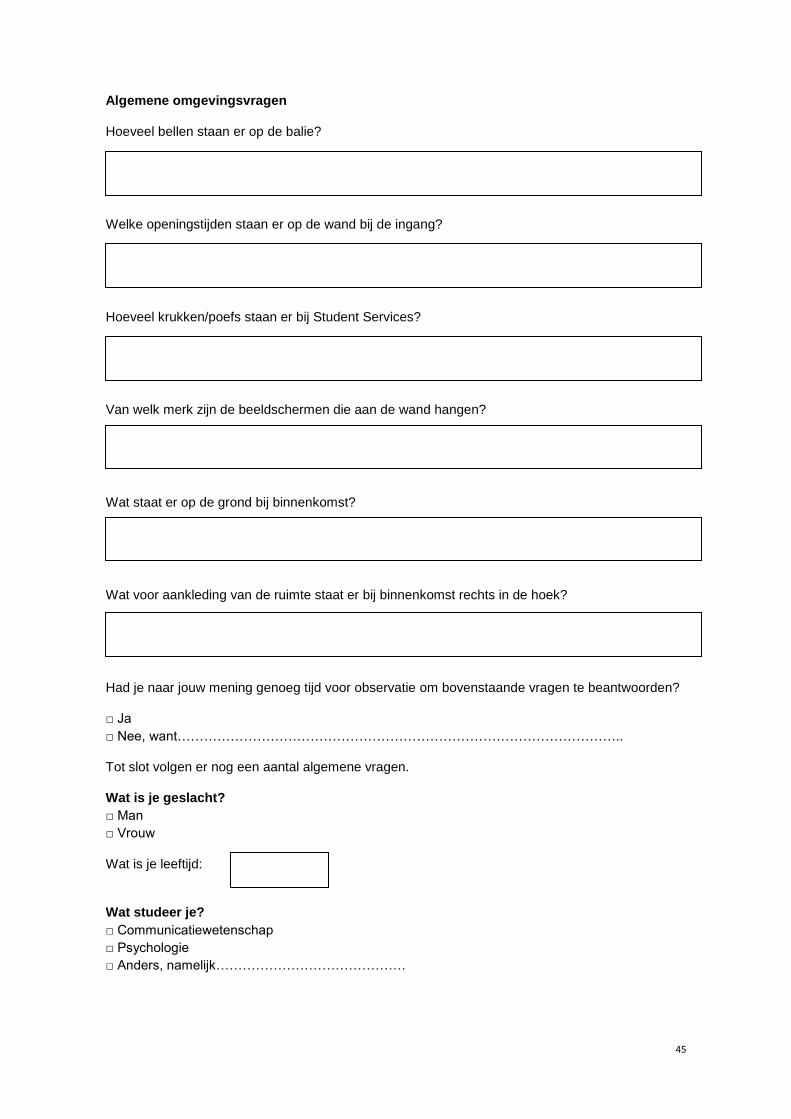
45
Algemene omgevingsvragen
Hoeveel bellen staan er op de balie?
Welke openingstijden staan er op de wand bij de ingang?
Hoeveel krukken/poefs staan er bij Student Services?
Van welk merk zijn de beeldschermen die aan de wand hangen?
Wat staat er op de grond bij binnenkomst?
Wat voor aankleding van de ruimte staat er bij binnenkomst rechts in de hoek?
Had je naar jouw mening genoeg tijd voor observatie om bovenstaande vragen te beantwoorden?
□ Ja
□ Nee, want………………………………………………………………………………………..
Tot slot volgen er nog een aantal algemene vragen.
Wat is je geslacht?
□ Man
□ Vrouw
Wat is je leeftijd:
Wat studeer je?
□ Communicatiewetenschap
□ Psychologie
□ Anders, namelijk…………………………………….
46
Heb je al wel eens eerder meegewerkt aan een mysteryshop onderzoek?
□ Nee
□ Ja, ik ben zelf wel eens mysteryshopper geweest
□ Ja, mijn rol was………………………………………
Ben je wel eens eerder bij Student Services geweest?
□ Nee
□ Ja, 1-2 keer
□ Ja, 3-4 keer
□ Ja, 5 keer of vaker
Wat denk je dat het doel is van dit onderzoek?