The Relevance of Non-financial Performance …vmohan/bio/files/published papers...The Relevance of...
22
The Relevance of Non-financial Performance Measures for CEO Compensation: Evidence from the Airline Industry ANTONIO DAVILA [email protected] Graduate School of Business, Stanford University, Stanford, CA 94305 MOHAN VENKATACHALAM* [email protected] Fuqua School of Business, Duke University, PO BOX 90120, Durham, NC 27708 Abstract. This paper investigates the role of non-financial performance measures in executive compen- sation. Using a sample of airline firms we document that passenger load factor, an important non-financial measure for firms in this industry, is positively associated with CEO cash compensation. This association is significant after controlling for traditional accounting performance measures (return on assets) and financial performance measures (stock returns). This evidence is consistent with the hypothesis that non- financial measures provide incremental information about CEOs’ actions over financial measures and hence, receive a positive weight in compensation contracts. We also explore cross-sectional differences in the importance of non-financial performance measures. We find weak evidence that CEO power and the noise of financial performance measures impact the relationship between non-financial performance measures and cash compensation. Keywords: non-financial performance measures, CEO compensation, passenger load factor, airline industry JEL Classification: J33, L25, L93, M41, M52 Traditionally, firms have used accounting measures such as earnings, return on assets or return on investment to reward managers. Recent evidence indicates that firms are increasingly using non-financial performance measures such as customer satisfaction and product quality in the contracting process within firms (e.g., Ittner et al., 1997; Banker et al., 2000; Nagar and Rajan, 2001). The reason for the use of non-financial measures in compensation contracts is that they provide information incremental to accounting measures in rewarding and motivating managers. For CEOs of publicly traded firms, however, forward-looking stock prices play a significant role in com- pensation contracts (Murphy, 1998). The rationale for using stock prices in con- tracting is that they capture both the current and future impact of CEOs’ actions, and accordingly, may represent a sufficient statistic for accounting and non-financial performance measures. Despite the fact that stock prices impound information contained in accounting and non-financial measures, agency theory suggests that these measures will complement stock prices in CEO compensation (Feltham and Xie, 1994). In support of this theory, several researchers document the role of accounting *Corresponding author. Review of Accounting Studies, 9, 443–464, 2004 ȑ 2004 Kluwer Academic Publishers. Manufactured in The Netherlands.
-
Upload
duongkhuong -
Category
Documents
-
view
216 -
download
1
Transcript of The Relevance of Non-financial Performance …vmohan/bio/files/published papers...The Relevance of...

The Relevance of Non-financial Performance
Measures for CEO Compensation:
Evidence from the Airline Industry
ANTONIO DAVILA [email protected]
Graduate School of Business, Stanford University, Stanford, CA 94305
MOHAN VENKATACHALAM* [email protected]
Fuqua School of Business, Duke University, PO BOX 90120, Durham, NC 27708
Abstract. This paper investigates the role of non-financial performance measures in executive compen-
sation. Using a sample of airline firms we document that passenger load factor, an important non-financial
measure for firms in this industry, is positively associated with CEO cash compensation. This association is
significant after controlling for traditional accounting performance measures (return on assets) and
financial performance measures (stock returns). This evidence is consistent with the hypothesis that non-
financial measures provide incremental information about CEOs’ actions over financial measures and
hence, receive a positive weight in compensation contracts. We also explore cross-sectional differences in
the importance of non-financial performance measures. We find weak evidence that CEO power and the
noise of financial performance measures impact the relationship between non-financial performance
measures and cash compensation.
Keywords: non-financial performance measures, CEO compensation, passenger load factor, airline
industry
JEL Classification: J33, L25, L93, M41, M52
Traditionally, firms have used accounting measures such as earnings, return on assetsor return on investment to reward managers. Recent evidence indicates that firms areincreasingly using non-financial performance measures such as customer satisfactionand product quality in the contracting process within firms (e.g., Ittner et al., 1997;Banker et al., 2000; Nagar and Rajan, 2001). The reason for the use of non-financialmeasures in compensation contracts is that they provide information incremental toaccounting measures in rewarding and motivating managers. For CEOs of publiclytraded firms, however, forward-looking stock prices play a significant role in com-pensation contracts (Murphy, 1998). The rationale for using stock prices in con-tracting is that they capture both the current and future impact of CEOs’ actions, andaccordingly, may represent a sufficient statistic for accounting and non-financialperformance measures. Despite the fact that stock prices impound informationcontained in accounting and non-financial measures, agency theory suggests thatthese measures will complement stock prices in CEO compensation (Feltham and Xie,1994). In support of this theory, several researchers document the role of accounting
*Corresponding author.
Review of Accounting Studies, 9, 443–464, 2004
� 2004 Kluwer Academic Publishers. Manufactured in The Netherlands.

numbers incremental to market-based measures in CEO compensation contracts (e.g.,Lambert and Larcker, 1987; Sloan, 1993). However, little empirical research exists onthe economic importance of non-financial performance measures for CEO compen-sation. The objective of this study is to provide evidence on this issue.A direct approach to investigate whether CEOs are evaluated and compensated
based on non-financial performance measures would entail an examination of theexplicit use of non-financial measures in compensation contracts. Research by Ittneret al. (1997) uses bonus related disclosures in proxy statements to examine thedeterminants of the relative weight placed on non-financial performance measures incalculating bonus payments to CEOs.1 However, as they acknowledge in their study,their sample is limited to firms that have chosen to disclose the specific relativeweights on non-financial measures in bonus contracts. The generally limited dis-closures about compensation contracts in the proxy statements suggest that manyfeatures of executive compensation contracts including the use of non-financialperformance measures may be implicit.We examine the premise that non-financial measures are statistically and eco-
nomically important for compensating CEOs by exploring whether CEO compen-sation behaves as if CEOs are evaluated based on non-financial performancemeasures. Because non-financial measures of performance are not comparable acrossindustries unlike accounting or stock market performance measures, we focus ourstudy on one industry: the airline industry. Arguably, non-financial performancemeasures have incremental information about the performance of CEOs of airlinefirms because they may capture performance dimensions not fully reflected inaccounting or stock market performance measures, they exhibit a better signal-to-noise behavior, or they allow the design of contracts that are more congruent.The non-financial performance measure we use is passenger load factor for airline
firms. Passenger load factor, measured as the number of passenger-miles (i.e., thetotal number of miles flown by all passengers) divided by the total number of seatmiles available, is among the most relevant measures in this industry (Francis et al.,2003). It captures information about an important aspect of airline management: theability to use installed capacity. Unlike other non-financial performance measures(e.g., customer satisfaction) that are often viewed as leading indicators of firm per-formance, passenger load factor captures operational efficiency of an airline andhence is more of a current indicator of firm performance. Previous research (Behnand Riley, 1999; Francis et al., 2003) finds that passenger load factor has implica-tions beyond traditional accounting measures for assessing firm performance andequity valuation. Passenger load factor, by no means, is a comprehensive measure ofCEO performance. For example, it does not capture the influence that CEO’s actionsmay have on future performance (investment decisions), on negotiating the cost ofinputs (fuel or salary costs) or the prices of outputs (ticket sales). Accordingly, thismeasure is not likely to be used in isolation for contracting. Nevertheless, it is likelyto capture information about an important dimension of CEO current performancewith more precision than accounting and stock-based measures (Banker and Datar,1989). Thus, we posit that passenger load factor will have incremental informationcontent to be used in the design of CEOs’ contracts for airline firms.
DAVILA AND VENKATACHALAM444

We test this hypothesis by examining the association between passenger load factorand CEO compensation for a sample of airline firms, after controlling for accountingand market-based performance measures. Focusing on the airline industry and usinga cross-sectionally comparable non-financial performance measure has the distinctadvantage of increasing the power of empirical tests. We acknowledge, however, thatfocusing on one industry limits the generalizability of our findings.Our sample is comprised of 246 firm-year observations between 1986 and 2000 from
35 airline firms. For the empirical analyses we consider both aggregate CEO com-pensation as well as its components: cash compensation (i.e., salary and bonus) andoption compensation. We find that the passenger load factor is primarily associatedwith the cash component of CEO compensation. Moreover, this performance mea-sure adds significant incremental explanatory power (increase in R2 of 10%) to aregression of CEO cash compensation on stock returns and accounting return onassets. In economic terms, we find that a 10% increase in the passenger load factor(one standard deviation) is associated with an increase of approximately $134,000 (atthe mean) in CEO cash compensation (or 37% of base salary). This result is consistentwith passenger load factor being an important dimension of current firm performanceand being rewarded through the cash component of total compensation. Our resultsare robust to a ‘‘changes’’ specification that addresses inference problems associatedwith a ‘‘levels’’ specification because of omitted variables.We also extend our analysis to examine cross-sectional differences in the relation
between passenger load factor and CEO compensation. In particular, we investigatewhether CEO power and noise in the stock return performance measure (proxied byreturn volatility) affect the association between non-financial performance measureand CEO compensation. Our results suggest that firms with powerful CEOs (e.g.,where CEO is also the chairman of the Board) and high levels of stock returnvolatility place more weight on passenger load factor in determining CEO com-pensation. However, because this result obtains only in the ‘‘levels’’ specification weview the evidence on the cross-sectional differences in the association between pas-senger load factor and CEO compensation as weak.The paper extends extant literature on the role of non-financial measures in two
ways. First, prior work (e.g., Ittner et al., 1997) takes the use of non-financialmeasures as given, and examines factors that influence the relative weights on non-financial performance measures, conditional on firms using such measures. In con-trast, we do not assume the use of non-financial measures in CEO compensation.Rather, we test whether non-financial measures provide incremental informationregardless of whether such measures are implicitly or explicitly used.2 Thus, ourstudy is not limited to firms that explicitly disclose the use of non-financial perfor-mance measures but includes firms that may implicitly use the information containedin these measures for subjective assessments of managerial performance. Second, wepartition the compensation variable into its different components: cash compensa-tion and option compensation, to test how non-financial performance measuresaffect different components of CEO compensation.The paper proceeds as follows: Section 1 develops our hypothesis and discusses
related research. Section 2 describes the research method used to test our hypothesis.
THE RELEVANCE OF NON-FINANCIAL PERFORMANCE MEASURES FOR CEO COMPENSATION 445

Section 3 describes the sample and measurement of variables. Section 4 presents ourprimary empirical findings while Section 5 reports results from additional analyses.In Section 6, we present our conclusions.
1. Hypothesis Development and Related Research
In this section we present the theoretical background that guides our hypothesis onthe use of non-financial measures in CEO compensation. We begin with the conceptof sufficient statistic in a single action agency setting and then extend the argument tomultiple actions setting that better captures the dynamics of CEO activity. Animportant theoretical justification for the use of non-financial performance measuresin compensation contracts is based on the concept of sufficient statistic (Holmstrom,1979). Non-financial performance measures are useful in contracting if they provideincremental information about the agent’s effort beyond that contained in otheravailable measures, including accounting data and stock prices. A measure mayprovide incremental information if it captures additional dimensions of performancenot reflected in existing measures, or if it contains less noise relative to other mea-sures. The weight on a performance measure in compensation contracts can beshown to be a function of its signal to noise ratio (Banker and Datar, 1989).Accounting performance measures do not capture all the dimensions of CEO
performance and, therefore non-financial performance measures may provideincremental information beyond accounting measures (Banker and Datar, 1989). Incontrast, stock price represents an aggregate measure of future value that impoundsall existing public information including non-financial measures. If stock pricesubsumes information in other performance measures then such other measures willbe redundant for contracting. However, even if stock price may be a sufficient sta-tistic from a valuation perspective, it may not be so for contracting purposes.Theoretical work by Bushman and Indjejikian (1993), Kim and Suh (1993), andFeltham and Wu (1999) show that when stock price is an inefficient aggregator ofpublicly available information, the role for other performance measures emerge incontracting. Recent work (e.g., Rajgopal et al., 2003) suggests that stock prices donot efficiently incorporate the implications of non-financial measures. Thus, a stockprice-based performance measure may not necessarily represent a sufficient statisticfor non-financial information.Recent studies argue that even if stock prices efficiently incorporate information in
financial and non-financial performance measures, they would still be considered incontracting. First, stock prices may suffer from higher levels of noise, i.e., reflectvariance in performance unrelated to the agent’s effort (Banker and Datar, 1989); andhence, including stock prices for contracting imposes additional risk on the agent. Toreduce this additional risk, additional performance measures may be included incontracts. The second argument stems from the lack of congruency of stock prices forcontracting (Feltham and Xie, 1994; Datar et al., 2001). Feltham and Xie (1994) showthat while stock prices aggregate all existing public information they may do so in away that is not congruent with the weights required on the various signals from a
DAVILA AND VENKATACHALAM446

contracting perspective. In other words, the weights on different signals that areimplicit in determining the stock price are established with the objective of valuing thefirm and not with the objective of assessing the performance of the manager. Thus,‘‘price is not necessarily, nor even likely to be, a perfectly congruent performancemeasure’’ (Feltham and Xie, 1994, p. 447). If stock prices are not congruent with theintended mix of actions of the CEO, then we expect additional performance measuresto be included in the contracting process. Finally, stock prices may be complementedwith alternative performance measures when CEOs are allowed to trade (Baiman andVerrecchia, 1995). In this case, the compensation contract not only rewards the CEOs’effort but also determines their trading incentives.The preceding discussion suggests that non-financial measures are likely to be
included in efficient contracts in addition to accounting and market-based perfor-mance measures. We test this prediction in the context of the airline industry usingpassenger load factor, a common performance indicator in terms of productivity, asthe non-financial performance measure (Schefczyk, 1993). Passenger load factormeasures the amount of revenue passenger miles that an airline can generate basedon the capacity of available passenger miles. Passenger load factor may have theproperties required to provide incremental information to accounting and market-based performance measures for four reasons. First, airline firms have a highoperational leverage where fixed costs account for a significant proportion of theirtotal costs. Thus, capacity utilization is a key non-financial measure to explain airlineperformance (Behn and Riley, 1999; Francis et al., 2003).3 Also, unlike other non-financial measures (e.g., customer satisfaction index) used in prior research that areviewed as leading indicators of firm performance, passenger load factor is a currentindicator of firm performance in that it captures operational efficiency beyondfinancial performance measures such as return on assets. Consistent with thisargument, Behn and Riley (1999) show that passenger load factor is contempora-neously associated with operating profitability.4
Second, analysts often consider passenger load factor as an important perfor-mance metric for airline firms in addition to other performance measures (e.g., Behnand Riley, 1999; Francis et al., 2003). Moreover, Francis et al. (2003) find that non-financial performance measures such as passenger load factor (in combination withother metrics such as revenue passenger miles) add incremental explanatory power toearnings based metrics for equity valuation. Third, from a signal to noise perspec-tive, passenger load factor captures an operational dimension – capacity utilization –that is less noisy than accounting or market measures. While financial measuresincorporate noise from sources in addition to that in passenger load factor, such aschanges in cost of inputs and ticket prices, passenger load factor is not directlyinfluenced by external factors over which the CEO has little or no influence (e.g., fuelcosts) but that are reflected in accounting and market measures. Thus, including ameasure with a superior signal to noise ratio may increase the overall congruity ofthe compensation contract and decrease the risk that the CEO bears. Finally, whileprior research shows that information in passenger load factor is impounded inprices, it is unclear that such information is incorporated either efficiently or in amanner consistent with the weights appropriate for goal congruence. Moreover, this
THE RELEVANCE OF NON-FINANCIAL PERFORMANCE MEASURES FOR CEO COMPENSATION 447

measure is likely to be less noisy than accounting measures of performance or stockprices because it is not easily manipulable. The combination of these two charac-teristics is likely to lead the passenger load factor measure to have a signal-to-noiseratio attractive enough to receive a significant weight in CEO compensation.In contrast, the incremental benefits of including passenger load factor may not be
high enough compared to the incremental costs of contracting with an additionalmeasure. It is also plausible that other accounting measures of capacity utilization,e.g., sales turnover may capture the information contained in passenger load factor.Further, accounting and stock price together may appropriately capture the infor-mation in passenger load factor and make the latter measure redundant to CEO’sperformance. Finally, shareholders may choose to contract on stock performance assuggested in Core et al. (2003) regardless of the potential contracting efficienciesassociated with alternative non-market based performance measures. This is becausea substantial portion of the CEO compensation relates to price-based incentivesfrom stock and options granted to CEO. Thus, whether passenger load factorprovides incremental explanatory power for CEO compensation beyond accountingand market-based measures remains an empirical question.
2. Research Method
We infer the use and economic importance of non-financial performance measures incompensation contracts by examining the cross-sectional relation between CEOcompensation and passenger load factor. In general, identifying important non-financial performance measures is particularly difficult because a multitude of non-financial performance measures such as customer satisfaction, employee satisfaction,product innovation, etc., are commonly used in compensation contracts. Further-more, cross-sectionally comparable proxies for such measures are not easilyobtainable. Therefore, we focus on one industry where non-financial performancemeasures are likely to have incremental information beyond accounting measuresand stock price. From a research design perspective, the passenger load factormeasure, has the appealing characteristic of being cross-sectionally comparableacross airline firms.Following the predictions developed in the previous section, we examine the
incremental importance of passenger load factor for CEO compensation by tests ofassociation between the two variables after controlling for other performancemeasures. Specifically, we test the following empirical specification:
Compensationit ¼ d1 þX
d2k� Performancekit þ j ð1Þ
wherekperformancemeasures includingpassenger load factor are used as independentvariables. If a performance measure is important for determining compensation wewould expect d2 to be positive. Several studies have used a similar ‘‘levels’’ specification(Murphy, 1985; Lambert and Larcker, 1987; Yermack, 1995; Bushman et al., 1996;
DAVILA AND VENKATACHALAM448

Core et al., 1999). However, such a specification suffers from omitted firm specificdeterminants of CEO compensation and other unknown variables.5
We address this problem by modifying equation (1) to control for other economicdeterminants of CEO compensation as follows:
Compensationit ¼ d1 þX
d2k� Performancekit þ
Xd3k
� Controlskit þ j ð10Þ
We consider several control variables. First, we control for firm size. Second, wecontrol for a firm’s risk that is predicted to be positively associated with the levelof compensation. Third, we control for the effect of CEO ownership on com-pensation. The sign for this control variable is uncertain. If CEO ownershipcaptures CEO power, then we expect higher CEO ownership to be positivelyrelated to the level of compensation (Holderness and Sheehan, 1988). On theother hand, agency theory (Jensen and Meckling, 1976) identifies low levels ofstock ownership as a symptom of agency problems. Thus, firms with lower CEOownership are likely to design compensation contracts with a higher level of payfor performance. This, in turn, implies higher levels of risk for the CEO and thus,a risk averse CEO would expect higher compensation for the increased risk.Consistent with this latter prediction, recent empirical work by Core et al. (1999)finds a negative relation between CEO ownership and compensation. Fourth, wecontrol for CEO tenure that captures both CEO power and the quality of theCEO (Bushman et al., 1996). CEOs with greater power to influence the board aremore likely to extract higher compensation. Regardless of CEO power, highertenure may reflect better quality CEO and hence may have higher expectedcompensation. Thus, we predict CEO tenure to be positively related to compen-sation. Finally, we control for growth opportunities. Smith and Watts (1992)document that firms with more growth options have higher executive compen-sation. Hence, we predict a positive relation between growth opportunities andcompensation.As an alternative solution to address the omitted variable problem inherent in
equation (1), we consider a ‘‘changes’’ version of specification (1) wherein we relatechanges in compensation to change in performance (Janakiraman, 1992; Smith andWatts, 1992). That is, we estimate the following model:
DCompensationit ¼ d1 þX
d2k�DPerformancekit þ j ð2Þ
This specification allows the pooling of observations across firms as firm-specificdeterminants of compensation are controlled implicitly because such determinants areassumed to be constant across time. Nevertheless, to be consistent with the expandedspecification in (1¢) we estimate the following modified version of equation (2):
DCompensationit¼d1þX
d2k�DPerformancekitþ
Xd3k
�DControlskitþj ð20Þ
THE RELEVANCE OF NON-FINANCIAL PERFORMANCE MEASURES FOR CEO COMPENSATION 449

In estimating the empirical specifications, we explore the incremental relevance ofpassenger load factor for two components of CEO compensation: cash and optioncompensation. In principle, the impact of passenger load factor could occur through,bonus (cash) component of CEO compensation, and/or through additional stockand option grants. However, if the impact of passenger load factor occurs throughonly one component of compensation, then the impact on overall compensation islikely to be muted. In other words, examining the relation between passenger loadfactor and total compensation alone will likely result in low power of tests.Furthermore, the relation between passenger load factor and the two components
of compensation are not necessarily similar. With respect to cash component, it isreasonable to expect the relationship to be positive as we relate performance measureswith compensation in the current period. In contrast, the relationship between optioncompensation and non-financial measures is less obvious. This is because optioncompensation may not only reward current performance but also motivate futureperformance. A positive relationship is expected if option compensation relates toreward for current performance. However, firms with poor current performance mayaward more options to ‘‘restore’’ incentives and thereby motivate CEOs to improvelong-term performance. In such an instance, we would posit a negative relationbetween option compensation and performance measures. Hence, we do not have asign prediction for the relation between passenger load factor and option compensation.In sum, the previous discussion suggests that if passenger load factor is at all
relevant to the contracting process, it is most likely to be observed in the cash portionof CEO compensation.
3. Sample Selection, Measurement of Variables and Descriptive Statistics
3.1. Sample
To build our sample, we obtain a list of all airline firms from the EDGAR onlinedatabase. From this list, we eliminate firms for which we are unable to collectfinancial and stock price information from Compustat and CRSP databases. Wehand-collected CEO compensation data from the proxy statements available fromEDGAR online and Laser Disclosure. Passenger load factor was hand-collectedfrom the World Air Transport Statistics published yearly by IATA (InternationalAir Transport Association) and from the proxy statements. Our final sample consistsof 35 airlines and 246 firm-year observations. Table 1 lists our sample of firms.
3.2. Measurement of Variables
3.2.1. Measurement of CEO Compensation
Consistent with prior research (e.g., Lambert and Larcker, 1987), we use the loga-rithm of cash compensation as the primary dependent variable for our empirical
DAVILA AND VENKATACHALAM450

analysis. We also examine a broader definition of compensation to include the valueof options granted during the year, and define total compensation as the sum of allcash and option-based compensation. As with cash compensation, both the optionand total compensation are represented in logarithmic transformation.We define cash compensation as the sum of salary, bonus, and other compensa-
tion.6 We separately estimate the value of the options granted during the year usingthe Black–Scholes formula assuming that the options are held 70% of the option’sstated maturity (Huddart, 1994; Cuny and Jorion, 1995). The inputs needed toestimate the option compensation such as the number of options granted, exerciseprice, dividends, and time to maturity are obtained from the proxy statements andCompustat. We estimate volatility as the square root of the sample variance of daily
Table 1. Sample firms.
Firm Name
1 Air Midwest
2 Air Wisconsin Services Inc.
3 Airtran Holdings
4 Airways Corp
5 Alaska Airgroup
6 America West Holdings Co.
7 AMR Corp
8 ASA Holding Ltd
9 Atlantic Coast Airlines
10 CCAIR
11 Comair Holdings Inc
12 Conquest Airlines Corp
13 Continental Airlines Inc
14 Delta Air Lines Inc
15 Frontier Airlines Inc
16 Great Lakes Aviation
17 HAL Inc
18 Hawaiian Airlines Inc
19 Mesa Air Group
20 Mesaba Holdings Inc
21 Metro Airlines Inc
22 Midway Airlines Corp
23 Northwest Airlines Corp
24 Pan Am Corp
25 Pan Am Corp FLA
26 Reno Air
27 Skywest
28 Southwest Airlines Co
29 Stateswest Airlines Inc
30 Tower Air Inc
31 UAL Corp
32 USAIR Group Inc
33 Vanguard Airlines
34 Westair Holding Inc
35 Western Pacific Airlines
THE RELEVANCE OF NON-FINANCIAL PERFORMANCE MEASURES FOR CEO COMPENSATION 451

stock returns during the 120 trading days before the end of the fiscal year multipliedby 254 trading days of a typical year. Because stock option awards are grantedthroughout the year we consider that stock option grants in the first half of the yearrelates to reward for previous year’s performance. Therefore, we classify optionsgranted in the first half of the fiscal year as compensation for the previous year andthose granted in the second half as compensation for the current year.7
3.2.2. Measurement of Passenger Load Factor, Financial Performance Measures andOther Determinants of CEO Compensation
We measure passenger load factor (Plf) as the number of passenger-miles (i.e., thetotal number of miles flown by all passengers) divided by the total number of seatmiles available. Like prior research (Lambert and Larker, 1987; Sloan, 1993), weconsider two financial performance measures: (i) the natural logarithm of (1+ fiscalyear stock return) (LnRet) and (ii) accounting return on assets (Roa). We computereturn on assets (Roa) as income before extraordinary items scaled by total assets.We use the natural logarithm of sales as the proxy for size (LnSales), and we usebook-to-market (Bm) to capture growth opportunities.8
We use the volatility measure used in the computation of Black Scholes optionvalue (Vol) as our proxy for firm risk. From the proxy statements we obtain thepercentage of outstanding shares held by the CEO and use that as our measure ofCEO ownership (CEOown). We measure CEO tenure (Tenure) as the number ofyears the CEO has been in that position at the end of the fiscal year.
3.3. Descriptive Statistics
Panel A of Table 2 presents the descriptive statistics for components of CEO com-pensation. The median cash compensation is $464,000 and the median stock optioncompensation is $37,000.9 At the median, stock options represent about 6% of CEOcompensation. However, more than 25% of the CEOs in our sample do not receivestock options. Excluding these firms the proportion of CEO compensation fromstock options is close to 53%. The percentage of bonus to salary for our sample (62%at the mean) is comparable to traditional firms.10
Panel B reports the descriptive statistics for passenger load factor and proxies forvarious economic determinants of CEO compensation. Stock returns have a mean of20% with a minimum of -81% and a maximum of 447%. The mean for CEO’s stockownership is 5% (median 1%) with a maximum of 80%. This percentage is somewhathigher than those reported by prior research. For example, Core et al. (1999) reportan average ownership of 1.5% (median of 0.8%) and Yermack (1995) reports a meanof 2.41% (median of 0.14%).Table 3 provides the correlation matrix for all the regression variables used in this
study. Note that we present correlation statistics using logarithmic transformation ofcompensation variables to be consistent with the variables used in the empirical
DAVILA AND VENKATACHALAM452

specification. Consistent with previous research, we find that accounting (Roa) andfinancial (Lnret) performance measures are positively related to both cash andoption compensation. Of particular importance, passenger load factor (Plf) is sig-nificantly correlated with cash compensation (Pearson correlation of 0.54) but notwith option compensation. Thus, based on univariate analysis, it appears that pas-senger load factor is relevant primarily for CEO cash compensation. Whether pas-senger load factor provides incremental information to accounting and financialperformance measures is examined next.
4. Results
In this section, we present the results relating CEO compensation to passenger loadfactor after controlling for financial performance measures. First, we consider alevels specification where we examine the association between the level of CEOcompensation and the level of performance measures. To control for potential
Table 2. Descriptive statistics.
Panel A: Descriptive Statistics for CEO Compensation (N = 246)
(in thousands of $) Mean Std Dev. Min Q1 Median Q3 Max
Salary 368 223 1 180 318 500 1139
Bonus 227 531 0 0 23 264 6390
Other 74 560 0 0 0 14 7478
Cshcomp 669 880 7 231 464 770 8153
Optcomp 1162 3244 0 0 37 887 26614
Totcomp 1831 3501 7 354 675 1695 28356
Panel B: Descriptive Statistics for Independent Variables
Mean Std Dev. Min Q1 Median Q3 Max
Ret 0.20 0.72 )0.81 )0.23 0.04 0.48 4.47
Plf 0.59 0.10 0.35 0.51 0.61 0.67 0.80
CEOown 0.05 0.14 0.00 0.00 0.01 0.04 0.80
Sales ($ mil.) 3722.88 5300.77 5.57 188.14 473.20 6686.41 19703.00
Roa 0.02 0.20 )1.27 )0.02 0.04 0.07 1.04
Tenure (years) 7.69 6.15 0.00 3.00 6.00 11.00 25.00
Vol 0.56 0.27 0.19 0.38 0.51 0.86 1.82
Bm 0.49 0.63 )4.27 0.23 0.46 0.82 3.61
Cshcomp represents total cash compensation, i.e., salary plus bonus plus other. Optcomp represents stock
option compensation. Totcomp is the sum of cash and stock options compensation.
Ret represents stock returns, estimated as the holding period return for the fiscal year. Plf is number of
passenger miles flown divided by total available mile seats. CEOown is the percentage of the company
stock owned by the CEO at the end of the fiscal year. Roa represents return on assets determined as income
before extraordinary items divided by total assets at the end of the fiscal year. Tenure is the number of
years between the appointment of the CEO and the end of the fiscal year. Vol is the standard deviation of
returns for 120 trading days before the end of the fiscal year times the square root of 254 trading days in a
typical year. Bm is book to market ratio.
THE RELEVANCE OF NON-FINANCIAL PERFORMANCE MEASURES FOR CEO COMPENSATION 453

Table
3.Correlationstatistics.
LnCshcomp
LnOptcomp
LnTotcomp
LnSales
LnRet
Roa
Plf
CEOown
Tenure
Vol
Bm
LnCshcomp
0.28
0.75
0.74
0.18
0.14
0.54
)0.39
)0.03
)0.35
0.03
(0.00)
(0.00)
(0.00)
(0.00)
(0.03)
(0.00)
(0.00)
(0.62)
(0.00)
(0.68)
LnOptcomp
0.33
0.71
0.21
0.19
0.14
0.09
)0.25
)0.11
)0.21
0.10
(0.00)
(0.00)
(0.00)
(0.00)
(0.03)
(0.12)
(0.00)
(0.08)
(0.00)
(0.10)
LnTotcomp
0.80
0.76
0.64
0.18
0.17
0.46
)0.40
)0.14
)0.31
0.06
(0.00)
(0.00)
(0.00)
(0.00)
(0.01)
(0.00)
(0.00)
(0.02)
(0.00)
(0.31)
LnSales
0.81
0.27
0.67
0.12
0.11
0.70
)0.31
)0.15
)0.47
0.04
(0.00)
(0.00)
(0.00)
(0.07)
(0.07)
(0.00)
(0.00)
(0.02)
(0.00)
(0.56)
LnRet
0.20
0.18
0.21
0.09
0.24
0.01
)0.20
0.04
)0.37
)0.12
(0.00)
(0.00)
(0.00)
(0.18)
(0.00)
(0.84)
(0.00)
0.51
(0.00)
(0.05)
Roa
0.20
0.21
0.23
0.02
0.35
0.08
0.06
0.06
)0.17
0.23
(0.00)
(0.00)
(0.00)
(0.74)
(0.00)
(0.19)
(0.31)
(0.32)
(0.01)
(0.00)
Plf
0.59
0.15
0.48
0.71
)0.01
0.00
)0.23
)0.35
)0.22
0.02
(0.00)
(0.02)
(0.00)
(0.00)
(0.82)
(0.96)
(0.00)
(0.00)
(0.00)
(0.76)
CEOown
)0.48
)0.22
)0.44
)0.62
)0.11
0.09
)0.47
0.28
0.39
0.09
(0.00)
(0.00)
(0.00)
(0.00)
(0.10)
(0.14)
(0.00)
(0.00)
(0.00)
(0.18)
Tenure
0.04
)0.15
)0.09
)0.07
0.05
0.17
)0.29
0.21
0.05
0.10
(0.56)
(0.02)
(0.09)
(0.25)
(0.40)
(0.00)
(0.00)
(0.00)
(0.41)
(0.13)
Vol
)0.40
)0.16
)0.31
)0.55
)0.27
)0.12
)0.26
0.40
)0.04
)0.08
(0.00)
(0.01)
(0.00)
(0.00)
(0.00)
(0.05)
(0.00)
(0.00)
(0.51)
(0.24)
Bm
0.09
0.13
0.11
0.18
)0.23
)0.00
0.06
)0.14
0.09
)0.23
(0.15)
(0.04)
(0.09)
(0.00)
(0.00)
(0.97)
(0.35)
(0.03)
(0.16)
(0.00)
Pearsoncorrelationsreported
intheupper
triangle
andSpearm
ancorrelationsin
thelower
triangle.p-values
reported
inparenthesis(two-sided).Significant
p-values
atthe5%
level
are
highlightedin
bold.
LnCshcompisthelogarithm
ofthetotalCEO
cash
compensation.LnOptcompislogarithm
ofthestock
optioncompensation.LnTotcompislogarithm
ofthe
sum
ofcash
andstock
optionscompensation.LnSalesisthelogarithm
ofsalesasaproxyforfirm
size.LnRet
isthelogarithm
ofthe1plustheholdingperiod
return
forthefiscalyear.Roaisthereturn
onassetsforthefiscalyearcalculatedasincomebefore
extraordinary
times
divided
bytotalassets.Plfisnumber
of
passenger
miles
flowndivided
bytotalavailablemileseats.CEOownisthepercentageofsharesheldbytheCEO
attheendofthefiscalyear.Tenure
isthetime
inyears
from
theappointm
entasCEO
andtheendofthefiscalyear.Volisthestandard
deviationofdailystock
returnsfor120daysbefore
theendofthe
fiscalyeartimes
thesquare
rootof254tradingdaysin
ayear.Bm
isbookto
market
ratio.
DAVILA AND VENKATACHALAM454

omitted variables, we control for other determinants of CEO compensation. Spe-cifically, we estimate the following empirical specification:
LnCshcomp; LnOptcomp; LnTotcomp ¼ b1 þ b2�Plf þ b3
�LnRet þ b4�Roa
þ b5�LnSalesþ b6
�Volþ b7�CEOown
þ b8�Tenureþ b9
�Bmþ e ð3Þ
where LnCshcomp, LnOptcomp, LnTotcomp represents the natural logarithm of cash,option, and total compensation, respectively. The theoretical discussion indicatesthat the sign for the passenger load factor (Plf) coefficient is expected to be positivefor cash compensation. For option compensation, however, we do not have a signprediction because options may be used to reward long-term performance as well ascurrent operational performance. Consequently, with respect to total compensation,although the predicted relation is positive, the power of tests is likely lower. LnRetand Roa proxy for stock and accounting measures of performance; both are expectedto be positive.11 LnSales controls for size, and is also predicted to be positive. Basedon the discussion in Section 2, we predict the coefficient on Vol and Tenure to bepositive and that of Bm to be negative.12 In estimating the regression specifications,we eliminate observations with studentized residuals greater than two to control foroutlier observations.Table 4 reports the results of estimating equation (3). We find that CEOs of
larger firms (as proxied by LnSales) have higher compensation; we also find thatstock performance is significantly related to compensation. In contrast, accountingmeasures of performance, Roa, is not significantly related to any of the compen-sation measures. The coefficient on our proxy for non-financial performancemeasure, passenger load factor (Plf), is positive (coefficient ¼ 1.83) and significant(t ¼ 4.01; p < 0.01) for cash compensation, consistent with the predictions. Inaddition, the inclusion of passenger load factor increases the explanatory power ofthe model by 10%. An economic interpretation of our findings is that a 10%increase in Plf (one standard deviation) at the mean translates into an additional$134,000 in cash compensation.13 The coefficient is negative (although not signifi-cant) for option compensation consistent with option compensation being associ-ated with long-term incentives rather than being used to reward currentperformance.14 The coefficient on Plf is positive but not significant for totalcompensation.Broadly, our evidence is consistent with our hypothesis that non-financial per-
formance measures are relevant to contracting, especially in determining cashcompensation. Moreover, the significance of passenger load factor to cash com-pensation is consistent with current performance being rewarded with the cashcomponent of compensation. This also highlights the importance of examining therelation between passenger load factor and the two components of compensationseparately.The coefficient on the percentage of ownership held by the CEO (CEOown) is
negative and significant, consistent with the agency theory argument that CEOs with
THE RELEVANCE OF NON-FINANCIAL PERFORMANCE MEASURES FOR CEO COMPENSATION 455

lower ownership require stronger incentives and, accordingly higher levels of com-pensation. Tenure is positively associated with both cash and total compensation,consistent with CEO power being translated in higher compensation. However, thisvariable is not related to option compensation. Finally larger book-to-market (Bm)is associated with higher option compensation. While this latter result is againstexpectations, it is consistent with options being granted to motivate improvements inperformance for companies that are under-performing (high book-to-market ratio).While we have attempted to control for potential omitted variables in the levels
specification in equation (3), it may still suffer from coefficient biases due to un-known correlated omitted variables.15 Hence, as an alternative test of the relevanceof non-financial measures in CEO compensation we use a ‘‘change’’ specification ofequation (3) described below:
Table 4. Regression results relating the level of CEO compensation with passenger load factor after
controlling for financial performance measures.
Dependent Variable
Independent Variables Predicted Sign LnCshcomp (1) LnOptcomp (2) LnTotcomp (3)
Plf +/?/+ 1.83** )5.00 1.04
(4.01) ()1.56) (1.24)
LnRet + 0.19** 1.33** 0.35**
(3.13) (3.05) (3.17)
Roa + 0.19 0.48 0.29
(1.27) (0.44) (1.04)
LnSales + 0.25** 0.43** 0.35**
(13.07) (2.53) (7.76)
Vol + 0.13 1.49 0.57*
(0.91) (1.46) (2.17)
CEOown ? )0.94** )5.72** )1.90**
()3.49) ()3.18) ()3.83)Tenure + 0.02** 0.02 0.02*
(3.98) (0.57) (2.09)
Bm ) 0.005 0.75* 0.11
(0.10) (2.12) (1.23)
Adjusted R2 (%) 69.29% 11.02% 49.95%
t-statistics (presented in parenthesis) are based on white-adjusted standard errors. Regressions are
estimated after removing outliers with a R-student value above 2. **, * indicate significance at the 1 and 5%
level respectively (one-tailed when the coefficient sign is predicted, two-tailed otherwise).
LnCshcomp is the logarithm of the total CEO cash compensation. LnOptcomp is logarithm of the stock
option compensation. LnTotcomp is logarithm of the sum of cash and stock options compensation.
LnSales is the logarithm of sales as a proxy for firm size. LnRet is the logarithm of the 1 plus the stock
returns for the fiscal year. Roa is the return on assets for the fiscal year calculated as income before
extraordinary times divided by total assets. Plf is number of passenger miles flown divided by total
available mile seats. CEOown is the percentage of shares held by the CEO held at the end of the fiscal year.
Tenure is the time in years from the appointment as CEO and the end of the fiscal year. Vol is the standard
deviation of daily returns for 120 days before the end of the fiscal year times the square root of 254 trading
days in a year. Bm is book to market ratio.
DAVILA AND VENKATACHALAM456
DLnCshcomp; DLnOptcomp; DLnTotcomp ¼ b1 þ b2�DPlf þ b3
�DLnRet
þ b4�DRoaþ b5
�DLnSales
þ b6�DVolþ b7
�DCEOown
þ b9�DBmþ e ð4Þ
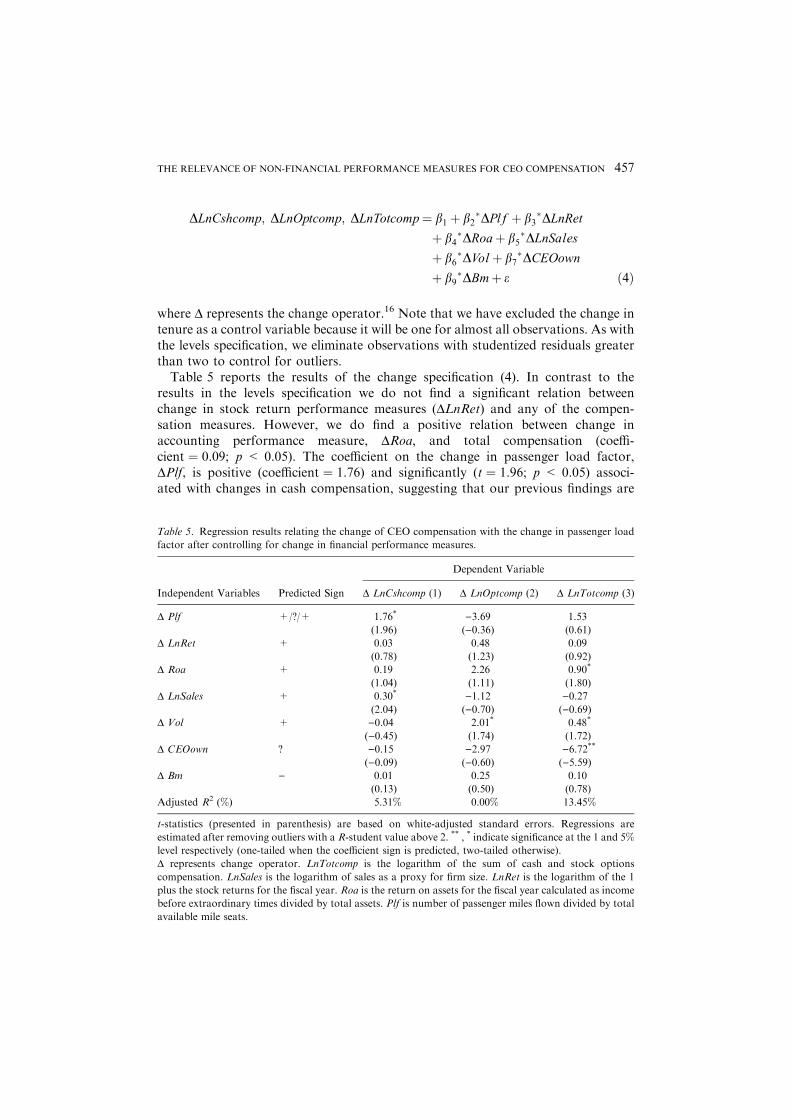
where D represents the change operator.16 Note that we have excluded the change intenure as a control variable because it will be one for almost all observations. As withthe levels specification, we eliminate observations with studentized residuals greaterthan two to control for outliers.Table 5 reports the results of the change specification (4). In contrast to the
results in the levels specification we do not find a significant relation betweenchange in stock return performance measures (DLnRet) and any of the compen-sation measures. However, we do find a positive relation between change inaccounting performance measure, DRoa, and total compensation (coeffi-cient ¼ 0.09; p < 0.05). The coefficient on the change in passenger load factor,DPlf, is positive (coefficient ¼ 1.76) and significantly (t ¼ 1.96; p < 0.05) associ-ated with changes in cash compensation, suggesting that our previous findings are
Table 5. Regression results relating the change of CEO compensation with the change in passenger load
factor after controlling for change in financial performance measures.
Dependent Variable
Independent Variables Predicted Sign D LnCshcomp (1) D LnOptcomp (2) D LnTotcomp (3)
D Plf +/?/+ 1.76* )3.69 1.53
(1.96) ()0.36) (0.61)
D LnRet + 0.03 0.48 0.09
(0.78) (1.23) (0.92)
D Roa + 0.19 2.26 0.90*
(1.04) (1.11) (1.80)
D LnSales + 0.30* )1.12 )0.27(2.04) ()0.70) ()0.69)
D Vol + )0.04 2.01* 0.48*
()0.45) (1.74) (1.72)
D CEOown ? )0.15 )2.97 )6.72**
()0.09) ()0.60) ()5.59)D Bm ) 0.01 0.25 0.10
(0.13) (0.50) (0.78)
Adjusted R2 (%) 5.31% 0.00% 13.45%
t-statistics (presented in parenthesis) are based on white-adjusted standard errors. Regressions are
estimated after removing outliers with a R-student value above 2. ** , * indicate significance at the 1 and 5%level respectively (one-tailed when the coefficient sign is predicted, two-tailed otherwise).
D represents change operator. LnTotcomp is the logarithm of the sum of cash and stock options
compensation. LnSales is the logarithm of sales as a proxy for firm size. LnRet is the logarithm of the 1
plus the stock returns for the fiscal year. Roa is the return on assets for the fiscal year calculated as income
before extraordinary times divided by total assets. Plf is number of passenger miles flown divided by total
available mile seats.
THE RELEVANCE OF NON-FINANCIAL PERFORMANCE MEASURES FOR CEO COMPENSATION 457

robust to this alternative specification. We also find that the coefficient forchanges in passenger load factor is positive, but not significant for total com-pensation consistent with the power of the test being lower for this specificationcompared to the cash specification. However, as before, we do not find a sig-nificant relation between change in passenger load factor and option compensa-tion (coefficient ¼ )3.69; t ¼ )0.36). Hence, we do not find support for thehypothesis that option compensation being used to reward either current per-formance with respect to capacity utilization or motivate long-term improvementsin capacity utilization.
5. Additional Analyses
Our main hypothesis predicts a positive association between non-financial perfor-mance measures and CEO compensation. However, existing theory allows extendingthis hypothesis to explore cross-sectional differences in this association. We considertwo important factors that are hypothesized to affect the importance of non-financialperformance measures: (i) noise in other performance measures (Noise hypothesis)and, (ii) the extent of CEO power (Influence hypothesis). We explore thesehypotheses below.Theory (e.g., Banker and Datar, 1989) suggests that the relative weight placed on a
performance measure in compensation contracts is influenced by the noise inherentin that measure. In particular, the relative weight on a performance measure is adecreasing function of the noisiness of that measure. Consistent with this theory,prior research by Lambert and Larcker (1987) documents that the relative weight onaccounting (market-based) performance measure is positively related to the noise inthe market-based (accounting) performance measure. In related work, Bushmanet al. (1996) find that noise in accounting and market-based performance measuresare positively associated with individual performance measures in compensationcontracts. More recently, Ittner et al. (1997) report a higher relative weight on non-financial measures in determining bonuses when the noise in stock returns is higher.Thus, we predict the weight on passenger load factor to increase with the noise infinancial performance measures (Noise hypothesis).Another variable that has been argued to affect the design of compensation
contracts is the power of the CEO. CEOs may attain power in various ways, andthus, influence their compensation. First, tenure may signal their ability and allowCEOs to leverage that signal to gain power (Core et al., 1999). Second, CEOs maygain power through their influence on the board of directors (Ittner et al., 1997), andin particular, if they also hold the chairperson of the board position (Boyd, 1994).Finally, CEO stock ownership as well as stock ownership of the executive team canprovide the CEO with additional power. Powerful CEOs will choose performancemeasures that they can influence more readily to increase their expected compen-sation.17 Thus, we predict that the weight on passenger load factor will increase withCEO power (Influence hypothesis).
DAVILA AND VENKATACHALAM458

To test the two hypotheses we interact Plf with proxies for noise in financialperformance measures and CEO power. We use the stock return volatility (Vol) asour proxy for noise in the stock return measure. As with prior research, we use CEOtenure (Tenure), CEO percentage stock ownership (CEOown), percentage of mem-bers of the board that are also executives at the company (Execbrd), stock ownershipby top managers (Insown), and whether the CEO is also chairperson of the board(CEOChair) to proxy for CEO power.Table 6 presents our empirical findings on the sensitivity of the weight on Plf to
noise and CEO power. We restrict this sensitivity analysis to cash compensationwhere previous results indicate that non-financial performance measures are asso-ciated with compensation. Consistent with our previous analyses we present a‘‘levels’’ as well as a ‘‘changes’’ specification.Column (1) reports results from the ‘‘levels’’ specification. The results are con-
sistent with our hypothesized predictions except for insider ownership, tenure andCEO ownership. We find that the interaction between Plf and volatility is positiveand significant (coefficient ¼ 2.77, t-statistic ¼ 2.10), indicating that for firm-yearswith higher stock return volatility, the association between cash compensation andpassenger load factor is higher. This is consistent with non-financial performancemeasure receiving higher ‘‘weight’’ when financial measures (stock returns, in par-ticular) are noisier (Noise hypothesis). We also find that two out of the five proxiesfor CEO power are positive and statistically significant. Specifically, for firms withhigher proportion of board members who are also executives of the firm the asso-ciation between the level of cash compensation and passenger load factor is higher.The same is true with respect to situations where the CEO is also the chairperson ofthe board. These results are broadly consistent with the ‘‘Influence hypothesis’’ thatthe weight on non-financial performance measures is higher when the CEO hassignificant power over the board.Notice that the coefficient on Plf is positive but statistically insignificant (coef-
ficient ¼ 0.54, t ¼ 0.58). This is not surprising because the coefficient on Plf thatrepresents the main effect becomes ambiguous when we include the interactionterms. That is, the coefficient on Plf now captures the weight on Plf for a firmwhere the proxies for the noise and the influence hypotheses are zero. Thus, todetermine the net effect of Plf on CEO compensation we have to combine both themain effect and the interaction effects. By substituting the mean values for thevarious proxies it is easy to show that the combined effect of Plf on CEO com-pensation is positive.Column (2) reports results from the ‘‘changes’’ specification. In contrast to the
levels specification, we do not find significant coefficients on the interaction termsexcept for the CEO ownership interaction. Even with respect to CEO ownershipinteraction, the coefficient is weakly significant. Nevertheless, the main effect ofpassenger load factor, i.e., the coefficient on DPlf is significantly positive (t ¼ 4.00).Thus, collectively, we view the evidence in Table 6 as providing weak support forboth the Noise and the Influence hypotheses.
THE RELEVANCE OF NON-FINANCIAL PERFORMANCE MEASURES FOR CEO COMPENSATION 459

Table 6. Regression results of cross-sectional differences in the relation between CEO compensation and
passenger load factor.
Independent Predicted
Dependent
Variable Independent Predicted
Dependent
Variable
Variables Sign LnCshcomp (1) Variables Sign D LnCshcomp (2)
Plf + 0.54 D Plf + 15.81**
(0.58) (4.00)
LnRet + 0.16** D LnRet + 0.03
(2.73) (0.93)
Roa + 0.26* D Roa + 0.31*
(1.76) (1.66)
LnSales + 0.26** D LnSales + 0.41**
(9.43) (2.65)
Vol + )1.38 D Vol + 0.06
()1.83) (0.56)
CEOown ? )1.58 D CEOown ? )0.47()0.59) ()0.29)
Tenure + 0.10**
(3.21)
Bm ) )0.03 D Bm ) )0.01()0.63) ()0.32)
Plf*Vol + 2.77* D Plf *Vol + )5.53(2.10) ()2.41)
Plf*Tenure + )0.13 D Plf *Tenure + )0.26()2.46) ()1.62)
Plf*CEOown + 0.63 D Plf *CEOown + 14.37
(0.12) (1.28)
Plf*Execbrd + 1.04** D Plf *Execbrd + )8.38(2.90) ()1.41)
Plf*Insown + 0.48 D Plf *Insown + )11.98(1.37) ()1.86)
Plf*CEOchair + 0.35* D Plf *CEOchair + )4.72(2.33) ()1.41)
Adjusted R2 (%) 72.63 % 10.38%
t-statistics (presented in parenthesis) are based on white-adjusted standard errors. Regressions are
estimated after removing outliers with a R-student value above 2. ** , * indicate significance at the 1 and 5%
level respectively (one-tailed when the coefficient sign is predicted, two-tailed otherwise).
D represents change operator. LnCshcomp is the logarithm of the total CEO cash compensation. LnSales is
the logarithm of sales as a proxy for firm size. LnRet is the logarithm of the 1 plus the stock returns for the
fiscal year. Roa is the return on assets for the fiscal year calculated as income before extraordinary times
divided by total assets. Plf is number of passenger miles flown divided by total available mile seats.
CEOown is the percentage of shares held by the CEO held at the end of the fiscal year. Tenure is the time in
years from the appointment as CEO and the end of the fiscal year. Vol is the standard deviation of daily
returns for 120 days before the end of the fiscal year times the square root of 254 trading days in a year. Bm
is book to market ratio. Execbrd is the percentage of executives in the board of directors. Insown is the
percentage ownership by executives and directors. CEOchair is a dummy variable that takes value of one if
the CEO also chairs the board, zero otherwise.
DAVILA AND VENKATACHALAM460

6. Conclusions
This paper investigates the role of non-financial performance measures in CEO com-pensation. Focusing on one industry, the airline industry, where a specific non-finan-cial performance measure, passenger load factor, is critical to a firm’s success providesa unique setting to examine this research question. We use a research design that testspredictions from agency theory on the relevance of non-financial measures, regardlessof whether such information is explicitly or implicitly used in contracting. Thus, ourstudy extends past research that focused on the cross-sectional variation of the relativeweight of non-financial measures for companies that explicitly disclose their use.We find that passenger load factor is positively associated with CEO compensa-
tion in support of the hypothesis that non-financial measures have incrementalinformation content about managers’ actions beyond accounting and market-basedperformance measures. Also consistent with agency theory, we find that the asso-ciation between the level of cash compensation and passenger load factor isenhanced when the noise inherent in the stock returns measure increases. We alsofind evidence that the weight on passenger load factor increases with CEO power.However, the evidence on cross-sectional differences in the relation between pas-senger load factor and compensation obtains only in the levels specification.The study is subject to two caveats. First, the sample is limited to one industry and
a specific non-financial performance measure. This limits the generalizability of ourfindings to other industries and a broader set of non-financial performance measures.Second, we merely document an association between non-financial performancemeasures and compensation. Thus, our evidence does not imply that these measuresare actually used in compensation contracts. In other words, we cannot completelyrule out the possibility that our proxy for non-financial performance measures iscorrelated with other subjective measures that are used in compensation contracts.Finally, our study examines a time period when financial performance of airlinefirms was relatively stable. In recent times, however, several airline firms haveexperienced severe financial distress. It is plausible that the weight placed on non-financial performance measures is a function of the level of financial performancemeasures. Examining whether the weight placed on non-financial performancemeasures for executive compensation is influenced by financial distress is an inter-esting question for future research.
Acknowledgments
We thank Rick Lambert (the editor), Dave Larcker, Stephen Penman, MadhavRajan, Shivaram Rajgopal, Stefan Reichelstein, an anonymous referee and work-shop participants at the 2002 Stanford Accounting Summer camp for helpful com-ments and suggestions. We also thank Nicole Bastian, Jiangyun Liu, PilarParmigiani, and Qian Wang for research assistance. We appreciate funding from theGraduate School of Business, Stanford University and Fuqua School of Business,Duke University.
THE RELEVANCE OF NON-FINANCIAL PERFORMANCE MEASURES FOR CEO COMPENSATION 461

Notes
1. In related work, Bushman et al. (1996) use survey data to document the importance of individual
performance evaluation of CEOs’ actions in explaining their compensation. Arguably, individual
performance evaluation could be based on non-financial performance measures. But, Bushman
et al. (1996) find that for most of their sample firms it was ‘‘difficult to classify in a systematic
fashion, reporting a complex variety of non-financial and qualitative performance measures, and
sometimes vague references to the use of discretion and subjectivity in determining awards.’’
(p. 171)
2. In contemporaneous work, Srinivasan et al. (2002) examine the relevance of non-financial measures in
top management compensation for firms in the airline industry. Our paper is distinct from theirs in
two respects. First, they focus on a different set of performance measures such as customer
satisfaction, number of mishandled bags, and number of complaints. Their results indicate that only
one measure, mishandled baggage, is associated with CEO compensation. It is unlikely that
mishandled baggage is correlated with passenger load factor because they capture different attributes
of performance. Hence, both performance measures can coexist in contracting. Second, they consider
only a levels specification whereas we consider both a levels and a changes specification.
3. For example, Reno Air in its 1998 10-K states: ‘‘The Company’s business is characterized, as is true
for the airline industry generally, by high fixed costs relative to revenues and low profit margins. A
slight change in fare levels or load factors can have a substantial impact on the Company’s revenues.
(…) In addition, the Company’s business is highly sensitive to general economic conditions. Any
reduction in airline passenger traffic (whether general or specific to the Company) may materially and
adversely affect the Company’s financial position’’ (emphasis added).
4. Typically, increased capacity utilization is associated with better economic performance. Note that if
capacity utilization is close to 100%, the airline may be forgoing existing demand that it cannot satisfy
with the existing airplanes. The average capacity utilization for our sample is 61.5%, a point where
additional capacity utilization is considered to improve performance.
5. Lambert and Larcker (1987) run firm-specific time series regressions that do not suffer from the
omitted variable problem.
6. Other compensation usually includes rent payments or moving expenses covered by the firm.
Inferences are unchanged if other compensation is excluded in our variable definitions.
7. The timing within the year of the option grants is based on the expiration date of the options granted
as reported in the proxy statements.
8. We include the logarithm of market value of equity both as an alternative and an additional proxy for
size and our inferences are unaltered. We also include return on equity as an alternative accounting
measure; inferences are unaltered.
9. We focus our discussion on the median rather than the mean because given the underlying distribution
the median is more informative as a descriptive statistic.
10. For example, statistics in Bushman et al. (1996) suggest a ratio close to 50%.
11. We do not use the logarithmic transformation of Roa because of the significant number of negative
Roas in the sample (see Table 2). Also, our inferences are unaffected by using the logarithmic
transformation of Plf.
12. Note that Bm captures the inverse of growth opportunities and hence, the relation between
compensation and Bm is predicted to be negative.
13. The impact of the 10% change is estimated as the change from the mean of cash compensation when
Plf increases 10% from its mean. The impact of a standard deviation change in returns over total
compensation is estimated at $468,000.
14. We also run a Tobit specification when the dependent variable is option compensation because for a
significant number of observations, the option compensation is zero. Inferences are unaltered.
Alternatively, we estimated the specification with observations that have non-zero option compen-
sation and find that the coefficient on passenger load factor is positive and statistically significant.
DAVILA AND VENKATACHALAM462

15. We also examine whether passenger load factor is related to compensation after including an
accounting measure of capacity utilization, viz., sales turnover. Our results (unreported) suggest that
passenger load factor continues to be positively related to compensation.
16. Our inferences are unaltered when we estimate equation (4) excluding the control variables.
17. An alternative view is that CEOs can manipulate rather than influence non-financial performance
measures (Ittner et al., 1997).
References
Baiman, S. and R. E. Verrecchia. (1995). ‘‘Earnings and Price-based Compensation Contracts in the
Presence of Discretionary Trading and Incomplete Contracting.’’ Journal of Accounting and Economics
20, 93–121.
Banker, R. D. and S. M. Datar. (1989). ‘‘Sensitivity, Precision, and Linear Aggregation of Signals for
Performance Evaluation.’’ Journal of Accounting Research 27, 21–39.
Banker, R. D., G. Potter and D. Srinivasan. (2000). ‘‘An Empirical Investigation of an Incentive Plan that
Includes Non-financial Performance Measures.’’ The Accounting Review 75, 65–92.
Behn, B. K. and R. A. Riley. (1999). ‘‘Using Non-financial Information to Predict Financial Performance:
The Case of the U.S. Airline Industry.’’ Journal of Accounting, Auditing and Finance 14, 29–56.
Boyd, B. (1994). ‘‘Board Control and CEO Compensation.’’ Strategic Management Journal 15, 335–344.
Bushman, R. M. and R. J. Indjejikian. (1993). ‘‘Accounting Income, Stock Price, and Managerial
Compensation.’’ Journal of Accounting and Economics 16, 3–23.
Bushman, R. M., R. J. Indjejikian and A. Smith. (1996). ‘‘CEO Compensation: The Role of Individual
Performance Evaluation.’’ Journal of Accounting and Economics 21, 161–193.
Core, J. E., W. Guay and R. Verrechia. (2003). ‘‘Price Versus Non-price Performance Measures in
Optimal CEO Compensation Contracts.’’ The Accounting Review 78, 957–981.
Core, J. E., R. W. Holthausen and D. F. Larcker. (1999). ‘‘Corporate Governance, Chief Executive Officer
Compensation, and Firm Performance.’’ Journal of Financial Economics 51, 371–406.
Cuny, C and P. Jorion. (1995). ‘‘Valuing Executive Stock Options with a Departure Decision.’’ Journal of
Accounting and Economics 20, 193–205.
Datar, S., S. Kulp and R. A. Lambert. (2001). ‘‘Balancing Performance Measures.’’ Journal of Accounting
Research 39, 75–93.
Feltham, G. A. and M. Wu. (1999). ‘‘Public Reports, Information Acquisition by Investors, and Mana-
gement Incentives.’’ Review of Accounting Studies 5, 155–190.
Feltham, G. A. and J. Xie. (1994). ‘‘Performance Measure Congruity and Diversity in Multi-task Prin-
cipal/Agent Relations.’’ The Accounting Review 69, 429–453.
Francis, J., K. Schipper and L. Vincent. (2003). ‘‘The Relative and Incremental Explanatory Power of
Earnings and Alternative (to Earnings) Performance Measures for Returns.’’ Contemporary Accounting
Research 20, 121–164.
Holderness, C. and D. Sheehan. (1988). ‘‘The Role of Majority Shareholders in Publicly-held Corporat-
ions: An Exploratory Analysis.’’ Journal of Financial Economics 20, 317–346.
Holmstrom, B. (1979). ‘‘Moral Hazard and Observability.’’ Bell Journal of Economics 10, 74–91.
Huddart, S. (1994). ‘‘Employee Stock Options.’’ Journal of Accounting and Economics 18, 207–231.
Ittner, C. D., D. F. Larcker and M. V. Rajan. (1997). ‘‘The Choice of Performance Measures in Annual
Bonus Contracts.’’ The Accounting Review 72, 231–255.
Janakiraman, S. N. (1992). ‘‘An Empirical Investigation of the Relative Performance Evaluation Hypo-
thesis.’’ Journal of Accounting Research 30, 53–70.
Jensen, M. C. and W. H. Meckling. (1976). ‘‘Theory of the Firm: Managerial behavior, Agency Costs and
Ownership Structure.’’ Journal of financial Economics 3, 305–360.
Kim, O. and Y. Suh. (1993). ‘‘Incentive Efficiency of Compensation Based on Accounting and Market
Performance.’’ Journal of Accounting and Economics 16, 25–54.
Lambert, R. and D. Larcker. (1987). ‘‘An Analysis of the Use of Accounting and Market Measures of
Performance in Executive Compensation Contracts.’’ Journal of Accounting Research 25, 85–129.
THE RELEVANCE OF NON-FINANCIAL PERFORMANCE MEASURES FOR CEO COMPENSATION 463

Murphy, K. J. (1985). ‘‘Corporate Performance and Managerial Remuneration: An Empirical Analysis.’’
Journal of Accounting and Economics 7, 11–43.
Murphy, K. J. (1998). ‘‘Executive Compensation.’’ Working paper, University of Southern California.
Nagar, V. and M. Rajan. (2001). ‘‘The Revenue Implications of Financial and Operational Measures of
Product Quality.’’ The Accounting Review 76, 495–513.
Rajgopal, S., T. Shevlin and M. Venkatachalam. (2003). ‘‘Does the Stock Market Fully Appreciate the
Implications of Leading Indicators for future Earnings? Evidence from Order Backlog.’’ Review of
Accounting Studies 8, 461–492.
Schefczyk, M. (1993). ‘‘Operational Performance of Airlines: An Extension of Traditional Measurement
Paradigms.’’ Strategic Management Journal 14, 301–317.
Sloan, R. (1993). ‘‘Accounting Earnings and Top Executive Compensation.’’ Journal of Accounting and
Economics 16, 55–100.
Smith, C. W. and R. L. Watts. (1992). ‘‘The Investment Opportunity Set and Corporate Financing,
Dividend and Financing Policies.’’ Journal of Financial Economics 32, 262–292.
Srinivasan, D., A. Sayrak and N. J. Nagarajan. (2002). ‘‘Executive Compensation and Non-financial
Performance Measures: A Study of the Incentive and Value Relevance of Mandated Non-financial
Disclosures in the U.S. Airline Industry.’’ Working paper, University of Pittsburgh.
Yermack, D. (1995). ‘‘Do Corporations Award CEO Stock Options Effectively?’’ Journal of Financial
Economics 39, 237–269.
DAVILA AND VENKATACHALAM464