THE RELATIONSHIP OF CHANGE READINESS AND WORK …
195
The Pennsylvania State University The Graduate School College of Education THE RELATIONSHIP OF CHANGE READINESS AND WORK ENGAGEMENT IN MANUFACTURING ORGANIZATIONS IN SOUTH-CENTRAL PENNSYLVANIA A Dissertation in Workforce Education and Development by Mary Jane Park 2015 Mary Jane Park Submitted in Partial Fulfillment of the Requirements for the Degree of Doctor of Philosophy December 2015
Transcript of THE RELATIONSHIP OF CHANGE READINESS AND WORK …

The Pennsylvania State University
The Graduate School
College of Education
THE RELATIONSHIP OF CHANGE READINESS AND
WORK ENGAGEMENT IN MANUFACTURING
ORGANIZATIONS IN SOUTH-CENTRAL PENNSYLVANIA
A Dissertation in
Workforce Education and Development
by
Mary Jane Park
2015 Mary Jane Park
Submitted in Partial Fulfillment
of the Requirements
for the Degree of
Doctor of Philosophy
December 2015

The dissertation of Mary Jane Park was reviewed and approved* by the following:
William J. Rothwell
Professor of Education
Dissertation Advisor
Chair of Committee
Judith A. Kolb
Associate Professor of Education
Wesley E. Donahue
Associate Professor of Management Development and Education
Edgar P. Yoder
Professor of Extension Education
Roy Clariana
Professor of Education
Director of Graduate Studies for Learning and Performance Systems
*Signatures are on file in the Graduate School

iii
ABSTRACT
Successful change efforts are critical to an organization’s strategy and growth
and, therefore, an understanding of how to best manage these change efforts is of interest
to innovative and forward-looking organizations. The goal of this study was to determine
if the employees’ level of work engagement was related to the organization’s level of
readiness for the change effort. As no empirical studies were found which examined this
relationship, this research adds to the existing literature on both topics.
To explore the multiple variables and inter-relationships posed in the four
research questions, a cross-sectional survey was conducted with a sample of
manufacturing employees in south-central Pennsylvania. Work engagement was
measured via the three subscales of vigor, dedication, and absorption of the nine item
Utrecht Work Engagement Scale (UWES-9). Organizational readiness for change was
measured with the reflexivity, and innovation and flexibility subscales of the
Organizational Climate Measure (OCM).
Methods to analyze the data included descriptive statistics, bivariate analyses, and
hierarchical multiple regression, factorial ANOVA, and coding of qualitative data. The
results of bivariate analyses demonstrate the moderate positive strength of the
relationship for the seven study variables. Therefore, this study provides the first
empirical evidence of the importance of employee work engagement to an organization’s
readiness for change and adds to the existing literature on both constructs.
Results of the hierarchical multiple regression analysis demonstrates (a)
dedication was the only work engagement variable with a significant influence in

iv
explaining differences in the change readiness scores of innovation and flexibility, and
(b) dedication and absorption had very similar influences in explaining score differences
in reflexivity. The importance of the employee’s dedication on an organization’s
readiness for change strengthened the significance of the moderate to strong correlation
measured between dedication and overall RFC.
Finally, three methods were used, including factorial ANOVA, to investigate the
influence of position and years in the organization on overall EWE, overall RFC, and the
subscales of each construct. Results demonstrate only an employee’s position is
significantly related to their overall level of engagement and the vigor, dedication, and
absorption with their work. However, no influence was found for position or years in the
organization on overall RFC, innovation and flexibility, or reflexivity.

v
TABLE OF CONTENTS
LIST OF FIGURES ..................................................................................................... viii
LIST OF TABLES ....................................................................................................... x
ACKNOWLEDGEMENTS ......................................................................................... xi
DEDICATION ............................................................................................................. xiv
Chapter 1 Problem ...................................................................................................... 1
Introduction ........................................................................................................... 1 Defining Engagement .................................................................................... 4
Defining Readiness for Change ..................................................................... 8 Purpose of Study ................................................................................................... 11
Significance of Study ............................................................................................ 12 Study Design ......................................................................................................... 13
Research Questions ....................................................................................... 14
Data Analysis ................................................................................................. 15
Chapter 2 Literature Review ....................................................................................... 18
Material Criteria .................................................................................................... 19
Employee Work Engagement ............................................................................... 20
Models of Employee Work Engagement ...................................................... 24 Assessing Employee Work Engagement ....................................................... 27
Maslach Burnout Inventory (MBI). ....................................................... 28 Utrecht Work Engagement Survey (UWES). ........................................ 29 Gallup’s Workplace Audit (Q
12). ........................................................... 30
Readiness for Change ........................................................................................... 31 Organizational Characteristics and Readiness for Change ............................ 33 Assessing Readiness for Change ................................................................... 39
Pasmore Sociotechnical Systems Assessment Survey (STSAS). .......... 40
Organizational Climate Measure (OCM). .............................................. 41 Competing Values Framework (CVF). .................................................. 44
Theory of Planned Behavior (TPB). ...................................................... 46 Additional Empirical Studies to Assess Readiness for Change .................... 48
Alas (2009). ............................................................................................ 48 Elgamal (2012). ...................................................................................... 50 Rafferty et al. (2013). ............................................................................. 51
Linking Work Engagement to Readiness for Change ................................... 53 Madsen, Miller, and John (2005). .......................................................... 54 Avey et al. (2008). .................................................................................. 54
Weiner (2009). ....................................................................................... 57

vi
Spreitzer et al. (2010). ............................................................................ 58 Harter, Schmidt, Agrawal, and Plowman (2013). .................................. 59
Ghitulescu (2013). .................................................................................. 60 Conclusion ............................................................................................................ 64
Chapter 3 Method ....................................................................................................... 67
Research Questions ............................................................................................... 67 Study Design ......................................................................................................... 68
Population and Sample .................................................................................. 70 Survey Response Rate. .................................................................................. 73
Potential Issues. ...................................................................................... 74 Strategies to Increase Response Rates.................................................... 75
Data Collection .............................................................................................. 80 Instrumentation. ............................................................................................. 82
Utrecht Work Engagement Scale (UWES). ........................................... 84 Organizational Climate Measure (OCM). .............................................. 85
Research Variables. ....................................................................................... 88 Data Analysis ................................................................................................. 90
Chapter 4 Results ........................................................................................................ 93
Instrumentation ..................................................................................................... 94 Response Rates and Survey Completion .............................................................. 96
Study Participant Profile ....................................................................................... 96 Descriptive Statistics for Employee Work Engagement (EWE) and Readiness
for Change (RFC) .......................................................................................... 101 Bivariate Correlations between Work Engagement and Readiness for Change ... 106
Hierarchical Multiple Regression Analysis of EWE, Personal and
Organizational Characteristics, and Readiness for Change ........................... 109 Work Engagement and Organizational Innovation and Flexibility. .............. 113
Work Engagement and Organizational Reflexivity. ..................................... 115 Additional Results ................................................................................................ 118
Factorial ANOVA – Years & Position on Total RFC and RFC Subscales. .. 118 Factorial ANOVA – Years & Position on Total EWE and EWE
Subscales. ............................................................................................... 121
Patterns in Work Engagement and Readiness for Change by Position or
Years in the Organization. ...................................................................... 126 The Influence of Years on Variable Means. .......................................... 126 The Influence of Position on Variable Means. ....................................... 129
Position and Years in Organization - Influence on Qualitative Responses. .. 132 Influences by Position. ........................................................................... 134
Resource Influences by Years Employed. .............................................. 137
Chapter 5 Summary, Conclusions, and Recommendations ........................................ 139

vii
Purpose ................................................................................................................. 139 Research Questions ............................................................................................... 140
Research Method .................................................................................................. 141 UWES-9 and OCM Instrumentation ............................................................. 141 Research Study Design .................................................................................. 143
Summary and Discussion of Results .................................................................... 145 Descriptive Statistics for Work Engagement (EWE) and Readiness for
Change (RFC) Research Variables ........................................................ 145 Bivariate Correlations between Work Engagement and Readiness for
Change .................................................................................................... 146 Hierarchical Multiple Regression Analysis of EWE, Personal and
Organizational Characteristics, and Readiness for Change.................... 148 Additional Results ......................................................................................... 150
Implications and Recommendations ..................................................................... 152 Implications for the Literature ....................................................................... 152
Madsen et al. (2005). .............................................................................. 153 Avey et al. (2008). .................................................................................. 153 Weiner (2009). ....................................................................................... 154
Spreitzer et al. (2010). ............................................................................ 155 Ghitulescu (2013). .................................................................................. 155
Implications and Recommendations for Organizations and OD
Practitioners ............................................................................................ 156 Limitations ............................................................................................................ 159
Recommendations for Future Research ................................................................ 160
References .................................................................................................................... 162
Appendix A Approval for Use of OCM Instrument .................................................... 174
Appendix B Approval for Use of JD-R Figure ............................................................ 175
Appendix C Research Instrument ................................................................................ 176
Appendix D Box Plots Reflecting the Normality of the Mean Score for Each
Research Variable ................................................................................................. 178
Appendix E IRB Approval for Human Subjects Research ......................................... 180

viii
LIST OF FIGURES
Figure 1: JD-R Model .................................................................................................. 7
Figure 2. Exploring the Relationships of Employee Work Engagement and
Organizational Readiness for Change and Each Respective Subscale ................. 15
Figure 3. Illustration of the hierarchical multiple regression analysis conducted
for RQ4 ................................................................................................................. 16
Figure 4. Competing Values Framework Model ......................................................... 37
Figure 5. Values-Based Change Management Model ................................................. 50
Figure 6. Multilevel Framework of the Antecedents and Consequences of
Readiness for Change. .......................................................................................... 52
Figure 7. Impact of Psychological Capital, Mindfulness, and Positive Emotions
on Attitudes and Behaviors Relevant to Positive Organizational Change ........... 56
Figure 8. Determinants and Outcomes of Organizational Readiness for Change. ...... 57
Figure 9. Adaptive and Proactive Behavior-the Impact on Change Management ...... 61
Figure 10. Distribution of Sample (n=171) by Position in the Organization. ............. 97
Figure 11. Distribution of Sample (n=171) by Years in the Organization. ................. 98
Figure 12. Categories of Organizational Change Experienced (n=171). .................... 99
Figure 13. Distribution of Sample (n=172) Active Involvement in a Change
Effort. .................................................................................................................... 100
Figure 14. Illustration of the bivariate analyses conducted for RQ1, RQ2, & RQ3 ... 106
Figure 15. The Correlations for RQ1, RQ2 and RQ3 significant at p < .01 ............... 109
Figure 16. Illustration of the hierarchical multiple regression analysis conducted
for RQ4 ................................................................................................................. 110
Figure 17. Interactive influence of position and years in organization on
Innovation & Flexibility. ...................................................................................... 119
Figure 18. Interactive influence of position and years in organization on
Reflexivity. ........................................................................................................... 120
Figure 19. Interactive influence of position and years in organization on Vigor. ....... 123

ix
Figure 20. Interactive influence of position and years in organization on
Dedication. ............................................................................................................ 123
Figure 21. Interactive influence of position and years in organization on
Absorption. ........................................................................................................... 124
Figure 22. Interactive influence of position and years in organization on Total
EWE. ..................................................................................................................... 124
Figure 23. Influence of Years in Organization on EWE and Subscales. ..................... 126
Figure 24. Influence of Years in Organization on RFC and Subscales. ...................... 128
Figure 25. Influence of Position in Organization on EWE and Subscales. ................. 130
Figure 26. Influence of Position in Organization on RFC and Subscales. .................. 131
Figure 27. Non-Managers - Influences on Desire to do Best Work. ........................... 135
Figure 28. First-level Supervisor - Influences on Desire to do Best Work. ................ 135
Figure 29. Executive - Influences on Desire to do Best Work. ................................... 136
Figure 30. Years of Employment- Influences on Desire to do Best Work.................. 137

x
LIST OF TABLES
Table 1. Popular OD Models to Guide Interventions ....................................................... 3
Table 2. Dillman et al. (2014) Response Rate Recommendations Applied ....................... 79
Table 3. Research Study Response Rates .......................................................................... 82
Table 4. Association of Research Variables to Instrument Items ...................................... 88
Table 5. Association of Research Questions to Instrument Items ..................................... 89
Table 6. Descriptive Statistics ........................................................................................... 102
Table 7. Distribution of EWE-related Responses for UWES-9 Statements ....................... 104
Table 8. Distribution of RFC-related Responses for OCM Statements ............................. 105
Table 9. Pearson Correlations Between Research Variables ........................................... 108
Table 10. Summary Descriptive Statistics for Interval Scale Variables used in
Regression Analysis. .................................................................................................. 111
Table 11. Frequency Distribution for Categorical Variables used in the Regression
Analysis. ..................................................................................................................... 111
Table 12. Zero-order-correlations for Innovation & Flexibility Regression Analysis
(n = 168). ................................................................................................................... 112
Table 13. Zero-order-correlations for Reflexivity Regression Analysis (n = 169). .......... 113
Table 14. Summary of Regression for Innovation and Flexibility. .................................... 115
Table 15. Summary of Regression for Reflexivity.............................................................. 117
Table 16. Descriptive Statistics for the RFC-related Factorial Analysis of Variance
Analysis for Current Position of the Respondent by Years in the Current
Organization. ............................................................................................................. 118
Table 17. Factorial Analysis of Variance Results. ............................................................ 120
Table 18. Descriptive Statistics for the EWE-related Factorial Analysis of Variance
Analysis for Current Position of the Respondent by Years in the Current
Organization. ............................................................................................................. 121
Table 19. Factorial Analysis of Variance Results. ............................................................ 125
Table 20. Correlation Results by Research Question........................................................ 147

xi
ACKNOWLEDGEMENTS
I would like to thank the following persons and organizations for their approvals,
assistance, and/or participation with this dissertation:
Penn State Doctoral Committee: Dr. William Rothwell (Advisor and Chair), Dr.
Judith Kolb, Dr. Wesley Donahue, and Dr. Edgar Yoder for their insight and expertise
throughout this dissertation process. Dr. Yoder was instrumental in the completion of this
dissertation as he provided his valuable time and statistical proficiency to supporting the
development of the methodology and evaluation of the results.
The Executive Director of The Manufacturers’ Association of South-Central
Pennsylvania (MA), Tom Palisin, for his gracious support for this research. The prior
Interim Director of MA, Jack Bardol, for considering and accepting my research proposal
and for allowing staff resources to be committed to the process; and the former MA
Marketing and Membership coordinator, for her work to champion this research idea
within the organization.
The various company Executives who permitted their employees to participate in
this research and committed resources to its implementation.
Approval for use of the Utrecht Work Engagement Survey (UWES) is not
required for non-commercial educational and research purposes. See details at
http://www.wilmarschaufeli.nl/downloads/test-manuals.
Approval for use of the Organizational Climate Measure (OCM) was received
from co-author Jeremy Dawson via email on January 14, 2014. This approval included
the use of instrument and edits to its spelling to American English. (Appendix A)

xii
Approval for use of Figure 1, JD-R Model was obtained from Dr. Bakker via
email on 6/6/14 and from Emerald Publishing on 6/9/14. (Appendix B)
Approval for use of Figure 3, Competing Values Framework. Per Wiley-
Blackwell’s Copyright Clearance Center RightsLink® permission is granted free of
charge for use in a doctoral dissertation. However, as this image was adapted, approval
for use was sought and received via email from the initial source, the Institute for
Operations Research and the Management Sciences (INFORMS), on 6/10/14.
Approval for use of Figure 4, Values-Based Change Management Model was
obtained on 6/9/14. Per Springer’s Copyright Clearance Center RightsLink® permission
is granted free of charge for use in a doctoral dissertation.
Approval for use of Figure 5, Multilevel Framework of the Antecedents and
Consequences of Readiness for Change was obtained on 6/4/14. Per SAGE Publications’
Copyright Clearance Center RightsLink® permission is granted free of charge for use in
a doctoral dissertation.
Approval for use of Figure 6, Model for Impact of Psychological Capital,
Mindfulness, and Positive Emotions on Attitudes and Behaviors Relevant to Positive
Organizational Change was obtained on 6/4/14. Per SAGE Publications’ Copyright
Clearance Center RightsLink® permission is granted free of charge for use in a doctoral
dissertation.
Approval for use of Figure 7, Adaptive and Proactive Behavior and the Impact on
Change Management was obtained on 6/4/14. Per SAGE Publications’ Copyright
Clearance Center RightsLink® permission is granted free of charge for use in a doctoral
dissertation.

xiii
Approval for use of Figure 8, Determinants and Outcomes of Organizational
Readiness for Change was provided by the Creative Commons Attribution License
(http://creativecommons.org/licenses/by/2.0), which permits unrestricted use,
distribution, and reproduction in any medium, provided the original work is properly
cited.

xiv
DEDICATION
To Steve, my amazing husband, who I met on the first night of my first class in
this PhD program. What a wonderful journey we are on together. You are always my
champion as I am yours.
To all of my family, especially my mother and father, who supported me through
these intensive years of courses, writing, and research; and who lovingly and gracefully
understood those times when I could not be with them.

1
Chapter 1
Problem
Introduction
Organizations exist in a dynamic and complex environment and find this setting
creates the need for consistent internal change in order to stay relevant and competitive.
The importance of the organizational change topic is supported by the research. Avey,
Wernsing, and Luthans (2008) stated “Organizational change initiates from a mismatch
with the environment and is motivated by gaps between the organization’s goals and
current results. This…change is…critical for managers in terms of effective
implementation and for employees in terms of acceptance and engagement” (p. 49).
“The pressure for businesses to change is enormous and inexorable, mostly because the
competition is changing, and so is the marketplace” (O’Rourke, 2013, p. 169).
Successful change efforts are critical to an organization’s strategy and growth and,
therefore, an understanding of how to best manage these change efforts is of interest to
innovative and forward-looking organizations.
Organization development (OD) practitioners conduct interventions to assist
organizations in managing change efforts (e.g. Alzahmi, Rothwell, & Kim, 2013; Burke,
Church, & Waclawski, 1993; Church, Burke, & Van Eynde, 1994; Cooperrider &
Whitney, 1998; Rothwell, Stavros, & Sullivan, 2010b; Scherer & Alban, 2010; Theodore,
2013; Worley & Feyerherm, 2003). The first step in managing change is identifying an
issue, problem, or need for a change based upon a formal or informal analysis of internal

2
or external factors. The success, or failure, of an organization’s change effort relies on
several factors including whether the organization identifies the right problem and,
subsequently, the choices an organization makes to correct the problem such as the role
of the consultant, if applicable, and the model of intervention.
Change agents are critical to this process. Significant research is available on the
role of a consultant as a change agent in an intervention including their approach as a
change management expert or organization development facilitator; their requisite
technical expertise, interpersonal skills and consulting skills; and their value-adding or
destructive roles (e.g. Appelbaum & Steed, 2005; Block, 2011; Burke, 1982; Carucci &
Tetenbaum, 2000; Rothwell, Stavros, & Sullivan, 2010a, 2010b; Schein, 1990, 1995;
Weiss, 2009).
Studies are also accessible on change effort models of intervention – structured
models that describe a method for approaching, facilitating, and evaluating or appraising
change efforts (Levasseur, 2010). These models support organizational change efforts
and vary in their applicability to organization problems. A summary of popular OD
models to guide interventions is provided in Table 1 below. The choice of a model may
vary based on a number of factors including the focus of the change effort, the
organization’s culture, and the role of the consultant in the change process.

3
Table 1.
Popular OD Models to Guide Interventions
Model Definition
Definition
Source:
(Authors,
Date, Page)
Action Research
Model
Consists of a clearly identifiable sequence of activities that
are directed toward continuous improvement by means of a
cycle in which information about problems is collected, fed
back to people affected, used to stimulate action, and
evaluated
Rothwell &
Sredl, 2000,
p. 309
Appreciative
Inquiry
A philosophy and methodology that can enhance the
organization’s capacity for ongoing adaptability…[and]
focuses on an organization’s capacity for positive change
through inquiry into…the body of stories, knowledge, and
wisdom…that best describes the…organization when it…is
at its best.
Cooperrider
& Whitney,
1998, p. 17
SOAR
An OD strengths-based, whole system approach to strategic
planning and execution…[which] stands for Strengths,
Opportunities, Aspirations, and Results.
Stavros &
Saint, 2010, p.
377
Whole System
Change
Uses the terrain of emergence; acting from inquiry,…[and]
embrace[s] disturbance because [of]…the promise of creative
and innovative answers on the other side of the unknown.
Axelrod,
Cady, &
Holman,
2010, p. 375
Two additional factors are critical to a change effort and are the subject of this
study. The first is the organization’s employees – those directly involved in the
intervention and those impacted by it. The second is the organization’s level of readiness
for the change effort. It is important to consider what is known about each of these
factors and, explicitly, about the interaction of work engagement and readiness for
change; however, significant research is not available related to the questions posed in
this study. Without this information in the literature, an organization is unable to gain an
understanding of, or benefit from, the valuable nature of work engagement on its

4
preparedness for change and, consequently, improve the likelihood its change efforts will
be successful.
Defining Engagement
Before discussing the research related to this study’s topics, it was important to
first provide operational definitions of work engagement and organizational readiness for
change. According to Macey and Schneider (2008), “[n]umerous definitions of
engagement can be derived from the practice- and research- driven literatures…[and]
the…sense that people, and particularly leaders within organizations, have about work
motivation” (p. 4). Schaufeli and Bakker (2010) stated that “no agreement exists among
practitioners or scholars on a particular conceptualization of (work) engagement” (p. 11).
However, Bakker, Schaufeli, Leiter, and Taris (2008) found most scholarship recognized
that work engagement possesses energy and identification components and was
“characterized by a high level of energy and strong identification with one’s work” (p.
189).
Therefore, for this study, the operational definition of work engagement was that
of Schaufeli, Salanova, González-romá, and Bakker (2002), who defined employee
engagement as “a positive, fulfilling, work-related state of mind that is characterized by
vigor, dedication, and absorption….a more persistent and pervasive affective cognitive
state that is not focused on any particular object, event, individual, or behavior” (p. 74).
Schaufeli et al. defined each of these characteristics in the following way:

5
Vigor is characterized by high levels of energy and mental resilience while
working, the willingness to invest effort in one’s work, and persistence even in
the face of difficulties. Dedication is characterized by a sense of significance,
enthusiasm, inspiration, pride, and challenge….[and] absorption, is characterized
by being fully concentrated and deeply engrossed in one’s work, whereby time
passes quickly and one has difficulties…detaching oneself from work. (pp. 74-75)
Standard models illustrating the relationship of the antecedents of work
engagement to the state of engagement and, consequently, employee outcomes included
the Job Demands-Resources (JD-R) Model (Bakker & Demerouti, 2007, 2008;
Baumgardner, 2014; Kim, 2014; Xanthopoulou, Bakker, Demerouti, & Schaufeli, 2007)
and the State Work Engagement (SWE) Model (Sonnentag, Dormann, & Demerouti,
2010). In the JD-R and SWE models the antecedents of work engagement comprised the
categories of employee’s personal resources, job resources, and job demands.
Personal resources encompassed the internal capacities of “optimism, self-
efficacy, and self-esteem” (Bakker & Leiter, 2010, pp. 20, 33). Xanthopoulou, Bakker,
Demerouti, and Schaufeli (2007) found as a result of their research that “personal
resources mediated the relationship between job resources and engagement/exhaustion
and influenced the perception of job resources” (p. 121). Further, they impact an
individual’s resilience to stress resilience, and positively influence the individual’s
wellbeing - physically and emotionally (Xanthopoulou et al., 2007, p. 124).
Job resources included external items such as pay, career opportunities, job
security, supervisor and co-worker support, team climate, role clarity, participation in

6
decision making, skill variety, task identity, task significance, autonomy, and
performance feedback (Bakker & Demerouti, 2007; Kim, 2014). Baumgardner (2014)
stated that job resources were “the working conditions that provide resources for the
individual employees that impact the physical, psychological, social or organizational
aspects of the job” (p. 7). Job demands, such as work pressure, emotional demands,
mental demands, and physical demands, were similar in both models (Bakker &
Demerouti, 2007, 2008; Sonnentag, et al., 2010).
The SWE model was similar to the JD-R model in terms of its antecedents of
engagement, but depicted engagement as an in-the-moment (day-level or week-level)
state or experience. The JD-R model, on the other hand, represented trait work
engagement, an average-over-time assessment of experience; therefore, this study used
the JD-R model to conceptualize employee work engagement. This was considered the
appropriate model as the concept of readiness for change could best be assessed in a
similar way – the organization’s flexibility and innovativeness over time.
The JD-R model (Figure 1), absent major alterations to job and/or personal
resources, demonstrated that an employee’s level of work engagement over time was a
relatively consistent psychological state that impacted behavioral outcomes (Bakker &
Demerouti; Baumgardner, 2014; Kim, 2014). Specifically, these behavioral outcomes
were individual employee outcomes such as organizational commitment, extra-role
behavior, personal initiative, and performance.

7
Figure 1: JD-R Model
Source: Bakker and Demerouti, 2008, p. 219. Used with Permission.
Further, according to Schaufeli and Bakker (2010), “Almost without
exception…firms claim that they have found conclusive and compelling evidence that
work engagement increases profitability through higher productivity, sales, customer
satisfaction, and employee retention” (p. 11). Several additional recent studies were
available that defined work engagement and demonstrated its impact on the
organization’s performance results (e.g. Bakker & Demerouti, 2007, 2008; Kim, 2014a;
Kim, Kolb, Kim, 2013; Macey & Schneider, 2008; Schaufeli, Salanova, González-romá,
& Bakker, 2002; Spreitzer, Lam, & Fritz, 2010; Sweetman & Luthans, 2010).
Kim (2014a), in his review of the literature of the prior decade, confirmed that
engaged employees significantly influenced both individual and organizational
performance. In addition, the level of an employee’s engagement directly impacted their
feelings of self-efficacy, intention to leave the organization, psychological health,

8
satisfaction with their job, number of days absent, level of creativity, proactive behavior,
commitment to the organization, and demonstrated organizational citizenship behavior
(Kim, 2014a, pp. 8-9).
Comparable to the impact of individual employee engagement on organizational
outcomes, the connection between an organization’s employees and its change efforts
was gained by reviewing the literature on the antecedents and consequences of
employees’ reaction to change (e.g. Alas, 2009; Avey, Wernsing, & Luthans, 2008;
Ingersoll, Kirsch, Merk, & Lightfoot, 2000; Jimmieson, Peach, & White, 2008; Jones,
Jimmieson, & Griffiths, 2005; Kim et al., 2013; Oreg, Vakola, & Armenakis, 2011;
Rafferty, Jimmieson, & Armenakis, 2013; Rafferty & Simons, 2006).
However, while these studies discussed a variety of individual affective,
cognitive, and behavioral components that may relate to work engagement, most did not
specifically discuss the broader topic of employee work engagement or its relationship to
change readiness in an organization. One example of those who touched on the topic was
a review of the literature by Kim, Kolb, and Kim (2013) who stated “in positive
organizational change, work engagement could be viewed as an essential element in
helping and facilitating employees’ change and then leading to improvement in their
performance” (p. 249).
Defining Readiness for Change
A review of the literature on readiness for change found topics such as defining
readiness, creating readiness, assessing readiness, the characteristics of readiness, and the

9
employees’ perception of the organization’s readiness for change (e.g. Alas, 2009;
Armenakis, Harris, & Mossholder, 1993; Bevan, 2011; Choi & Ruona, 2011; Drew &
Smith, 1995; Eby, Adams, Russell, & Gaby, 2000; Elgamal, 2012; Holt, Armenakis,
Feild, & Harris, 2007; Ingersoll et al., 2000; Jones et al., 2005; Rafferty et al., 2013;
Schein, 1990; Theodore, 2013).
Within this expansive literature review, several definitions were found for the
term readiness for change. While Chawla and Kelloway (2004) stated that “resistance to
change has often been used interchangeably with terms such as a lack of change
readiness” (p. 485), the literature on change theory has evolved to include the concept of
readiness for change as a different construct from the resistance to change. Therefore,
resistance to change was not considered as a variable in this research.
In a study by Ingersoll, Kirsch, Merk, and Lightfoot (2000), “organizational
readiness was defined as a state of preparedness for change…influenced by the
organization's previous history of change, its plans for continuous organizational
refinement, and its ability through its social and technical systems to initiate and sustain
that change” (Review of the Literature section, para. 8). And “Holt et al. (2007)
suggested that readiness for change is an [employee] attitude that acts as a precursor to
intentions to support change” (Jimmieson, et al., 2008, pp. 239-240).
However, for this study, the functional definition of readiness for change was
based on that of Elgamal (2012). Elgamal stated that “organizational readiness refers to
organizational members [sic] change commitment and change efficacy to implement

10
organizational change…[where] readiness…connotes a state of being both
psychologically and behaviorally prepared to take action” (p. 46).
Several researchers have developed models related to readiness for change
focusing on factors at the individual and organization level as antecedents (e.g. Alas,
2009; Avey et al., 2008; Ghitulescu, 2013; Rafferty et al., 2013). However, the extant
research lacked empirical studies that related an organization’s readiness for change and
the level of employee work engagement. There were authors, such as Avey et al. (2008),
which demonstrated interest with related topics such as organizational change and
adaptation related to positive employees and employee thriving.
Avey et al. (2008) stated “positive employees, defined here as those with positive
psychological capital and positive emotions, may exhibit attitudes and behaviors that in
turn may lead to more effective and positive organizational change” (p. 50). Spreitzer,
Lam, and Fritz (2010) asserted “thriving is positively associated with adjustments to
changing circumstances, creative and innovative behavior as well as organizational
citizenship behavior” (p. 138).
Taking one step closer, one interesting research study was conducted by
Ghitulescu (2013) on the effect of employee adaptive and proactive behaviors, as
influenced by job resources and job demands, on the organizational change effort
process. Ghitulescu stated “little research has considered how to promote employee
adaptivity and proactivity, behaviors with particular relevance to organizational change”
(p. 230). The author suggested that “change leaders can encourage adaptivity and

11
proactivity by shaping a work environment that stimulates these behaviors” (Ghitulescu,
2013, p. 230).
This researcher agreed with Ghitulescu (2013) and determined an important
implication of this study was to provide information to the management of organizations,
on the relationship between employee work engagement and readiness for change, which
would potentially influence the development of behaviors and activities to improve the
organizational climate and increase employee engagement.
Purpose of Study
The purpose of this study was to empirically bridge the gap in the research on the
relationship between employee work engagement and organizational readiness for
change. The goal was to determine if an employees’ level of work engagement was not
only important to an organization’s performance results, but also its ability to
successfully manage change.
Using validated instruments, the researcher conducted a cross-sectional survey
using a sample of employees within the member companies of the Manufacturers’
Association of South-Central Pennsylvania (MA). MA is an organization that provides
support to the manufacturing organizations in the specified region and enjoys
relationships with over 350 organizations with the goal of making them more
competitive, productive, and profitable. They offer a variety of education and training
opportunities, and services to their members. Due to their extensive relationships with

12
manufacturing organizations, MA was considered by the researcher to be a visible and
credible sponsor to the research.
However, this organization was also a gatekeeper in the study as the Executive
Director, due to past experience with the member companies, advised that a one-time
survey be conducted – this would deliver the best participation by respondents, whereas,
a pilot study would reduce involvement in a final study. Additional contributions from
MA representatives included a review of the instrument to be used, the facilitation of
participation commitment by organizations, and assistance in the content validity process.
Finally, based on study results, the importance of employee work engagement
would be enhanced if it was demonstrated to have an impact on an organization’s
readiness for change. Further, if demonstrated, it was anticipated the recognition of this
important influence would have a marked effect on policies and practices within
organizations and the OD field.
Significance of Study
As a result of this study, the literature on work engagement and readiness for
change would be expanded to incorporate the empirical association of the concepts which
currently does not exist. Further, progressive organizations may recognize the value;
continue to value; or, perhaps, increase their perceived value of employee work
engagement in the dynamic business environment. Organizations may acknowledge the
success of their change efforts, often related to the organization’s strategy and growth,
are based on, to a significant extent, their internal practices that influence work

13
engagement. The certainty of this interaction may intensify an organization’s efforts to
promote work engagement and, subsequently, increase its ability to successfully manage
change efforts. It is expected organizations would exploit this information to obtain a
practical benefit; therefore, this knowledge could (a) provide the tools needed by the
organization or OD practitioners to assess work engagement and readiness for change; (b)
necessitate new interventions within organizations; and (c) feasibly increase the need for
OD consultation.
Study Design
A cross-sectional survey – comprised of seven descriptive items, 20 Likert-scale
items, and one qualitative item – was used to gather data from a sample of manufacturing
employees in south-central Pennsylvania. A detailed discussion of the study’s
instruments is provided in the literature review and method sections of this dissertation,
but the following is a brief introduction.
In this study, work engagement was measured via the three subscales of vigor,
dedication, and absorption using the Utrecht Work Engagement Survey (UWES)
(Schaufeli et al., 2002, pp. 74-75). Organizational readiness for change was measured
with the Organizational Climate Measure (OCM), an instrument of 17 subscales
including two that indicated readiness for change in this study: (a) reflexivity and (b)
innovation and flexibility (Patterson et al., 2005, p. 391).
With the OCM instrument, the use of only two scales was acceptable as the
authors promoted the selection of the number of scales appropriate for any particular

14
research (Patterson et al., 2005, p. 399). In order to explore the multiple variables and to
determine any inter-relationships, the following four research questions were examined.
Research Questions
RQ1: What is the relationship between overall employee work engagement and
overall organizational change readiness?
RQ2: What is the relationship between each of the subscales of employee work
engagement (vigor, dedication, and absorption) and overall organizational change
readiness?
RQ3: What is the relationship between overall employee work engagement and
each of the subscales indicating organizational change readiness (reflexivity, and
innovation and flexibility)?
RQ4: To what extent is organizational change readiness – measured by the two
subscales of innovation and flexibility, and reflexivity – influenced by (a) the
employee work engagement factors of vigor, dedication, absorption; (b) employee
position in the organization; (c) the number of employees in the organization; and
(d) organizational changes experienced by the employee, including new
leadership, reorganization, downsizing, and/or merger/acquisition?

15
Data Analysis
Analysis of the data included descriptive statistics. Next, bivariate analyses of the
data were used to demonstrate the relationship between employee work engagement and
change readiness; however, as each construct was measured by multiple subscales, a
more extensive examination of the data was completed to determine if any of the
subscales had a stronger influence on the relationship (Figure 2).
Figure 2. Exploring the Relationships of Employee Work Engagement and Organizational
Readiness for Change and Each Respective Subscale
Further, the mediating influences of the EWE subscales and multiple employee
descriptive characteristics on the RFC subscales were examined through hierarchical
Reflexivity
Innovation & Flexibility
Vigor
Dedication
Absorption
Employee Work Engagement Organizational Readiness for Change RQ1
RQ3
RQ2
RQ3
RQ2
RQ2

16
multiple regression analyses. The steps in the regression analysis were illustrated in
Figure 3.
Reflexivity
Innovation
and
Flexibility
Dedication
Reorganization
Absorption
Position in
Organization
New
Leadership
Vigor
Merger/
Acquisition
Downsizing
Number of
Employees
Model 1
Model 2
Model 3
Model 4
Figure 3. Illustration of the hierarchical multiple regression analysis conducted for RQ4

17
Next, to supplement and enrich the findings for the previously mentioned data
analyses, the researcher investigated whether there was an interaction between the current
positions of the respondents with years in the current organization with each of the
study’s variables using factorial ANOVA. Finally, separate explorations were made of
the respondents’ position and years in the organization relative to (a) the mean scores of
all study variables through graphical illustrations, and (b) their responses to the
qualitative question posed through coding.
18
Chapter 2
Literature Review
Existing research regarding an organization’s readiness for change provided
multiple viewpoints in terms of the characteristics of an organization deemed more ready.
The benefit of finding common characteristics related to readiness for change was the
practical implication of the information for organizations and OD practitioners. For
example, the researcher considered the possible effects of conducting an assessment and
feedback in an organization to determine the gap between their current state of readiness
for change in comparison to organizations whose characteristics classify them as more
ready. What could an organization do with this powerful knowledge?
If through this study an employee’s engagement was found to correlate to
readiness for change in an organization, what intervention(s) could/would an organization
pursue to increase the level of engagement in their employees to close this gap and better
prepare the individuals and the organization for change in a dynamic environment?
Therefore, the powerful information generated by this exploration had value for
organizations and highlighted the significance of these topics for study. However, first
the literature on the constructs had to be examined, and then, through empirical research,
a relationship between the constructs of employee work engagement and organizational
readiness for change had to be established.
The major themes of this literature review encompassed (a) an exploration of
employee work engagement and related constructs; (b) a review of methods to assess
employee engagement including the Utrecht Work Engagement Scale (UWES); (c) a

19
discussion of organizational readiness for change; (d) an examination of studies on the
common characteristics of organizations that indicate a readiness for change; (e) an
analysis of how these common characteristics relate to the traits of employee engagement
as illustrated by the Job Demands-Resources (JD-R) Model; (f) an investigation into
various methods of assessing organizational readiness for change including the
Organizational Climate Measure (OCM); and (g) consideration of the relationship
between employee work engagement and organizational readiness to change.
Material Criteria
The articles and books sourced for this literature review were limited to scholarly
publications, including peer-reviewed articles and books. The content of the material
included a discussion, based on empirical research or scholarly literature, on one or more
of the following topics: defining employee work engagement, assessing employee work
engagement, defining organizational change, the impact of organizational change, the
readiness for change, the antecedents for successful organizational change, characteristics
that demonstrate the readiness for change, or assessing an organization’s readiness for
change.

20
Employee Work Engagement
There are several definitions and models related to the concept of employee work
engagement; therefore, the literature selections in this review were chosen in order to
provide a broad overview of significant concepts and models related to engagement.
“Many organizations share the belief that in [a]…talent market where knowledge
is becoming an organizational commodity, employee engagement is an undeniable
dominant source of competitive advantage” (Shuck, 2011, p. 305). Because of this belief,
Shuck (2011) stated the topic of employee engagement was an important concept for both
the practitioner and academic communities and has led to two different approaches.
Practitioners were interested in its “usability… and actionable outcomes such as
improved retention, commitment, and productivity with a focus of aggregating data to
inform practice” (Shuck, 2011, p. 305). The academic approach, on the other hand,
focused on understanding the antecedents to employee engagement in addition to
defining and validating it as a psychological concept.
Shuck (2011) discussed that within the academic or scholarly arena there were
four perspectives on the topic of employee engagement including “(a) Kahn’s (1990)
need-satisfying approach, (b) Maslach et al.’s (2001) burnout-antithesis approach, (c)
Harter et al.’s (2002) satisfaction-engagement approach, and (d) Saks’s (2006)
multidimensional approach” (p. 307). Two of the definitions of employee engagement
that resulted from these perspectives were provided here as the work of many researchers
was based on that of Kahn and Saks. Maslach’s definition and research was discussed in
the engagement measurement section.
21
First, “Kahn (1990)…define[d] engagement as the ‘simultaneous employment and
expression of a person’s ‘preferred self’ in task behaviors that promote connections to
work and others, personal presence, and active full role performances’ (p. 700)” (Shuck,
2011, p. 308). This engagement could be physical, emotional, and/or cognitive.
Regarding the second perspective, Shuck (2011) reported “Saks (2006)
hypothesized that employee engagement developed through a social exchange model
and…suggest[ed] separate states of engagement: job engagement and organizational
engagement….The multidimensional concept…[is] ‘a distinct…construct consisting of
cognitive, emotional, and behavioral components…associated with individual role
performance’ (p. 602)” (p. 313).
Additional perspectives on EWE included that of Schaufeli, Salanova, González-
romá, and Bakker (2002) who defined engagement as “a positive, fulfilling, work-related
state of mind that is characterized by vigor, dedication, and absorption….a more
persistent and pervasive affective cognitive state that is not focused on any particular
object, event, individual, or behavior” (p. 74). Schaufeli et al. defined each of these
individual engagement characteristics in the following way:
Vigor is characterized by high levels of energy and mental resilience while
working, the willingness to invest effort in one’s work, and persistence even in
the face of difficulties. Dedication is characterized by a sense of significance,
enthusiasm, inspiration, pride, and challenge….absorption, is characterized by
being fully concentrated and deeply engrossed in one’s work, whereby time

22
passes quickly and one has difficulties with detaching oneself from work. (pp. 74-
75)
After surveying the research on work engagement and developing an instrument
to measure work engagement, Schaufeli and Bakker (2003), concluded the following:
The possible consequences of work engagement pertain to positive attitudes
towards work and towards the organization, such as job satisfaction,
organizational commitment, and low turnover intention…but also to positive
organizational behavior such as, personal initiative and learning motivation…,
extra-role behavior…, and proactive behavior….Finally, it seems that work
engagement is positively related to job performance. (p. 10)
Macey and Schneider (2008) described engagement as “a desirable condition
[with] organizational purpose…connotes involvement, commitment,…enthusiasm,
focused effort, and energy, so it has both attitudinal and behavioral components” (p. 4).
The authors built a conceptual model that incorporated the three types of engagement
(trait, state, and behavioral) as the various components of their framework. The authors
linked the concepts by stating “trait engagement gets reflected in psychological state
engagement….[which] we conceptualize…as an antecedent of behavioral
engagement…defined in terms of discretionary effort…or extra-role…behavior” (Macey
& Schneider, 2008, pp. 5-6).
In terms of how to measure engagement, Macey and Schneider (2008) found the
measures were “composed of…four different categories: job satisfaction, organizational
commitment, psychological empowerment, and job involvement” (pp. 6-7). These

23
conclusions by Macey and Schneider were very relevant to this study’s discussion on
work engagement because extra-role behavior, personal initiative, job involvement,
organizational commitment, and job satisfaction are concepts once considered
indistinguishable from work engagement.
Schaufeli and Bakker (2010) made a tremendous effort to clarify this previous
misconception about work engagement and to establish it as a separate and distinct
construct. The authors argued extra role behavior was discretionary behavior that
engaged employees may or may not exhibit and; therefore, “should not be considered...a
constituting element of work engagement….Personal initiative is about the quality of the
employee’s work [and] related to the…vigor component of the broader concept of work
engagement” (Schaufeli & Bakker, 2010, p. 14). They further stated “organizational
commitment is a binding force between individual and organization….In contrast, work
engagement is…being involved…in the work itself….[and where] engagement…is
concerned with the employee’s mood at work,…job satisfaction is concerned with the
affect about or toward work” (Schaufeli & Bakker, 2010, p. 14).
However, as these concepts referred to either psychological states similar to work
engagement (job satisfaction and job involvement) or outcomes of employee work
engagement (organizational commitment, personal initiative, extra-role behavior) that
were integrated into the Job Demands-Resources (JD-R) Model, the research by Macey
and Schneider (2008) and Schaufeli and Bakker (2003, 2010) provided an excellent
introduction to the discussion of employee work engagement models.

24
Models of Employee Work Engagement
In the literature, standard models illustrating the relationship of the antecedents of
work engagement to the state of employee engagement and, consequently, employee
outcomes included the JD-R Model (Bakker & Demerouti, 2007, 2008; Baumgardner,
2014; Kim, 2014; Xanthopoulou et al., 2007) and the State Work Engagement (SWE)
Model (Sonnentag et al., 2010). In the JD-R and SWE models, employee work
engagement was considered a psychological state that impacted behavioral outcomes.
The antecedents of work engagement in both of these models included the employee’s
personal resources, job resources, and job demands.
Personal resources comprised the capacities of optimism, self-efficacy, and self-
esteem (Bakker & Leiter, 2010, pp. 20, 33). Xanthopoulou, et al. (2007) concluded from
their research that “personal resources mediated the relationship between job resources
and engagement/exhaustion and influenced the perception of job resources” (p. 121).
Further, they impact an individual’s resilience to stress resilience, and positively
influence the individual’s wellbeing - physically and emotionally (Xanthopoulou et al.,
2007, p. 124). Schaufeli and Bakker (2010) believed these capacities have similar
motivational potential (p. 21). Bakker and Demerouti (2007) described job resources in
the following way:
Job resources may be located at the level of the organization at large (e.g. pay,
career opportunities, job security), the interpersonal and social relations (e.g.
supervisor and co-worker support, team climate), the organization of work (e.g.
role clarity, participation in decision making), and at the level of the task (e.g.

25
skill variety, task identity, task significance, autonomy, performance feedback).
(pp. 312-313)
Schaufeli and Bakker (2010) reported “both job resources and personal resources
foster work engagement….Job resources may…play an intrinsic… or…extrinsic
motivational role” (p. 21). They supported the assertion of an “intrinsic motivational role
because they foster an employee’s growth, learning [sic] and development” (Schaufeli &
Bakker, 2010, p. 21). On the other hand, Schaufeli and Bakker concluded these job
resources may “play an extrinsic role because they are instrumental in achieving work
goals” (p. 21). Baumgardner (2014) stated that job resources were “the working
conditions that provide resources for the individual employees that impact the physical,
psychological, social or organizational aspects of the job” (p. 7).
The influence of job demands, such as work pressure, emotional demands, mental
demands, and physical demands, were also similar in both models (Bakker & Demerouti,
2007, 2008; Sonnentag et al., 2010). If an employee’s job and/or personal resources were
high then the job demands were considered challenging and potentially increased work
engagement; however, if the job and/or personal resources were low, then the job
demands could seem overwhelming and lead to burnout (Sonnentag et al., 2010, p. 34).
Further, according to Hakanen and Roodt (2010), the JD-R model may reflect the
buffering impact on job demands by job resources “suggesting that the relationship
between job demands and engagement is weaker for employees who have many job
resources at their disposal….positing a so-called coping or motivational hypothesis” (p.
89).

26
As discussed, the SWE model was similar to the JD-R model in terms of its
antecedents of engagement, but there was a significant distinction between the models.
The SWE depicted engagement as an in-the-moment (day-level or week-level) state or
experience. The JD-R model, on the other hand, represented trait work engagement – an
average-over-time assessment of experience. The importance of this distinction related
to the applicability of a model to an empirical study. For example, if one preferred to
measure trait work engagement then the JD-R model would be chosen.
Another construct in the literature on work engagement was that of Psychological
Capital (PsyCap). Avey et al. (2008) developed a model, described in more detail later in
this chapter, which illustrated the indirect relationship of PsyCap to engagement. In this
model, (a) the antecedents of work engagement – efficacy, optimism, hope, and resiliency
– were similar to the personal resources of the JD-R model, and (b) “includes the role
PsyCap plays in impacting work engagement indirectly through positive emotions”
(Sweetman & Luthans, 2010, p. 58). According to Luthans, Avey, Avolio, Norman, and
Combs (2006), PsyCap referred to:
An individual's positive psychological state of development that is characterized
by: (1) having confidence (self-efficacy) to take on and put in the necessary effort
to succeed at challenging tasks; (2) making a positive attribution (optimism) about
succeeding now and in the future; (3) persevering toward goals, and when
necessary, redirecting paths to goals (hope) in order to succeed; and (4) when
beset by problems and adversity, sustaining and bouncing back and even beyond
(resiliency) to attain success. (p. 388)

27
A concept that builds on PsyCap, and also linked to an individual’s personal
resources that impact their level of work engagement, was that of thriving. According to
Spreitzer et al. (2010), “thriving as a psychological state focuses on ‘a sense of progress
or forward movement in one’s self-development’ captured in two dimensions of personal
growth: learning and vitality” (p. 133). The authors cited empirical research and
concluded “in a sample of professionals across six industries, respondents who reported
more thriving were evaluated by their bosses as taking more initiative in their career
development” (Spreitzer et al., 2010, p. 135).
Spreitzer et al. (2010) further concluded work engagement and thriving added
value to employees and their organizations and related to high job performance (p. 138).
It appeared, therefore, that these demonstrated behaviors of thriving related to the extra-
role behavior and personal initiative outcomes of work engagement as shown on the JD-
R model.
As illustrated in these various models and constructs, work engagement creates
value-added performance by employees and for the organization; therefore, using
instruments to assess employee engagement provides important information to an
organization related to its future success.
Assessing Employee Work Engagement
The available literature offered a variety of methods to assess employee work
engagement. This was relevant to this study as the extant research demonstrated that
employee work engagement was related to many organizational outcomes including

28
performance measures. “Almost without exception…firms claim that they have found
conclusive and compelling evidence that work engagement increases profitability through
higher productivity, sales, customer satisfaction, and employee retention” (Schaufeli &
Bakker, 2010, p. 11). In particular, Bakker and Demerouti (2009) concluded from their
research that “men’s work engagement and in particular their dedication is positively
related to both in-role and extra-role performance” (p. 226). Therefore, for any effort that
sought to make changes to improve these performance measures, it would be logical for
an organization to measure the level of work engagement in its employees. The methods
to assess employee work engagement discussed in this section included the Maslach
Burnout Inventory, the Utrecht Work Engagement Survey, and Gallup’s Workplace
Audit.
Maslach Burnout Inventory (MBI).
Interestingly, the early research on measuring work engagement was based on the
study of burnout because work engagement and burn out were considered two ends of a
continuum – opposite constructs (Schaufeli & Bakker, 2003, p. 4). The popular
instrument to measure burnout, and its dimensions of exhaustion, cynicism, and reduced
professional efficacy, was the Maslach Burnout Inventory (MBI). “According to
Maslach and Leiter (1997) engagement is characterized by energy, involvement, and
efficacy – the direct opposites of the three burnout dimensions….By implication,
engagement is assessed by the opposite pattern of scores…of the Maslach Burnout
Inventory” (Schaufeli & Bakker, 2003; 2010).

29
However, Schaufeli and Bakker (2003) identified two major concerns with this
approach. If burnout and engagement were measured with the same instrument the
relationship between the two could not be studied. Also, through the use of only one
instrument, the incorrect assumption could be made that a low measurement on burnout
reflected high engagement and vice versa. Therefore, Schaufeli and Bakker determined it
was critical to define and assess the concepts independently (p. 4).
Utrecht Work Engagement Survey (UWES).
Schaufeli and Bakker (2003) used the work engagement definition of Schaufeli et
al. (2002), previously discussed, and developed an instrument to measure engagement
that incorporated the dimensions or subscales of vigor, dedication, and absorption – the
Utrecht Work Engagement Survey (UWES). “Vigor and dedication are considered direct
opposites of exhaustion and cynicism, respectively” (Schaufeli & Bakker, 2003, p. 5).
However, empirical evidence did not support the use of the MBI professional efficacy
dimension; therefore, Schaufeli and Bakker determined engagement was characterized
more by a state of absorption (p. 5).
The UWES instrument developed by Schaufeli and Bakker (2010) was a survey
questionnaire that consisted of 17 items scored on a 7-point Likert response scale. A
validated, shortened version of nine items was later available. The instrument has been
translated into 21 languages and included student versions. Further, the authors have
developed an international database with over 60,000 employee records (Schaufeli &
Bakker, 2010, p. 16). In addition, tests for validity, variance, consistency, and stability

30
have all shown the instrument to be effective in measuring work engagement over time
(Schaufeli & Bakker, 2003, pp. 7-8). For these reasons, the UWES instrument has been
the most popular measure of work engagement. Due to its inclusion in this study’s
instrument, more detail on the UWES was provided in Chapter 3 Methods.
Gallup’s Workplace Audit (Q12
).
According to Schaufeli and Bakker (2010), while several instruments have been
used to measure work engagement, there were very few for which psychometric data
were available in order to evaluate reliability and validity (p. 15). One instrument for
which data were available was the Gallup’s Workplace Audit (GWA or Q12
). This
measure was designed to assess work engagement based on a Positive Psychology
approach and was the result of collaborative research by Dr. George Gallup and Dr.
Donald Clifton (Harter, Schmidt, Killham, & Asplund, 2006, pp. 4-5).
The Q12
was “designed from an ‘actionability standpoint’….In the development
of the instrument, practical considerations regarding the usefulness…in creating
change…have been the leading principle” (Schaufeli & Bakker, 2010, p. 15). However,
Schaufeli and Bakker (2010) found the Q12
measures an employee’s perception of their
job resources versus their level of job engagement (p. 15). In other words, the Q12
was
measuring an antecedent of work engagement versus an employee’s actual level of work
engagement.
In conclusion, obtaining an accurate measure of employee work engagement is
critical to predicting the performance outcomes that provide a value-add to an

31
organization. As work engagement is an antecedent to organizational commitment,
extra-role behavior, and performance, perhaps there is also evidence that it is linked to an
individual’s and organization’s readiness for change.
Readiness for Change
“Organizational change initiates from a mismatch with the environment and is
motivated by gaps between the organization’s goals and current results. This…change
is…critical for managers in terms of effective implementation and for employees in terms
of acceptance and engagement” (Avey et al., 2008, p. 49).
There were several definitions for the term readiness for change found in the
literature. The definitions discussed give insight into organizational characteristics that
influence readiness for change. The literature on change theory has evolved to include
the concept of readiness for change as a different construct from the resistance to
change. However, Chawla and Kelloway (2004) stated “resistance to change has often
been used interchangeably with terms such as a lack of change readiness” (p. 485).
In a study by Ingersoll et al. (2000), “organizational readiness was defined as a
state of preparedness for change…influenced by the organization's previous history of
change, its plans for continuous organizational refinement, and its ability through its
social and technical systems to initiate and sustain that change” (Review of the Literature
section, para. 8).
Werner (2009) stated “organizational readiness for change is a multi-level, multi-
faceted construct....As an organizational-level construct...[it] refers to organizational

32
members’ shared resolve to implement a change...and shared belief in their collective
ability to do so” (p. 1). Elgamal (2012) believed change readiness was found at the
individual, group, unit, department or organizational level. “Organizational readiness
refers to organizational members [sic] change commitment and change efficacy to
implement organizational change…[where] readiness…connotes a state of being both
psychologically and behaviorally prepared to take action” (Elgamal, 2012, p. 46).
Further, “when organizational readiness for change is high…members are more likely to
initiate change, exert greater effort, exhibit greater persistence and display more
cooperative behavior. The result is more effective implementation” (Werner, 2009, p. 1).
According to Armenakis, Harris, and Mossholder (1993), readiness for change
described the “organizational members’ beliefs, attitudes, and intentions regarding the
extent to which changes are needed and the organization’s capacity to successfully make
those changes. The cognitive precursor to the behaviors of either resistance to, or support
for, a change effort” (pp. 681-682). Further, Jansen (2000) concluded “readiness for
change is an organization’s capacity for making change and the extent to which
individuals perceive the change as needed” (as cited in Choi & Ruona, 2011, p. 52).
Finally, Holt, Armenakis, Feild, and Harris (2007) offered “readiness for change
is an [employee] attitude that acts as a precursor to intentions to support change” (as cited
in Jimmieson et al., 2008, p. 239). Holt et al. stated readiness for change related to the
“employees’ beliefs that (a) they are capable of implementing a proposed change…(b)
the proposed change is appropriate for the organization…(c) the leaders are committed to
33
the proposed change…and (d) the proposed change is beneficial to organizational
members” (as cited in Choi & Ruona, 2011, p. 52).
From these various definitions it was clear readiness for change was not just an
organizational characteristic, but one linked to the individual employees and their
perceptions of the change effort. To expand on this understanding, it warranted a closer
look into (a) the organizational characteristics that may be an indication of readiness for
change, and (b) identifying how these characteristics might link to employee work
engagement in order to build a foundation for establishing this relationship empirically.
Organizational Characteristics and Readiness for Change
“Creating change readiness means managing in a way that encourages
engagement, commitment, aspiration, and adaptability” (Bevan, 2011, p. 9). Therefore,
for an organization to be prepared to manage change effectively, the author asserted that
it must create an alignment between its mission and strategy, supportive leaders, and
engaged employees (Bevan, 2011, p. 9).
Armenakis et al. (1993) concluded “the energy, inspiration, and support necessary
to create readiness must come from within the organization…the activities of internal
change agents” were significant (p. 682). Internal change agents included organizational
leaders and managers as they attempted “to influence the beliefs, attitudes, intentions, and
ultimately the behavior of a change target” (Armenakis et al., 1993, p. 683). However,
the change agent “must understand the distinction between individual and collective

34
readiness…an organization’s collective readiness is constantly being influenced by the
readiness of the individuals comprising it” (Armenakis et al., 1993, p. 686).
Choi and Ruona (2011) stated, historically, individual employees were considered
the source of resistance to change within an organization. However, the authors believed
this perspective should be viewed as the employee’s readiness for change. Particularly in
organization development (OD) change interventions, the participation of the individual
employees was a significant ingredient to the assessment and change process.
Further, if the consensus in the conceptual and theoretical literature was that the
employees were an important part of the system of change, the organizational context
became significant to this research. “Organizational change…interrupts the normal
patterns of an organization….[T]o make sense of the new environment and to draw
conclusions about its possible outcomes, individuals are actively involved in information
seeking…and assumption making about the change process” (Choi & Ruona, 2011, p.
51).
In other words, these assumptions, expectations, and impressions represented
individual employee’s change readiness (Choi & Ruona, 2011, p. 51). This assertion
supported that of Eby, Adams, Russell, and Gaby (2000) who “found that employees who
rated their division as having flexible policies and procedures were more likely to
evaluate their organization and the people working there as being more responsive to
change” (as cited in Jones et al., 2005, p. 363).
An illustration of the relationship of organizational context and its influence on
individuals was found within learning organizations which appeared to have a higher

35
readiness for change. Senge (1990) reported that “learning organizations are entities
where people continually expand their capacities to create…results…, environments
where new and expansive patterns of thinking are nurtured,…and where people are
continually learning to see the whole together” (as cited in Theodore, 2013, p. 65).
Therefore, in learning organizations, the capacities to change on an individual and
organizational level are nurtured and part of the culture.
Further, Theodore (2013) stated OD “interventions in key areas of learning
organizations assist to further develop such organizations because they are open systems
and accustomed to planned developmental changes” (p. 65). Therefore, within learning
organizations “the resistance to planned development changes is limited or absent in
comparison to non-learning organizations” (Theodore, 2013, p. 65).
This perspective was supported by Choi and Ruona (2011) who reported “a
learning culture enables individuals to be agents learning on behalf of their organization
and to be ready for organizational change” (p. 62). The authors went on to say
organizations with a strong emphasis on learning tended to be better at change. Watkins
and Marsick (1993) stated “a learning culture not only encourages individuals to be
engaged in organizational learning but also enhances organizational capacity to make
successful changes” (as cited in Choi & Ruona, 2011, p. 62).
These definitions lead to a discussion of organizational culture and its impact on
individuals and readiness for change. Schein (1990) stated the organization’s culture was
like its personality and character, similar to that of an individual who learned how to
behave, acquired certain beliefs and values, and allowed one to adapt to one’s

36
environment (p. 111). On this topic, Jones, Jimmieson, and Griffiths (2005) described
the following:
Organizations differ in terms of whether they adopt an inward focus towards their
internal dynamics or an external focus towards the environment….An
organizational culture emphasizing human relations values aims to foster high
levels of cohesion and morale among employees through training and
development, open communication, and participative decision-making. An open
systems orientation...places more of an emphasis on innovation and development.
This is achieved by fostering adaptability and readiness, visionary
communication, and adaptable decision-making. (p. 364)
Based upon their findings, Jones et al. (2005) asserted that “employees who
perceive their workplace to be dominant in either human relations values or open systems
values are more likely to hold positive views towards organizational change” (p. 366).
The researchers used the Competing Values Framework (CVF), which included the
human relations values and open systems values quadrants, to illustrate the relationship
between an organization’s culture, capabilities, and the impact on readiness for change
(Figure 4).

37
Flexibility
Internal
Human relations
Ends
cohesion and morale Means
training and development
open communication
participative decision-making
Open Systems
Ends
innovation and development Means
adaptability and readiness
visionary communication
adaptable decision-making
External
Internal process Ends
stability and control Means
information management
precise communication
data-based decision-making
Rational goal
Ends
efficiency and productivity Means
goal-setting
instructional communication
centralized decision-making
Control
Figure 4. Competing Values Framework Model
Adapted with permission from Jones et al., The impact of organizational culture and reshaping capabilities
on change implementation success: The mediating role of readiness for change, Journal of Management
Studies, volume 41, number 2, February, 2005. Copyright 2005, the Institute for Operations Research and
the Management Sciences, 5521 Research Park Drive, Catonsville, Maryland 21228.
The research by Patterson et al. (2005) supported this point of view. According to
Patterson et al., “the open systems approach (external focus and flexible relationships
with the environment) emphasizes the interaction and adaptation of the organization in its
environment, with managers seeking resources and innovating in response to
environmental (or market) demands” (pp. 384-385). “The emphasis…is on readiness,
change [sic] and innovation, where norms and values are associated with growth,
resource acquisition, creativity [sic] and adaptation” (Patterson et al., 2005, p. 386).
Climate dimensions within the open systems approach included “flexibility-an
orientation toward change…; innovation-the extent of encouragement and support for

38
new ideas and innovative approaches…; [and] reflexivity-a concern with reviewing and
reflecting upon objectives, strategies, and work processes, in order to adapt to the wider
environment” (Patterson et al., 2005, p. 386). These exact dimensions were those chosen
to be measured in this research via the OCM instrument. The OCM and the reasons why
the researcher chose these dimensions were discussed in more detail later in this chapter.
Finally, Rafferty, Jimmieson, and Armenakis (2013) emphasized their belief that
any model of organizational readiness for change must include an affective component
(p. 130). The following was a key part of the authors’ conclusion: “An individual’s
overall evaluative judgment that he or she is ready for organizational change is
influenced by the individual’s current and future-oriented positive affective emotional
responses to a specific change event” (Rafferty et al., 2013, p. 116). Further, Rafferty et
al. addressed the affective influence at the group and organizational levels when they
provided the following:
A work group’s change readiness and an organization’s change readiness are
influenced by (1) shared cognitive beliefs among work group or organizational
members (a) that change is needed, (b) that the work group or organization has
the capability to successfully undertake change, (c) that change will have positive
outcomes for the work group or organization and by (2) the occurrence of current
and future-oriented positive group or organizational emotional responses to an
organizational change. (p. 117)
In conclusion, this section of the review of the literature makes it apparent the
characteristics of an organization have a significant impact on its readiness for change. It

39
is also clear the individuals in the organization are impacted by these characteristics and
this influences their readiness for change. As organizations are made up of these
individuals, the relationship is one that is significant, must be considered, and properly
assessed in order to ensure the organization is in an appropriate state of readiness prior to
implementing a change effort.
Assessing Readiness for Change
The review of the research in this area addressed several empirical studies and
introduced various assessment instruments used to measure an organization’s readiness
for change.
Drew and Smith (1995) stated the “concepts of the learning organization can be
utilized to ‘change proof’ the firm – to increase its capacity to withstand and exploit
unexpected and rapid change” (p. 4). The authors explained this concept in the following
way: “Change proofing is not a means of resisting or avoiding change, but a process for
becoming more flexible and responsive in order to cope with it” (Drew & Smith, 1995, p.
5).
Therefore, for an organization to assess its readiness for change, “to help identify
and assess the critical factors for change proofing, a ‘change audit’ is recommended…of
organizational learning processes and their impact on strategic focus, motivation and core
capabilities” (Drew & Smith, 1995, p. 5). Drew and Smith (1995) stated “a change audit
is aimed at diagnosing needs for organizational learning and developing initiatives to
enhance organizational capacity for change” (p. 11).

40
Pasmore Sociotechnical Systems Assessment Survey (STSAS).
Ingersoll et al. (2000) conducted an empirical study using the Pasmore
Sociotechnical Systems Assessment Survey (STSAS) in which organizational readiness
was measured by the subscales of innovativeness and cooperation. The innovation
subscale included 10 Likert-response items that “measure rewards for innovation,
propensity for risk taking, and extent to which the organization leaders and members
maintain a futuristic orientation” (Ingersoll et al., 2000, Instruments section, para. 5).
The cooperation subscale of the STSAS comprised seven Likert response items “which
measure teamwork, flexibility, changes in organizational structure, and extent to which
individuals and subunits work together to accomplish superordinate goals” (Ingersoll et
al., 2000, Instruments section, para. 5).
According to Ingersoll et al. (2000), the researchers distributed 2,157
questionnaires to hospital employees directly affected by the change effort through an
internal mailing system. A follow up letter was sent two weeks later to thank the
respondents and to request a response from those that had not completed the survey. The
response rate was 41.1%, or 887 questionnaires, but only 31.7%, or 684, were usable
based on completeness. The authors recognized the low response rate but as the staff to
administrator ratio was comparable to that of the institution, the response rate was
considered acceptable (Ingersoll et al, 2000, Findings section, para. 1).
An interesting conclusion by Ingersoll et al. (2000) was “organizational
readiness…was the strongest predictor of employee commitment to the organization”

41
(Organizational Readiness and Commitment section, para. 1). In addition, the authors
reported the following conclusion based on their study:
[A] constructive culture was associated with favorable perceptions about the
organization’s readiness and employee commitment to the organization….It
suggests that creating environments in which employees feel empowered to
influence the work of the group are likely to have the added benefit of employee
commitment to the work of the organization as well as favorable perceptions
about any proposed plans for change. (Ingersoll et al., 2000, Organizational
Culture and Commitment section, para. 2)
Organizational Climate Measure (OCM).
Patterson et al. (2005) described organizational climate as “an intervening
variable between the context of an organization and the behavior of its members” (p.
379). This variable was generally accepted as the perception of the organization by its
employees; therefore, to analyze an organizational climate at various levels, individual
scores on a measure were aggregated for the group, department, or organization levels.
“The rationale behind aggregating individual data…is the assumption that organizational
collectives have their own climate….Perceptual agreement implies a shared assignment
of psychological meaning allowing individual perceptions to be aggregated and treated as
a higher-level construct” (Patterson et al., 2005, p. 380).
The Organizational Climate Measure (OCM) was developed by Patterson et al.
(2005) who validated the measure in an empirical study, discussed in detail below, and

42
linked it to “managerial practices, productivity, and innovation” (p. 379). The authors
found prior studies on organizational climate did not build upon one another as they often
studied different dimensions of climate; therefore, the goal of their study was to develop
“an inclusive, robust, and theoretically based approach to the measurement of climate”
(Patterson et al., 2005, p. 382).
The OCM was developed as a multi-dimensional measure and the 17 subscales
have been validated for use independently by researchers as applicable to their particular
study. “The measure is designed to…be applicable across a range of work settings and to
target all employee levels” (Patterson et al., 2005, p. 383). Patterson et al. (2005) stated
“The 17 scales contained within the measure had acceptable levels of reliability and were
factorially distinct” (p. 379).
Patterson et al. (2005) specifically used the term climate in their measure and
distinguished organizational climate from organizational culture in the following way:
Organizational climate is more behaviorally oriented in that climates for
creativity, innovation, safety, or service, for example, may be found in the
workplace. These climates represent employees' perceptions of organizational
policies, practices, and procedures, and subsequent patterns of interactions and
behaviors that support creativity, innovation, safety, or service in the organization.
Thus, climate can be understood as a surface manifestation of culture. (p. 381)
Interestingly, the OCM was based on the Competing Values Model (CVM), also
known as the CVF, which related to an organization’s culture – though this disparity of
climate versus culture did not appear to be of significance as Patterson et al. understood

43
climate to be the manifestation of culture. Patterson et al. (2005) stated that the CVM
“calls attention to how opposing values exist in organizations” (p. 384) and reported that
according to Zammuto and O’Connor (1992) “individual organizations are likely to
embrace different mixtures of values that are reflected in their desired ends and in the
means to attain them” (as cited in Patterson et al., 2005, p. 384).
Like the CVM, the 17 scale OCM incorporated four quadrants of measurement:
human relations, internal processes, open systems, and rational goals. Of particular
interest in this instrument were the dimensions, or subscales, within the open systems
quadrant for their applicability in assessing readiness for change. “The Open Systems
Model (external focus and flexible orientation) is on readiness, change [sic] and
innovation, where norms and values are associated with growth, resource acquisition,
creativity and adaptation” (Patterson et al., 2005, p. 386). The three climate dimensions
in the open systems quadrant of the OCM included (a) innovation and flexibility, (b)
reflexivity, and (c) outward focus. The dimensions that specifically focus on internal
readiness for change were innovation and flexibility, and reflexivity.
The innovation and flexibility climate dimension measured “acceptance of new
ideas; ability to respond to change; identification of need for change; flexibility in
responding to changes needed in procedures; support in developing new ideas; and
orientation to improvement and innovation” (Rivard, 2005, p. 4). According to West
(1996, 2000), reflexivity was concerned “with reviewing and reflecting upon objectives,
strategies, and work processes, in order to adapt to the wider environment” (as cited in
Patterson et al., 2005, p. 386).

44
In their post-study discussion of results, Patterson et al. (2005) stated that in order
to be useful, the OCM should “demonstrate significant differences in employee
perceptions across organizations….[and]…produce data indicating reasonable consensus
between employees within organizations” (p. 394). The authors found the measure
distinguished between organizational climates and; therefore, the data collected using the
OCM reflected variations in climate (Patterson et al., 2005, p. 398).
Finally, the authors suggested using the instrument to assess organizational
compatibility before and after mergers and acquisitions; and for studies related to
organizational and cultural change, including sub-cultures (Patterson et al., 2005, p. 399).
The instrument was also validated for use in measuring organizational climate in service
organizations. Additional details on the OCM were provided in Chapter 3 Methods.
Competing Values Framework (CVF).
The impact of an organization’s culture on change implementation success, with
change readiness as a mediating variable, was the focus of an empirical study by Jones et
al. (2005) and previously shown in Figure 4. The authors based their study on the
Competing Values Framework (CVF), also known as the CVM used by Patterson et al.
(2005), which represented the interaction of culture, capabilities, and readiness for
change. The CVF model supported the work by Patterson et al. (2005) and the OCM as
the open systems quadrant reflected the organization’s goal of innovation and
development.
45
However, in this discussion, in addition to the open systems quadrant, the
importance of the human relations quadrant to organizational change readiness was
explored. The human relations quadrant reflected the end goal of cohesion and morale by
means of training and development, open communication, and participative decision-
making (Jones et al., 2005, p. 365).
The initial hypothesis of the study by Jones et al. (2005) was “employees’
perceptions of an organizational culture strong in human relations values and open
systems values would be associated with heightened levels of readiness for change
which, in turn, would be predictive of change implementation success” (p. 361). The
authors’ Hypothesis 1a specifically stated “employees who perceive a human relations
cultural environment within their division would report higher levels of user
satisfaction…and that this relationship would be mediated by their ratings of readiness
for change” (Jones et al., 2005, p. 369). Hypothesis 1b referred in a similar way to an
open systems cultural environment and its impact on user satisfaction mediated by
readiness for change.
Questionnaires were distributed to 572 employees at Time 1 and Time 2, five
weeks later. Five independent instruments were used including unidentified measures of
organizational culture and readiness for change. “Levels of readiness for change were
measured with seven items designed to assess the extent to which employees were feeling
positive about the changes introduced” (Jones et al, 2005, p. 373). The available
responses were presented using a seven point Likert scale.

46
The authors used descriptive measures and multiple regression techniques to
analyze their results. The analysis supported Hypothesis 1a that employees’ perceptions
of a human relations culture were predictive of readiness for change: β = .33, p < .01, R2
= .11, F(1, 60) = 7.43, p < .01 (Jones et al., 3005, p. 377). In the discussion of these
results, Jones et al. (2005) stated “the present study…has demonstrated simultaneously
that readiness for change may be the mechanism through which an organizational culture
emphasizing human relations values impacts on successful change outcomes” (p. 380).
Based on their study results Jones et al. (2005) found that Hypothesis 1b
regarding the importance of open systems to change implementation success was not
supported. However, to provide evidence as to their belief in this hypothesis, the authors
stated the following:
O’Neill and Quinn (1993) note that open systems cultures are characterized by
adaptability and a willingness to take on new challenges….Zammuto and
Krakower (1991) compliment this argument by commenting that open systems
cultures are dynamic and entrepreneurial, usually displaying significant levels of
adaptability and change readiness. (as cited in Jones, et al., 2005, p. 380)
Theory of Planned Behavior (TPB).
An empirical study by Jimmieson et al. (2008) used the Theory of Planned
Behavior (TPB) model which focused on the impact of the individual employees’
intentions to support organizational change, specifically a relocation of the organization.
According to Ajzen (1991) “The TPB is similar to other cognitive decision-making

47
models in that its underlying premise states that individuals make decisions rationally and
systematically through information available to them” (as cited in Jimmieson et al., 2008,
p. 239).
Jimmieson et al. (2008) chose to use TPB due to its association with the premise
that the determinant of behavior was intentions. In their study, the authors focused on
three determinants of intentions – a person’s attitude, subjective norm, and behavioral
control – and developed an 11 item instrument based on TPB questionnaire guidelines
which included a seven point Likert response scale.
In analyzing their results, the authors used descriptive measures, hierarchical
multiple regressions, and one-way ANOVA. In addition, the authors controlled for age
and gender in the hierarchical multiple regressions and found no effect on the study
variables as predictors of intention. Tests to determine group-level variability found
there was little influence and; therefore, the data could be analyzed at the individual level.
The study supported three of the Jimmieson et al (2008) hypotheses:
Employees who held positive attitudes toward performing behaviors that
supported the relocation, β = .23, p < .01, who perceived pressure from others to
complete the required activities, β = .28, p < .001, and who felt they were in
control of performing such behaviors, β = .18, p < .05, were more likely to intend
to carry out supportive activities related to the relocation. (p. 252)
The results also demonstrated the social influence of group norms and in-group
identification on an individual’s intentions to support change. Finally, the authors
concluded “from an applied point of view, the TPB is a useful framework for

48
preimplementation assessments of readiness for change as it can provide organizations
with an early indication of employee beliefs and determinants of their intentions prior to
the change event” (Jimmieson et al., 2008, p. 259).
Additional Empirical Studies to Assess Readiness for Change
Alas (2009).
Alas (2009) conducted an empirical study on the impact of work-related values on
an employee’s readiness to change, particularly “attitudes concerning change and
organizational learning” (p. 113). According to Ashkanasy, Wilderom, and Peterson
(2000) “Work-related values [is] a concept that implies the existence of particular sets of
values that govern employee work behaviour [sic] in all of its forms” (as cited in Alas,
2009, p. 115).
With regard to the first factor of readiness to change, Alas (2009) found “attitudes
to change – the benefits of the change and the competence of managers to implement
these changes – become important” (p. 114). Further, regarding the second factor, Alas
stated “the ability to adapt to change is enhanced by learning, both at the individual and
organizational levels” (p. 114). Therefore, according to Struckman and Yammarino
(2003) “the readiness factors act like a bridge between identifying what needs to happen
and the activity of implementing the change” (as cited by Alas, 2009, p. 114).
For the Alas (2009) study, the respondents completed three questionnaires
including (a) 21 items on organizational learning, both individual and collective, on a 10-

49
point Likert scale; (b) 15 items on attitude towards change with four sub-scales; and (c)
46 items related to nine work-related value groups. The data were analyzed using linear
regression stepwise analysis, t-tests, and ANOVA. Based on these results, the Alas
reported the following regarding the predictors of attitude toward change:
The LRA Stepwise method reveals that 9.8% of the variability in perceived
benefit from change - F(3, 743) = 28.1, p < .001 - and 7.1% of the variability in
satisfaction about information about change - F(4, 742) = 15.3, p < .001 - can be
explained by reference to independent variables. These figures for satisfaction
with leadership are 4.3% of the variability and - F(3, 743) = 12.3, p < .001 - and
for job satisfaction and commitment to the company 3.1% of the variability - F(1,
745) = 25.2, p < .001. (p. 118)
Alas (2009) concluded “when analyzing readiness to change, the impact of values
on employee attitude toward change and organizational learning should be taken into
consideration” (p. 115). Specifically, the author’s results demonstrated “ethical values
and business ideological values are the best predictors of attitude toward change” (p.
118). The model developed by Alas based on this research is shown in Figure 5 below.

50
Figure 5. Values-Based Change Management Model
Source: Adapted from Alas, 2009, p. 119. Used with Permission.
Elgamal (2012).
An empirical study by Elgamal (2012) used an 18-item list of descriptive
variables with a five point Likert response scale to determine the key internal and
external factors in readiness for change. The instrument was developed for the study, and
based on the results the author hoped to improve a “proposed model of the determinants
of readiness for change in small professional sub-organizations” (Elgamal, 2012, p. 45).
To analyze the data, the author used descriptive methods, t-test, and regression
analysis. The means for the variables ranged from 3.36 to 4.07 from which the author
concluded an above average readiness for change in the organization examined. The

51
t-test was used to assess the variability between groups based upon their mean scores.
The factor analysis resulted in four factors with high reliability scores to assess
readiness for change with Cronbach alpha calculations ranging between .82 and .93 and
correlation coefficients ranging from .61 to .79. The four factors were (a) visionary
leadership and competencies of planning; (b) quality of planning supporting systems; (c)
availability of resources and motivation; and (d) top management involvement (Elgamal,
2012, p. 47). From an employee engagement perspective these factors would be
considered job resources.
Elgamal (2012) highlighted three limitations to the study including the small
sample size (135 participants across 21 organizations), the use of perceptual (self-
reported) data; and that the model did not take into account external effects on readiness
for change (p. 49). Due to these limitations, the author recommended that future research
with larger organizations and a larger sample size be undertaken to ensure
generalizability of the model. However, even with these limitations, it was evident that
the employees’ job resources had a significant impact on the organization’s readiness for
change.
Rafferty et al. (2013).
Using the existing empirical research available, Rafferty et al. (2013) conducted a
theoretical review of the literature on readiness for change. The goal was to “develop a
multi-level framework that identifies the antecedents and consequences of individual,
work group, and organizational change readiness,…[and] outline[s] the theoretical

52
processes that lead to the development of individual and collective change readiness”
(Rafferty et al., 2013, p. 110).
Based on their review, Rafferty et al. (2013) concluded the three categories of
antecedents to readiness for change encompassed (a) external organizational pressures,
(b) internal context enablers, and (c) “at the individual level of analysis… personal
characteristics, whereas at the collective level, we label this category of antecedents as
group composition characteristics” (Rafferty et al., 2013, p. 121). In the resulting multi-
level framework, the authors provided antecedents within each broad category used to
assess readiness for change (Figure 6).
Figure 6. Multilevel Framework of the Antecedents and Consequences of Readiness for Change.
Source: Rafferty et al., 2013, p. 113. Used with Permission.
When considering the implications of their research, the authors questioned what
high or low readiness for change meant for an organization. Rafferty et al. (2013) posited

53
that “a low level of individual, group, or organizational change readiness may present
important diagnostic information that an organization can use to develop and improve its
approach to change” (p. 129). Further, the authors concluded “assessing readiness and
then subsequently increasing efforts to create individual, group, and organizational
change readiness may be the necessary ingredient to increase the likelihood of successful
organizational change” (Rafferty et al., 2013, p. 129). These suggested practical
applications were the benefit of the research and aligned with the goal of this researcher’s
study.
In conclusion, the research reviewed in this section provides an overview of the
significant literature on assessing the readiness for change at the individual, group, and
organizational level and includes empirical studies using quantitative descriptive
questionnaires. The topics of readiness for change and the methods to assess whether the
organization is in a proper state of readiness may provide practical implications for the
work environment; however, to begin closing the gap in the existing literature, these
concepts must be linked to the topic of work engagement
Linking Work Engagement to Readiness for Change
No empirical research was found that attempted to link the work engagement
construct and its dimensions of vigor, dedication, and absorption directly to the
organizational readiness for change construct. However, the following studies were those
closest through the authors’ efforts to link readiness for change to concepts that were
similar to, or represent a dimension or antecedent of, work engagement.

54
Madsen, Miller, and John (2005).
The study by Madsen, Miller, and Johnson (2005) pursued an understanding of
the factors that contributed to an individual’s readiness for change in an organization.
The two factors examined in their study were organizational commitment and social
relationships.
The authors conducted their study in four companies in Utah and obtained 464
usable surveys. The results “indicate a significant relationships between readiness for
change, organizational commitment, and social relationships” (Madsen, Miller, & John,
2005, p. 213). Madsen et al. (2005) results included organizational commitment strongly
linked (r = .45, p < .001) to readiness for organizational change scores (p. 224). The
authors also found “a slight relationship between social relations and readiness for change
(r = .18, p < .001)” (Madsen et al., 2005, p. 226).
While not studying the work engagement construct directly, relative to this study,
organizational commitment represents an outcome of employee work engagement in the
JD-R Model and social relationships represent a type of job resource.
Avey et al. (2008).
Avey et al. (2008) stated “central to our proposed model of the relationship of
positive employees in positive organizational change is psychological capital” (p. 52).
The authors conducted an empirical study in which they surveyed 132 employees from a
broad cross-section of organizations and jobs to research the link between positive

55
employees and organizational change. The study was conducted in two phases to
measure the independent and dependent variables separately in order to reduce rater bias.
Multiple instruments were used and included Likert-type scales.
Independent or predictor variable measurements were conducted with instruments
for PsyCap, mindfulness, and positive emotions. The dependent or criterion variable
measurements were conducted with instruments for cynicism, engagement,
organizational citizenship, and deviance (Avey et al., 2008, p. 59). Due to the number of
variables, the data analysis was detailed and completed using descriptive measures,
reliability coefficients (.80 to .95), confirmatory factor analysis, and hierarchical
regression.
From the results, Avey et al. (2008) concluded: (a) positive emotions were
positively related to emotional engagement; (b) positive emotions were positively related
to organizational citizenship behaviors; (c) positive emotions were positively related to
PsyCap; (d) positive emotions fully mediated between PsyCap and employee
engagement; and (e) mindfulness moderated the relationship between positive emotions
and PsyCap. Construct validity tests and path analysis, through structural equation
modeling, were used to develop and confirm the model by Avey et al. (Figure 7).

56
Figure 7. Impact of Psychological Capital, Mindfulness, and Positive Emotions on Attitudes and Behaviors
Relevant to Positive Organizational Change
Sources: Avey et al., 2008, p. 51. Used with Permission
Based on their study, the following was one of the authors’ key findings regarding
these employees: “psychological capital (consisting of hope, efficacy, optimism, and
resilience) was related to...positive emotions that in turn were related to...attitudes
(engagement and cynicism) and behaviors (organizational citizenship and deviance)
relevant to organizational change” (Avey et. al, 2008, p. 48).
This discussion attempted to directly link the work engagement concept of
PsyCap to organizational change readiness. It should be noted that the authors’
description of PsyCap included efficacy, optimism, and resilience which are the elements
of personal resources in the JD-R model demonstrated as antecedents to employee
engagement. Further, the authors associated their concept of engagement to behaviors
important for organizational change including organizational commitment – an outcome
shown in the JD-R model.
Psychological Capital
Mindfulness
Positive
Emotions
Employee Behaviors: -Organizational Citizenship
-Deviance
Employee Attitudes: -Engagement
-Cynicism

57
Weiner (2009).
Through his review of the literature, Weiner (2009) developed a conceptual
framework for organizational change which included what he refers to as determinants of
implementation effectiveness of organizational change (Figure 8). The determinants
comprised organizational change readiness and change-related effort. Weiner defined
“organizational readiness as a shared psychological state in which organizational
members feel committed to implementing an organizational change and confident in their
collective abilities to do so” (p. 1).
Figure 8. Determinants and Outcomes of Organizational Readiness for Change.
Source: Weiner (2009). Used with Permission.
In this framework, Weiner (2009) provided pre-determinants for organizational
readiness for change. These pre-determinants included contextual factors in the
organization such as culture, resources, structure, past experience, and policies and
procedures; informational assessment including task demands, resource perceptions, and
situational factors; and the employees’ belief that the change is important – change
valence (Weiner, 2009, p. 4).
Possible Contextual Factors*
Organizational culture
Policies and procedures
Past experience
Organizational resources
Organizational structure
Change valence
Informational assessment
Task demands
Resource perceptions
Situational factors
Organizational Readiness for Change
Change commitment
Change efficacy
Change-Related Effort
Initiation
Persistence
Cooperative behavior
Implementation Effectiveness
* Briefly mentioned in text, but not focus of the theory

58
There was no empirical evidence in the work by Weiner (2009) that directly
connects any of the specific work engagement factors used in this study to readiness for
change. However, commitment to the organization was an outcome demonstrated in the
JD-R Model and it should be considered that commitment to the organization may
influence commitment to a change effort. Further, the contextual factors highlighted by
Weiner align with the concept of job resources which are one of the antecedents to work
engagement.
Spreitzer et al. (2010).
Though not empirical research, Spreitzer et al. (2010) conducted a thorough
review of the literature on employee engagement and thriving. Porath, Spreitzer, and
Gibson (2008) stated “thriving contributes to positive adaptation amidst a changing work
environment” (as cited in Spreitzer et al., 2010, p. 134). Specifically, thriving workers
were more resilient in the face of work-related difficulties. This resilience was attributed
to thriving in the form of sense-making, defined as “the process of creating situational
awareness and understanding in situations of high complexity or uncertainty in order to
make decisions” (Spreitzer et al., 2010, p. 138).
Based on the study of the literature, Spreitzer et al. (2010) reported “through
enhanced sense-making, employees…anticipate problems in advance, and respond
promptly to adverse events in a flexible…way” (p.138). Finally, according to the
authors, thriving and engagement, via its subscales, have similar characteristics including
positive emotions, energy, resilience, and persistence during difficult times.

59
In conclusion, there are several commonalities from the research by Spreitzer et
al. (2010) that support this author’s study. In particular, in the JD-R model, resilience is
considered one of the primary personal resources which are antecedents to work
engagement; and energy (vigor) and persistence (dedication) are dimensions of employee
engagement as defined for this study. Therefore, the research by Spreitzer et al. supports
the perspective that an organization’s readiness for change would benefit from employees
that garner these characteristics including an improved adaptability and flexibility toward
change.
Harter, Schmidt, Agrawal, and Plowman (2013).
There was substantive empirical research found between employee work
engagement and organizational outcomes. For example, in their review of the literature,
Kim (2014a) and Kim et al. (2013) found that employee engagement was related to
turnover intention and performance results for the individual and the organization.
In their work, Harter et al. (2013) completed a meta-analysis of 263 studies
conducted across 192 organizations in 34 countries. They concluded the relationship
between employee engagement and performance at the business/work unit level was
substantial and highly generalizable across organizations.
Their “results indicate high generalizability, which means the correlations were
consistent across different organizations. The true score correlation between employee
engagement and the composite performance indicator was 0.42” (Harter, Schmidt,
Agrawal, & Plowman, 2013, p. 2). The caveat, however, is that they used nine different

60
organization performance indicators with none of the indicators being organizational
readiness for change.
Ghitulescu (2013).
Ghitulescu (2013) conducted research on the relationship between employees’ job
resources, job demands, the work context, and employee performance outcomes to
organizational readiness for change. The research by Ghitulescu was perhaps closest to
this study; however, while the author briefly referenced the JD-R model, the research did
not incorporate the full construct of work engagement or the personal resources
antecedent as an influence on employee engagement or performance behavior.
The study was framed in the following way: “The job demands-resources theory
provides insights into the factors (i.e. job resources and demands) that facilitate an
employee’s work engagement and encourage adaptivity and proactivity” (Ghitulescu,
2013, p. 213). The purpose of the research was to provide managers with an
understanding of the “impact of work contexts on proactivity….regardless of individual
characteristics or personality traits” (Ghitulescu, 2013, p. 208) so they can shape the
environment to provide opportunities for adaptive and proactive employee behaviors.
According to Griffin, Parker, and Mason (2010) in order to “cope with dynamic
environments and enact change, organizations expect employees not only to work harder
but also to engage in change-oriented behaviors, such as adapting to changing conditions
and proactively anticipating new challenges” (as cited in Ghitulescu, 2013, pp. 206-207).
Further, Ghitulescu (2013) stated “scholars have argued that organizational success

61
increasingly depends on employees taking personal responsibility for change and [in
particular] cite…workplace concepts [including] psychological empowerment,
organizational citizenship, proactivity, and personal initiative” (p.207).
Relating the study to organizational readiness for change, Ghitulescu (2013)
proposed that “adaptivity and proactivity are important aspects in the change adoption
and institutionalization phase” (p. 209). After reviewing the extant literature, Ghitulescu
synthesized these concepts and their impacts during times of change (Figure 9).
Illustrations in various types of change
Change-oriented behavior
Importance to change management
Incremental/ evolutionary
Frame breaking/ revolutionary
Adaptive behavior Adaption to new circumstances in work environment
Employee acceptance of change
Coping with changes in core tasks in uncertain environment (Griffin et al.,
2010)
Adapting to task changes during organizational restructuring (Griffin et al., 2010)
Proactive behavior Implementation of organizational change
Employee support for change
Initiate organizational change from below
Contribution to organizational innovation
Taking charge to initiate change at work (Morrison & Phelps, 1999)
Continuous improvement behavior (Fuller et al., 2006)
Proactive problem solving (Crant, 2000; Parker et al., 2006)
Proactive modification of product design (Frohman, 1997)
Initiating improvements in tasks during organizational restructuring (Griffin et al., 2010)
Figure 9. Adaptive and Proactive Behavior-the Impact on Change Management
Source: Ghitulescu, 2013, p. 210. Used with Permission.
With the framework developed, Ghitulescu (2013) conducted a multi-level study
in a school setting during the implementation of a district-wide change effort. The first
stage included observations and interviews with teachers, and interviews with

62
administrators and subject-matter experts. For the second stage the researchers
developed a survey instrument using 20 behavior statements developed from the
qualitative data obtained in the first stage. Using a Likert-type survey, 621 special
education teachers were asked to respond to how frequently they engaged in the behavior.
The author noted that while educators in general tended to be adaptable due to the
demands of the classroom, special education teachers in particular have high demands for
adaptability and proactivity due to the nature of the challenges faced each day.
The data were analyzed using descriptive measures, hierarchical linear modeling,
confirmatory factor analysis, correlation measures, and simple regression techniques.
The results demonstrated that adaptivity and proactivity behaviors related to features of
the job, or job context. Also, it was found that teacher’s task discretion and the social ties
they enjoyed had a positive impact on adaptivity and proactivity. Therefore, during
change efforts, Ghitulescu (2013) recommended increasing job resources such as task
discretion and social ties to create an environment which facilitates employee adaptive
and proactive behavior.
Discussing the implications of the study, Ghitulescu (2013) made a link between
individual behavior and the success of organizational change in the following way:
Change that alters performance goals and work roles encourages employees to
adapt to changing demands, as well as anticipate, plan ahead, and act in advance
to create change. Our research underscores the importance of individual
behavioral change in models of planned organizational change. Indeed, without

63
individual behavioral change, successful organizational change is not possible. (p.
233)
Further, the author concluded that the skills of adaptivity and proactivity “allow
individuals to…initiate changes in their work that are consistent with the larger change
effort….[They will be] more committed to the change process, will internalize the change
effort, and contribute to its institutionalization” (Ghitulescu, 2013, p. 209). Ghitulescu
(2013) also highlighted the need for “active participation…[which] contribute[s] to
increased feelings of efficacy that underlie employees’ readiness for change and their
motives to support the change” (p. 209).
In conclusion, the study by Ghitulescu (2013) supported the idea an
organization’s environment (i.e. climate and culture) can influence the employee to
become more adaptable and proactive and should be considered essential during change
efforts. In addition to the job contexts mentioned previously, environmental factors that
the author discussed include relational factors such as trustworthy managers, a supportive
work environment, and the organization’s culture (i.e. job resources in the JD-R model).
This study, therefore, confirmed the idea that engaged employees, supported by their job
resources, were more likely to behave in ways that prepare for and facilitate
organizational change. This conclusion supported this researcher’s study.
As discussed previously, efficacy is one of the personal resources represented in
the JD-R model as an antecedent to work engagement; however, the stated focus of this
study by Ghitulescu (2013) was on job resources, organizational context, and the
mediating role of job demands. Yet, even with such a strong focus the author found it

64
necessary to indicate the influence of job resources and job demands on employee
“feelings of efficacy [a personal resource] that “underlie the employees’ readiness for
change and their motives to support the change” (Ghitulescu, 2013, p. 234). The absence
of additional consideration of the personal resources antecedent on employee engagement
and readiness for change highlighted how the study by Ghitulescu (2013) diverges from
the study by this researcher.
While no study found to date examined the direct relationship between the
employee work engagement and organizational change readiness constructs, in the
various ways noted, the literature indicated a strong link that should be tested through
focused research. The study undertaken with the employees of MA member companies
empirically examined this relationship.
Conclusion
This review of the literature on the topics of employee work engagement,
organizational readiness to change, and related concepts provided some rich conclusions.
First, an overview of key theories and models related to work engagement were
highlighted in order to illustrate the impact of the personal resources and job resources on
engagement, behavior, and organizational outcomes. Next, when seeking definitions of
readiness for change it was found this was not just an organizational construct, but one
linked to individual employees and their perceptions of the change effort. These
perceptions included how the change would benefit them and the organization, the
availability of resources, and the level of communicated management support.

65
In addition, a review of the literature was made to seek common organizational
characteristics indicating a readiness for change. Common themes found in the research
reviewed included: clear mission and strategy; flexible policies; and an organizational
climate supporting human relations and open systems, such as a learning organization.
From the research, it was clear the individuals in the organization were impacted by these
characteristics and this influenced their readiness for change in terms of energy,
engagement, and openness to learning.
Further, a review was conducted to examine the literature regarding methods to
assess readiness for change. The research found on this topic provided a broad overview
on assessment at the individual, group, and organizational levels. The literature
comprised research on both theoretical studies and empirical assessment methods
including quantitative studies using descriptive questionnaires such as the OCM used in
this study.
Finally, an examination was made of the literature to investigate a potential link,
empirically tested, between employee work engagement and an organization’s readiness
to change. The research demonstrated the reciprocal relationship of the individual and
the organization with regard to readiness for change. In particular, the affective
component of the individual was critical to an organization and should be addressed long
before a change intervention was needed, planned, or implemented. This affective
component was key to an employee’s level of work engagement and, therefore, also to
the individual’s and organization’s readiness for change.

66
In conclusion, by building on the JD-R model, this literature review attempted to
determine whether: (a) job resources and personal resources together impact an
employee’s level of work engagement; (b) this level of engagement impacts individual
outcomes such as organizational commitment, personal initiative, extra-role behavior,
and performance; and (c) this level of engagement also appears to be related to the
individual’s and organization’s readiness for change.
Finally, it was determined that additional research was needed on the link
between the employee’s level of work engagement and an organization’s readiness for
change. Empirical research using valid assessment tools to measure employee work
engagement and organizational readiness for change, respectively, may establish a
stronger relationship than what was found in the literature. Establishing this relationship
was the focus of this study. The next chapter discussed the methodology used in this
empirical research.
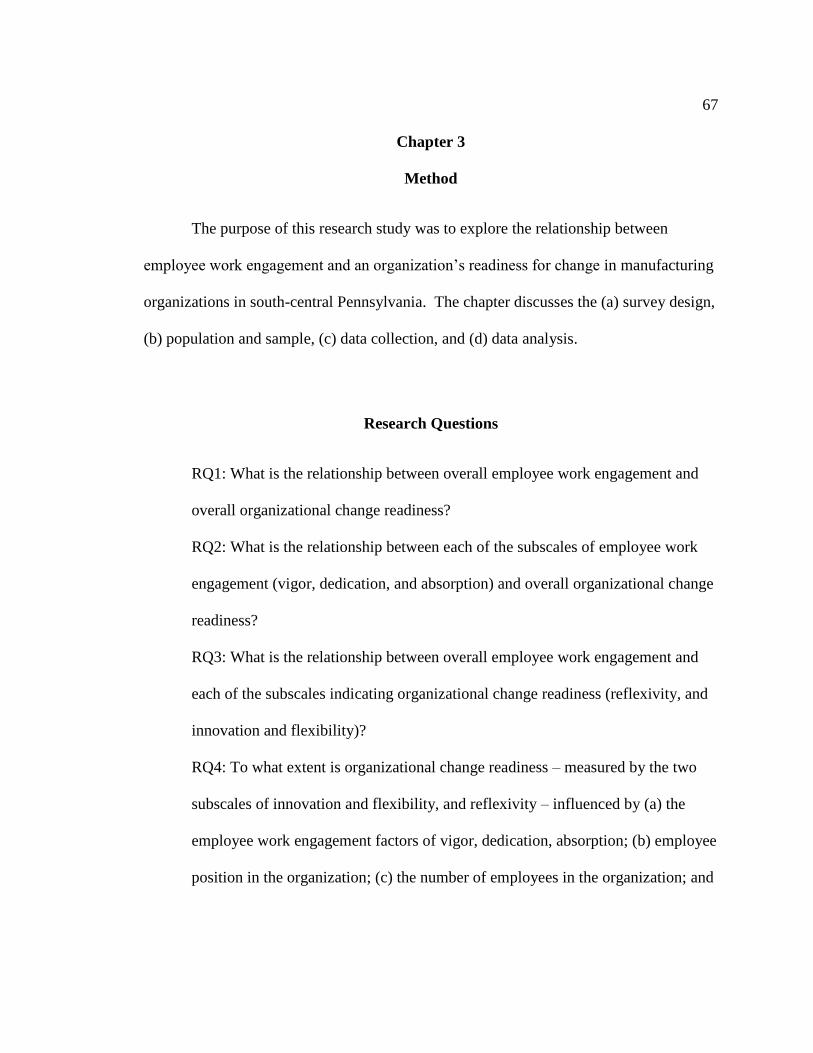
67
Chapter 3
Method
The purpose of this research study was to explore the relationship between
employee work engagement and an organization’s readiness for change in manufacturing
organizations in south-central Pennsylvania. The chapter discusses the (a) survey design,
(b) population and sample, (c) data collection, and (d) data analysis.
Research Questions
RQ1: What is the relationship between overall employee work engagement and
overall organizational change readiness?
RQ2: What is the relationship between each of the subscales of employee work
engagement (vigor, dedication, and absorption) and overall organizational change
readiness?
RQ3: What is the relationship between overall employee work engagement and
each of the subscales indicating organizational change readiness (reflexivity, and
innovation and flexibility)?
RQ4: To what extent is organizational change readiness – measured by the two
subscales of innovation and flexibility, and reflexivity – influenced by (a) the
employee work engagement factors of vigor, dedication, absorption; (b) employee
position in the organization; (c) the number of employees in the organization; and

68
(d) organizational changes experienced by the employee, including new
leadership, reorganization, downsizing, and/or merger/acquisition?
Study Design
This research study was conducted using quantitative methods. The research
represents descriptive correlational research. A questionnaire was used with a total of 28
items. First, the survey combined inventory items from two validated instruments: the
nine-question Utrecht Work Engagement Survey (UWES-9) and two subscales of the
Organizational Climate Measure (OCM) that comprised 11 questions. Content validity
for the final instrument was established based upon a review by a panel of experts and the
Executive Director of MA.
Next, in order to obtain context and identify any possible limitations to the study
based upon the respondents’ characteristics, seven descriptive items gathered data on the
(a) participant’s position within the organization; (b) the number of years in their current
position; (c) whether the organization was a manufacturing or non-manufacturing
business; (d) whether the organization was union or non-union; (e) the number of full-
time employees within the organization ; (f) the types of changes the employee had
experienced; and (g) whether the respondent had ever been actively involved in a change
effort. The position titles and the categories for number of employees were determined
by the MA representatives to be those that would be most recognizable to the employees
in the association’s member companies. Further details regarding these items were
provided in the instrumentation section below.

69
Finally, beyond the 27 items described above, one qualitative question was asked
to determine what influences (personal or workplace) contributed most to the
respondents’ desire to do their best at work. According to Kim et al. (2013) “inclusion of
a short-answer, critical incident, or interview component, along with quantitative
methods,...allow[s] researchers to explore issues in greater detail and to augment the
quantitative findings” (p. 263).
The survey conducted was cross-sectional as it measured individual employee
self-reported work engagement and individual employee’s perceptions regarding their
respective organization’s change readiness at one particular time. While two
organizations chose to duplicate and administer a paper survey, the single-stage research
was primarily conducted by emailing the respondents a link to a web-based survey. One
benefit of the survey method employed in this research was the ability to gather data on
multiple variables using existing, validated, and reliable instruments. In addition, as the
sample was geographically diverse across several organizations, the online method
allowed a cost-efficient and time-efficient way to reach the maximum number of
potential respondents (Fowler, 2014, pp. 68-69). Overall, it may also have been more
convenient for the respondents in terms of the receipt, completion, and return of the
questionnaire.
The potential efficiencies of electronic surveys were supported by Dillman (2007)
as this format eliminated the costs related to paper, postage, and data entry and reduced
the time for survey implementation to days or hours (p. 352). Dillman made a distinction
between email surveys and Web surveys; the latter most closely represented the style of

70
this study. Also, web-based surveys provided a more polished appearance and various
capabilities that benefitted the respondent including the opportunity for quick access
instructions; drop down menus of standard responses; and the ability to add color, shapes,
images, and animation (Dillman, 2007, p. 354).
Further, Dillman, Smyth, and Christian (2014) asserted web-based surveys were
the “fastest growing form of surveying occurring in the United States, as well as
throughout most of the world....[and] is especially attractive because of speed, low cost,
and economies of scale” (p. 301). The authors reported people were comfortable and
familiar with online activity and, therefore, may be “more receptive to completing
surveys online (Dillman, Smyth, & Christian, 2014, p. 302).
An important consideration related to study design and data collection procedures
was response rate. According to Fowler (2014), the three main issues with response rates
included “access, motivation, and cost” (p. 54). Utilizing an online survey makes an
assumption regarding the potential respondents’ access to technology as a routine part of
the job tasks; however, if no such availability were found to exist, the lack of access must
be considered a limitation of the study. An expanded discussion regarding response rates
for Internet surveys can be found in the next section related to sample size.
Population and Sample
The population for the study consisted of individual employees of manufacturing
organizations who were members of the Manufacturers’ Association of South-Central
Pennsylvania (MA). This organization had approximately 400 member manufacturing

71
and non-manufacturing companies with approximately 200,000 working employees in
total (M. Smeltzer, personal communication, January 15, 2014). With the administrative
help of the MA Executive Director, Tom Palisin, specific companies from the
membership list were contacted regarding the opportunity to participate in the research.
Though all organizations contacted did not participate, a number of organizations
supported the study and their employees comprised the respondent pool. The unit of
analysis is, therefore, the individual employee.
For data analysis purposes and generalizability it was important to have a large
enough completed sample in order to assume normalcy and representativeness in the data
distribution. To calculate the minimum sample size needed to meet these criteria, one
could use a variety of methods. The following methods were examined prior to
calculating this study’s required sample size. The applicability of each to this study is
discussed.
According to Tabachnick and Fidell (2007), a standard calculation should be 50 +
8 (m) + m, where m was the number of variables in the study. The minimum sample size
(n) for a study with seven variables; therefore, would be 113 employees. If a study
incorporated multiple regression, Urdan (2010) stated the researcher should have at least
30 + (10 * each study variable). Using this calculation, a study with seven variables
would require a sample (n) of at least 100 individuals. Multiple regression analysis was
used in the data analysis phase of this study; therefore, this sample calculation method
was relevant and obtaining this sample size was critical.

72
However, according to Smith (2013), sample size can be calculated considering
three factors, confidence interval, confidence level (z-score), and standard deviation, in
the following way: “Necessary Sample Size = (Z-score)² – StdDev*(1-StdDev) / (margin
of error)²” (para. 11). So, according to Smith, for a study with a confidence interval of
+/- 5%, a confidence level of 95% (which equals a z-score of 1.96), and a standard
deviation of .5, the necessary sample size is approximately 385 individuals. This result
was significantly different from the prior two methods.
Finally, Dillman et al. (2014) provided another method to calculate sample size
when using simple random sampling. Using a standard 95% confidence interval, the
authors provided a table that allowed one to determine an appropriate sample size based
on a population estimate (16 choices from 100 to 1 billion); an acceptable sampling error
(± 10%, ± 5% or ± 3%); and the homogeneity of the population relative to the topic of
interest (80/20 or 50/50) (p. 80). Therefore, using the table, if this study assumed a
population of 2,000; a sampling error of ± 5%; and an 80/20 split of homogeneity, the
appropriate sample size for the study would be 219 individuals. However, changing the
homogeneity split to 50/50, which Dillman et al. consider the conservative assumption on
variance, the sample size would increase to 322 individuals (pp. 78, 80). Though
calculated differently, this latter figure was similar to that of Smith (2013).
Conversely, Fowler (2014) disagreed with most standard methods of calculating
sample size, even those discussed above, and stated (a) sample size should be based upon
the researcher’s analysis plan and (b) a larger sample provides increased reliability of the
data analysis results. In particular, it was important to consider sub-groups within the

73
population and obtain the minimum sample to ensure adequate representation of the sub-
groups (p. 39). This method for obtaining a proper sample size was also supported by Dr.
Edgar Yoder, a Professor of Extension Education at Penn State University and the
methodologist for this dissertation (E. Yoder, personal communication, June 17, 2014).
For this study, the researcher used the sample size method recommended by
Fowler (2014). Three sub-groups were considered based upon an employee’s managerial
(or non-managerial) position within the organization. If an appropriate sample size
(approximately 30 or more individuals per subgroup) of a sub-group was not obtained,
any data related to that sub-group was examined to determine its inclusion in or exclusion
from the data analysis due to its potential as a limitation to the study.
Survey Response Rate.
In addition to sample size, survey response rates must be considered as they
influence credibility of research and the generalizability of findings. Prior to conducting
the formal research, a pilot study was recommended by the researcher to MA; however,
MA declined the opportunity. The Executive Director, due to past experience with the
member companies, advised that a pilot study would likely reduce involvement in a final
study. Therefore, to strengthen response rate, the identification of potential survey issues
and the implementation of other research strategies were critical to obtain an adequate
response.

74
Potential Issues.
Fowler (2014) reported surveys conducted via the Internet can obtain mixed
results and respondents may be less likely to respond versus a mail-only survey.
However, Fowler found if the proposed respondents were those that routinely used the
Internet and received the survey from a familiar source; they were more likely to respond.
Therefore, in this study, it was a concern that non-managerial employees would
not have routine access to the Internet during the normal course of fulfilling their job
duties. This potential nonresponse could have entered a bias into the data and created a
limitation that reduced the completed sample to only those employees at managerial
levels. This latent bias was the primary aim for the survey participants to select a
response which broadly indicated their position in the organization.
Further, this issue was addressed with the company representatives and
assurances were provided to the researcher that non-managerial employees would be
given the opportunity to complete either the web-based or paper surveys. Finally, the
SPSS analytical software allowed the researcher to view the data based on position and
determine whether each of the position sub-groups were adequately represented in the
completed sample. The participation of non-managerial employees was no longer
considered a limitation to the study; therefore, strategies were implemented to increase
the study’s overall response rate.

75
Strategies to Increase Response Rates.
According to Fowler (2014), Internet surveys were similar to postal surveys and,
therefore, the steps used in postal surveys to encourage response cooperation can be used
for Internet surveys. Dillman (2007) found “implementation procedures have a greater
influence on response rates….[including] multiple contacts,…incentives,…sponsorship
and how it is explained” (p. 149). Therefore, these and the following similar steps,
recommended by Fowler, were implemented: “identifiable sponsors, well-designed
instruments, financial incentives, and repeated contacts” (p. 54).
First, if the survey was received from a researcher who was an unfamiliar source
to the potential respondent, it may have reduced the response rate. Therefore, to avoid
this issue, the survey was sent from, or provided by, each participating organization’s
own representative to the respondents. Further, the President or CEO of the respondent’s
organization was the visible sponsor of the survey.
Second, the instrument was well designed and validated for conducting either a
web-based or paper survey. The Dillman (2007) guidelines for creating a respondent-
friendly questionnaire were applicable to this study’s instrument including “questions that
are clear and easy to comprehend, a question order that suggests high salience to the
respondent, and a question layout…for comprehension and easy response” (p. 150).
High salience questions encompassed those that ask “about current behaviors or
interests” (Dillman, 2007, p. 155). Additional recommendations by Dillman et al. (2014)
for well-designed web-based surveys were incorporated into the questionnaire: (a) use a
consistent page layout, (b) allow respondents to back up in the survey, (c) do not require

76
responses to questions, and (d) permit the survey to be stopped and completed at a later
time (pp. 318-327).
Third, a financial incentive was offered to the respondents. The MA
representatives agreed a drawing for a gift card award created an excellent and positive
inducement for survey participation. According to Fowler (2014), rewards improve
overall response rates and may also “reduce non-response bias resulting from those most
interested in a topic being overrepresented in samples – by including some less interested
people to respond who otherwise would not” (p. 51).
For the purpose of awarding incentives in postal surveys, the literature described
several methods to track respondents. For example, Ghitulescu (2013) had the
respondent send the completed surveys to a third party where a code was assigned (p.
222). On the other hand, Avey et al. (2008) offered a method appropriate for online
surveys. In their research, the respondents signed the informed consent form by
providing their email address and were then assigned a randomly generated code for
tracking (Avey et al., 2008, p. 58).
For the incentive award process in this study, a system was devised to (a) collect
the email address or phone number of those who chose to enter into the drawing and (b)
ensure their anonymity. Respondents who completed the web-based survey were offered
a link to a second and separate survey for the incentive drawing. For the paper surveys, a
page was included for the respondents to complete and they were instructed to separate
this page from the rest of the survey prior to submission. In both cases, the respondent
opted in to the drawing and voluntarily provided their contact information while their

77
anonymity was maintained. After the survey closed, the MA Executive Director, Tom
Palisin, conducted the award drawing by a random pick of the four winners.
Finally, Dillman (2007) stated the primary factor in improving response rates was
the number of contacts with the potential respondents with incentives as a close second.
The number of contacts during implementation was explained in the following way: “the
strategy of using multiple...contacts that are strategically timed...is more important than
using...[an] exact system of contacts” (Dillman et al., 2014, p. 373). The authors
indicated the organization and its culture should be the major influence on how
respondents were contacted.
Further, according to Dillman (2007), under social exchange, varying the content
of each contact was more impactful than those that were repetitious (p. 151). However,
each contact must be related to the others to provide consistency of message. Finally, in
order to reduce nonresponse it was important each communication created a positive
impression that increased the perceived rewards of participation; decreased the perceived
costs of participation; and established trust (Dillman, 2007, p. 155).
Therefore, this research study incorporated several contacts with potential
respondents, facilitated by the MA and company representatives, at approximately seven
to ten day intervals. The web-based contacts included messages that varied, including (a)
an initial recruitment email; (b) an email with cover letter and survey link; (c) a follow up
email that incorporated a thank you and reminder to complete the survey; and (d) a final
reminder email that encouraged immediate action from those who had not completed the
survey and indicated that the survey was closing on a specific date.

78
The paper surveys were conducted in a similar manner with the distribution of the
recruitment cover letter and survey initiated by the company representative. The
distribution information included an explicit due date and collection information.
Subsequent notifications were provided as reminders.
Next, additional strategies for increasing response rates implemented in this study
are discussed. Dillman (2007) and Dillman et al. (2014) addressed survey response rates
as a social exchange between the researcher and the respondents. Based on this
philosophy, Dillman developed survey procedures called the Tailored Design Method
(TDM). According to Dillman et al., tailored design comprised “customizing survey
procedures for each...situation based upon knowledge about the topic and sponsor of the
survey, the...people who will be asked to complete the survey, the resources available,
and the time frame for reporting results” (p. 16).
The goal of tailored design was the reduction of survey errors including sampling
errors, coverage errors, measurement errors, and nonresponse errors. TDM used a three-
pronged approach to reduce the respondent’s reluctance to participate in a survey. For
the respondent, the survey must have (a) increased the perceived benefits of participating;
(b) reduced the costs of participating; and (c) promoted the establishment of trust
(Dillman et al., 2014, p. 27).
In the updated TDM, Dillman et al. (2014) provided five recommendations to
establish trust; nine to increase benefits; and nine to decrease the costs of participation for
the respondent (pp. 27-41). These recommendations can be incorporated in the research
questionnaire and the implementation process. The instrument used in this study was not

79
changed to incorporate these specific recommendations; however, they were built into the
recruitment message communicated to the questionnaire recipients. Recommendations
by Dillman et al. used to increase response rates in this study are shown in Table 2.
Table 2.
Dillman et al. (2014) Response Rate Recommendations Applied
Area Recommendations Applied
To Establish Trust Provide methods to assess the authenticity of the
survey and ask questions about it
Sponsorship by a legitimate authority
Assure confidentiality and protection of data
Design communications with professionalism in mind
Make the task appear important
To Increase Benefits Discuss how the survey results will be used
Ask for assistance
Sponsorship by a legitimate authority
Give tangible rewards
Show positive regard (Dillman, 2007)
Say thank you (Dillman, 2007)
To Reduce Costs Make questionnaire short and easy
Avoid subordinating language
Make it convenient to respond
Minimize requests to obtain personal information

80
Data Collection
The data were collected via a cross-sectional, quantitative survey. In order to
obtain the largest sample possible, overall and within each sub-group, the survey link was
emailed to all members of the participating organizations for which an email address was
available. However, this was completed through a two-step process required by MA due
to the proprietary nature of employee contact information. In step one, an email with the
survey link and instructions was sent by the researcher to one contact within each
participating organization. In step two, the contact sent a blast email with the survey link
to the members of their organization with email. Subsequent reminders were sent out by
the same contact. The benefit of this process; however, was that it demonstrated visible
sponsorship by the organization.
Upon receipt of the email, the respondents followed the provided link to a
Qualtrics survey and the completed responses were captured by the software. Each
respondent was limited to one submission using the software’s customized settings.
Upon completion of the survey, the respondents reached the Thank You screen and had
the opportunity to voluntarily select the incentive link.
However, in two organizations, as the number of employees without email was
substantial, the recruitment letter and survey were printed by the company representatives
and distributed. A due date and reminders were provided by the same representatives.
This paper method; therefore, required these organizations to collect the survey responses
differently. One organization provided each respondent with an envelope within which
to seal their completed survey. These respondents had the option of mailing the survey

81
directly back to the researcher or placing the envelope in a larger collection envelope sent
to the researcher. The second organization collected the surveys and forwarded them on
to the researcher. In the latter case, as directed, the incentive page was detached by the
respondent prior to submission. Paper-based survey data were entered into the Qualtrics
system by the researcher.
Therefore, in both the web-based and paper methods, the respondents to the
survey remained anonymous. While the survey gathered the respondents’ descriptive
information, there were no identifiers that linked responses to a particular person. This
level of anonymity eliminated the opportunity to follow up with individual non-
respondents; however, the organization representatives communicated with their
company employees two to three times to remind them to complete the survey.
In conclusion, the total number of employees to receive the emailed and paper
surveys for this study was 293. Within this sample, those individuals that read the
consent form and chose to move to the survey instrument were considered to have
provided their implied consent. Reminder emails and notifications were conducted by
the company representatives at appropriate intervals (approximately seven days),
prompted by the researcher. The response rate calculation, therefore, was based on the
number of employees that received the survey and those whose response was considered
complete for survey items 8-27. The total completed employee sample was 172
individuals for a survey response rate of 58.7% (Table 3). Finally, the sample size and
response rate obtained were determined to be acceptable for all levels of analysis.

82
Table 3.
Research Study Response Rates
Sample Completed Sample Survey Response Rate
293 172 58.7%
Instrumentation.
The survey instrument comprised 28 items including seven demographic
questions, one qualitative question, and 20 responses measured via a summative (Likert)
scale (See Appendix C) which comprised the UWES-9 and OCM instruments, described
in detail below. Content validity for the final instrument was established based upon a
review by a panel of experts and the Executive Director of MA.
While in the past there had been a question as to the appropriateness of treating
summative scale scores as representing interval scale data, “Likert (1932) himself argued
that his scaling technique correlated close to…the results of Thurstone’s (1929; Thurston
[sic] & Chave, 1929) equal-appearing interval method” (Meyers, Gamst, & Guarino,
2006, p. 23). However, since the mid-twentieth century, it has been common practice to
use the summative response scale score as meeting interval scale properties (Meyers et
al., 2006).
Data were primarily collected via a web-based survey emailed to potential
respondents. The email included a survey link that took the respondent to an online
questionnaire consisting of 28 items. Seven descriptive questions were used to obtain
context and identify any possible limitations to the study based upon the respondents’
characteristics. Specifically, these items gathered data on the:

83
participant’s position within the organization (non-manager, first-level
supervisor, or executive);
the number of years in their current organization (<1, 1-5, 6-10, 11-15, or
>15);
whether the respondent’s organization was a manufacturing or non-
manufacturing business;
whether the organization was union or non-union;
the number of employees within the organization (1-50, 51-100, 101-200,
201-300, or >300);
the types of organizational changes the respondent had experienced at any
time in their career (reorganization, new leadership, downsizing,
international expansion, merger/acquisition, or other); and
if the respondent had ever been actively involved in a change effort.
The position titles and the categories for number of employees were determined
by the MA representatives to be those that would be most recognizable to the employees
in the association’s member companies.
Beyond the 27 questions described, one qualitative question was asked to
determine what influences (personal or workplace) contributed most to the respondents’
desire to do their best at work. The results for the descriptive questions and the
qualitative question were specifically used to determine (a) potential study limitations
related to the data, (b) discussion opportunities, (c) underlying influencers, and (d) areas
of future research.

84
Utrecht Work Engagement Scale (UWES).
The UWES questionnaire used was used for items 8-16 on the survey. The
UWES was a self-reporting survey and measured employee work engagement including
the three dimensions of work engagement: vigor, dedication, and absorption. It has been
one of the most popular instruments for measuring employee work engagement, has been
translated into 21 languages, and includes student versions. “An international database
exists that currently includes engagement records of over 60,000 employees” (Schaufeli
& Bakker, 2010, p. 16).
Further, the data from the instrument can be analyzed using the total of all three
subscales, or each of the subscales respectively. There were three forms of the UWES
instrument to choose from – the UWES-17, the UWES-9, and the UWES-6 – with the
integer indicating the number of items in the survey. Research demonstrated that the
UWES-6 was the least used of the forms; the UWES-9 was the most popular.
The UWES-17 used 6 items to measure vigor, 5 items for dedication, and 6 items
for absorption. Tests for validity, variance, consistency, and stability have all shown the
instrument to be effective in measuring work engagement over time (Schaufeli & Bakker,
2003, pp. 7-8). The UWES-17 provided an internal consistency, Cronbach’s alpha, of .80
to .90 (Schaufeli, Bakker, & Salanova, 2006, p. 703).
Following the development of the UWES-17, and after a study of 14,521 people
in 10 different countries, Schaufeli, Bakker, and Salanova (2006) found that the UWES-
17 questionnaire could be reduced to nine items. The UWES-9 “have acceptable
psychometric properties” (Schaufeli et al., 2006, p. 701). “The factorial validity of the

85
UWES-9 was demonstrated using confirmatory factor analyses, and the three scale scores
have good internal consistency and test-retest reliability” (Schaufeli et al., 2006, p. 701).
For example, the authors found that the UWES-9 has a higher internal consistency with a
Cronbach’s alpha of .85 to .92 (Schaufeli et al., p. 709).
The UWES-9 was used in this study and the Cronbach’s alpha for the EWE scales
was .905 (.91). Due to the reduced number of items in the questionnaire, the UWES-9
used three items to measure each of the three subscales of work engagement. All items
of the UWES-9 were measured with a 7-point Likert scale with a range from (0) never to
(6) always. Sample items on the questionnaire included: “When I get up in the morning,
I feel like going to work.” to measure vigor; “I am enthusiastic about my job.” to measure
dedication; and “I get carried away when I am working.” to measure absorption
(Schaufeli et al., 2006, p. 714). The UWES-9 was administered using Qualtrics software,
therefore, the reported scales for analysis ranged from (1) never to (7) always.
In conclusion, the UWES-9 instrument was used in this study, represented by
items 8-16 on the survey administered, and obtained a Cronbach’s alpha score of .905.
Organizational Climate Measure (OCM).
The OCM was a self-reporting survey and included 17 dimensions or subscales in
total. Patterson et al. (2005) validated the instrument and linked it to managerial
practices, innovation, and productivity. In addition, Patterson et al. validated the
subscales for independent use in order for researchers to use as applicable to their
particular study. Therefore, for this study, two subscales comprising 11 items were used

86
to indicate readiness for change: (a) innovation and flexibility, and (b) reflexivity. These
items were represented in items 17-27 on the instrument for this study.
Research to validate the OCM instrument was conducted in 55 manufacturing
organizations in the United Kingdom with companies ranging from 60-1929 employees
with 12,051 questionnaires distributed via mail and in on-site interviews (Patterson et al.,
2005, pp. 387-388). The original design of the OCM included 19 subscales, but was
refined by removing one and combining two which resulted in the 17 subscales in the
validated measure. The factors of Innovation and Flexibility, with a very strong
correlation of .94, were combined due to the researchers’ interest in using factors that
measured distinct areas of an organization’s climate.
The 17 dimensions included in the refined OCM provided Cronbach’s alpha
values of .73 or higher with the exception of one subscale. The Cronbach’s alpha values
for the subscales used in this study to indicate readiness for change were .86 for
Innovation and Flexibility, and .76 for Reflexivity demonstrating strong internal
consistency (Patterson et al., 2005, pp. 391, 394). The Cronbach’s alpha for the overall
RFC scale in this study was measured as .928.
The Competing Values Framework (CVF) previously discussed was the basis of
the OCM and the subscales chosen to indicate readiness for change were in the open
systems quadrant. According to Patterson et al. (2005), “the model does not propose that
organizations will have a set of practices that map to all or most of these climate
dimensions within one domain” (p. 393). The open systems domain of the OCM
included three subscales: (a) innovation and flexibility, (b) reflexivity, and (c) outward

87
focus. The first two subscales in the open systems quadrant were chosen to indicate
readiness for change in this study. The third, outward focus, was not chosen as it focuses
on an organization’s response to outside factors. While this dimension related to an
organization’s readiness for change, this study focused on the relationship between
employee psychological states and related behaviors in the internal climate.
Responses on the OCM were measured on a 4-point Likert scale: 1 = Definitely
false, 2 = Mostly false, 3 = Mostly true, and 4 = Definitely true. Sample items in the
Reflexivity dimension included: “In this organization, the way people work together is
readily changed in order to improve performance”; “The methods used by this
organization to get the job done are often discussed”; and “In this organization, time is
taken to review organizational objectives” (Patterson et al., 2005, p. 407).
Sample items in the Innovation and Flexibility dimension included: “The
company is quick to respond when changes need to be made”; “The organization is very
flexible; it can quickly change procedures to meet new conditions and solve problems as
they arise”; and “People in this organization are always searching for new ways of
looking at problems” (Patterson et al., 2005, p. 406).
In their study, the researchers found a negative correlation between a company’s
age and its innovation and flexibility due to the institutionalization of practices which
limits the ability to adapt to changing conditions (Patterson et al., 2005, p. 397). This
finding was not tested in this study.
In conclusion, the OCM represented items 17-27 on the instrument for this
research. The Cronbach’s alpha values for the subscales to indicate readiness for change

88
were .86 for Innovation and Flexibility, and .76 for Reflexivity demonstrating strong
internal consistency. The Cronbach’s alpha for the overall RFC scale in this study was
measured as .928.
Research Variables.
This research study included seven variables. These variables were overall work
engagement; the three UWES-9 subscales of vigor, dedication, and absorption; overall
readiness for organizational change; and the two OCM subscales used to indicate
readiness for change of innovation and flexibility, and reflexivity. Table 4 below
summarized the associations between the seven research variables and the instrument
items 8-16 for this study.
Table 4.
Association of Research Variables to Instrument Items
Research Variable Instrument Items
Overall Employee Work Engagement Items 8 – 16
Vigor subscale Items 8, 9, 12
Dedication subscale Items 10, 11, 14
Absorption subscale Items 13, 15, 16
Overall Readiness for Change Items 17 – 27
Reflexivity subscale Items 17 – 21
Innovation and Flexibility subscale Items 22 – 27
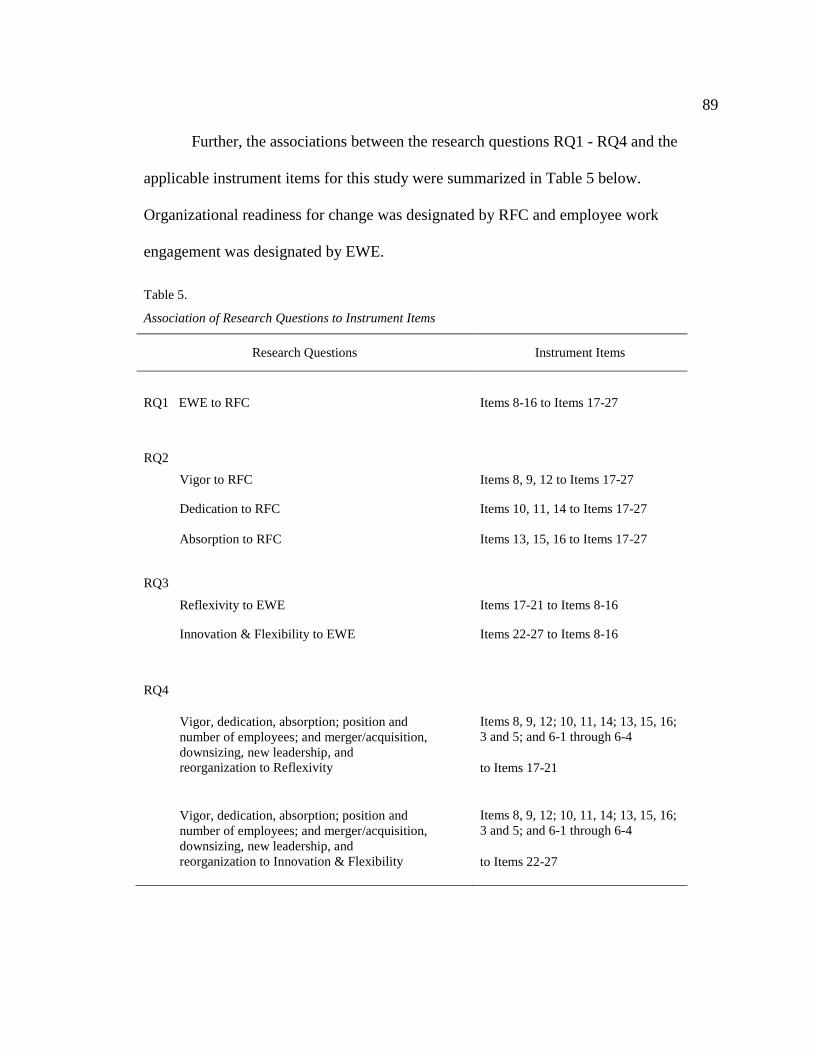
89
Further, the associations between the research questions RQ1 - RQ4 and the
applicable instrument items for this study were summarized in Table 5 below.
Organizational readiness for change was designated by RFC and employee work
engagement was designated by EWE.
Table 5.
Association of Research Questions to Instrument Items
Research Questions Instrument Items
RQ1 EWE to RFC Items 8-16 to Items 17-27
RQ2
Vigor to RFC Items 8, 9, 12 to Items 17-27
Dedication to RFC Items 10, 11, 14 to Items 17-27
Absorption to RFC Items 13, 15, 16 to Items 17-27
RQ3
Reflexivity to EWE Items 17-21 to Items 8-16
Innovation & Flexibility to EWE Items 22-27 to Items 8-16
RQ4
Vigor, dedication, absorption; position and
number of employees; and merger/acquisition,
downsizing, new leadership, and
reorganization to Reflexivity
Items 8, 9, 12; 10, 11, 14; 13, 15, 16;
3 and 5; and 6-1 through 6-4
to Items 17-21
Vigor, dedication, absorption; position and
number of employees; and merger/acquisition,
downsizing, new leadership, and
reorganization to Innovation & Flexibility
Items 8, 9, 12; 10, 11, 14; 13, 15, 16;
3 and 5; and 6-1 through 6-4
to Items 22-27

90
Data Analysis
The data analysis consisted of several stages which incorporated descriptive and
inferential statistics using SPSS and Microsoft Excel. Prior to the actual statistical
analysis of data the researcher conducted exploratory data analysis (EDA) to assess the
overall distribution of responses. This EDA included the use of SPSS Explore to assess
the normality of the summated subscale scores and to identify potential outliers.
Descriptive statistics calculated included the mean and standard deviation for each of the
seven variables, and frequency counts related to respondent characteristics. Inferential
statistics used included bivariate correlations, hierarchical multiple regression analysis,
and factorial analysis.
Further, as a number of respondents indicated they were employed in non-
manufacturing organizations, a one-way ANOVA was used to determine if the means of
these responses varied significantly from those of respondents who indicated they were
from manufacturing organization. This test was conducted so the proper sample was
used for the response rate calculation and for all subsequent statistical analyses. No
significant variance was found; therefore, all valid responses were included in the sample
and used to calculate the response rate and complete subsequent analyses. However, this
does not indicate that this study’s results are generalizable to non-manufacturing
organizations and, therefore, was considered a limitation to the study and an area of
future research.
Bivariate correlations were used to examine the relationship between (a) overall
employee work engagement and overall organizational change readiness (RQ1), (b) each

91
of the subscales of work engagement with overall organizational change readiness (RQ2),
and (c) each subscale indicating organizational change readiness to overall work
engagement (RQ3).
Hierarchical multiple regression analysis was conducted to examine the
influenced on the RFC variables of reflexivity, and innovation and flexibility by: vigor,
dedication, absorption; the respondents' position in the organization; the number of
employees in the organization; and organizational change experiences of
merger/acquisition, downsizing, new leadership, and/or reorganization (RQ4).
Factorial ANOVA analyses were conducted to assess if there was an interaction
between the respondents’ current position with the years in the current organization; and
with the scores for total RFC and its subscales, and with the scores for total EWE and its
subscales. Further, pattern analyses were conducted using graphical depictions of mean
data for position and years in the organization. These analyses attempted to illustrate the
influence, if any, of the employee’s position and years in the organization on the mean
scores of total RFC and its subscales and total EWE and its subscales.
Finally, qualitative analyses examined the influence of the respondent’s years and
position in the organization on the responses provided for the qualitative question on the
instrument: “At work, what contributes most to your desire to do your best?” Using a
deductive approach, the responses were coded to one of the following three categories:
personal resources, job resources, and combination.
For this content analysis, the coding plan specified personal resources were
indicated by statements that discussed the internal resources, physical or psychological,

92
the respondent brought to the workplace. The job resources were indicated by statements
that discussed the external resources, physical or psychological, the respondent received
from the workplace. The combination category was indicated by a statement that
comprised references to both personal and job resources. After the researcher coded the
statements, to confirm interrater reliability, a colleague with experience in EWE research
was brought in to replicate the qualitative analysis process.

93
Chapter 4
Results
The self-reported data for this research were collected in a cross-sectional study
conducted via paper surveys and Qualtrics web-based surveys. This study addressed the
following four research questions:
RQ1: What is the relationship between overall employee work engagement and
overall organizational change readiness?
RQ2: What is the relationship between each of the subscales of employee work
engagement (vigor, dedication, and absorption) and overall organizational change
readiness?
RQ3: What is the relationship between overall employee work engagement and
each of the subscales indicating organizational change readiness (reflexivity, and
innovation and flexibility)?
RQ4: To what extent is organizational change readiness – measured by the two
subscales of innovation and flexibility, and reflexivity – influenced by (a) the
employee work engagement factors of vigor, dedication, absorption; (b) employee
position in the organization; (c) the number of employees in the organization; and
(d) organizational changes experienced by the employee, including new
leadership, reorganization, downsizing, and/or merger/acquisition?
The data analyses were completed using Microsoft Excel and SPSS software.
Information reported in this section includes sample size and response rates; respondent
characteristics; the results from analyses conducted on the seven variables including
descriptive statistics; bivariate correlations for RQ1, RQ2, and RQ3; and the results from

94
the hierarchical multiple regression analysis for RQ4. Additional results reported in this
chapter comprise the (a) factorial analyses of the interactive influence of the respondent
demographic characteristics of years in the organization and position with each other and
with all study variables, (b) pattern analyses for years in the organization and position
and the means of all study variables, and (c) coding of the responses from the qualitative
item on the survey.
Instrumentation
The study questionnaire comprised 28 items that combined inventory items from
two validated instruments: the nine-question Utrecht Work Engagement Survey (UWES-
9) and two subscales of the Organizational Climate Measure (OCM) totaling 11
questions. Content validity for the final instrument was established based upon a review
by a panel of experts and the Executive Director of MA.
UWES-9 was a self-reporting survey and measured employee work engagement
including the three dimensions of work engagement: vigor, dedication, and absorption.
Schaufeli et al. (2002) defined each of these characteristics in the following way:
Vigor is characterized by high levels of energy and mental resilience while
working, the willingness to invest effort in one’s work, and persistence even in
the face of difficulties. Dedication is characterized by a sense of significance,
enthusiasm, inspiration, pride, and challenge….[and] absorption, is characterized
by being fully concentrated and deeply engrossed in one’s work, whereby time
passes quickly and one has difficulties…detaching oneself from work. (pp. 74-75)

95
Sample UWES-9 items on the questionnaire included: “When I get up in the
morning, I feel like going to work.” to measure vigor; “I am enthusiastic about my job.”
to measure dedication; and “I get carried away when I am working.” to measure
absorption (Schaufeli et al., 2006, p. 714).
Organizational readiness for change was measured with the Organizational
Climate Measure (OCM), an instrument of 17 subscales including two that indicated
readiness for change in this study: (a) reflexivity and (b) innovation and flexibility
(Patterson et al., 2005, p. 391). The innovation and flexibility climate dimension
measured “acceptance of new ideas; ability to respond to change; identification of need
for change; flexibility in responding to changes needed in procedures; support in
developing new ideas; and orientation to improvement and innovation” (Rivard, 2005, p.
4). Reflexivity was concerned “with reviewing and reflecting upon objectives, strategies,
and work processes, in order to adapt to the wider environment (West, 1996, 2000)”
(Patterson et al., 2005, p. 386).
Responses on the OCM were measured on a 4-point Likert scale: 1 = Definitely
false, 2 = Mostly false, 3 = Mostly true, and 4 = Definitely true. Sample items in the
Reflexivity dimension included: “In this organization, the way people work together is
readily changed in order to improve performance”; “The methods used by this
organization to get the job done are often discussed”; and “In this organization, time is
taken to review organizational objectives” (Patterson et al., 2005, p. 407).
Sample items in the Innovation and Flexibility dimension included: “The
company is quick to respond when changes need to be made”; “The organization is very

96
flexible; it can quickly change procedures to meet new conditions and solve problems as
they arise”; and “People in this organization are always searching for new ways of
looking at problems” (Patterson et al., 2005, p. 406).
Response Rates and Survey Completion
For this study, the total number of employees to receive the emailed and paper
surveys was 293. Within this sample of 293, 177 participants (60.4%) read the consent
form and chose to move to the survey instrument and, thereby, provided their implied
consent. The completed surveys of 172 was determined by examining those respondents
that had answered quantitative items 8-27 that comprised the UWES-9 and OCM
instruments. The resulting survey response rate calculation of 58.7%; therefore, was
based on the number of individual respondents that completed the survey (172) and the
total number of individual employees that received the survey (293).
Study Participant Profile
The respondents to the survey provided personal and organizational background
information regarding their organization type, union affiliation, current position in the
organization, years at the organization, the number of employees at their organization
(proxy measure for the size of the organization), and their experience with change efforts.
The personal and organizational background information found to potentially
represent limitations to the generalizability of this research study included (a) the

97
organization type – non-manufacturing organizations were not represented in the sample;
(b) union affiliation – all organizations surveyed were non-union; and (c) the number of
employees – all participating organizations were small businesses with less than 110
employees.
The personal and organizational background information which did not appear to
create limitations were those of the respondents’ position in the organization, years at the
organization, and experiences with change efforts. First, an adequate representation (n >
25) was obtained amongst the three subgroups of position in the organization and five
sub-groups of years in the organization (Figures 10 and 11). As Figure 10 indicates, the
concern that non-managerial employees might be underrepresented was unfounded at
67% and the data showed the combined managerial employee categories were 32% of the
respondents.
Figure 10. Distribution of Sample (n=171) by Position in the Organization.

98
Figure 11. Distribution of Sample (n=171) by Years in the Organization.
Second, it was important to understand what types of organizational changes the
respondents had experienced as the researcher believed this might impact their view of an
organization’s RFC. For example, if a respondent was had experienced a reorganization
at a previous company, it was expected they may have a more informed perspective
regarding the organization’s readiness for a future reorganization. On this question, the
respondents were permitted to select multiple answers for the types of change
experienced so frequencies were examined (Figure 12). Thus totals across the types of
changes may not equal n=171.
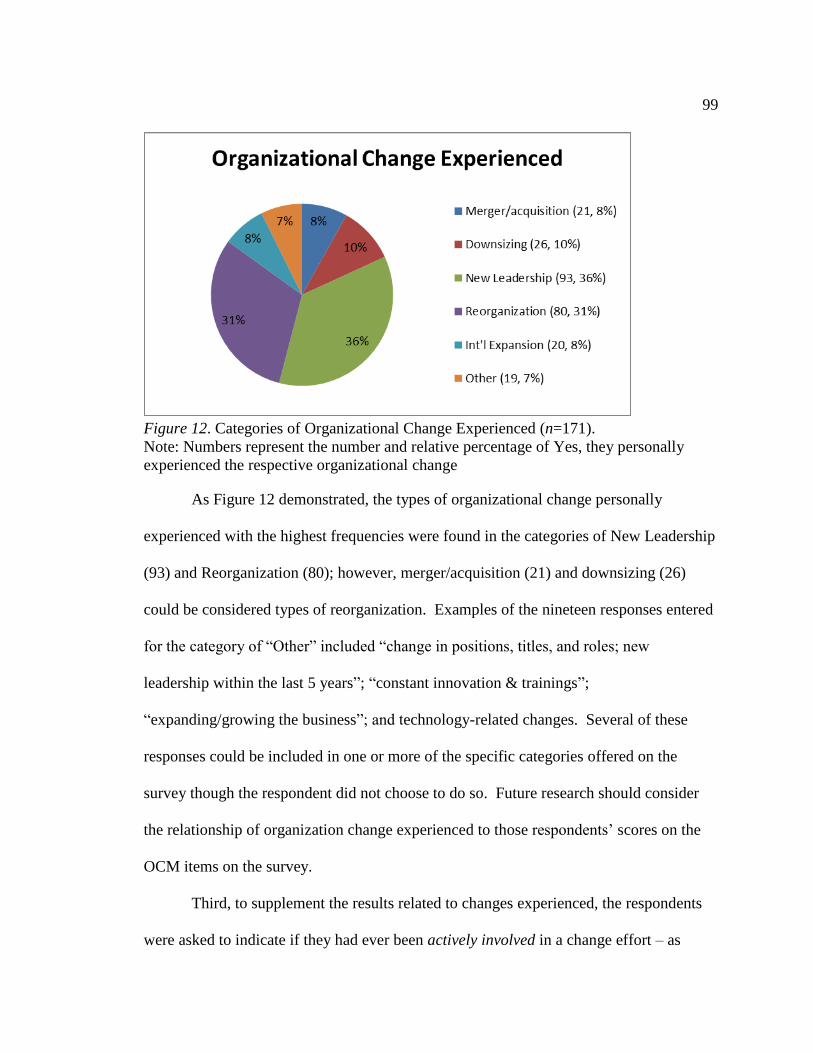
99
Figure 12. Categories of Organizational Change Experienced (n=171).
Note: Numbers represent the number and relative percentage of Yes, they personally
experienced the respective organizational change
As Figure 12 demonstrated, the types of organizational change personally
experienced with the highest frequencies were found in the categories of New Leadership
(93) and Reorganization (80); however, merger/acquisition (21) and downsizing (26)
could be considered types of reorganization. Examples of the nineteen responses entered
for the category of “Other” included “change in positions, titles, and roles; new
leadership within the last 5 years”; “constant innovation & trainings”;
“expanding/growing the business”; and technology-related changes. Several of these
responses could be included in one or more of the specific categories offered on the
survey though the respondent did not choose to do so. Future research should consider
the relationship of organization change experienced to those respondents’ scores on the
OCM items on the survey.
Third, to supplement the results related to changes experienced, the respondents
were asked to indicate if they had ever been actively involved in a change effort – as

100
opposed to being the passive recipient of change. The data related to the respondents’
level of active involvement in a change effort was shown in Figure 13. In answer to this
statement, 48% of the respondents said yes, they had been actively involved; however,
38% picked no and 12% chose maybe. Perhaps the selection of maybe by 12% of the
sample demonstrated a lack of clarity in the survey term actively as no definition was
provided to the respondents.
Therefore, it was feasible some or all of the 12% of respondents who experienced
some type of organizational change assumed they were actively involved because of the
experience alone rather than the researcher’s intended meaning of active involvement –
discussed, developed, implemented, and/or led the change effort. Clarification of the
envisioned connotation of the term would be beneficial for future research on this and
related topics.
Figure 13. Distribution of Sample (n=172) Active Involvement in a Change Effort.
In summary, the personal and organizational background information clarified
several limitations to the study, but also confirmed adequate representation across the

101
categories of position and years in the organization which made them useful for most
statistical analyses. This confirmation provided additional justification for the researcher
to explore how the respondents’ position and years in the organization impacted
employee self-reported perceptions regarding overall EWE and its subscales vigor,
dedication, and absorption; and overall RFC and its subscales innovation and flexibility,
and reflexivity. The results of those analyses were provided in the following section.
Descriptive Statistics for Employee Work Engagement (EWE) and Readiness for
Change (RFC)
To summarize the responses and provide some qualitative summary for work
engagement and organizational readiness for change and assess normality for each of the
seven primary study variables, the researcher examined the descriptive statistics of mean,
median, and standard deviation (Table 6).
For EWE the data analyses indicated a relatively high level of employee work
engagement. Qualitatively, the means indicated a level of work engagement that
reflected being engaged often – very often. The descriptive statistics (Mean = 5.55, SD =
.98) for overall work engagement fell between often and very often on the Likert
response scale. Similarly, the means for the three subscales reflected high levels of work
engagement (Vigor – M = 5.25, SD = 1.24; Dedication – M = 5.77, SD = .97; and
Absorption – M = 5.63, SD = .99). These summary statistics provided additional
evidence the summated Likert scale scores were fairly normally distributed (the means
were very similar to the median values as reported in Table 6).

102
Table 6.
Descriptive Statistics
Research Variable Measure Score
Vigor* Mean 5.25
Median 5.67
Std. Deviation 1.24
Dedication* Mean 5.77
Median 6.00
Std. Deviation 0.97
Absorption* Mean 5.63
Median 6.00
Std. Deviation 0.99
Reflexivity* Mean 2.87
Median 2.90
Std. Deviation 0.59
Innovation & Flexibility* Mean 2.71
Median 2.75
Std. Deviation 0.72
Overall RFC Mean 2.78
Median 2.82
Std. Deviation 0.62
Overall EWE
Mean 5.55
Median 5.67
Std. Deviation 0.98
*Vigor = high levels of energy and mental resilience, willingness to invest effort in one’s work, and persistence in the
face of difficulties
*Dedication = a sense of significance, enthusiasm, inspiration, pride, and challenge
*Absorption = fully concentrated and deeply engrossed in one’s work whereby time passes quickly and one has
difficulties detaching oneself from work (Schaufeli & Bakker, 2010)
*Reflexivity = a concern with reviewing and reflecting upon objectives, strategies, and work processes, in order to
adapt to the wider environment
*Innovation = the extent of encouragement and support for new ideas and innovative approaches
*Flexibility = an orientation toward change (Patterson et al., 2005)

103
For RFC the data analyses indicated a moderately high level of readiness for
change. Qualitatively, the means indicated a significant level of readiness for change
with respondents most often indicated the statements were mostly true. The descriptive
statistics (Mean = 2.87, SD = .62) for overall readiness for change fell between mostly
false and mostly true on the Likert response scale. Similarly, the two subscales reflected
high levels of readiness for change (Reflexivity – M = 2.87, SD = .59; and Innovation
and Flexibility – M = 2.71, SD = .72). These summary statistics provided additional
evidence the summated Likert scale scores were fairly normally distributed (the means
were very similar to the median values as reported in Table 6.
To further examine the scales for skewness and outliers the box plot for each
variable was created (Appendix D). These illustrations demonstrated the scales were
fairly normally distributed, with limited or no skewness, and only minor outliers.
A final examination regarding the distribution of the responses for each item in
the UWES-9 and OCM instruments appears in (Tables 7 and 8 respectively). The
UWES-9 instrument used a 0-6 response scale; however, the Qualtrics software reported
the scales from (1) never to (7) always.

104
Table 7.
Distribution of EWE-related Responses for UWES-9 Statements
UWES-9 Statement
1
Never
2
Almost
Never
3
Rarely
4
Sometim
es
5
Often
6
Very
Often
7
Always
Row N
%
Row N
%
Row N
%
Row N
%
Row N
%
Row N
%
Row N
%
At my work, I feel
that I am bursting
with energy
0.6% 4.1% 5.8% 16.4% 19.3% 38.6% 15.2%
At my job, I feel
strong and vigorous 0.6% 2.3% 8.8% 11.1% 24.0% 36.8% 16.4%
I am enthusiastic
about my job 0.0% 1.8% 4.7% 10.5% 17.0% 45.0% 21.1%
My job inspires me 1.2% 3.5% 5.3% 14.6% 22.2% 35.1% 18.1%
When I get up in the
morning, I feel like
going to work
3.5% 7.6% 7.0% 8.2% 15.8% 38.6% 19.3%
I feel happy when I
am working
intensely
0.6% 2.3% 1.8% 8.2% 18.1% 40.9% 28.1%
I am proud of the
work that I do 0.6% 0.0% 0.0% 3.5% 8.8% 29.2% 57.9%
I am immersed in my
work 0.6% 0.0% 1.8% 7.6% 14.6% 39.2% 36.3%
I get carried away
when I’m working 3.5% 2.9% 8.2% 14.0% 18.7% 38.0% 14.6%
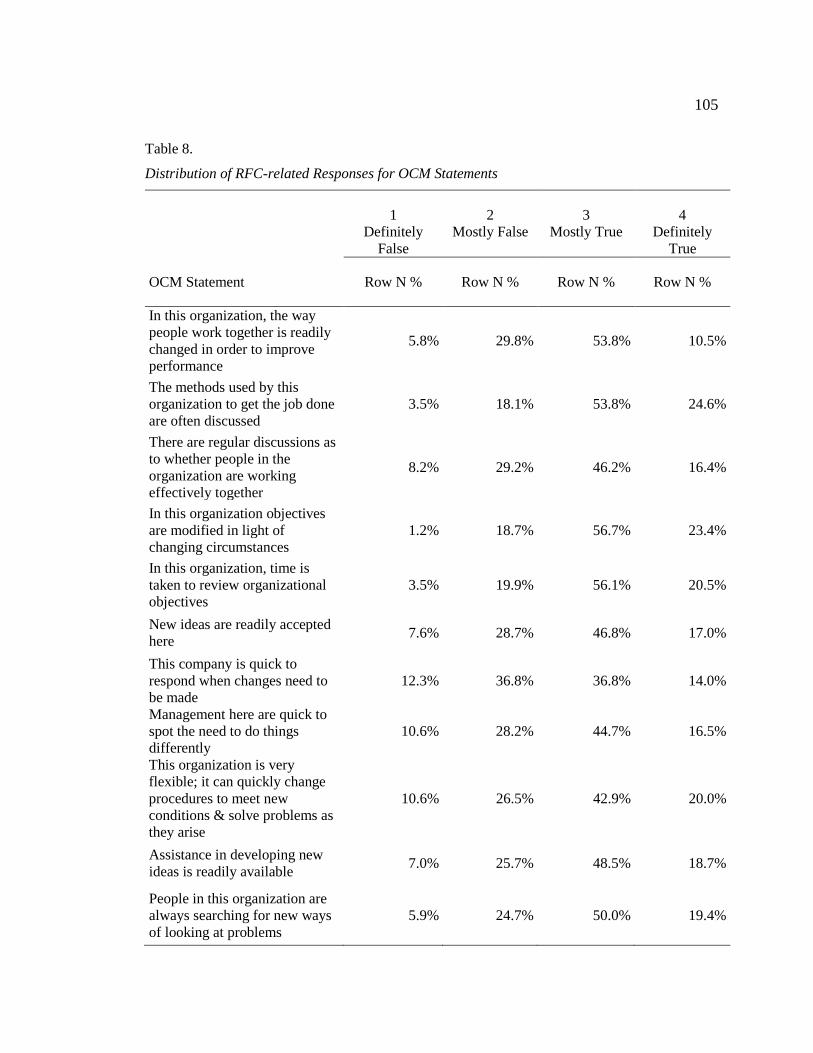
105
Table 8.
Distribution of RFC-related Responses for OCM Statements
OCM Statement
1
Definitely
False
2
Mostly False
3
Mostly True
4
Definitely
True
Row N % Row N % Row N % Row N %
In this organization, the way
people work together is readily
changed in order to improve
performance
5.8% 29.8% 53.8% 10.5%
The methods used by this
organization to get the job done
are often discussed
3.5% 18.1% 53.8% 24.6%
There are regular discussions as
to whether people in the
organization are working
effectively together
8.2% 29.2% 46.2% 16.4%
In this organization objectives
are modified in light of
changing circumstances
1.2% 18.7% 56.7% 23.4%
In this organization, time is
taken to review organizational
objectives
3.5% 19.9% 56.1% 20.5%
New ideas are readily accepted
here 7.6% 28.7% 46.8% 17.0%
This company is quick to
respond when changes need to
be made
12.3% 36.8% 36.8% 14.0%
Management here are quick to
spot the need to do things
differently
10.6% 28.2% 44.7% 16.5%
This organization is very
flexible; it can quickly change
procedures to meet new
conditions & solve problems as
they arise
10.6% 26.5% 42.9% 20.0%
Assistance in developing new
ideas is readily available 7.0% 25.7% 48.5% 18.7%
People in this organization are
always searching for new ways
of looking at problems
5.9% 24.7% 50.0% 19.4%

106
Bivariate Correlations between Work Engagement and Readiness for Change
Shown in Figure 14, six bivariate correlations were used to examine the
relationships between (a) overall employee work engagement (EWE) and overall
organizational change readiness (RFC) (RQ1), (b) each of the subscales of employee
work engagement with overall organizational change readiness (RQ2), and (c) each
subscale indicating organizational change readiness to overall work engagement (RQ3).
Cohen, Manion, and Morrison (2007) provided the following guideline which was
used in this study to determine the positive or negative correlation strength between the
examined variables:
0.0 - 0.10 = weak;
0.11 - 0.30 = modest;
0.31 - 0.50 = moderate;
0.51 - 0.80 = strong;
0.81 - 1.00 = very strong (p. 521).
RQ1
Figure 14. Illustration of the bivariate analyses conducted for RQ1, RQ2, & RQ3
Work
Engagement
Vigor
Absorption
Dedication
Reflexivity
Organizational
Readiness for
Change
Innovation &
Flexibility

107
As shown in bold in Table 9 below, each bivariate analysis found at p < .01 there
was significant and moderate correlation (strength) amongst all seven variables studied.
The following reports the specific correlation and effect size data for all examined
relationships: RQ1 found a moderate to strong correlation between overall EWE and
overall RFC at r = .487 (R2 = 23.7%); for RQ2, the subscales of EWE of vigor and
absorption were moderately correlated with overall RFC at r = .442 (R2
=19.5%) & r =
.421 (R2
=17.7%) respectively, while the EWE subscale of dedication had a moderate to
strong correlation with overall RFC at r = .477 (R2
=21.3%); and for RQ3, the correlation
for the subscales of RFC of reflexivity and innovation and flexibility to overall EWE
were moderate to strong and moderate at r = .467 (R2
=21.8%) & r = .455 (R2
=20.7%)
respectively.
Finally, while examining the relationships between each of the EWE and RFC
subscales to the others was not the focus of this study’s research questions, the bivariate
analyses of the data related to these subscales found moderate correlations from r = .376
to r = .455 between each of the subscales which were significant at the p < .01 level
(Table 9).

108
Table 9.
Pearson Correlations Between Research Variables
VIGOR DEDICATION ABSORPTION REFLEXIVITY INNOVATION FLEXIBILITY
RFC TOTAL SCALE
EWE TOTAL SCALE
VIGOR
Pearson Correlation 1 .811** .710
** .415
** .420
** .443
** .931
**
Sig. (2-tailed)
.000 .000 .000 .000 .000 .000
N 171 171 171 171 170 170 171
DEDICATION
Pearson Correlation .811** 1 .755
** .443
** .455
** .477
** .928
**
Sig. (2-tailed) .000
.000 .000 .000 .000 .000
N 171 171 171 171 170 170 171
ABSORPTION
Pearson Correlation .710** .755
** 1 .430
** .376
** .421
** .887
**
Sig. (2-tailed) .000 .000
.000 .000 .000 .000
N 171 171 171 171 170 170 171
REFLEXIVITY
Pearson Correlation .415** .443
** .430
** 1 .770
** .915
** .467
**
Sig. (2-tailed) .000 .000 .000
.000 .000 .000
N 171 171 171 171 170 170 171
INNOVATION_FLEXIBI
LITY
Pearson Correlation .420** .455
** .376
** .770
** 1 .962
** .455
**
Sig. (2-tailed) .000 .000 .000 .000
.000 .000
N 170 170 170 170 170 170 170
RFC_TOTAL_SCALE
Pearson Correlation .443** .477
** .421
** .915
** .962
** 1 .487
**
Sig. (2-tailed) .000 .000 .000 .000 .000
.000
N 170 170 170 170 170 170 170
EWE_TOTAL_SCALE
Pearson Correlation .931** .928
** .887
** .467
** .455
** .487
** 1
Sig. (2-tailed) .000 .000 .000 .000 .000 .000
N 171 171 171 171 170 170 171
**. Correlation is significant at the 0.01 level (2-tailed).

109
In conclusion, the results of the bivariate correlations demonstrated moderate and
moderate to strong correlation between all seven research variables with effect sizes
ranging from approximately 18 to 23%. These results supported the researcher’s
proposed relationships between employee work engagement and its subscale scores with
readiness for change and the related subscale scores. Figure 15 illustrates these
relationships by labeling the applicable research question (RQ) and the correlation
measured significant at p < .01.
Figure 15. The Correlations for RQ1, RQ2 and RQ3 significant at p < .01
Hierarchical Multiple Regression Analysis of EWE, Personal and Organizational
Characteristics, and Readiness for Change
The final analysis examined the relative influence selected personal and
organizational variables had on the relationships between work engagement and
Reflexivity
Innovation &
Flexibility
Vigor
Dedication
Absorption
Employee Work Engagement Organizational Readiness for Change
RQ1: r = .487
RQ3: r = .455
RQ2: r = .477
RQ3: r = .467
RQ2: r = .443
RQ2: r = .421

110
organizational readiness for change (RQ4). Hierarchical multiple regression analysis was
used to examine the relationships when simultaneously accounting for the influence of
selected personal and organizational factors. Figure 16 illustrates the variables and four
models examined.
Reflexivity
Innovation
and
Flexibility
Dedication
Reorganization
Absorption
Position in
Organization
New
Leadership
Vigor
Merger/
Acquisition
Downsizing
Number of
Employees
Model 1
Model 2
Model 3
Model 4
Figure 16. Illustration of the hierarchical multiple regression analysis conducted for RQ4

111
Tables 10 and 11 descriptively summarize the variables used in the analyses.
Prior to entering the variables into the regression analysis, basic assumptions for interval
data including normality and linearity were assessed and were found to be acceptable per
commonly utilized procedures and guidelines (Tabachnick & Fidell, 2007).
Table 10.
Summary Descriptive Statistics for Interval Scale Variables used in Regression Analysis.
Variable Mean Std Deviation Low Value High Value
Innovation Flexibility 2.71 0.71 1.00 4.00
Reflexivity 2.87 0.58 1.00 4.00
Dedication 5.77 0.97 1.67 7.00
Absorption 5.63 0.99 2.67 7.00
Vigor 5.25 1.24 1.67 7.00
Note: The Likert scale response for the dedication, absorption and vigor items ranged from a low of 1 to a high of 7.
The innovation flexibility scale and the reflexivity scale items had a Likert scale that ranged from a low of 1 to a high
of 4.
Table 11.
Frequency Distribution for Categorical Variables used in the Regression Analysis.
Variable and Response Option Frequency Valid Percent-%
Current Position
Non Managerial
Supervisor
Executive
115
32
23
67.6
18.8
13.5
Number of Employees
1-50
51-100
101 – 200
201 - 300
58
36
75
1
34.1
21.2
44.1
.6
Organizational Change
Merger
No
Yes
Downsizing
No
Yes
New Leadership
No
Yes
Reorganization
No
Yes
150
21
145
26
78
93
91
80
87.7
12.3
84.8
15.2
45.6
54.4
53.2
46.8

112
In addition, the researcher summarized the zero-order correlations for variables
used in the regression analyses in Tables 12 and 13. The information in those tables
indicated the bivariate correlations among the variables without accounting for the
influence of other potential mediating or moderating variables. Further, dichotomous
nominal variables used in the regression analysis were dummy coded and the coding was
reflected in the zero-order correlation tables and the final regression analysis tables as X1
through X10.
In Table 12 innovation and flexibility was most highly positively correlated with
dedication (r = .45), vigor (r = .42) and absorption (r = .37). The same variables
(dedication r = .44; absorption r = .43; and vigor r = .41) were also most highly
positively correlated with reflexivity scores (Table 13). In all cases, these values were
considered moderate size correlations (Cohen, Manion, & Morrison, 2007).
Table 12.
Zero-order-correlations for Innovation & Flexibility Regression Analysis (n = 168).
Variable X1 X2 X3 X4 X5 X6 X7 X8 X9 X10
Innovation Flexibility
(X1)
1.00
Dedication (X2) .45 1.00
Absorption (X3) .37 .75 1.00
Vigor (X4) .42 .81 .71 1.00
No of Employees (X5) -.03 .11 .07 .11 1.00
Position (X6) .04 .29 .32 .27 -.01 1.00
Merger (X7) .05 .05 -.03 .05 .14 .05 1.00
Downsizing (X8) .01 -.19 -.08 -.15 -.36 -.05 -.16 1.00
New Leadership (X9) -.15 .01 .11 .04 .04 .13 .05 .11 1.00
Reorganization (X10) .02 .02 .07 .05 .01 -.01 -.11 .12 .03 1.00
Note: Bold faced zero order correlation values are statistically significant at ≤ .05 (1 tail test of significance)

113
Table 13.
Zero-order-correlations for Reflexivity Regression Analysis (n = 169).
Variable X1 X2 X3 X4 X5 X6 X7 X8 X9 X10
Reflexivity (X1) 1.00
Dedication (X2) .44 1.00
Absorption (X3) .43 .75 1.00
Vigor (X4) .41 .81 .71 1.00
No of Employees (X5) -.01 .12 .08 .11 1.00
Position (X6) .09 .29 .32 .27 -.01 1.00
Merger (X7) .04 .05 -.03 .05 .14 .05 1.00
Downsizing (X8) .05 -.19 -.08 -.15 -.36 -.05 -.16 1.00
New Leadership (X9) -.07 .01 .10 .04 .03 .12 .05 .12 1.00
Reorganization (X10) .09 .02 .08 .05 .02 -.01 -.11 .12 .03 1.00
Note: Bold faced zero order correlation values are statistically significant at ≤ .05 (1 tail test of significance)
Work Engagement and Organizational Innovation and Flexibility.
When determining if there were adequate numbers in the applicable cells to
conduct the hierarchical regression with the position variable, lower frequencies were
observed in the first-level supervisor and executive cells (32 and 23 respectively);
therefore the position variable was recoded into two groups (non-management=0; and
supervisor or executive=1),
In this analysis, innovation and flexibility (Mean = 2.71, SD = .71) was the
dependent (criterion) variable. The innovation and flexibility climate dimension
measured “acceptance of new ideas; ability to respond to change; identification of need

114
for change; flexibility in responding to changes needed in procedures; support in
developing new ideas; and orientation to improvement and innovation” (Rivard, 2005, p.
4).
Dedication, as self-reported by the employee, was the single most influential and
significant factor (β = .307) in explaining differences in Innovation and Flexibility scores.
The beta value (β) was a measure of how strongly each predictor or independent variable
influenced the dependent variable. The beta was measured in units of standard deviation.
Dedication had a beta value of .307 (p = .021). This indicated that a one (1) standard
deviation increase in dedication would result in a .307 standard deviation unit increase in
the dependent variable innovation and flexibility. Thus, the higher the beta value the
greater the impact of the predictor variable on the criterion variable.
The information summarized in Table 14 substantiated that employee dedication
was the most influential and remained so regardless of the other variables entered into the
analysis at each of the subsequent steps. The only other variable which ultimately was
significant was whether the employee experienced new leadership in the organization.
However, that variable, although statistically significant (β = -.166, p = .020), did not
significantly increase the amount of variance explained in the organizational innovation
and flexibility value (Model 4, R Square Change, p = .199).

115
Table 14.
Summary of Regression for Innovation and Flexibility.
Block and Variable
Model 1
β (Sig 1 tail)
Model 2
β (Sig 1 tail)
Model 3
β (Sig 1 tail)
Model 4
β (Sig 1 tail)
Work Engagement Subscale
Dedication
Absorption
Vigor
.307 (.020)
.048 (.662)
.133 (.277)
.315 (.017)
.044 (.686)
.139 (.259)
.325 (.014)
.068 (.535)
.144 (.240)
.307 (.021)
.099 (.375)
.146 (.229)
Size of Organization
(Number of Employees)
-.083 (.238)
-.087 (.214)
-.057 (.446)
Position Of Respondent
(0= Non Manager and 1 = Supervisor
or Executive)
-.110 (.133)
-.092 (.268)
Type of Organizational Change
Merger (0 = No and 1 = Yes)
Downsizing (0 = No and 1 = Yes)
New Leadership (0 = No and 1 = Yes)
Reorganization (0 = No and 1 = Yes)
.066 (.347)
.093 (.226)
-.166 (.020)
-.004 (.957)
Model Summary Information
R Square
Adjusted R Square
F
n
Significance of Model
Significance of R Square Change
.212
.198
14.70
168
<.001
<.001
.219
.199
11.40
168
<.001
.412
.230
.206
9.65
168
<.001
.345
.261
.219
6.21
168
<.001
.199
Note: Beta values in boldface are statistically significant.
Work Engagement and Organizational Reflexivity.
In this analysis, reflexivity (Mean = 2.87, SD = .58) was the dependent (criterion)
variable. Reflexivity in an organization is concerned “with reviewing and reflecting upon

116
objectives, strategies, and work processes, in order to adapt to the wider environment”
(Patterson et al., 2005, p. 386). Because of collinearity issues between the variables
dedication, absorption, and vigor, the variable vigor was not included in the regression
analysis for organizational reflexivity.
Dedication (β = .296, p = .007), as self-reported by the employee, and absorption
(β = .242, p = .026) had very similar influences in explaining reflexivity score
differences. The beta values for both variables were positive and very similar in absolute
value. For each of the two variables a one (1) standard deviation increase resulted in a
similar standard deviation unit increase in the dependent variable reflexivity.
The information summarized in Table 15 substantiates that the subscales of
employee dedication and employee absorption were the only variables statistically
significant relative to organizational reflexivity.

117
Table 15.
Summary of Regression for Reflexivity.
Block and Variable
Model 1
β (Sig 1 tail)
Model 2
β (Sig 1 tail)
Model 3
β (Sig 1 tail)
Model 4
β (Sig 1 tail)
Work Engagement Subscale
Dedication
Absorption
.270 (.011)
.224 (.033)
.277 (.009)
.223 (.035)
.285 (.008)
.238 (.026)
.296 (.007)
.242 (.026)
Size of Organization
(Number of Employees)
-.055 (.430)
-.057 (.415)
-.018 (.814)
Position Of Respondent
(0= Non Manager and 1 = Supervisor
or Executive)
-.067 (.359)
-.055 (.452)
Type of Organizational Change
Merger (0 = No and 1 = Yes)
Downsizing (0 = No and 1 = Yes)
New Leadership (0 = No and 1 = Yes)
Reorganization (0 = No and 1 = Yes)
.070 (320)
.133 (.084)
-.106 (.136)
.059 (.402)
Model Summary Information
R Square
Adjusted R Square
F
n
Significance of Model
Significance of R Square Change
.214
.205
22.64
169
<.001
<.001
.217
.203
15.27
169
<.001
.430
.221
.202
11.65
169
<.001
.359
.250
.213
6.67
169
<.001
.195
Note: Beta values in boldface are statistically significant.

118
Additional Results
Factorial ANOVA – Years & Position on Total RFC and RFC Subscales.
Separate analyses were completed to assess if there was an interaction between
the current position of the respondent and years in the current organization, with
innovation and flexibility scores, and with reflexivity scores. Table 16 summarized the
descriptive statistics for this interaction analysis.
Table 16.
Descriptive Statistics for the RFC-related Factorial Analysis of Variance Analysis for Current Position of
the Respondent by Years in the Current Organization.
Dependent Variable Position Years in Current
Organization
Cases Mean Std. Dev.
Innovation Flexibility Non Managerial Less Than 1 Year
1 – 5 Years
6 – 10 Years
10 Years or more
Total
17
35
23
39
114
3.23
2.54
2.49
2.70
2.69
.59
.81
.79
.59
.74
Supervisor/Exec. Less Than 1 Year
1 – 5 Years
6 – 10 Years
10 Years or more
Total
4
13
12
25
54
2.83
2.83
2.53
2.79
2.74
.92
.72
.80
.57
.68
Combined Less Than 1 Year
1 – 5 Years
6 – 10 Years
10 Years or more
Total
21
48
35
64
168
3.15
2.62
2.50
2.73
2.70
.65
.79
.78
.58
.72
Reflexivity
Non Managerial Less Than 1 Year
1 – 5 Years
6 – 10 Years
10 Years or more
Total
17
35
23
39
114
3.16
2.77
2.72
2.82
2.83
.52
.72
.55
.61
.63
Supervisor/Exec. Less Than 1 Year
1 – 5 Years
6 – 10 Years
10 Years or more
Total
4
13
12
26
55
3.20
3.05
2.72
2.95
2.94
.43
.32
.65
.43
.47
Combined Less Than 1 Year
1 – 5 Years
6 – 10 Years
10 Years or more
Total
21
48
35
65
169
2.17
2.84
2.72
2.87
2.88
.50
.65
.58
.55
.59 Note: The mean values are based on the following Likert response scale: 1 = Definitely False; 2 = Mostly False; 3 = Mostly True; and
4 = Definitely True.

119
When determining if there were adequate numbers in the applicable cells to
conduct the factorial analysis with the position and year variable combined, low numbers
were observed in the first-level supervisor and executive cells; therefore the position
variable was recoded into two groups (non-management, and supervisor and executive),
and the years in the current organization variable was recoded into four groups by
combining the 11-15 year and > 15 year categories.
Two figures are presented which visually depict the interactive influence of the
two variables (position and years in current organization) on innovation and flexibility
(Figure 17) and reflexivity (Figure 18).
Figure 17. Interactive influence of position and years in organization on Innovation & Flexibility.

120
Figure 18. Interactive influence of position and years in organization on Reflexivity.
The factorial analysis of variance was used to statistically assess whether there
was a significant interaction between position and years in the current organization with
innovation and flexibility, reflexivity, and total RFC. There was no significant statistical
interaction found at the ≤ 0.05 significance level (Table 17).
Table 17.
Factorial Analysis of Variance Results.
Dependent
Variable
Independent Variable and Interaction F Value Sig (2 tail)
Innovation
Flexibility
Position
Years in Organization
Interaction of position and years in organization
0.003
1.829
0.782
0.955
0.144
0.506
Reflexivity Position
Years in Organization
Interaction of position and years in organization
0.958
2.010
0.384
0.329
0.115
0.764
Total RFC Position
Years in Organization
Interaction of position and years in organization
0.202
2.111
0.599
0.653
0.101
0.616

121
Factorial ANOVA – Years & Position on Total EWE and EWE Subscales.
Additional and separate analyses were completed to determine if there was an
interaction between the current position of the respondent and years in the current
organization, with vigor scores, with dedication scores, with absorption scores, and with
total EWE scores. The recoded categories for position and years at the organization were
also used for these analyses. Table 18 summarized the descriptive statistics for this
interaction analysis.
Table 18.
Descriptive Statistics for the EWE-related Factorial Analysis of Variance Analysis for Current
Position of the Respondent by Years in the Current Organization.
Dependent
Variable
Position Years in Current
Organization
Cases Mean Std. Dev.
Vigor Non Managerial Less Than 1 Year
1 – 5 Years
6 – 10 Years
10 Years or more
Total
17
35
23
39
114
5.45
4.82
4.84
5.21
5.05
1.20
1.27
1.30
1.15
1.23
Supervisor/Exec. Less Than 1 Year
1 – 5 Years
6 – 10 Years
10 Years or more
Total
4
13
12
26
55
5.83
5.79
5.64
5.73
5.73
0.96
1.21
1.27
0.95
1.05
Combined Less Than 1 Year
1 – 5 Years
6 – 10 Years
10 Years or more
Total
21
48
35
65
169
5.52
5.08
5.11
5.42
5.27
1.15
1.31
1.32
1.10
1.22
Dedication
Non Managerial Less Than 1 Year
1 – 5 Years
6 – 10 Years
10 Years or more
Total
17
35
23
39
114
6.12
5.28
5.51
5.72
5.60
1.01
1.06
1.27
0.74
1.03
Supervisor/Exec. Less Than 1 Year
1 – 5 Years
6 – 10 Years
10 Years or more
Total
4
13
12
26
55
6.08
6.18
6.03
6.24
6.17
0.69
0.75
0.72
0.64
0.68

122
Combined Less Than 1 Year
1 – 5 Years
6 – 10 Years
10 Years or more
Total
21
48
35
65
169
6.11
5.52
5.69
5.93
5.79
0.94
1.06
1.13
0.77
0.97
Absorption Non Managerial Less Than 1 Year
1 – 5 Years
6 – 10 Years
10 Years or more
Total
17
35
23
39
114
5.94
5.17
5.10
5.68
5.44
0.83
1.06
1.11
0.83
1.00
Supervisor/Exec. Less Than 1 Year
1 – 5 Years
6 – 10 Years
10 Years or more
Total
4
13
12
26
55
6.00
6.05
6.11
6.08
6.07
0.54
0.61
0.77
0.79
0.71
Combined Less Than 1 Year
1 – 5 Years
6 – 10 Years
10 Years or more
Total
21
48
35
65
169
5.95
5.41
5.45
5.84
5.65
0.77
1.03
1.11
0.83
0.96
Total EWE Non Managerial Less Than 1 Year
1 – 5 Years
6 – 10 Years
10 Years or more
Total
17
35
23
39
114
5.84
5.09
5.15
5.54
5.37
0.94
1.02
1.16
0.81
1.00
Supervisor/Exec. Less Than 1 Year
1 – 5 Years
6 – 10 Years
10 Years or more
Total
4
13
12
26
55
5.97
6.01
5.93
6.02
5.99
0.73
0.74
0.79
0.69
0.71
Combined Less Than 1 Year
1 – 5 Years
6 – 10 Years
10 Years or more
Total
21
48
35
65
169
5.86
5.34
5.42
5.73
5.57
0.89
1.03
1.10
0.80
0.96
Note: The mean values are based on the following Likert response scale in Qualtrics: 1 = Never; 2 = Almost Never; 3
= Rarely; 4 = Sometimes; 5 = Often; 6 = Very Often; 7 = Always.
Four figures presented below visually depict the interactive influence of the two
variables (position and years in current organization) on vigor (Figure 19), dedication
(Figure 20), absorption (Figure 21), and total EWE (Figure 22). The results of the
factorial ANOVA analyses were provided in Table 19.

123
Figure 19. Interactive influence of position and years in organization on Vigor.
Figure 20. Interactive influence of position and years in organization on Dedication.

124
Figure 21. Interactive influence of position and years in organization on Absorption.
Figure 22. Interactive influence of position and years in organization on Total EWE.

125
The factorial analysis of variance was used to statistically assess whether there
was a significant interaction between position and years in the current organization with
each subscale of vigor, dedication, absorption, or total EWE. There was a significant
main effect interaction found for each EWE scale score with the category of employee
position at the ≤ 0.05 significance level (Table 19). However, there was no significant
interaction between years in the organization or position and years in the organization for
each of the EWE scale scores.
Table 19.
Factorial Analysis of Variance Results.
Dependent
Variable
Independent Variable and Interaction
F Value
Sig (2 tail)
Vigor
Position
Years in Organization
Interaction of position and years in organization
8.454
0.529
0.391
0.004
0.663
0.760
Dedication
Position
Years in Organization
Interaction of position and years in organization
7.223
1.009
0.908
0.008
0.390
0.439
Absorption
Position
Years in Organization
Interaction of position and years in organization
11.320
1.239
1.488
0.001
0.297
0.220
Total EWE
Position
Years in Organization
Interaction of position and years in organization
10.833
1.030
0.858
0.001
0.381
0.464
Note: Values in boldface are statistically significant at ≤ 0.05.

126
Patterns in Work Engagement and Readiness for Change by Position or Years in
the Organization.
The next data analyses examined the separate influences of the respondents’
demographic characteristics of years and positions in the organization on the mean scores
for the study’s seven variables: overall EWE and its subscales vigor, dedication,
absorption; and overall RFC and its subscales innovation and flexibility, and reflexivity.
The results were depicted graphically through line graphs.
The Influence of Years on Variable Means.
Figure 23 below illustrated the influence on EWE and its subscales by the
respondents’ number of years in the organization. The UWES-9 item scale to measure
EWE and its subscales was 1-7 but as no mean scores were below 4.00, the vertical axis
was edited to show a range of 4-7.
Figure 23. Influence of Years in Organization on EWE and Subscales.
<1 year n=211-5 years
n=486-10 years
n=3511-15 years
n=17>15 years
n=49
Overall EWE 5.86 5.34 5.42 5.65 5.75
Vigor 5.52 5.08 5.11 5.29 5.46
Dedication 6.11 5.52 5.69 5.86 5.94
Absorption 5.95 5.41 5.45 5.78 5.84
4.00
4.50
5.00
5.50
6.00
6.50
7.00
Mea
n S
core
s p
er V
aria
ble
s
cale
1-7
Years in Organization on EWE & Subscales

127
This line graph illustrated the close relationship between the four variables
depicted – vigor, dedication, absorption, and overall EWE – and the consistent influence
of the number of years worked at the respondents’ organizations on the variables. First,
the dedication subscale was noted to be the highest mean score across all categories of
years employed. For all variables, the mean scores were highest among employees who
worked less than one year at the organization. In comparison, there was a reduction in
the mean scores of all variables for respondents employed one to five years, though for
all variables this was a decrease of 0.50 - 0.60 point.
Further, for each category of years 6-10, 11-15, and > 15 there was a gradual
increase in the mean scores of all variables; however, none reached those of the < 1 year
category of employees. These minor changes in the data were obtained through a cross-
sectional study; therefore, the researcher does not consider them definitive findings of the
study. However, in future research it would be interesting to examine longitudinal results
to determine if an employee’s years of employment influence EWE and RFC.
Figure 24 below demonstrated the influence on RFC and its subscales by the
respondents’ number of years in the organization. The OCM item scale to measure RFC
and its subscales was 1-4 and was depicted as such on this figure. Similar to Figure 23,
Figure 24 revealed the close relationship between the three variables measured – overall
RFC, reflexivity, and innovation and flexibility. Further, a comparable pattern of
influence by the number of years was demonstrated for the RFC-related variables.

128
Figure 24. Influence of Years in Organization on RFC and Subscales.
However, unlike the years employed data which increased for EWE, for the 6-10
year employees the mean scores for all RFC variables again declined slightly by 0.12. In
the 11-15 year employees the results were mixed as the reflexivity subscale mean
continued to decline (0.04) while the innovation and flexibility subscale mean score
increased (0.05); therefore, in combination the overall RFC mean score held steady
(+0.01). It was only in the > 15 years employed category where the mean scores of all
RFC-related variables increased. Based on the scores of the 11-15 year category, the >
15 year means increased by 0.24 - 0.26, yet never reached the scores of the < 1 year
category.
While discovering an explanation for these year and RFC-related patterns were
not part of this research, the data appeared to indicate after the first year of employment
<1 yearn=21
1-5yearsn=48
6-10yearsn=35
11-15yearsn=17
>15yearsn=49
Overall RFC 3.16 2.72 2.60 2.61 2.87
Reflexivity 3.17 2.84 2.72 2.68 2.94
Innov-Flex 3.15 2.62 2.50 2.55 2.81
1.00
1.50
2.00
2.50
3.00
3.50
4.00M
ean
Sco
res
per
Var
iab
le
scal
e 1
-4
Years in Organization on RFC & Subscales

129
the employees were skeptical about the of these organizations’ ability to (a) adapt to the
wider environment, (b) support innovative approaches, and (c) orient toward change.
Further, only after being employed for over 15 years does that perspective seem to
improve. While the reason for this change in employee perspective was unknown, this
researcher hypothesized it may be caused by the > 15 year category of employees’
enhanced understanding of the organization’s culture and practices, and the participation
in change efforts. Future research should focus on these potential influences on RFC-
related variables.
The Influence of Position on Variable Means.
Next, the data was examined to understand the influence, if any, of an employee’s
position in the organization on the mean scores for the study’s seven variables: overall
EWE and its subscales vigor, dedication, absorption; and overall RFC and its subscales
innovation and flexibility, and reflexivity.
Figure 25 revealed the close relationship between the three variables measured in
the UWES-9. The UWES-9 item scale to measure EWE and its subscales was 1-7 but as
no mean scores were below 4.00, the vertical axis was edited for a range of 4-7. The
dedication subscale was noted to be the highest mean score across all categories of
position. The analysis further illustrated the mean scores of EWE and its subscales were
influenced by the employee’s position in the organization by 0.69 - 0.97 when non-
managerial scores were compared to executive scores. The largest increase in the scores

130
relative to position was 0.97 between non-managerial and executive employees on the
vigor subscale.
Figure 25. Influence of Position in Organization on EWE and Subscales.
Recall that vigor was defined as “high levels of energy and mental resilience,
willingness to invest effort in one’s work, and persistence in the face of difficulties”
(Schaufeli & Bakker, 2010, p. 74). This finding appeared to indicate an employee’s
position may influence their level of engagement particularly in how vigorous their job
makes them feel. This importance of an employee’s position was supported by the
factorial analysis conducted which determined that position in the organization was a
significant influence on EWE and its subscales. Future research should focus on
understanding how the responsibility of management influences the employee’s sense of
vigor, dedication, and overall EWE.
Non-manager n=1151st level supervisor
n=32Executive n=23
Overall EWE 5.34 5.89 6.13
Vigor 5.02 5.55 5.99
Dedication 5.59 6.07 6.30
Absorption 5.42 6.05 6.10
4.00
4.50
5.00
5.50
6.00
6.50
7.00
Me
an S
core
s p
er V
aria
ble
sc
ale
1-7
Position in Organization on EWE & Subscales
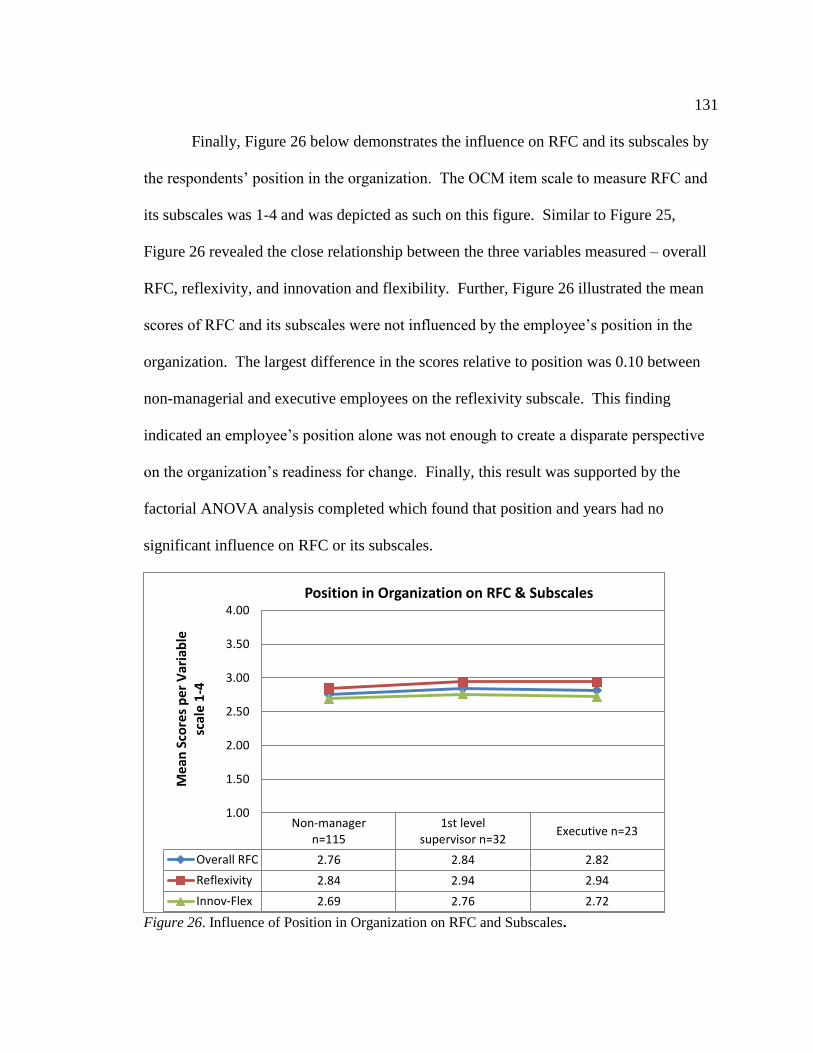
131
Finally, Figure 26 below demonstrates the influence on RFC and its subscales by
the respondents’ position in the organization. The OCM item scale to measure RFC and
its subscales was 1-4 and was depicted as such on this figure. Similar to Figure 25,
Figure 26 revealed the close relationship between the three variables measured – overall
RFC, reflexivity, and innovation and flexibility. Further, Figure 26 illustrated the mean
scores of RFC and its subscales were not influenced by the employee’s position in the
organization. The largest difference in the scores relative to position was 0.10 between
non-managerial and executive employees on the reflexivity subscale. This finding
indicated an employee’s position alone was not enough to create a disparate perspective
on the organization’s readiness for change. Finally, this result was supported by the
factorial ANOVA analysis completed which found that position and years had no
significant influence on RFC or its subscales.
Figure 26. Influence of Position in Organization on RFC and Subscales.
Non-managern=115
1st levelsupervisor n=32
Executive n=23
Overall RFC 2.76 2.84 2.82
Reflexivity 2.84 2.94 2.94
Innov-Flex 2.69 2.76 2.72
1.00
1.50
2.00
2.50
3.00
3.50
4.00
Mea
n S
core
s p
er V
aria
ble
sc
ale
1-4
Position in Organization on RFC & Subscales

132
In conclusion, when Figures 23 and 25 were examined, they appeared to
demonstrate that an employee’s years and position at an organization had a minor or
modest influence, respectively, on an employee’s level of work engagement. Further, the
factorial ANOVA analysis demonstrated that the category of position was a statistically
significant influence. However, based upon Figures 24 and 26, only the number of years
worked at the organization appeared to have a very minor influence on the employee’s
perspective of the organization’s readiness for change. However, this was not supported
by any other analysis completed in this study so the finding was not considered to be
significant.
When the position and years employed categories and their influence on EWE
were compared, the dedication subscale was noted to be the highest mean score across all
categories. Recall, “dedication is characterized by a sense of significance, enthusiasm,
inspiration, pride, and challenge” (Schaufeli et al., 2002, p. 74). The data appeared to
suggest an organization’s efforts to develop employee dedication across all positions and
years in the organization would be beneficial. Further, the importance of employee
dedication was confirmed in the hierarchical regression analysis.
Position and Years in Organization - Influence on Qualitative Responses.
Finally, an analysis was conducted to determine the influences the respondent
characteristics of position and years in the organization on the qualitative responses
provided for item 28 on the instrument: “At work, what contributes most to your desire to

133
do your best?” The item included a statement indicating the response could reflect
personal and/or work-related influences.
Using a deductive approach, each response was read and coded by assigning it to
one of three classifications: personal resources, job resources, and combination. These
classification choices were made as personal resources and job resources have been
confirmed in the research as antecedents of EWE. Therefore, for this content analysis,
the coding plan specified the following:
Personal resource: indicated by statements that discussed the internal
resources, physical or psychological, the respondent brought to the
workplace;
Job resource: indicated by statements that discussed the external
resources, physical or psychological, the respondent received from the
workplace;
Combination: indicated by a statement that comprised references to both
personal and job resources.
Examples of personal resource statements included “my values and work ethic”,
“pride in myself”, “my ambition to be better than I was yesterday”, and “personal
gratification.” Job resource items comprised statements such as “the people –
management – excellent workers”, “recognition of a job well done and time to do it
correctly”, “the relationship with my manager”, and “salary and raises.” Combination
statements encompassed responses such as “the desire to excel personally, coupled with
an environment that acknowledges success and effort”, “pride in my work and a pay

134
check”, “I want to do the best job for the guys in the shop so they are happy it is my
project to work on”, and “Respect for myself and the respect and appreciation of co-
workers.”
After the researcher read, coded, and reviewed the statements in each
classification for consistency, the statements were sorted by the respondents’ years of
employment and position in the organization, respectively, in order to examine
influences. Further, to confirm interrater reliability, a colleague with experience in EWE
research was asked to repeat the qualitative analysis process. The initial interrater
reliability score was 75.5%; however, after discussion to align perspectives on the codes
being used and each statement not agreed upon, the inter-rater reliability increased to
97.9%.
Influences by Position.
Figures 27-29 demonstrated the resource influences, by position, that contributed
to the employee’s desire to do their best work. Based on their responses, it was
determined non-managers and first-level supervisors (Figure 27 and 28) shared similar
levels of personal resource influences, 53% and 50% respectively. In both positions, the
job resources accounted for approximately one third of the contribution and the
combination category reflected a 16% influence.

135
Figure 27. Non-Managers - Influences on Desire to do Best Work.
Figure 28. First-level Supervisor - Influences on Desire to do Best Work.
For this analysis, it was also important to particularly consider the influence of the
combination resources as these reflected a statement by the respondent which included
both personal resources and job resources. Therefore, if one evenly disaggregated the
percentages of the combination category for the non-managerial and first-level supervisor
positions, personal resources would be enlarged to 61% and 58%, and job resources 39%
and 42%, respectively. Based on this data, the researcher concluded that in these
positions the personal resources the individual employee brought to the organization were
53% 31%
16%
Contributes most to desire to do best? Non-managers
Personal Resources, 53%
Job Resources, 31%
Combination, 16%
50%
34%
16%
Contributes most to desire to do best? First-level Supervisors
Personal Resources, 50%
Job Resources, 34%
Combination, 16%
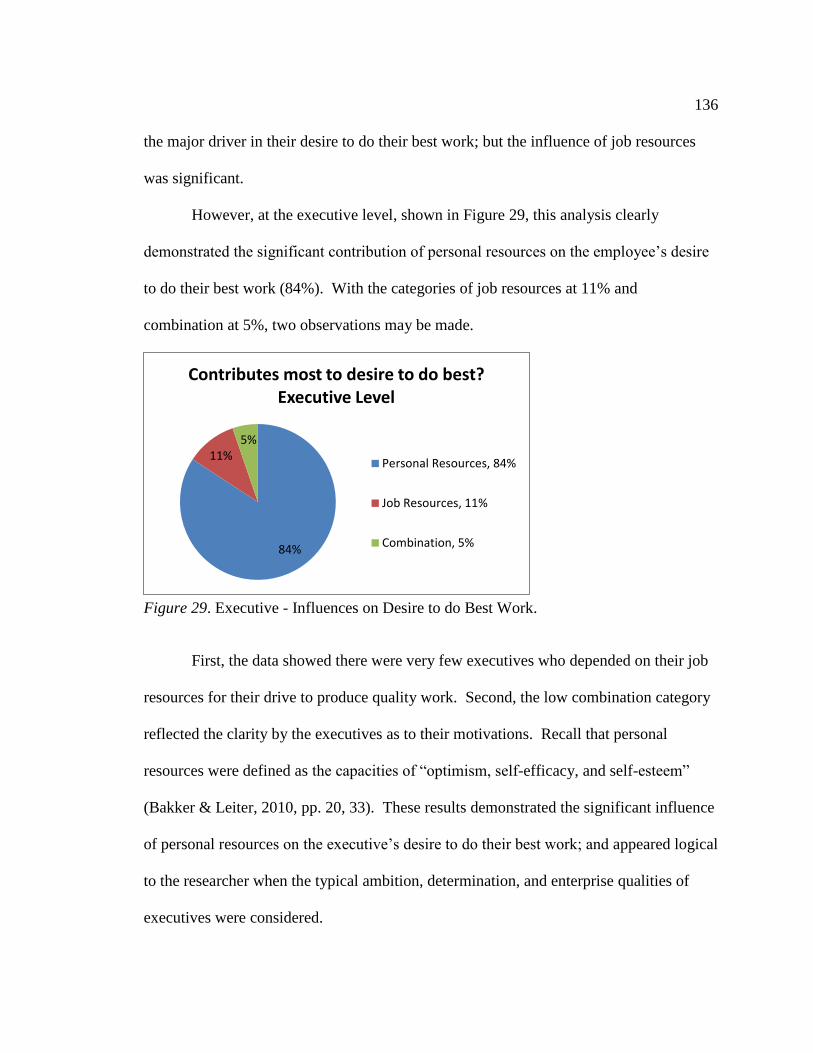
136
the major driver in their desire to do their best work; but the influence of job resources
was significant.
However, at the executive level, shown in Figure 29, this analysis clearly
demonstrated the significant contribution of personal resources on the employee’s desire
to do their best work (84%). With the categories of job resources at 11% and
combination at 5%, two observations may be made.
Figure 29. Executive - Influences on Desire to do Best Work.
First, the data showed there were very few executives who depended on their job
resources for their drive to produce quality work. Second, the low combination category
reflected the clarity by the executives as to their motivations. Recall that personal
resources were defined as the capacities of “optimism, self-efficacy, and self-esteem”
(Bakker & Leiter, 2010, pp. 20, 33). These results demonstrated the significant influence
of personal resources on the executive’s desire to do their best work; and appeared logical
to the researcher when the typical ambition, determination, and enterprise qualities of
executives were considered.
84%
11% 5%
Contributes most to desire to do best? Executive Level
Personal Resources, 84%
Job Resources, 11%
Combination, 5%

137
Resource Influences by Years Employed.
Figures 30 below illustrated the resource influences by years of employment. An
analysis of each category was completed and then considered against the results of the
position resource influences. The data for new (< 1 year) employees demonstrated job
resources provided by the organization contributed to their desire to do their best work
(47%) where as personal resources accounted for 33%. Recall, job resources included
“pay, career opportunities, job security, supervisor and co-worker support, team climate,
role clarity, participation in decision making, skill variety, task identity, task significance,
autonomy, and performance feedback” (Bakker & Demerouti, pp. 312-313).
Figure 30. Years of Employment- Influences on Desire to do Best Work.
< 1 year 1-5 years 6-10 years 11-15 years > 15 years
Personal Resources 33% 62% 50% 67% 60%
Job Resources 47% 33% 32% 13% 22%
Combination 20% 5% 18% 20% 18%
20%
5%
18% 20% 18%
47%
33%
32%
13% 22%
33%
62% 50%
67% 60%
0%
10%
20%
30%
40%
50%
60%
70%
80%
90%
100%
Pe
rce
nta
ge C
on
tib
uti
on
Years of Employment Influences

138
Further, if the combination category was evenly disaggregated for the < 1 year
category, job resources as an influence would be increased to 57%. It appeared this result
indicated a new employee’s desire to be supported by the organization in achieving
success at their position. Interestingly, for each subsequent years-employed category, the
personal resources scales increased significantly while the influence of job resources
decreased to the lowest in the categories of 11-15 years and > 15 years at 13% and 22%
respectively.
These results appeared to reflect the employee’s confidence in the resources
provided by the organization and a growth in their personal self-esteem and self-efficacy.
A final observation was made that the combination category scores remained fairly
steady in the final three years-related categories.
In the next chapter, the results from this study are summarized and a discussion
regarding implications, limitation, and future research are provided.

139
Chapter 5
Summary, Conclusions, and Recommendations
An organization that exists in a dynamic and complex environment finds this
setting creates the need for consistent internal change in order to stay relevant and
competitive. Successful change efforts are critical to an organization’s strategy and
growth and, therefore, an understanding of how to best manage these change efforts is of
interest to innovative and forward-looking organizations. Two factors critical to the
success of a change effort were the subject of this study. One of these factors related to
the organization’s employees level of engagement, and the second was the organization’s
level of change readiness.
Purpose
The goal of this study was to examine whether employees’ level of work
engagement was important to employees’ perceptions of the organization’s level of
readiness for the change effort in manufacturing organizations in south-central
Pennsylvania. As no empirical studies were found which examined the direct
relationship between employee perceptions regarding work engagement and
organizational change readiness, this study adds to the existing literature by empirically
examining that relationship in the manufacturing sector.
Further, as a result of this research and its contribution to the literature, it was
feasible the importance of employee work engagement would be enhanced due to its

140
demonstrated relationship with employees’ perceptions regarding their respective
organization’s readiness for change. In addition, it was anticipated that the recognition of
this important relationship would create the potential for the development of policies and
practices within organizations and the OD field. Finally, it was expected that
manufacturing organizations, in particular, would choose to further examine this study’s
results to obtain a practical benefit as it provided knowledge to assist organization or OD
practitioners to assess work engagement and readiness for change.
Research Questions
RQ1: What is the relationship between overall employee work engagement and
overall organizational change readiness?
RQ2: What is the relationship between each of the subscales of employee work
engagement (vigor, dedication, and absorption) and overall organizational change
readiness?
RQ3: What is the relationship between overall employee work engagement and
each of the subscales indicating organizational change readiness (reflexivity, and
innovation and flexibility)?
RQ4: To what extent is organizational change readiness – measured by the two
subscales of innovation and flexibility, and reflexivity – influenced by (a) the
employee work engagement factors of vigor, dedication, absorption; (b) employee
position in the organization; (c) the number of employees in the organization; and

141
(d) organizational changes experienced by the employee, including new
leadership, reorganization, downsizing, and/or merger/acquisition?
Research Method
UWES-9 and OCM Instrumentation
To explore the multiple variables and inter-relationships posed in the four
research questions, a 28-item cross-sectional survey – comprised of seven descriptive
items, 20 Likert-scale items, and one qualitative item – measured the level of employees’
self-reported work engagement and the employees’ perceptions regarding the level of
organizational readiness for change in manufacturing organizations.
Employee work engagement (EWE) was measured via the three subscales of
vigor, dedication, and absorption using the nine-item Utrecht Work Engagement Survey
(UWES-9). The Cronbach’s alpha in this study for the UWES-9 items measuring EWE
was .905. Employees’ perceptions of their organization’s readiness for change (RFC)
were measured with the Organizational Climate Measure (OCM), an instrument of 17
subscales including the two that indicated readiness for change in this study: (a)
reflexivity and (b) innovation and flexibility. The Cronbach’s alpha in this study for the
OCM items measuring RFC was .928. Content validity for the final instrument was
established based upon a review by a panel of experts and the Executive Director of MA.

142
UWES-9 was a self-reporting survey and measured employee work engagement
including the three dimensions of work engagement: vigor, dedication, and absorption.
Schaufeli et al. (2002) defined each of these characteristics in the following way:
Vigor is characterized by high levels of energy and mental resilience while
working, the willingness to invest effort in one’s work, and persistence even in
the face of difficulties. Dedication is characterized by a sense of significance,
enthusiasm, inspiration, pride, and challenge….[and] absorption, is characterized
by being fully concentrated and deeply engrossed in one’s work, whereby time
passes quickly and one has difficulties…detaching oneself from work. (pp. 74-75)
Sample UWES-9 items on the questionnaire included: “When I get up in the
morning, I feel like going to work.” to measure vigor; “I am enthusiastic about my job.”
to measure dedication; and “I get carried away when I am working.” to measure
absorption (Schaufeli et al., 2006, p. 714).
The OCM subscales used in this study comprised (a) reflexivity and (b)
innovation and flexibility. The full OCM instrument was developed as a multi-
dimensional measure and the 17 subscales have been validated for use independently by
researchers as applicable to their particular study. “The measure is designed to…be
applicable across a range of work settings and to target all employee levels” (Patterson et
al., 2005, p. 383). Patterson et al. (2005) stated “The 17 scales contained within the
measure had acceptable levels of reliability and were factorially distinct” (p. 379).
The innovation and flexibility climate dimension measured “acceptance of new
ideas; ability to respond to change; identification of need for change; flexibility in

143
responding to changes needed in procedures; support in developing new ideas; and
orientation to improvement and innovation” (Rivard, 2005, p. 4). West (1996, 2000)
stated that reflexivity was concerned “with reviewing and reflecting upon objectives,
strategies, and work processes, in order to adapt to the wider environment” (as cited in
Patterson et al., 2005, p. 386)
Responses on the OCM were measured on a 4-point Likert scale: 1 = Definitely
false, 2 = Mostly false, 3 = Mostly true, and 4 = Definitely true. Sample items in the
Reflexivity dimension included: “In this organization, the way people work together is
readily changed in order to improve performance”; “The methods used by this
organization to get the job done are often discussed”; and “In this organization, time is
taken to review organizational objectives” (Patterson et al., 2005, p. 407).
Sample items in the Innovation and Flexibility dimension included: “The
company is quick to respond when changes need to be made”; “The organization is very
flexible; it can quickly change procedures to meet new conditions and solve problems as
they arise”; and “People in this organization are always searching for new ways of
looking at problems” (Patterson et al., 2005, p. 406).
Research Study Design
The research study was conducted with a sample of individuals employed in the
member companies of the Manufacturers’ Association of South-Central Pennsylvania
(MA). MA is an organization that provides support to the manufacturing organizations in
the specified region and enjoys relationships with more than 350 organizations with the

144
goal of making them more competitive, productive, and profitable. Due to their extensive
relationships with manufacturing organizations, MA was considered by the researcher to
be a visible and credible sponsor to the research.
This organization was also served as a gatekeeper in the study as the Executive
Director, due to past experience with the member companies, advised that a one-time
survey be conducted – this would deliver the best participation by respondents, whereas,
a pilot study would reduce involvement in a final study. Additional contributions from
MA representatives included a review of the instrument to be used, assistance in the
content validity process, and the facilitation of participation commitment by
organizations.
The total number of individual employees receiving the survey (email version and
paper version) for this study was 293. Those individual recipients that read the consent
form and chose to move to the survey instrument were considered to have provided their
implied consent. To address non-respondents, reminder emails and notifications were
communicated to all employees by the respective company representatives at appropriate
intervals. Individual non-respondents were not able to be identified or contacted directly
due to the anonymity of the survey. The final response rate calculation was based on the
number of individual employees that received the survey and those who responded. The
total usable sample of individual respondents was 172 for a survey response rate of
58.7%.
Methods to analyze the data included descriptive statistics, bivariate correlational
analyses, and hierarchical multiple regression. Additional analyses using factorial

145
ANOVA, pattern analysis, and the coding of qualitative data were completed to add
depth to the results and conclusions obtained from the quantitative data.
Summary and Discussion of Results
Descriptive Statistics for Work Engagement (EWE) and Readiness for Change
(RFC) Research Variables
The researcher examined the descriptive statistics of mean, median, and standard
deviation; and the normality of the seven research variables. Boxplots for each variable
and the distribution of the UWES-9 and OCM item responses were also examined for
normality.
The data for EWE indicated a relatively high level of employee work engagement
for these respondents in the manufacturing sector. Qualitatively, the means indicated a
level of work engagement that reflected being engaged Often – Very Often. The
descriptive statistics (Mean = 5.55, SD = .98) for overall work engagement fell between
Often and Very Often on the Likert response scale of (1) Never to (7) Always. Similarly,
the means for the three subscales reflected high levels of work engagement (Vigor – M =
5.25, SD = 1.24; Dedication – M = 5.77, SD = .97; and Absorption – M = 5.63, SD =
.99). These summary statistics provided additional evidence the summated Likert scale
scores were fairly normally distributed (the means were very similar to the median
values).
For RFC the data analyses indicated a moderately high level of readiness for
change for these respondents in the manufacturing sector. Qualitatively, the means

146
indicated a significant level of readiness for change with respondents most often
indicating the statements were Mostly True. The descriptive statistics (Mean = 2.87, SD
= .62) for overall readiness for change fell more closely to Mostly True on the Likert
response scale of (1) Definitely False to (4) Definitely True. Similarly, the two subscales
reflected high levels of readiness for change (Reflexivity – M = 2.87, SD = .59; and
Innovation and Flexibility – M = 2.71, SD = .72). These summary statistics provided
additional evidence the summated Likert scale scores were fairly normally distributed
(the means were very similar to the median values).
Overall, the respondents in these manufacturing organizations were found to be
highly engaged and perceived their organizations at a higher level of readiness for
change. The normality of the distributions allowed further examination of the variables
using inferential statistics.
Bivariate Correlations between Work Engagement and Readiness for Change
Pearson correlations were calculated to examine the relationship between overall
employee work engagement (EWE) and overall organizational change readiness (RFC)
(RQ1), and an examination of each construct’s subscales was also made to determine
which may have had an influence on the relationship. Correlations were calculated to
examine the subscales of EWE – vigor, dedication, and absorption – to overall
organizational change readiness (RQ2); and to examine the dimensions of RFC –
innovation and flexibility, and reflexivity – to overall employee work engagement (RQ3).
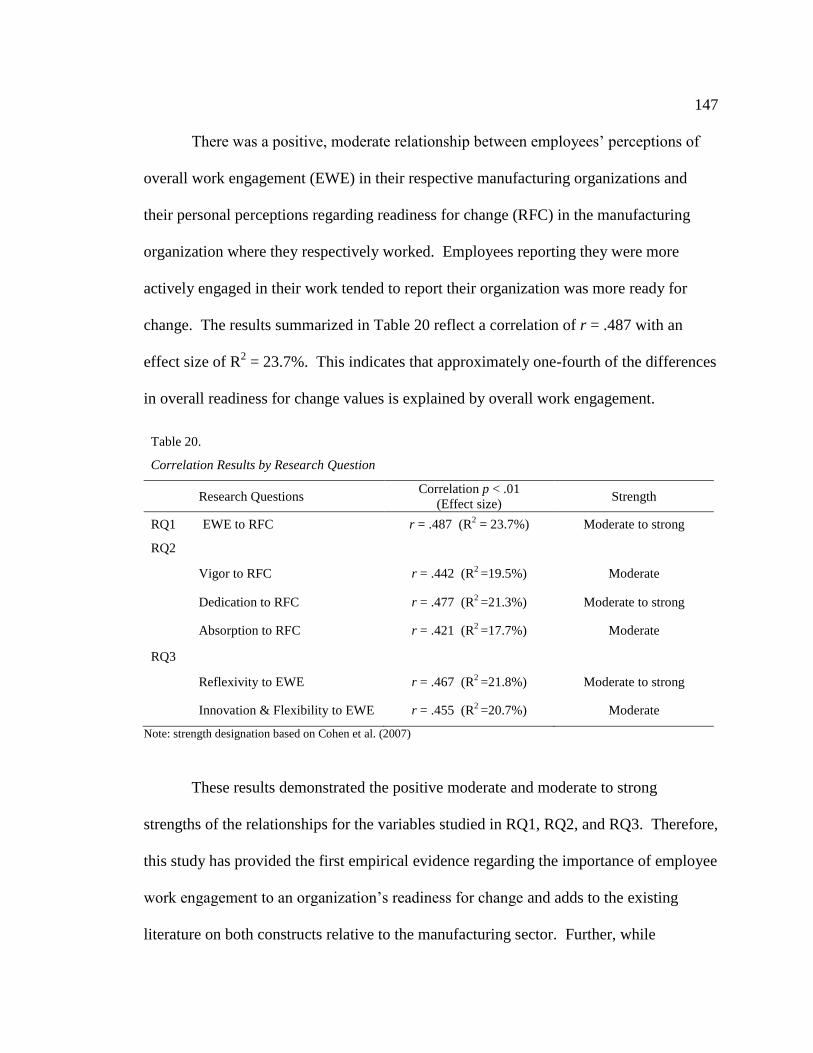
147
There was a positive, moderate relationship between employees’ perceptions of
overall work engagement (EWE) in their respective manufacturing organizations and
their personal perceptions regarding readiness for change (RFC) in the manufacturing
organization where they respectively worked. Employees reporting they were more
actively engaged in their work tended to report their organization was more ready for
change. The results summarized in Table 20 reflect a correlation of r = .487 with an
effect size of R2 = 23.7%. This indicates that approximately one-fourth of the differences
in overall readiness for change values is explained by overall work engagement.
Table 20.
Correlation Results by Research Question
Research Questions Correlation p < .01
(Effect size) Strength
RQ1 EWE to RFC r = .487 (R2 = 23.7%) Moderate to strong
RQ2
Vigor to RFC r = .442 (R2 =19.5%) Moderate
Dedication to RFC r = .477 (R2 =21.3%) Moderate to strong
Absorption to RFC r = .421 (R2 =17.7%) Moderate
RQ3
Reflexivity to EWE r = .467 (R2 =21.8%) Moderate to strong
Innovation & Flexibility to EWE r = .455 (R2 =20.7%) Moderate
Note: strength designation based on Cohen et al. (2007)
These results demonstrated the positive moderate and moderate to strong
strengths of the relationships for the variables studied in RQ1, RQ2, and RQ3. Therefore,
this study has provided the first empirical evidence regarding the importance of employee
work engagement to an organization’s readiness for change and adds to the existing
literature on both constructs relative to the manufacturing sector. Further, while

148
examining the relationships between the EWE subscales and the RFC subscales was not a
research question in this study, the results related to these subscales found moderate
correlations from r = .376 to r = .455 significant at the p < .01 level.
While the implication and recommendation section will discuss these results in
detail, the overall conclusion made by this researcher from these findings is that an
employee’s psychological state at work – explained by their vigor, dedication, and
absorption – is positively moderately correlated to the employee’s perception regarding
the organization’s readiness for change as measured by innovation and flexibility, and
reflexivity.
Hierarchical Multiple Regression Analysis of EWE, Personal and Organizational
Characteristics, and Readiness for Change
In separate analyses, the influences on the dependent variables of reflexivity, and
innovation and flexibility (the OCM subscales indicating RFC) were tested with nine
regression predictor variables including the three EWE subscales of vigor, dedication,
absorption; and the six employee demographic characteristics of position in the
organization, number of employees (a proxy for the size of the organization), and
employee change experiences related to new leadership, reorganization, downsizing, and
merger/acquisition.
It was concluded that for innovation and flexibility scores, dedication, as self-
reported by the employee, was the only variable with a significant influence in explaining
differences in the scores of the dependent variable (β = .307, p = .021). For reflexivity

149
the researcher concluded dedication scores (β = .296, p = .007) and absorption scores (β =
.242, p = .026) were very similar in explaining reflexivity score differences. Both
dedication and absorption have a positive influence on reflexivity.
Bakker and Demerouti (2009) concluded from their research that “men’s work
engagement and in particular their dedication is positively related to both in-role and
extra-role performance” (p. 226). Therefore, this study’s results add to the current
literature and provides evidence regarding the particular importance of an employee’s
level of dedication to an organization’s readiness for change and strengthened the
significance of the moderate to strong correlation measured between dedication and
overall RFC (r = .477, p < .01). The employee’s level of absorption is significant in its
influence on the employee’s perception of the organization’s reflexivity – the adaptability
to the wider organizational environment by examining policies, procedures, objectives,
and strategies.
Finally, this researcher finds that not only is overall employee work engagement
related to organizational readiness for change in the manufacturing organizations studied,
but dedication and absorption have particular importance to the types of change readiness
the organization may experience. While these findings will be discussed in more detail in
the recommendation section of this chapter, generally, it may be expected that these
results provide an understanding that will encourage organizations and OD practitioners
to examine these employee characteristics and seek ways to increase their dedication to
their work and absorption in their work in order to better prepare the organization for
future change efforts.

150
Additional Results
To provide a richer analysis of the quantitative data and enhance the results
related to the research questions, the researcher used three methods to investigate the
influence of the demographic characteristics of position and years in the organization on
overall EWE, overall RFC, and the subscales of each construct. All three analyses
demonstrate that in these manufacturing organizations an employee’s position was
significantly related to their level of engagement.
First, the data were examined, using factorial ANOVA, to statistically determine
whether there was a significant interaction between the position of the respondents with
years in the current organization with each RFC subscale of innovation and flexibility,
and reflexivity, or total RFC. There was no significant statistical interaction found at the
≤ 0.05 significance level.
Next, an assessment was made to determine whether there was a significant
interaction between these same demographic characteristics with each EWE subscale of
vigor, dedication, absorption, or total EWE. The results of the factorial ANOVA
demonstrated that there was a significant statistical interaction found for each variable
(.004, .008, .001, and .001 respectively) with position at the ≤ 0.05 significance level.
Therefore, the results of this study demonstrated that an employee’s position in the
organization has a direct interaction with their overall level of engagement and each
dimension of their engagement.
Second, distinct explorations were made of the respondents’ position and years in
the organization relative to the mean scores of all study variables through graphical

151
illustrations in order to find any patterns of influence. The results demonstrated that
years in the organization do not impact either the employee’s level of engagement or the
organization’s readiness for change. The study also showed that the employee’s position
does not influence RFC; however, position did appear to influence the changes in the
mean scores for overall EWE and its subscales. These results supported those obtained
through the factorial ANOVA regarding the relevance of an employee’s position to their
level of engagement.
Finally, through statement coding, the year and position characteristics of the
respondents were studied to understand their influence on the responses to the qualitative
question posed. The results of this content analysis demonstrated that, most often, an
employee’s personal resources were the major contributing factor to their desire to do
their best at work. While the < 1 year category of employees ranked the contribution of
personal resources as 33% in importance, employees in the 1-5 years to > 15 years
categories rated this contribution as 50-67%. When examined relative to position, the
level of importance of personal resources significantly increased as an employee moved
up from non-managerial (53%) to executive (84%). As personal resources are
antecedents to employee engagement, these qualitative results also support those of the
factorial ANOVA regarding the importance of an employee’s position to their level of
engagement. Implications regarding these qualitative results are discussed in the next
section.

152
Implications and Recommendations
The results of this study demonstrated the participants were a highly engaged and
highly ready for change manufacturing workforce. Further, these results have
implications for the available literature on the constructs of employee work engagement
and organizational readiness for change and are the basis of recommendations for
organizations and OD practitioners.
Implications for the Literature
As a result of this empirical study, the literature on several topics is advanced
including (a) the importance of personal and/or job resources on employee work
engagement (Baumgardner, 2014; Ghitulescu, 2013; Kim, 2014; Schaufeli et al., 2002;
Xanthopoulou et al., 2007); (b) the particular significance of personal resources on the
employee’s desire to do their best work; and (c) the influence of the employees’
dedication on the organization’s readiness for change which adds to the extant literature
on its impact on performance at the individual and organizational level (Bakker &
Demerouti, 2009).
Further, the literature related to the constructs of work engagement and readiness
for change will incorporate the relationship of these concepts in a way that previously did
not exist beyond theory. Specifically, my research relates to assertions, discussed in the
literature review, by Madsen et al. (2005), Avey et al. (2008), Weiner (2009), Spreitzer et
al. (2010), and Ghitulescu (2013). These connections are explained in the next sections.

153
Madsen et al. (2005).
Madsen et al. (2005) empirically researched factors that contributed to an
individual’s readiness for change in an organization, specifically organizational
commitment and social relationships. While not studying the work engagement construct
directly organizational commitment (a) was found to be strongly linked to organizational
readiness for change and (b) represents an outcome of employee work engagement in the
JD-R Model used in this study. However, it could be posited that commitment to the
organization may provide commitment to change. Further, social relationships were
shown to have a slight link to organizational readiness for change and, relative to this
study, represent a type of job resource. Therefore, this study complements the research
of Madsen et al. by providing the direct link between work engagement and
organizational readiness for change.
Avey et al. (2008).
Though it did not examine the total work engagement construct of the JD-R
model, empirical research by Avey et al. (2008) discussed the importance of personal
resources – an antecedent to engagement – to an organization’s readiness for change.
The qualitative analysis completed in my research confirms the significance of personal
resources at all positions and years in an organization to the employee’s desire to do their
best work. While it is an assumption at this point, I believe that doing their best work
could include an employee’s desire to facilitate an organization in a change effort.

154
Weiner (2009).
The work by Weiner (2009) was conceptual; therefore, his work did not
empirically connect any of the specific work engagement factors used in this study to
readiness for change. However, the author developed a framework to highlight the
determinants of implementation effectiveness in a change effort and included
organizational readiness for change and change-related efforts. Organizational readiness
for change was described, in part, by organizational commitment.
While organizational commitment is not a work engagement factor or antecedent,
it is an outcome of work engagement as demonstrated in the JD-R Model. Therefore, as
with Madsen et al. (2005), it might be considered that commitment to the organization
may provide commitment to change. Further, the contextual factors highlighted by
Weiner – organizational culture, resources, structure, past experience, and policies and
procedures – align with the concept of job resources. Job resources are one of the
antecedents to employee work engagement in the JD-R model used in this study.
Finally, this study supports and complements the work by Weiner (2009) by
providing empirical results linking employee work engagement and organizational
readiness for change. This study is supported by Weiner in that the importance of
readiness to change is highlighted as a determinant of change implementation
effectiveness.
155
Spreitzer et al. (2010).
Though not empirical research, based on their examination of the extant research,
Spreitzer et al. (2010) reported on their belief that there was a relationship between
readiness for change and employee’s resilience, energy, and persistence. If these key
psychological states are considered relative to this research, resilience is a type of
personal resource, energy describes vigor, and persistence describes dedication.
Therefore, my empirical research confirms these authors’ conclusion by demonstrating
the significance of personal resources (qualitative analysis) and the work engagement
subscales of vigor and dedication to an organization’s readiness for change (bivariate
correlations and hierarchical regression analyses).
Ghitulescu (2013).
The final research discussed in the literature review was the relationship
investigated by Ghitulescu (2013). In her study, the author examined the influence of job
resources on organizational readiness for change. Relative to this study, job resources are
an antecedent of employee work engagement in the JD-R model.
The focus on job resources by Ghitulescu (2013) may have been based on the
belief that these resources are those that the organization can influence. As shown in my
qualitative analysis, job resources are important, especially in the first year in an
organization; however, I can also assert that an employee’s personal resources; and levels
of vigor, dedication, and absorption (as shown in bivariate correlations) are also

156
significant to the organization’s readiness for change, particularly manufacturing
organizations as shown in this study.
Next, based on the results of this study, I present implications and offer
recommendations for organizations and OD practitioners.
Implications and Recommendations for Organizations and OD Practitioners
An important implication of this study is the new information available to the
leaders of manufacturing organizations and OD practitioners. Prior research provided
organizations with the knowledge that employee engagement is related to turnover
intention and performance results for the individual and the organization (Bakker &
Demerouti, 2009; Kim, 2014a; Kim et al., 2013; Schaufeli & Bakker, 2010). Based on
this study’s bivariate correlation analyses, the results demonstrate that EWE is related to
the organization’s ability to be ready for future changes. Therefore, in the dynamic
business environment, progressive manufacturing organizations may increasingly value
employee work engagement.
Further, in addition to other factors, these organizations must acknowledge that
the success (or lack thereof) of change effort implementations may be related to their
internal practices that positively (or negatively) influence employee work engagement.
This knowledge may intensify an organization’s efforts to actively promote the
development of behaviors and activities aimed at increasing employee engagement so the
organization has the opportunity to become more innovative and flexible, and reflexive as
required by circumstances. Actions to increase engagement include enhancing the

157
employee’s job resources and offering opportunities for the employees to increase their
personal resources.
Next, this study offers empirical evidence, through hierarchical multiple
regression analysis, that of all the engagement dimensions, employee dedication has the
greatest influence on the organization’s readiness for change including the dimensions of
reflexivity and innovation and flexibility. This supports the research by Bakker and
Demerouti (2009) as to the significant influence of dedication on employee engagement.
Grounded in this knowledge, strategic actions a manufacturing organization might
take include seeking information on and attending to (a) an employee’s level of
dedication – how enthusiastic, inspired, proud, or challenged are they in their position;
(b) how the organization arouses employee dedication – i.e. management practices,
challenging tasks, and participative decision-making; and (c) hiring practices that
evaluate an employee’s dedication to their work such as behavioral or situational
interview questions or role plays.
In addition to dedication, using hierarchical multiple regression analysis to
examine this study’s data, employee absorption was also shown to influence an
organization’s reflexivity. Actions an organization might undertake to increase employee
absorption include providing (a) work that the employee finds interesting, and/or (b) a
workplace that limits distractions. If it is not possible based on the organization and/or
the employee’s position to limit distractions, periodically offering employees the time to
reflect on a challenging task may serve to captivate and engage them. This would also
serve to develop their personal resources of self-efficacy and self-esteem.

158
In addition, this study shows, through factorial ANOVA and pattern analysis, that
an employee’s position in the manufacturing organization is significant to their level of
engagement. At successive levels of responsibility, from non-manager to supervisor and
executive, employees are increasingly engaged. It is important to contemplate the
characteristics of a managerial position – i.e. autonomy, self-direction, decision-making,
and self-efficacy – likely to increase employee engagement and consider how non-
managerial positions can be enhanced to incorporate similar intrinsic benefits. These
enhancements appear to provide the organization with opportunities to increase employee
engagement at all personnel levels.
Pattern analysis also demonstrated the contribution of personal resources to the
employees’ desire to do their best work. This result was found when examining all three
position levels – non-managerial, first-level supervisor, and executive – and for all
categories of years of employment in a manufacturing organization after the first year –
though the < 1 year category’s disaggregated result brought the importance of personal
resources close to 43%.
The qualitative personal resource statements provided by the respondents
appeared to express the employee’s intrinsic motivations to do their best work; therefore,
manufacturing organizations might consider asking their employees what contributes to
their desire to do their best at work. The results of this inquiry might illuminate areas of
potential personal or organizational improvement the leadership had not previously
considered, or considered important.

159
Finally, as these intrinsic employee motivations are so valuable, cultivation
through thoughtful action on the part of the organization and its leaders should be
considered. Organizational strategies to increase employee’s personal resources might
include offering opportunities to enhance feelings of self-esteem, self-efficacy, and
optimism through their work. Influencing these less tangible qualities may present a
challenge, but the results of this study demonstrate that the benefits of meeting the
challenge will be greater innovation, flexibility, and reflexivity within the organization
thereby increasing the organization’s readiness for change.
Limitations
This study was purposely limited to the south-central Pennsylvania region;
therefore, the literature would benefit from studies in other (a) regions in the state of
Pennsylvania, (b) states in the United States, and (c) countries. Further, the survey
responses are self-reported data and, therefore, are considered a limitation due to the
possible impact of social desirability bias on responses. In addition, due to the anonymity
of the survey, follow up with individual non-respondents was not possible.
Next, the research study was cross-sectional; therefore, the results indicated what
the respondents felt about their experiences and their organizations at a particular point in
time. Also, the incorporated OCM subscales of innovation and flexibility, and reflexivity
only explored internal factors relative to change readiness. Research that includes the
outward focus dimension would expand on this research.

160
Finally, the demographic data highlighted four additional limitations to the
study’s generalizability: (a) the study did not include any respondents employed outside
of the manufacturing sector; (b) government organizations were not part of the study; (c)
all organizations in this research were non-union organizations; and (d) the participating
organizations in the study were all small manufacturing organizations with less than 110
employees.
Recommendations for Future Research
Longitudinal studies using this research instrument with support from archival
data on successful change efforts is recommended. In addition, research across a larger
sample; in non-manufacturing, union, government; and/or medium, large, and
international companies would provide an enhanced perspective on the generalizability of
these results applicable to manufacturing organizations.
Future research should also further explore (a) the influence of dedication when
specific job resources are included as regression variables and (b) the most effective
approaches an organization might use to assess, influence, and increase employee
dedication. Further, gaining a clearer understanding of the characteristics of the
executive position that are particularly influential on employee engagement may be
helpful in devising appropriate strategies to increase engagement in non-managerial
employees. In addition, a full scale qualitative study is recommended to explore practical
and tangible ways an organization might provide their employees’ opportunities to grow

161
their personal resources including their resilience, optimism, self-esteem, and self-
efficacy.
To supplement the recommended studies on personal resources, I suggest that
future research should also focus on the topic of organization-based self-esteem (OBSE)
(Pierce, Gardner, Cummings & Dunham, 1989; Xanthopoulou et al., 2007). The
potential influence of OBSE on employee engagement and personal resources is
important to consider as it appears related to the combination category used in this
study’s qualitative analysis. According to Pierce, Gardner, Cummings, and Dunham
(1989), an employee whose self-esteem is high generally has greater feelings of self-
efficacy (p. 625). Efficacy at the task level provides task-specific self-esteem and
feelings of efficacy at a broader range of organizational tasks leads to OBSE (Pierce et
al., 1989, p. 625).
Finally, as employee engagement is a personal characteristic, this research will
benefit from an exploration of its results with a focus group of employees and/or
organizational leaders to gain their perspective. The leaders of this study’s organizations
have given their assent to participate in this focus group research in the future.

162
References
Alas, R. (2009). The impact of work-related values on the readiness to change in
Estonian organizations. Journal of Business Ethics, 86(2), 113-124.
doi:10.1007/s1055100898385
Alzahmi, R. A., Rothwell, W. J., & Kim, W. (2013). A practical evaluation approach for
OD interventions. International Journal of Research in Management, Economics
and Commerce, 3(3), 43-65. Retrieved from
http://www.indusedu.org/IJRMEC/March2013(Pdf)/4.pdf
Appelbaum, S. H., & Steed, A. J. (2005). The critical success factors in the client-
consulting relationship. The Journal of Management Development, 24(1), 68-93.
doi:10.1108/02621710510572362
Armenakis, A. A., Harris, S. G., & Mossholder, K. W. (1993). Creating readiness for
organizational change. Human Relations, 46(6), 681-703.
doi:10.1177/001872679304600601
Avey, J. B., Wernsing, T. S., & Luthans, F. (2008). Can positive employees help positive
organizational change? Impact of psychological capital and emotions on relevant
attitudes and behaviors. The Journal of Applied Behavioral Science, 44(1), 48-70.
doi:10.1177/0021886307311470

163
Axelrod, E., Cady, S., & Holman, P. (2010). Whole system change: What it is and why it
matters. In W. J. Rothwell, J. M. Stavros, R. Sullivan, & A. Threlkeld-Sullivan
(Eds.), Practicing organization development: A guide for leading change. (3rd
ed., pp. 363-376). San Francisco, CA: Pfeiffer & Co.
Bakker, A. B., & Demerouti, E. (2007). The job demands-resources model: State of the
art. Journal of Managerial Psychology, 22(3), 309-328.
doi:10.1108/02683940710733115
Bakker, A. B., & Demerouti, E. (2008). Towards a model of work engagement. Career
Development International, 13(3), 209-223. doi:10.1108/13620430810870476
Bakker, A. B., & Demerouti, E. (2009). The crossover of work engagement between
working couples. Journal of Managerial Psychology, 24(3), 220-236.
doi:10.1108/02683940910939313
Bakker, A. B., & Leiter, M. P. (Eds.). (2010). Work engagement: A handbook of theory
and research. New York, NY: Psychology Press/Taylor & Francis Group.
Bakker, A. B., Schaufeli, W. B., Leiter, M. P., & Taris, T. W. (2008). Work engagement:
An emerging concept in occupational health psychology. Work and Stress, 22(3),
187-200. doi:10.1080/02678370802393649
Baumgardner, C. Z. (2014). “Critical Demographic and Workplace Factors That
Influence Work Engagement in Nursing Practice in Pennsylvania. Diss. Penn
State University, 2014. Retrieved from https://etda.libraries.psu.edu/

164
Bevan, R. (2011). Keeping change on track. The Journal for Quality and Participation,
34(1), 4-9. Retrieved from
http://search.proquest.com/docview/867280017?accountid=13158
Block, P. (2011). Flawless consulting: A guide to getting your expertise used. (3rd ed.).
San Francisco, CA: Pfeiffer & Co.
Burke, W. W. (1982). Organization development: Principles and practices. New York,
NY: Little, Brown, & Co.
Burke, W. W., Church, A. H., & Waclawski, J. (1993). What do OD practitioners know
about managing change? Leadership & Organization Development Journal,
14(6), 3-11. doi:10.1108/01437739310047038
Carucci, R. A., & Tetenbaum, T. J. (2000). The value-creating consultant: How to build
and sustain lasting client relationships. New York, NY: AMACOM.
Chawla, A., & Kelloway, K. E. (2004). Predicting openness and commitment to change.
Leadership and Organization Development Journal, 25(6), 485-498.
doi:10.1108/01437730410556734
Choi, M., & Ruona, W. E. A. (2011). Individual readiness for organizational change and
its implications for human resource and organization development. Human
Resource Development Review, 10(1), 46-73. doi:10.1177/1534484310384957

165
Church, A. H., Burke, W. W., & Van Eynde, D. F. (1994). Values, motives, and
interventions of organization development practitioners. Group & Organization
Management, 19(1), 5-50. doi:10.1177/1059601194191002
Cohen, L., Manion, L. & Morrison, K. (2007). Research methods in education. London,
UK: Routledge.
Cooperrider, D. L., & Whitney, D. (1998). The appreciative inquiry summit: Overview
and applications. Employment Relations Today, 25(2), 17-28.
doi:10.1002/ert.3910250203
Dillman, D. A. (2007). Mail and internet surveys: The tailored design method. (2nd ed.).
Hoboken, NJ: Wiley & Sons, Inc.
Dillman, D. A., Smyth, J. D., & Christian, L. M. (2014). Internet, phone, mail, and
mixed-mode surveys: The tailored design method (4th ed.). Hoboken: Wiley.
Drew, S. A. W., & Smith, P. A. C. (1995). The learning organization: "Change proofing"
and strategy. The Learning Organization, 2(1), 4-14. Retrieved from
http://search.proquest.com/docview/215658119?accountid=13158
Eby, L. T., Adams, D. M., Russell, J. E. A., & Gaby, S. H. (2000). Perceptions of
organizational readiness for change: Factors related to employees’ reactions to the
implementation of team based selling. Human Relations, 53(3), 419-442.
Retrieved from http://search.proquest.com/docview/231439122?accountid=13158

166
Elgamal, M. A. (2012). A proposed model of the determinants of the readiness for change
in small professional sub-organizations. GSTF Business Review (GBR), 1(3), 45-
50. doi:10.5176/2010-4804_1.3.93
Fowler, F. J. (2014). Survey research methods. (5th ed.). Thousand Oaks, CA: SAGE
Publications.
Ghitulescu, B. E. (2013). Making change happen: The impact of work context on
adaptive and proactive behaviors. The Journal of Applied Behavioral Science,
49(2), 206-245. doi:10.1177/0021886312469245
Hakanen, J. J., & Roodt, G. (2010). Using the job demands-resources model to predict
engagement: Analysing [sic] a conceptual model. In A.B. Bakker & M. P. Leiter,
(Eds.), Work engagement: A handbook of theory and research. (pp. 85-101). New
York, NY: Psychology Press/Taylor & Francis Group.
Harter, J. K., Schmidt, F. L., Agrawal, S., & Plowman, S. K. (2013). The relationship
between engagement at work and organizational outcomes: 2012 Q12 meta-
analysis. Washington, DC: Gallup Inc.
Harter, J. K., Schmidt, F. L., Killham, E. A., & Asplund, J. W. (2006). Q12
meta-analysis.
Princeton, NJ: The Gallup Organization.
Holt, D. T., Armenakis, A. A., Feild, H. S., & Harris, S. G. (2007). Readiness for
organizational change: The systematic development of a scale. The Journal of
Applied Behavioral Science, (43)2, 232-255. doi:10.1177/0021886306295295.

167
Ingersoll, G. L., Kirsch, J. C., Merk, S. E., & Lightfoot, J. (2000). Relationship of
organizational culture and readiness for change to employee commitment to the
organization. Journal of Nursing Administration, 30(1), 11-20.
Jimmieson, N. L., Peach, M., & White, K. M. (2008). Utilizing the theory of planned
behavior to inform change management: An investigation of employee intentions
to support organizational change. Journal of Applied Behavioral Science, 44(2),
237-262. doi:10.1177/0021886307312773
Jones, R. A., Jimmieson, N. L., & Griffiths, A. (2005). The impact of organizational
culture and reshaping capabilities on change implementation success: The
mediating role of readiness for change. Journal of Management Studies, 41(2),
361-386. doi:10.1111/j.1467-6486.2005.00500.x
Kim, W. (2014). “An Examination of Work Engagement in Selected Major Organizations
in Korea: Its Role as a Mediator Between Antecedents and Consequences.” Diss.
Penn State University, 2014. Retrieved from https://etda.libraries.psu.edu/
Kim, W. (2014a). Introduction. In W. J. Rothwell (Ed.). Creating engaged employees:
It’s worth the investment (pp. 1-12). Alexandria, VA: ASTD Press.
Kim, W., Kolb, J. A., & Kim, T. (2013). The relationship between work engagement and
performance: A review of empirical literature and a proposed research agenda.
Human Resource Development Review, 12(3), 248-276.
doi:10.1177/1534484312461635
168
Levasseur, R. E. (2010). New OD: An integrative perspective. Organization
Development Journal, 28(3), 21-26. Retrieved from
http://search.proquest.com/docview/749238278?accountid=13158
Luthans, F., Avey, J. B., Avolio, B. J., Norman, S. M., & Combs, G. M. (2006).
Psychological capital development: Toward a micro-intervention. Journal of
Organizational Behavior, 27(3), 397-393. doi: 10.1002/job.373
Macey, W. H., & Schneider, B. (2008). The meaning of engagement. Industrial and
Organizational Psychology, 1, 3-30. doi:10.1111/j.1754-9434.2007.0002.x
Madsen, S. R., Miller, D., & John, C. R. (2005). Readiness for organizational change: Do
organizational commitment and social relationships in the workplace make a
difference? Human Resource Development Quarterly, 16(2), 213-234.
doi:10.1002/hrdq.1134
Meyers, L. S., Gamst, G. & Guarino A. J. (2006). Applied multivariate research: Design
and interpretation. Thousand Oaks, CA: SAGE Publications.
O’Rourke, J. S. (2013). Management communication: A case-analysis approach. (5th
ed.). Upper Saddle River, NJ: Prentice Hall
Oreg, S., Vakola, M., & Armenakis, A. (2011). Change recipients’ reactions to
organizational change: A 60-year review of quantitative studies. The Journal of
Applied Behavioral Science, 47(4), 461-524. doi:10.1177/0021886310396550

169
Patterson, M. G., West, M. A., Shackleton, V. J., Dawson, J. F., Lawthom, R., Maitlis, S.,
Robinson, D., L. & Wallace, A. M. (2005). Validating the organizational climate
measure: Links to managerial practices, productivity and innovation. Journal of
Organizational Behavior, 26(4), 379-408. doi:10.1002/job.312
Pierce, J. L., Gardner, D. G., Cummings, L. L., & Dunham, R. B. (1989). Organization-
based self-esteem: Construct definition, measurement, and validation. Academy of
Management Journal, 32(3), 622. Retrieved from
http://search.proquest.com/docview/199823581?accountid=13158
Rafferty, A. E., Jimmieson, N. L., & Armenakis, A. A. (2013). Change readiness: A
multilevel review. Journal of Management, 39(1), 110-135.
doi:10.1177/0149206312457417
Rafferty, A. E., & Simons, R. H. (2006). An examination of the antecedents of readiness
for fine-tuning and corporate transformation changes. Journal of Business and
Psychology, 20(3), 325-350.
Rivard, J. (2005). Measures of organizational readiness. Alexandria, VA: National
Association of State Mental Health Program Directors.
Rothwell, W. J., & Sredl, H. J. (2000). The ASTD reference guide to workplace learning
and performance: Present and future roles and competencies (3rd ed., Vol. 1).
Amherst, MA: HRD Press.

170
Rothwell, W. J., Stavros, M., & Sullivan, R. L. (2010a). Introduction: Getting the most
from this resource. In W. J. Rothwell, J. M. Stavros, R. L. Sullivan, & A. Sullivan
(Eds.), Practicing organization development: A guide for leading change (3rd ed.,
pp. 1-8). San Francisco, CA: Pfeiffer & Co.
Rothwell, W. J., Stavros, M., & Sullivan, R. L. (2010b). Organization development and
change. In W. J. Rothwell, J. M. Stavros, R. L. Sullivan, & A. Sullivan (Eds.),
Practicing organization development: A guide for leading change (3rd ed., pp.
11-42). San Francisco, CA: Pfeiffer & Co.
Schaufeli, W. B., & Bakker, A. B. (2003). Utrecht work engagement scale: Preliminary
manual. Department of Psychology, Utrecht University, The Netherlands.
Retrieved from
http://www.wilmarschaufeli.nl/publications/Schaufeli/Test%20Manuals/Test_man
ual_UWES_English.pdf
Schaufeli, W. B., & Bakker, A. B. (2010). Defining and measuring work engagement:
Bringing clarity to the concept. In A.B. Bakker & M. P. Leiter, (Eds.), Work
engagement: A handbook of theory and research. (pp. 10-24). New York, NY:
Psychology Press/Taylor & Francis Group.
Schaufeli, W. B., Bakker, A. B., & Salanova, M. (2006). The measurement of work
engagement with a short questionnaire: A cross-national study. Educational and
Psychological Measurement, 66(4), 701-716. doi:10.1177/0013164405282471

171
Schaufeli, W. B., Salanova, M., González-romá, V., & Bakker, A. B. (2002). The
measurement of engagement and burnout: A two sample confirmatory factor
analytic approach. Journal of Happiness Studies, 3(1), 71-92.
doi:10.1023/A:1015630930326
Schein, E. H. (1990). Organizational culture. American Psychologist, 45(2), 109-119.
doi:10.1037/0003-066X.45.2.109
Schein, E. H. (1995). Process consultation, action research and clinical inquiry: Are they
the same? Journal of Managerial Psychology, 10(6), 1-6.
http://dx.doi.org/10.1108/02683949510093830
Scherer, J. J., & Alban, B. T. (2010). On the shoulders of giants: The origins of OD. In
W. J. Rothwell, J. M. Stavros, R. Sullivan, & A. Threlkeld-Sullivan (Eds.),
Practicing organization development: A guide for leading change. (3rd ed., pp.
71-93). San Francisco, CA: Pfeiffer & Co.
Shuck, B. (2011). Four emerging perspectives of employee engagement: An integrative
literature review. Human Resource Development Review, 10(3), 304-328.
doi:10.1177/1534484311410840
Smith, S. (2013, April 8). Determining sample size: How to ensure you get the correct
sample size. [Web log post]. Retrieved from
http://www.qualtrics.com/blog/determining-sample-size/

172
Sonnentag, S., Dormann, C., & Demerouti, E. (2010). Not all days are created equal: The
concept of state work engagement. In A. B. Bakker & M. P. Leiter (Eds.), Work
engagement: A handbook of theory and research (pp. 25-38). New York, NY:
Psychology Press/Taylor & Francis Group.
Spreitzer, G. M., Lam, C. F., & Fritz, C. (2010). Engagement and human thriving:
Complementary perspectives on energy and connections to work. In A. B. Bakker
& M. P. Leiter (Eds.), Work engagement: A handbook of theory and research.
(pp. 132-146). New York, NY: Psychology Press/Taylor & Francis Group.
Stavros, J. M., & Saint, D. K. (2010). SOAR: Linking strategy and OD to sustainable
performance. In W. J. Rothwell, J. M. Stavros, R. Sullivan, & A. Threlkeld-
Sullivan (Eds.), Practicing organization development: A guide for leading
change. (3rd ed., pp. 377-394). San Francisco, CA: Pfeiffer & Co.
Sweetman, D., & Luthans, F. (2010). The power of positive psychology: Psychological
capital and work engagement. In A. B. Bakker & M. P. Leiter (Eds.), Work
engagement: A handbook of theory and research. (pp. 54-68). New York, NY:
Psychology Press/Taylor & Francis Group.
Tabachnick, B. G., & Fidell, L. S. (2007). Using multivariate statistics. (5th ed.). Boston,
MA: Pearson.

173
Theodore, J. (2013). Organizational development interventions in learning organizations.
International Journal of Management & Information Systems, 17(1), 65-70.
Retrieved from
http://search.proquest.com/docview/1418458881?accountid=13158
Urdan, T. C. (2010). Statistics in plain English. (3rd ed.). New York, NY: Taylor Francis
Group, LLC.
Weiss, A. (2009). Million dollar consulting: The professional's guide to growing a
practice (4th ed.). New York, NY: McGraw-Hill.
Weiner, B. J. (2009). A theory of organizational readiness for change. Implementation
Science, 4(67), 1-9. doi:10.1186/1748-5908-4-67
Worley, C. G., & Feyerherm, A. E. (2003). Reflections on the future of organization
development. The Journal of Applied Behavioral Science, 39(1), 97-115.
doi:10.1177/0021886303039001005
Xanthopoulou, D., Bakker, A. B., Demerouti, E., & Schaufeli, W. B. (2007). The role of
personal resources in the job demands-resources model. International Journal of
Stress Management, 14(2), 121-141. doi:10.1037/1072-5245.14.2.121

174
Appendix A
Approval for Use of OCM Instrument

175
Appendix B
Approval for Use of JD-R Figure
Approval by Dr. Bakker and Emerald Publishing

176
Appendix C
Research Instrument
1. Check the type of your organization: Manufacturing Non-manufacturing/service
2. Which of the following best describes your organization: Union Non-union
3. Check your position: Non-Manager First-level Supervisor Executive-level Position
4. How many years have you been with your current organization: < 1 1-5 6-10 11-15 >15
5. Check the number of employees in your organization: 1-50 51-100 101-200 201-300 > 300
6. Which of the following organizational changes have you experienced within the last 3 years? Check all that apply:
____ Merger/acquisition
____ Downsizing
____ New Leadership
____ Reorganization
____ International expansion
____ Other (briefly describe)
7. Have you ever been actively involved in an organizational change effort? ____ Yes ____ No
Please indicate your response to each of the questions below. Your responses are confidential.
The following 9 statements are about how you feel at work. Please read each statement carefully and decide if you ever feel this way about your
job. If you have never had this feeling, choose “0” (zero). If you have had this feeling, indicate how often you feel it by choosing the number (from 1
to 6) that best describes how frequently you feel that way.

177
8. At my work, I feel that I am bursting with energy 0 1 2 3 4 5 6
9. At my job, I feel strong and vigorous 0 1 2 3 4 5 6
10. I am enthusiastic about my job 0 1 2 3 4 5 6
11. My job inspires me 0 1 2 3 4 5 6
12. When I get up in the morning, I feel like going to work 0 1 2 3 4 5 6
13. I feel happy when I am working intensely 0 1 2 3 4 5 6
14. I am proud of the work that I do 0 1 2 3 4 5 6
15. I am immersed in my work 0 1 2 3 4 5 6
16. I get carried away when I’m working 0 1 2 3 4 5 6
For the following statements, please indicate your response.
Scale: 1 = Definitely false 2 = Mostly false 3 = Mostly true 4 = Definitely true
17. In this organization, the way people work together is readily changed in order to improve performance 1 2 3 4
18. The methods used by this organization to get the job done are often discussed 1 2 3 4
19. There are regular discussions as to whether people in the organization are working effectively together 1 2 3 4
20. In this organization objectives are modified in light of changing circumstances 1 2 3 4
21. In this organization, time is taken to review organizational objectives 1 2 3 4
22. New ideas are readily accepted here 1 2 3 4
23. This company is quick to respond when changes need to be made 1 2 3 4
24. Management here are quick to spot the need to do things differently 1 2 3 4
25. This organization is very flexible; it can quickly change procedures to meet new conditions & solve
problems as they arise 1 2 3 4
26. Assistance in developing new ideas is readily available 1 2 3 4
27. People in this organization are always searching for new ways of looking at problems 1 2 3 4
28. At work, what contributes most to your desire to do your best? Your response may reflect personal or workplace influences.
(Please limit your response to 100 characters).

178
Appendix D
Box Plots Reflecting the Normality of the Mean Score for Each Research Variable
Vigor Scale Normality Dedication Scale Normality
Limited skewness with minor outliers Minimal skewness with minor outliers
Absorption Scale Normality Reflexivity Scale Normality
Limited skewness with minor outliers Normal distribution with minor outliers
Innovation & Flexibility Scale Normality Overall RFC Scale Normality
Normal distribution with no outliers Normal distribution with minor outliers

179
Overall EWE Scale Normality Normal distribution with minor outliers

180
Appendix E
IRB Approval for Human Subjects Research

VITA
Mary Jane Park
Education
The Pennsylvania State University, University Campus, State College, PA.
Doctor of Philosophy (PhD) in Human Resource Development/Organization Development in Workforce
Education and Development
Georgia State University, Robinson College of Business, Atlanta GA.
Master of Business Administration (MBA) in Marketing, December 2003
Bachelor of Business Administration (BBA) in Finance, Cum Laude, December 1999
Professional Certification
SPHR - Senior Professional in Human Resources, January 2011 to present. Expires 2017.
Professional Experience – Academic
2012 to present, Bloomsburg University of Pennsylvania, Bloomsburg, PA: Full Time Adjunct Faculty, College of
Business, Departments of Management and Marketing, and Business Education and ITM
2014 to present, Millersville University of Pennsylvania, Millersville, PA: Adjunct Faculty, College of Business,
Department of Management and Marketing
Book Chapters
Why Evaluate Organizational Change Efforts? William J. Rothwell (ed.)., in process.
What is Strategic Planning and Why Should You Care About It? Zygmont (Park) and Feenstra in Encyclopedia of
Human Resource Management, Vol 2, Human Resources and Employment Forms. Pfeiffer & Co. April 2012. W. J.
Rothwell (Executive Ed.), J. Lindholm, K. K. Yarrish & A. G. Zabellero (Vol. eds.).
Articles
Leadership and Stress Orientations of Japan and Russian Working Adults. Nguyen, L. & Park, M.J., in process.
Professional Memberships
Association of Talent Development (ATD) Management Community of Practice, 2014
SHRM – Society of Human Resource Management, 2010 to present
Professional Service
Coordinator of Communication Logistics: BAASANA 2015 Conference, August, New York, NY
Manuscript Reviewer:
2013-2016 Association for Human Resource Development (AHRD) Conference in the America’s –
paper reviewer for International: Global and Cross Cultural Issues Track
Association for Human Resource Development (AHRD) 2014 ASIA Conference – paper reviewer
Conferences
August 2015, BAASANA Conference: The Relationship of Employee Work Engagement to an Organization's
Readiness for Change: A Summary of the Dissertation Research. City University of New York, New York, NY.
June 2014, Business and Applied Sciences Academy of North America (BAASANA) Conference: The Approach of a
Consultant during a Long Term Change Effort in Private Organization in Pennsylvania: A Case Study. Ramapo
College, Mahwah, NJ