The relationship of blood flow velocity fluctuations to ...
7
J Neurosurg 76:415-421, 1992 The relationship of blood flow velocity fluctuations to intracranial pressure B waves DAVID W. NEWELL, M.D., RUNE AASLID, Ph.D., RENATE STOOSS, R.N., AND HANS J. REULEN, M.D. Department of Neurological Surgery, University of Washington, Sealtle, Washington, and Department of Neurosurgerj,. University of Bern, Bern, Switzerland ~" Intracranial pressure (ICP) and continuous transcranial Doppler ultrasound signals were monitored in 20 head-injured patients and simultaneous synchronous fluctuations of middle cerebral artery (MCA) velocity and B waves of the ICP were observed. Continuous simultaneous monitoring of MCA velocity, ICP, arterial blood pressure, and expired CO2 revealed that both velocity waves and B waves occurred despite a constant CO,. concentration in ventilated patients and were usually not accompanied by fluctuations in the arterial blood pressure. Additional recordings from the extracranial carotid artery during the ICP B waves revealed similar synchronous fluctuations in the velocity of this artery, strongly supporting the hypothesis that blood flow fluctuations produce the velocity waves. The ratio between ICP wave amplitude and velocity wave amplitude was highly correlated to the ICP (r = 0.8 l, p < 0.001). Velocity waves of similar characteristics and frequency, but usually of shorter duration, were observed in seven of 10 normal subjects in whom MCA velocity was recorded for 1 hour. The findings in this report strongly suggest that B waves in the ICP are a secondary effect of vasomotor waves, producing cerebral blood flow fluctuations that become amplified in the ICP tracing, in states of reduced intracranial compliance. KEY WO~tDS 9 intracranial pressure 9 B wave 9 transcranial Dopp]er ultrasound 9 intraeranial pressure monitoring 9 head injury L U~DBEntGI3rWaSlth ~ fir~ t 3 observe BWavVees in t e' taca "a pessue(CP);these a esare characterized as repetitive alterations in the ICP at frequencies of 0.5 to 2 waves per minute. The etiology and mechanism responsible for this phenomenon are unclear; however, the alterations have been attributed to cerebral blood flow (CBF) fluctuations, thought to be secondary to respiratory variations during abnor- mal breathing patterns) 3 Previous observations using standard transcranial Doppler ultrasound (TCD) mon- itoring have demonstrated velocity fluctuations at fre- quencies similar to those of B waves in head-injured patients and also in normal subjects. ~2.~7~tx Simultaneous recording of TCD and ICP signals has demonstrated synchronous variations in both parametersJ 2 Recent advances in TCD and digital signal processing allow continuous recording of velocity signals from the basal intracranial arteries simultaneously with other physiological parameters. Moreover, the relationship of these parameters can be compared using computer analysis. These techniques allow new insights into the pathophysiology ofintracranial hemodynamics in head- injured patients. The present study investigates the hy- pothesis that B waves are primarily due to vasomotor waves of the regulating vessels in the cerebral circula- tion, which are independent of respiration. It is further hypothesized that these vasomotor waves in turn pro- duce fluctuations in CBF and cerebral blood volume which are then reflected in the 1CP tracing, more prom- inently when the intracranial compliance is low. Clinical Material and Methods Simultaneous monitoring of arterial blood pressure, middle cerebral artery (MCA) velocity, ICP, and end- tidal CO_, was performed on 20 patients admitted with a diagnosis of closed head injury to the intensive care unit at lnselspital, in Bern, Switzerland. A total of 150 continuous recordings were obtained for intervals rang- ing from 15 minutes to 2 hours. All patients were intubated and artificially ventilated; agitated patients were mildly sedated using midazolam or paralyzed us- ing muscle relaxants. Patient ages ranged between 17 and 59 years (average 35 years); there were 17 males and three females. Admission Glasgow Coma Scale (GCS) scores ranged between 3 and 10, with an average score of 6. Patients were treated using a standard ap- J. Neurosurg. / Volume 76/March, 1992 415
Transcript of The relationship of blood flow velocity fluctuations to ...

J Neurosurg 76:415-421, 1992
The relationship of blood flow velocity fluctuations to intracranial pressure B waves
DAVID W. NEWELL, M.D., RUNE AASLID, Ph.D., RENATE STOOSS, R.N., AND HANS J. REULEN, M.D.
Department of Neurological Surgery, University of Washington, Sealtle, Washington, and Department of Neurosurgerj,. University of Bern, Bern, Switzerland
~" Intracranial pressure (ICP) and continuous transcranial Doppler ultrasound signals were monitored in 20 head-injured patients and simultaneous synchronous fluctuations of middle cerebral artery (MCA) velocity and B waves of the ICP were observed. Continuous simultaneous monitoring of MCA velocity, ICP, arterial blood pressure, and expired CO2 revealed that both velocity waves and B waves occurred despite a constant CO,. concentration in ventilated patients and were usually not accompanied by fluctuations in the arterial blood pressure. Additional recordings from the extracranial carotid artery during the ICP B waves revealed similar synchronous fluctuations in the velocity of this artery, strongly supporting the hypothesis that blood flow fluctuations produce the velocity waves. The ratio between ICP wave amplitude and velocity wave amplitude was highly correlated to the ICP (r = 0.8 l, p < 0.001). Velocity waves of similar characteristics and frequency, but usually of shorter duration, were observed in seven of 10 normal subjects in whom MCA velocity was recorded for 1 hour. The findings in this report strongly suggest that B waves in the ICP are a secondary effect of vasomotor waves, producing cerebral blood flow fluctuations that become amplified in the ICP tracing, in states of reduced intracranial compliance.
KEY WO~tDS �9 intracranial pressure �9 B wave �9 transcranial Dopp]er ultrasound �9 intraeranial pressure monitoring �9 head injury
L U~DBEntGI3rWaSlth ~ fir~ t 3 observe BWavVees in t e ' t a c a "a p e s s u e ( C P ) ; t h e s e a esare characterized as repetitive alterations in the ICP
at frequencies of 0.5 to 2 waves per minute. The etiology and mechanism responsible for this phenomenon are unclear; however, the alterations have been attributed to cerebral blood flow (CBF) fluctuations, thought to be secondary to respiratory variations during abnor- mal breathing patterns) 3 Previous observations using standard transcranial Doppler ultrasound (TCD) mon- itoring have demonstrated velocity fluctuations at fre- quencies similar to those of B waves in head-injured patients and also in normal subjects. ~2.~7~tx Simultaneous recording of TCD and ICP signals has demonstrated synchronous variations in both parametersJ 2
Recent advances in TCD and digital signal processing allow continuous recording of velocity signals from the basal intracranial arteries simultaneously with other physiological parameters. Moreover, the relationship of these parameters can be compared using computer analysis. These techniques allow new insights into the pathophysiology ofintracranial hemodynamics in head- injured patients. The present study investigates the hy-
pothesis that B waves are primarily due to vasomotor waves of the regulating vessels in the cerebral circula- tion, which are independent of respiration. It is further hypothesized that these vasomotor waves in turn pro- duce fluctuations in CBF and cerebral blood volume which are then reflected in the 1CP tracing, more prom- inently when the intracranial compliance is low.
Clinical Material and Methods
Simultaneous monitoring of arterial blood pressure, middle cerebral artery (MCA) velocity, ICP, and end- tidal CO_, was performed on 20 patients admitted with a diagnosis of closed head injury to the intensive care unit at lnselspital, in Bern, Switzerland. A total of 150 continuous recordings were obtained for intervals rang- ing from 15 minutes to 2 hours. All patients were intubated and artificially ventilated; agitated patients were mildly sedated using midazolam or paralyzed us- ing muscle relaxants. Patient ages ranged between 17 and 59 years (average 35 years); there were 17 males and three females. Admission Glasgow Coma Scale (GCS) scores ranged between 3 and 10, with an average score of 6. Patients were treated using a standard ap-
J. Neurosurg. / Volume 76/March, 1992 415

D. W. Newell, etal.
proach, with early surgical evacuation of mass lesions. Postoperative ICP was monitored in many patients, which accounted for the inclusion of some with a high- er GCS score. Moderate hyperventilation and intrave- nous mannitol administration were used to control ele- vated ICP.
Blood pressure monitoring was accomplished with standard intra-arterial catheters and pressure transduc- ers. Intracranial pressure was monitored using an epi- dural pressure recording device,* which was inserted through a burr hole. Continuous end-tidal CO2 signals were obtained using side-port sampling with an infrared CO2 detector. A 2-MHz pulsed range-gated ultrasound transducer, fixed with a headband, was used for TCD monitoring, Signals were recorded from the MCA trunk at a depth between 50 and 60 mm, located using pre- viously accepted criteria. 2 The spectral display was con- tinuously observed to insure signal consistency. The spectral outline that corresponds to the maximum ve- locity (Vm,~) of blood flow at the center of the artery was then taken as an analog signal and processed with three other analog signals (arterial blood pressure, ICP, and end-tidal CO2) through an analog-to-digital con- rotter. These waveforms were sampled at a 50-Hz fre- quency and stored digitally for analysis by an IBM-AT- compatible 386 personal computer.
In five head-injured patients, the extracranial internal carotid artery velocity was monitored simultaneously with arterial blood pressure, ICP, and end-tidal CO2 during ICP wave recording. This was accomplished using a hand-held 2-MHz probe, set at a depth of 50 mm and aimed from the angle of the mandible toward the foramen lacerum. All head-injured patients had velocity recordings obtained from both extracranial internal carotid arteries as part of their initial exami- nation, and both arteries were patent in all.
Recordings were also made of MCA velocity and end-tidal CO2 in a group of 10 healthy volunteers with no history of cerebrovascular disease. There were five men and five women, with ages ranging from 20 to 43 years (average 31 years). With the subjects on a stretcher, continuous recording was performed from the left MCA for 1 hour. Continuous simultaneous CO2 monitoring was conducted on expired air through a tight-fitting mask with an infrared CO2 detector.
Data Analysis
Data were analyzed using an IBM-AT-compatible 386 personal computer with a numerical coprocessor. Custom software, written by one of the authors (R.A.), was used to review the stored digital tracings from all patients. Those with continuous data recorded for at least 1 hour (between 1 and 2 hours) were selected for further analysis; the recordings in this group (69 record- ings from 17 patients) were analyzed for the presence of repealing fluctuations of the MCA velocity occur-
* Epidural pressure recording device manufactured by Gal- etec, Ltd., Dunvegan, Scotland.
ring at a frequency of 0.5 to 2 cycles per minute and were accompanied by similar fluctuations in the ICP. Fourier analysis was performed in selected cases in or- der to determine the amplitude-frequency relationships between the velocity waves and the ICP waves and to determine the relationship between these waves and the arterial blood pressure and CO2.
The effect of ICP on the velocity wave amplitude was examined using a linear regression analysis of the two parameters during a typical wave episode in each tracing of more than 1 hour. The effect of ICP on the ICP wave amplitude was also examined using an ex- ponential regression analysis of values obtained in this interval. Finally, the relationship of the degree of ICP fluctuation to a given degree of velocity fluctuation was analyzed; this was done by calculating the ICP wave amplitude during a typical occurrence of waves in each tracing of more than 1 hour that demonstrated waves. The ICP amplitude was divided by the amplitude of the MCA velocity, which was expressed as a percentage of the average mean velocity during the same wave. An exponential regression analysis was then performed comparing this ratio to the average ICP values when they were obtained.
Results
Recordings in Head-Injured Patients
Continuously monitored tracings lasted at least 1 hour in 69 of the 150 recordings. In 38 (55%) of the 69 recordings, repeat fluctuations in the MCA velocity were observed at a frequency of 0.5 to 2 waves per minute, each lasting at least 2 minutes. These velocity waves were completely synchronous with waves in the ICP tracing, and continued for quite variable periods, ranging from 2 minutes to the entire recording period in some patients (Fig. 1). The velocity waves often began and subsided with no identifiable cause; at times they were irregular in frequency and at other times they occurred quite regularly. They were always in phase with the ICP waves. Rapid changes in blood pressure did not appear to influence the waves. Hyperventilation did not abolish the waves but usually reduced the velocity and ICP wave amplitudes.
Fourier analysis was performed on all four simulta- neously recorded parameters (arterial blood pressure, MCA velocity, ICP, and end-tidal CO2) during selected intervals of waves to determine their relationship to each other. It was found that, during typical waves, the MCA velocity and ICP showed the same frequency- amplitude relationship; the arterial blood pressure and end-tidal CO2 did not typically share this same fre- quency-amplitude relationship. Figure 1 illustrates a Fourier analysis showing the ventilator frequency af- fecting all four parameters and the velocity wave fre- quency affecting ICP, but no changes in arterial blood pressure or end-tidal CO2 are seen. Occasionally, small blood pressure perturbations were found synchronous with the peaks of the waves, but there were many
416 J. Neurosurg. / Volume 76/March, 1992

Blood flow velocity fluctuations in ICP B waves
FZG. I. Upper Left: Illustration of typical velocity fluc- tuations occurring in the presence of B waves in intracranial pressure (ICP) (in mm Hg) which were independent of changes in arterial blood pressure (ABP) and CO2 concentration levels (both in mm Hg). Upper Right." Fourier analysis of the frequency of repeating waves (W) in the recorded parameters showing the velocity and ICP waves at a frequency of 2 cylces per minute and no changes at this frequency in ABP and CO2 levels. The respirator frequency (R) is seen at between 16 and 17 cycles per minute with an effect on all four parameters. Lower: Continuous trend in a head-injured patient demon- strating the persistence of waves throughout the entire record- ing session (> 70 minutes) unaffected by a rapid decline in blood pressure (arrow) or hyperventilation (arrow). MCA = middle cerebral artery velocity (in cm/sec).
instances when no such blood pressure changes were seen.
The amplitude of the velocity waves varied between patients and also during continuous tracings in the same patient. Since relative changes in the MCA velocity have been shown to correlate with relative changes in volume flow in certain circumstances, ~ the amplitude of the waves was calculated as a percentage of the average mean velocity. If there was no significant change in the MCA diameter, variations from this baseline should represent percentage changes in blood flow. The maximum velocity wave amplitude observed in one head-injured patient was 49% of the average mean velocity during the fluctuations. The average velocity wave amplitude for the group analyzed during the maximum wave activity was 23.1% _+ 8.05% (_+ standard deviation) of the average mean velocity.
The amplitude of the ICP fluctuation in response to a given velocity wave amplitude varied between differ- ent monitoring sessions and also during different inter- vals of the same session, and appeared to be dependent on the ICP. First, to determine whether the amplitude of the velocity waves was affected by the ICP, a regres- sion analysis was performed between these two pa- rameters. This regression analysis revealed an inverse relationship between ICP and velocity wave amplitude
(r = -0.39, p < 0.05) (Fig. 2 left). Second, an exponen- tial regression analysis was performed between the av- erage ICP and the amplitude of the ICP waves, revealing a strong correlation (r = 0.69, p < 0.001) (Fig. 2 center). The best correlation, however, was found by exponen- tial regression analysis between the ICP and the ratio of amplitudes of the ICP wave to the same velocity wave (r = 0.81, p < 0.001), as shown in Fig. 2 right. This ratio corrects for the varying strength of the un- derlying "wave generator," and essentially expresses how the amplitude relationship between classic B waves in the ICP and the velocity waves seen on the TCD recordings is influenced by changing levels of ICP.
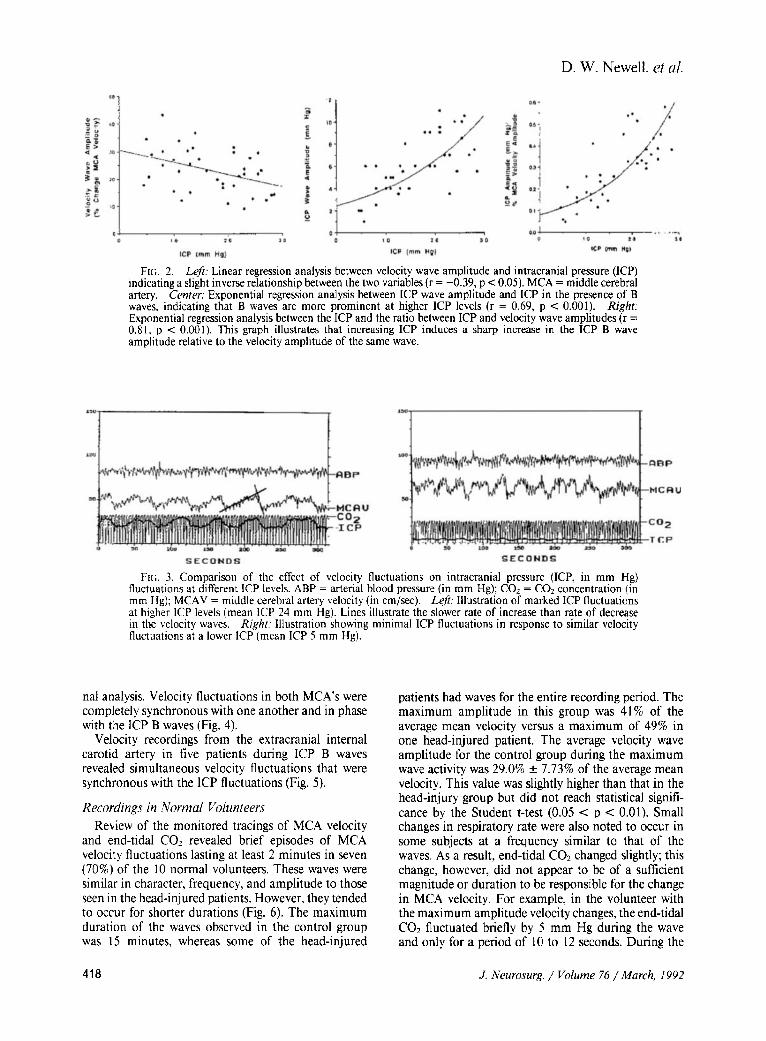
One frequently seen characteristic of the velocity waves was that the rate of increase in velocity was less than the rate of decrease (Fig. 3). This characteristic was sometimes but not always reflected in the ICP waves.
A recording was recently obtained that permitted simultaneous velocity recording from both MCA's, This recording was made using a two-channel TCD system from a head-injured patient not included in the origi-
J. Neurosurg. / Volume 76/March, 1992 417
D. W. Newell, et al.
FIG. 2. Left: Linear regression analysis between velocity wave amplitude and intracranial pressure (ICP) indicating a slight inverse relationship between the two variables (r = -0.39, p < 0.05). MCA = middle cerebral artery. Center: Exponential regression analysis between ICP wave amplitude and ICP in the presence of B waves, indicating that B waves are more prominent at higher ICP levels (r = 0.69, p < 0.001). Right: Exponential regression analysis between the ICP and the ratio between ICP and velocity wave amplitudes (r = 0.81, p < 0.001). This graph illustrates that increasing ICP induces a sharp increase in the ICP B wave amplitude relative to the velocity amplitude of the same wave.
FIG. 3. Comparison of the effect of velocity fluctuations on intracranial pressure (ICP, in mm Hg) fluctuations at different ICP levels. ABP = arterial blood pressure (in mm Hg); COz = CO2 concentration (in mm Hg); MCAV = middle cerebral artery velocity (in cm/sec). Left: Illustration of marked ICP fluctuations at higher ICP levels (mean ICP 24 mm Hg). Lines illustrate the slower rate of increase than rate of decrease in the velocity waves. Right: Illustration showing minimal ICP fluctuations in response to similar velocity fluctuations at a lower ICP (mean ICP 5 mm Hg).
hal analysis. Velocity fluctuations in both MCA's were completely synchronous with one another and in phase with the ICP B waves (Fig. 4).
Velocity recordings from the extracranial internal carotid artery in five patients during ICP B waves revealed simultaneous velocity fluctuations that were synchronous with the ICP fluctuations (Fig. 5).
Recordings in Normal Volunteers Review of the monitored tracings of MCA velocity
and end-tidal CO2 revealed brief episodes of MCA velocity fluctuations lasting at least 2 minutes in seven (70%) of the 10 normal volunteers. These waves were similar in character, frequency, and amplitude to those seen in the head-inj ured patients. However, they tended to occur for shorter durations (Fig. 6). The maximum duration of the waves observed in the control group was 15 minutes, whereas some of the head-injured
patients had waves for the entire recording period. The maximum amplitude in this group was 41% of the average mean velocity versus a maximum of 49% in one head-injured patient. The average velocity wave amplitude for the control group during the maximum wave activity was 29.0% _ 7.73% of the average mean velocity. This value was slightly higher than that in the head-injury group but did not reach statistical signifi- cance by the Student t-test (0.05 < p < 0.01). Small changes in respiratory rate were also noted to occur in some subjects at a frequency similar to that of the waves. As a result, end-tidal CO2 changed slightly; this change, however, did not appear to be of a sufficient magnitude or duration to be responsible for the change in MCA velocity. For example, in the volunteer with the maximum amplitude velocity changes, the end-tidal CO2 fluctuated briefly by 5 mm Hg during the wave and only for a period of 10 to 12 seconds. During the
418 J. Neurosurg. / Volume 76/March, 1992

Blood flow velocity fluctuations in ICP B waves
FIG. 4. Illustration of simultaneous velocity recording from both middle cerebral arteries in the presence of B waves using a two-channel Doppler ultrasound device. The velocity fluctuations are synchronous with each other and in phase with the intracranial pressure (ICP) B waves. ABP = arterial blood pressure; RMCV = fight middle cerebral artery velocity; LMCV = left middle cerebral artery velocity.
FIG. 5. Illustration of simultaneous recording from the neck of arterial blood pressure (ABP, in mm Hg), intracranial pressure (ICP, in mm Hg), and extracranial internal carotid artery velocity (ICAV, in cm/sec) in the presence of B waves, strongly indicating that velocity fluctuations occur due to volume flow fluctuations.
same wave, which lasted 40 seconds, the MCA velocity changed by 41%; this represents an 8% change in MCA velocity per mm of CO2 change.
Discussion
Theoretical Aspects of TCD Monitoring Monitoring of the blood flow velocity of the MCA,
both intraoperatively and in the intensive care unit, has been reported previously. 8,~2 For continuous recording, the TCD velocity signal can be taken from the outline of the velocity spectrum, which is normally calculated by the TCD instrument. This tracing corresponds to the Vm,x of blood flow at the center of the MCA. I During laminar flow, which is the normal condition in the basal arteries, the flow velocity at the center of the MCA will be directly proportional to the average cross- sectional velocity. Since blood flow is a product of the average velocity and the cross-sectional area of the vessel, changes in velocity directly reflect changes in blood flow through this conducting artery, provided that the diameter does not change significantly 3 and
FIG. 6. Upper. Continuous recording of middle cerebral artery '~elocity (MCAV, in cm/sec) and CO2 (in mm Hg) in a normal subject demonstrating a brief episode of velocity fluctuations (arrow) similar in frequency and character to those seen in the presence of B waves in the intracranial pressure of head-injured patients, Lower: Enlarged detail of this interval illustrating small fluctuations in end-tidal COz during the waves; however, these fluctuations appeared to be insufficient to be causative.
that the probe angle does not change. By employing a monitoring probe fixed with a headband, variations in probe angle are eliminated. Previous experiments have demonstrated a linear correlation between Vmax and volume flow variations in the internal carotid ar- tery, measured by an electromagnetic flowmeter during carotid endarterectomy? ~ This finding indicates that the MCA diameter did not change significantly and, therefore, changes in Vmax directly reflected relative changes in blood flow. Additional studies confirm a strong correlation between Vmax and relative blood flow changes during blood pressure fluctuations 3 and changes in CO2 concentration?
Theoretically, fluctuations in MCA velocity such as those seen in this study could either be due to phasic MCA diameter changes or to phasic blood flow varia- tions. Two findings in this study support the concept that the V~a~ fluctuations are due primarily to blood flow variations and not to phasic vessel diameter changes; they are: 1) that velocity fluctuations similar to those in the MCA were found in the extracranial internal carotid artery and occurred simultaneously with ICP fluctuations; and 2) that the ICP fluctuations were in phase with the velocity fluctuations. If increases
J Neurosurg./Volume 76/March. 1992 419

D. W. Newell, et al.
in velocity were due to rhythmic contractions of the MCA, then a decrease would be expected in the ICP, due to vasoconstriction at the peak velocity rather than the observed increases in ICP.
Current Findings
The finding of periodic fluctuations in the MCA velocity can be explained most easily by fluctuations in the CBF; these are caused by a phasic dilation and contraction of the small regulating arteries (vasomotor waves). These vasomotor waves produce fluctuations in cerebral blood volume, which are eventually reflected in the ICP. This interpretation is supported by experi- ments reported by Auer and Sayama 4 who, with the use of a pial window preparation in cats, observed pial vessels oscillating in synchrony with ICP variations using a pial window preparation in cats. They clearly demonstrated that increases in ICP occurred when the pial arteries dilated. These fluctuations were noted at a frequency between 0.5 and 2 cycles per minute and thus correspond to the present findings and previous descriptions of B waves in the ICP. j3
In his original description of B waves in ICP tracings, Lundberg ~3 frequently observed respiratory variations synchronous with the wave frequency. He therefore suggested that the B waves could be caused by fluctua- tions in the CO2 concentration, causing variations in CBF. However, B waves were observed in some artifi- cially ventilated patients. Lundberg noted that "These observations permit no definite conclusion as to the cause of the B waves. ''~3 The concentration of CO2 was not monitored during the recordings. Other investiga- tors have recorded respiratory rate simultaneously with ICP in nonventilated neurosurgical patients and found a relationship between respiratory variations and B waves?
Our data demonstrate conclusively that velocity waves and B waves of the ICP can occur in ventilated patients with a constant CO2 concentration. Fourier analysis in selected cases shows that the MCA velocity oscillations are clearly in synchrony with the ICP oscil- lations and are not necessarily accompanied by oscil- lations in arterial blood pressure or CO> Some cases, however, demonstrated minor fluctuations in arterial blood pressure that occurred regularly at the wave fre- quency and may be a secondary effect or an accompa- nying phenomenon. During the peak of the velocity waves in the normal subjects, there was often minor slowing of the respiratory rate, slightly effecting the end-tidal CO2. However, the change in CO2 concentra- tion was not sufficient to cause the change seen in the velocity. ~5 Therefore, it is unlikely that changes in CO2 concentration are a primary cause of the velocity changes; it appears more likely that respiratory changes may be an accompanying phenomenon.
Etiology of Blood Flow Fluctuations and B Waves
The exact cause of the fluctuations in CBF resulting in B waves is unknown. Some investigators have sug-
gested that a mechanism intrinsic to the arterial smooth-muscle cells in the regulating arteries is respon- sible. 4 Others have implicated an intrinsic brain-stem pacemaker that alters other physiological parameters as well as CBF at a regular frequency. 1~ The find- ing of synchronous fluctuations of blood flow in both MCA's suggests the presence of a central control mech- anism or a synchronizing mechanism. It was commonly observed (Figs. 3 and 4) that the velocity wave would begin before the change in ICP took place and thus was independent of any change in transmural or cere- bral perfusion pressure.
The inverse relationship found between ICP and velocity wave amplitude was initially unexpected, but may be explained by the very large amplitudes of the ICP waves at higher ICP's. The cerebral perfusion pres- sure is much lower at the peak of the ICP wave than in the valley. If autoregulation is poor (or slow), the flow (and velocity) amplitude will then necessarily be atten- uated at the peak, compared to a situation where per- fusion pressure does not fluctuate. Many of our patients had poor autoregulation (unpublished data).
The finding of a variable response in the ICP for a given degree of fluctuation in CBF velocity can be most easily explained by variations in intracranial compli- ance at different ICP levels. Although intracranial com- pliance was not measured in these patients, it is gener- ally lower in patients with elevated ICP. ~6 Thus, a given amount of cerebral blood volume fluctuation would produce a higher amplitude of the ICP wave with reduced intracranial compliance. Our results illustrated by Fig. 2 lower support this interpretation. Dirnagl, et al., 7 demonstrated a clear inverse relationship between intracranial compliance measured by the pressure vol- ume index and the ICP amplitude of B waves in neu- rosurgical patients. There was, however, no correlation between intracranial compliance and the duration of B wave activity. Other studies have also confirmed that B waves in the ICP are prominent in conditions associated with reduced intracranial compliance. 6'~9
The present data, supported by previous observa- tions, 4 suggest that phasic variations in CBF can occur at a frequency of 0.5 to 2 cycles per minute under normal conditions as well as in pathological states. The relationship between various pathological states and the magnitude and duration of these blood flow fluctua- tions is unclear. If ICP is monitored during these fluc- tuations, the magnitude of ICP variations will be influ- enced by the degree of CBF fluctuation and by the intracranial compliance during monitoring. It is likely that B waves of the ICP have been recognized as an amplification of a physiological phenomenon under conditions of reduced intracranial compliance.
Implications for TCD Examination
One implication of the current findings concerns the effect of MCA fluctuations an values recorded during TCD diagnostic examination. The finding of significant fluctuations of velocity in normal subjects indicates
420 J. Neurosurg. / Volume 76 /March, 1992

Blood flow velocity fluctuations in ICP B waves
that this phenomenon could be a source of variability in the velocity values and should be kept in mind when performing examinations. To record the most accurate mean velocity during appearance of these waves, the timed average mean velocity value between the ex- tremes of the fluctuations should be noted.
Acknowledgments
The authors thank Eden Medical Electronics Corporation and Medasonics Corporation for cooperation in providing some of the equipment used in these studies.
References
1. Aaslid R, Lindegaard KF, Sorteberg W, et al'. Cerebral autoregulation dynamics in humans. Stroke 20:45-52, t989
2. Aaslid R, Markwalder TM, Nornes H: Noninvasive trans- cranial Doppler ultrasound recording of flow velocity in basal cerebral arteries, d Neurosurg 57:769-774, 1982
3. Aaslid R, Newell DW, Stooss R, et al: Assessment of cerebral autoregulation dynamics from simultaneous ar- terial and venous transcranial Doppler recordings in hu- mans. Stroke 22:148-154, 1991
4. Auer LM, Sayama I: Intmcranial pressure oscillations (B- waves) caused by oscillations in cerebrovascular volume. Acta Neurochir 68:93-100, 1983
5. Bishop CCR, Powell S, Rutt D, et al: Transcranial Dop- pler measurement of middle cerebral artery blood flow velocity: a validation study. Stroke 17:913-915, 1986
6. Borgesen SE, Gjerris F, Sorensen SC: Cerebrospinal fluid conductance and compliance of the craniospinal space in normal-pressure hydrocephalus. A comparison between two methods for measuring conductance to outflow. J Neurosurg 51:521-525, 1979
7. Dirnagl U, Garner C, Haberl R, et al: Correlation between B-waves and intracranial pressure - - volume relation- ships, in Hoff JT, Betz AL (eds): lntracranial Pressure VII. Berlin: Springer-Verlag, 1989, pp 213-216
8. Giller CA: The frequency-dependent behavior of cerebral autoregulation. Neurosurgery 27:362-368, 1990
9. Hashimoto M, Higashi S, Kogure Y, et al: Respiratory and cardiovascular oscillations during B-waves, in Hoff JT, Betz AL (eds): lntracranial Pressure VII. Berlin: Springer-Verlag, 1989, pp 217-219
10. Higashi S, Yamamoto S, Hashimoto M, et at: The role of vasomotor center and adrenergic pathway in B-waves, in
Hoff JT, Betz AL (eds): Intracranial Pressure VII. Berlin: Springer-Verlag, 1989, pp 220-224
11. Lindegaard KF, Lundar T, Wiberg J, et al: Variations in middle cerebral artery blood flow investigated with non- invasive transeranial blood velocity measurements. Stroke 18:1025-1030, 1987
12. LundarT, LindegaardKF, Nornes H: Continuous record- ing of middle cerebral artery blood velocity in clinical neurosurgery. Acta Neurochir 102:85-90, 1990
13. Lundberg N: Continuous recording and control of ven- tricular fluid pressure in neurosurgical practice. Aeta Psy- ehiatr Seand (Suppl) 149:1-193, 1960
14. Maeda M, Takahashi K, Miyazaki M, et al: The role of the central monoamine system and the cholinoceptive pontine area on the oscillation of ICP "pressure waves," in Miller JD, Teasdale GM, Rowan JO, et al (eds): Intra- cranial Pressure VI. Berlin: Springer-Verlag, 1986, pp 151-155
15. Markwalder TM, Grolimund P, Seller RW, et al: De- pendency of blood flow velocity in the middle cerebral artery on end-tidal carbon dioxide partial pressure - - a transcranial ultrasound Doppler study. J Cereb Blood Flow Metab 4:368-372, 1984
16. Maset AL, Marmarou A, Ward JD, et al: Pressure-volume index in head injury. J Neurosurg 67:832-840, 1987
17. Mautner-Huppert D, Haberl RL, Dirnagl U, et al: B- waves in healthy persons. Neurol Res 11:194-196, 1989
18. Nakatani S, Ozaki K, Hara K, et al: Simultaneous mon- itoring of ICP and transcranial Doppler sonogram on the middle cerebral artery, in Hoff JT, Betz AL (eds): Intra- cranial Pressure VII. Berlin: Springer-Verlag, 1989, pp 113-115
19. Symon L, Dorsch NWC, Stephens R J: Pressure waves in so-called low-pressure hydrocephalus. Lancet 2:129l- 1292, 1972
Manuscript received March 21, 1991. Accepted in final form July 25, 1991. This work was supported in part by National Institute of
Neurological Disorders and Stroke Grant NS 07144. Dr. Newell is a recipient of the William P. Van Wagenen
fellowship awarded in 1989 by the American Association of Neurological Surgeons, and also the Allied Signal Corpora- tion/National Stroke Association Research fellowship from 1990 to 1993.
Address reprint requests to. David W. Newell, M.D., Department of Neurological Surgery, Harborview Medical Center, 325 9th Avenue, Seattle, Washington 98104.
J. Neurosurg. / Volume 76/March, 1992 491