The relationship between variability of intertap intervals and interval duration
5
Psychol Res (1989) 51:38-42 Psychological Research © Springer-Verlag 1989 The relationship between variability of intertap intervals and interval duration Michael Peters Department of Psychology, University of Guelph, Guelph, Ontario, N1G 2WI, Canada Summary. Subjects tracked intervals in a synchronization paradigm at interval durations of 180, 210, 240, 270, 300, 400, 500, 600, 700, 800, 900, and 1,000 ms. The variability of intertap intervals (ITIs) shows a sudden increase near 300 ms. This increase is interpreted as indicating the tran- sition from automatic to controlled movement. It is sug- gested that the sudden change in the variability of ITIs does not reflect the operation of different timing mecha- nisms at short and long intervals, but differences in the way in which attentional processes come to bear on move- ment initiation for different interval durations. In contrast to previous findings reported in the literature, a U-shaped function between interval duration and variability in the 300-to-l,000-ms range was not observed. One of the simpler questions to be asked about the timing of behavior is how humans manage to issue regularly spaced responses in synchrony with a pacing source. Hary and Moore (1985, 1987) have found that synchronization depends on the use of internal and external resetting events with more than one independent source of timing error. The present work addresses an additional source of complication in the synchronization paradigm: the role of the duration of an event in conscious perception. When subjects tap quickly and repetitively on a surface, the tap- ping movements are not individually experienced. When the rate is slowed sufficiently, however, there comes a point when movements are initiated and experienced indi- vidually. On the basis of a pilot study in which subjects were asked to identify that point, a rate corresponding to interresponse intervals near 300 ms emerged. Kristofferson (1976) reported that, with a different par- adigm, subjects experienced a discontinuity between short- er and longer intervals that emerged near 300 ms as well; subjects felt that at longer intervals preparatory move- ments preceded the actual response, while at intervals be- low 300 ms the response was immediate, without such preparations. In a different study, Wing and Kristofferson (1973a) report the variance of ITIs as constant up to 250-ms intervals, with a notable increase for longer inter- vals. Is it possible that in synchronization paradigms dif- ferent mechanisms operate at different intervals, with a change from one to the other near 300 ms? Such a possibil- ity would invite further investigation as to whether the mechanisms identified for the timing of repetitive re- sponses (Hary & Moore, 1985, 1987; Wing, 1982) might operate differently for different interval durations. This study asks the question: can a discontinuity be identified in a region of ITI durations where discontinuities are ex- perienced subjectively? Method Subjects. Two male and two female right-handed subjects were used. All had experience in tapping tasks, having participated previously in similar experiments that re- quired the repetitive production of equal intervals. Apparatus. Subjects tapped the lever of a microswitch con- nected to a microprocessor. The microprocessor also al- lowed the issue of a pacing beat. The pacing beat was a 600-Hz tone of 80-ms duratinn presented at 68 db, with a rise time of < 3 ms. All switch closures and releases were recorded and the pulses of the pacing tone were recorded as well so that the time difference between the response and the onset of the pulses could be documented. Procedure. Throughout, a synchronization paradigm was used, with the pacing beat present throughout the trial and subjects explicitly instructed to maintain synchronization as well as they could. No other instructions were given. In order to keep the number of trials constant, but avoiding too few values being collected at longer interval dura- tions, the trial durations were lengthened with increasing intervals. The following list of intervals tested gives, in brackets, the average number of taps collected for each of the 80 trials at each interval duration: 180 (50), 210 (41), 240 (35), 270 (32), 300 (29), 400 (22), 500 (36), 600 (29), 700 (24), 800 (21), 900 (29), and 1,000 (26). Subjects A and M performed a minimum of 80 trials for each of the intervals listed above. Subject K did not perform at the fastest inter- val (180 ms) because performance at this rate was too er- ratic; and subject S only performed at the intervals from 180 to 400 ms. 1 Each subject performed 20 trials a day, with one interval duration for all 20 trials. Before each daily session subjects performed 3-5 practice trials, exam- I Subjects A and M completed another 100 trials each for the 400-ms interval in order to see if the somewhat smaller number of intervals collected for this series had a marked effect on the SD of the ITI. This turned out not to be the case. For example, for A the SD at 400 ms for the first 80 trials was 11.2 ms, and 10.7 ms for the next 100 trials.
-
Upload
michael-peters -
Category
Documents
-
view
213 -
download
1
Transcript of The relationship between variability of intertap intervals and interval duration
Psychol Res (1989) 51:38-42 Psychological Research © Springer-Verlag 1989
The relationship between variability of intertap intervals and interval duration
Michael Peters
Department of Psychology, University of Guelph, Guelph, Ontario, N1G 2WI, Canada
Summary. Subjects tracked intervals in a synchronization paradigm at interval durations of 180, 210, 240, 270, 300, 400, 500, 600, 700, 800, 900, and 1,000 ms. The variability of intertap intervals (ITIs) shows a sudden increase near 300 ms. This increase is interpreted as indicating the tran- sition from automatic to controlled movement. It is sug- gested that the sudden change in the variability of ITIs does not reflect the operation of different timing mecha- nisms at short and long intervals, but differences in the way in which attentional processes come to bear on move- ment initiation for different interval durations. In contrast to previous findings reported in the literature, a U-shaped function between interval duration and variability in the 300-to-l,000-ms range was not observed.
One of the simpler questions to be asked about the timing of behavior is how humans manage to issue regularly spaced responses in synchrony with a pacing source. Hary and Moore (1985, 1987) have found that synchronization depends on the use of internal and external resetting events with more than one independent source of timing error. The present work addresses an additional source of complication in the synchronization paradigm: the role of the duration of an event in conscious perception. When subjects tap quickly and repetitively on a surface, the tap- ping movements are not individually experienced. When the rate is slowed sufficiently, however, there comes a point when movements are initiated and experienced indi- vidually. On the basis of a pilot study in which subjects were asked to identify that point, a rate corresponding to interresponse intervals near 300 ms emerged.
Kristofferson (1976) reported that, with a different par- adigm, subjects experienced a discontinuity between short- er and longer intervals that emerged near 300 ms as well; subjects felt that at longer intervals preparatory move- ments preceded the actual response, while at intervals be- low 300 ms the response was immediate, without such preparations. In a different study, Wing and Kristofferson (1973a) report the variance of ITIs as constant up to 250-ms intervals, with a notable increase for longer inter- vals. Is it possible that in synchronization paradigms dif- ferent mechanisms operate at different intervals, with a change from one to the other near 300 ms? Such a possibil- ity would invite further investigation as to whether the mechanisms identified for the timing of repetitive re- sponses (Hary & Moore, 1985, 1987; Wing, 1982) might
operate differently for different interval durations. This study asks the question: can a discontinuity be identified in a region of ITI durations where discontinuities are ex- perienced subjectively?
Method
Subjects. Two male and two female right-handed subjects were used. All had experience in tapping tasks, having participated previously in similar experiments that re- quired the repetitive production of equal intervals.
Apparatus. Subjects tapped the lever of a microswitch con- nected to a microprocessor. The microprocessor also al- lowed the issue of a pacing beat. The pacing beat was a 600-Hz tone of 80-ms duratinn presented at 68 db, with a rise time of < 3 ms. All switch closures and releases were recorded and the pulses of the pacing tone were recorded as well so that the time difference between the response and the onset of the pulses could be documented.
Procedure. Throughout, a synchronization paradigm was used, with the pacing beat present throughout the trial and subjects explicitly instructed to maintain synchronization as well as they could. No other instructions were given. In order to keep the number of trials constant, but avoiding too few values being collected at longer interval dura- tions, the trial durations were lengthened with increasing intervals. The following list of intervals tested gives, in brackets, the average number of taps collected for each of the 80 trials at each interval duration: 180 (50), 210 (41), 240 (35), 270 (32), 300 (29), 400 (22), 500 (36), 600 (29), 700 (24), 800 (21), 900 (29), and 1,000 (26). Subjects A and M performed a minimum of 80 trials for each of the intervals listed above. Subject K did not perform at the fastest inter- val (180 ms) because performance at this rate was too er- ratic; and subject S only performed at the intervals from 180 to 400 ms. 1 Each subject performed 20 trials a day, with one interval duration for all 20 trials. Before each daily session subjects performed 3-5 practice trials, exam-
I Subjects A and M completed another 100 trials each for the 400-ms interval in order to see if the somewhat smaller number of intervals collected for this series had a marked effect on the SD of the ITI. This turned out not to be the case. For example, for A the SD at 400 ms for the first 80 trials was 11.2 ms, and 10.7 ms for the next 100 trials.
39
ining the quality of performance at the end of each trial (summary data were displayed on computer screen). A tri- al began with the pacing signal and the subject could join in at any point; the first tap initiated the timing of the trial. The trials were performed in four series. For the first, sub- jects performed 20 trials daily, beginning with 20 trials at an ITI of 180 ms on the first day, and ascending day by day to the next ITI until the entire series was completed. After a day of rest the second series started, this time de- scending from the long to the short intervals, followed by another ascending and another descending series until 80 trials were completed at each ITI.
All subjects were instructed to tap as synchronously with the pacing signal as possible. The microswitches used produced an audible click when depressed and released.
Results
The variability of interresponse intervals
The SD of interresponse intervals for a trial was calculated by measuring the mean interresponse interval and by then expressing the variability of intervals around that mean in terms of the standard deviation. This measure was then averaged across all trials. The SDs obtained in this way and those obtained by calculating the SDs of all intervals around the grand-total mean based on all measured inter- vals over all trials were similar within less than 1 ms. As might be expected for such a large number of trials, the mean intervals differed by less than 1 ms from the interval created by the pacing pulse, except for the very rapid rates.
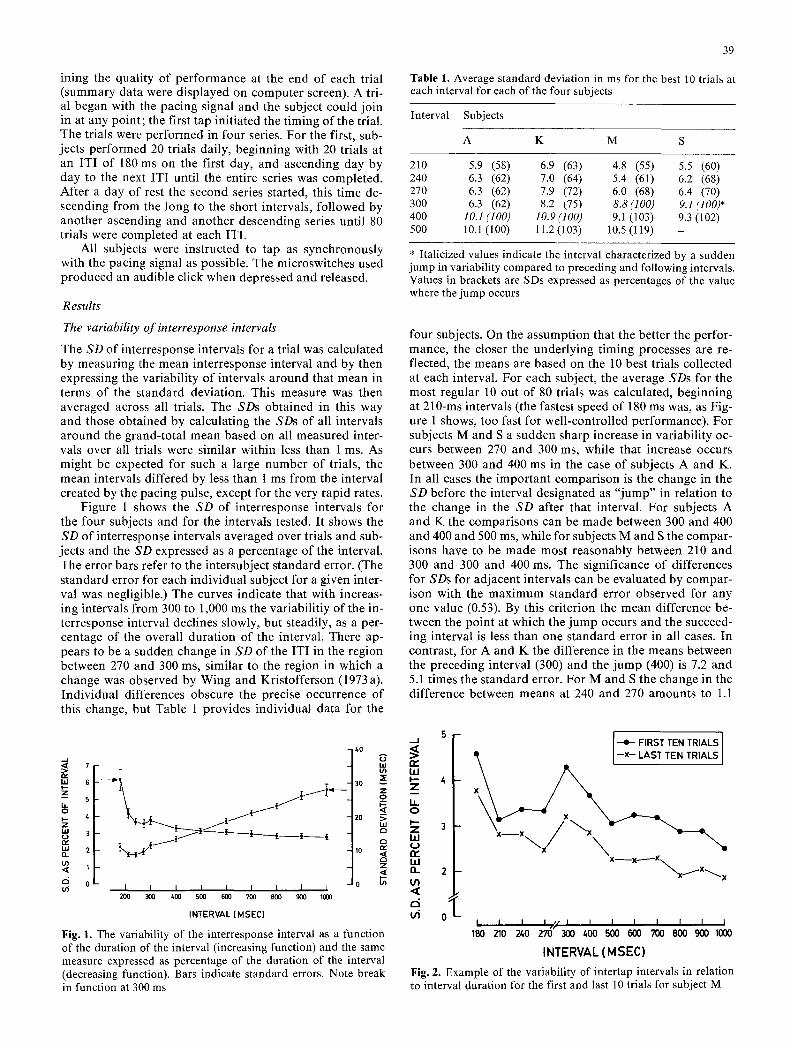
Figure 1 shows the SD of interresponse intervals for the four subjects and for the intervals tested. It shows the SD of interresponse intervals averaged over trials and sub- jects and the SD expressed as a percentage of the interval. The error bars refer to the intersubject standard error. (The standard error for each individual subject for a given inter- val was negligible.) The curves indicate that with increas- ing intervals from 300 to 1,000 ms the variabilitiy of the in- terresponse interval declines slowly, but steadily, as a per- centage of the overall duration of the interval. There ap- pears to be a sudden change in SD of the ITI in the region between 270 and 300 ms, similar to the region in which a change was observed by Wing and Kristofferson (1973 a). Individual differences obscure the precise occurrence of this change, but Table 1 provides individual data for the
Table 1. Average standard deviation in ms for the best 10 trials at each interval for each of the four subjects
Interval Subjects
A K M S
210 5.9 (58) 6.9 (63) 4.8 (55) 5.5 (60) 240 6.3 (62) 7.0 (64) 5.4 (61) 6.2 (68) 270 6.3 (62) 7.9 (72) 6.0 (68) 6.4 (70) 300 6.3 (62) 8.2 (75) 8.8(100) 9.1 (100)* 400 10.1 (100) 10.9 (100) 9.1 (103) 9.3 (102) 500 10.1 (100) 11.2(103) 10.5(119) -
* Italicized values indicate the interval characterized by a sudden jump in variability compared to preceding and following intervals. Values in brackets are SDs expressed as percentages of the value where the jump occurs
four subjects. On the assumption that the better the perfor- mance, the closer the underlying timing processes are re- flected, the means are based on the 10 best trials collected at each interval. For each subject, the average SDs for the most regular 10 out of 80 trials was calculated, beginning at 210-ms intervals (the fastest speed of 180 ms was, as Fig- ure 1 shows, too fast for well-controlled performance). For subjects M and S a sudden sharp increase in variability oc- curs between 270 and 300 ms, while that increase occurs between 300 and 400 ms in the case of subjects A and K. In all cases the important comparison is the change in the SD before the interval designated as "jump" in relation to the change in the SD after that interval. For subjects A and K the comparisons can be made between 300 and 400 and 400 and 500 ms, while for subjects M and S the compar- isons have to be made most reasonably between 210 and 300 and 300 and 400 ms. The significance of differences for SDs for adjacent intervals can be evaluated by compar- ison with the maximum standard error observed for any one value (0.53). By this criterion the mean difference be- tween the point at which the jump occurs and the succeed- ing interval is less than one standard error in all cases. In contrast, for A and K the difference in the means between the preceding interval (300) and the jump (400) is 7.2 and 5.1 times the standard error. For M and S the change in the difference between means at 240 and 270 amounts to 1.1
7
W 6
- - 5 I.L 0 ~ 4
W 3
t n
,'-i 0 t~ I I I I I I I I 1
200 300 400 500 600 700 800 900 1000
INTERVAL (MSEC)
.--I
w re" u~ W
30 z Z 2 LL
zo I.u I.-. ,", Z ,.., ILl
10 ~ z ILl
o ~ Ln
F i g . 1. The variability of the interresponse interval as a function of the duration of the interval (increasing function) and the same measure expressed as percentage of the duration of the interval (decreasing function). Bars indicate standard errors. Note break in function at 300 ms
5 - I ' ~ FIRST TEN TRIALS I
• I - X - LAST TEN TRIALS I
X ~ x ~ X ~
\ x ~ X ~ x
I I I I . t / I I I I I I I I 180 210 240 270 300 400 500 600 700 800 900 1000
INTERVAL (MSEC)
Fig. 2. Example of the variability of intertap intervals in relation to interval duration for the first and last 10 trials for subject M
40
lO
2 - - 20 3,
1
o I I I I I I I I I - lO 3oo 4oo soo 6oo 7o0 8oo 9oo m o
I N T E R V A L { M S E C I
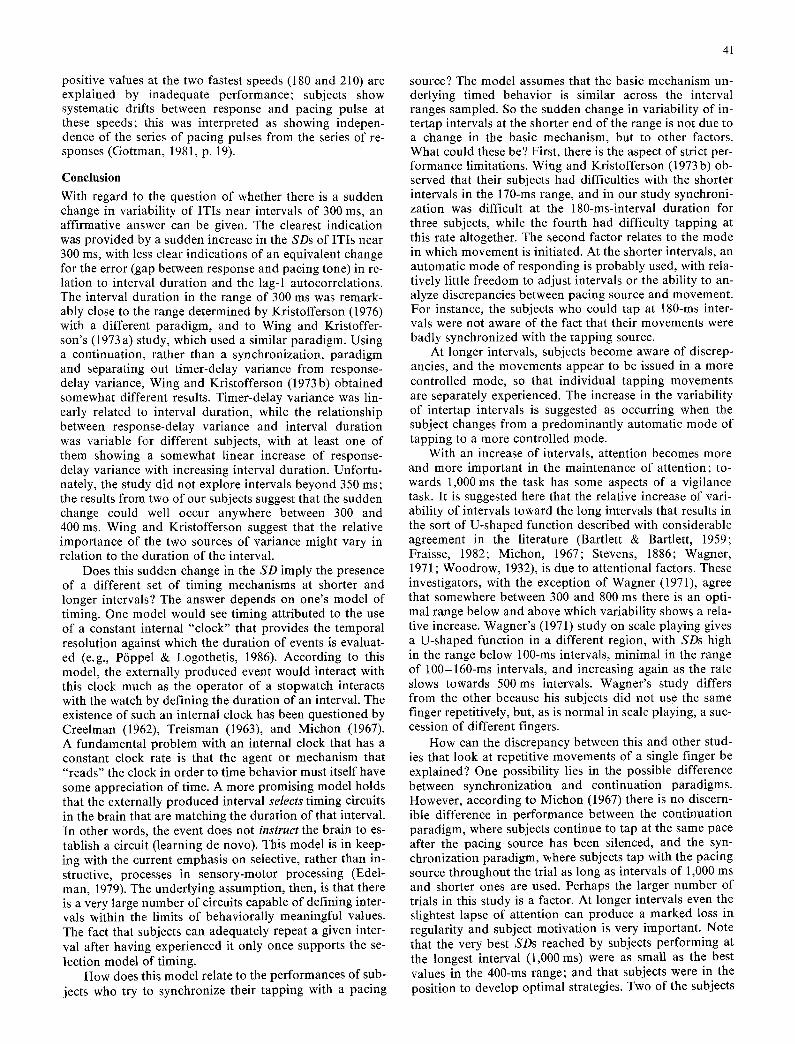
Fig. 3. The variability of the absolute error in ms between the oc- currence of the response and the presentation of the pacing signal, as a function of interval duration (increasing function). The same measure expressed as % of interval duration is seen in the decreas- ing function. Large standard errors indicate considerable inter- subject variability. Note break in function at 300 ms
so h ,
~E
&O Z o
a c l i x
z
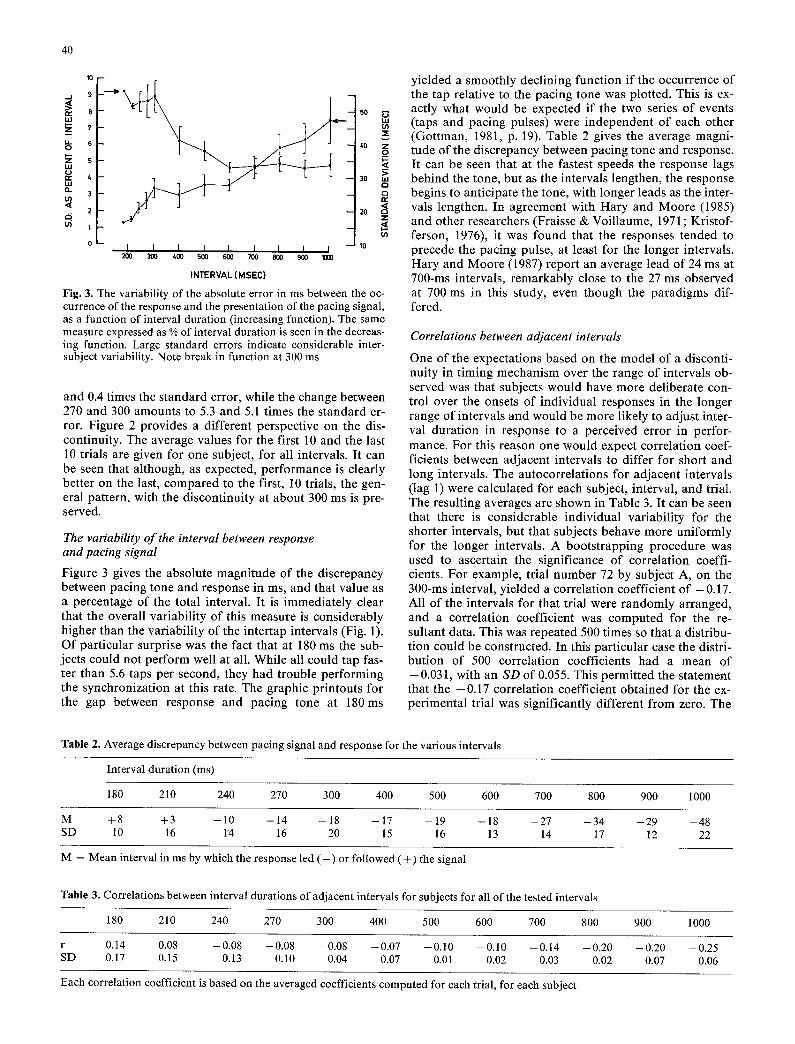
and 0.4 times the s tandard error, while the change between 270 and 300 amounts to 5.3 and 5.1 times the s tandard er- ror. Figure 2 provides a different perspect ive on the dis- continuity. The average values for the first 10 and the last 10 trials are given for one subject, for all intervals. It can be seen that although, as expected, per formance is clearly better on the last, compared to the first, 10 trials, the gen- eral pattern, with the discont inui ty at about 300 ms is pre- served.
The variability of the interval between response and pacing signal
Figure 3 gives the absolute magni tude of the discrepancy between pacing tone and response in ms, and that value as a percentage of the total interval. It is immedia te ly clear that the overall var iabi l i ty of this measure is considerably higher than the var iabi l i ty of the inter tap intervals (Fig. 1). Of par t icular surprise was the fact that at 180 ms the sub- jects could not perform well at all. While all could tap fas- ter than 5.6 taps per second, they had t rouble per forming the synchronizat ion at this rate. The graphic pr intouts for the gap between response and pacing tone at 180ms
yie lded a smoothly decl ining function if the occurrence of the tap relative to the pacing tone was plotted. This is ex- actly what would be expected if the two series of events (taps and pacing pulses) were independent of each other (Got tman, 1981, p. 19). Table 2 gives the average magni- tude of the discrepancy between pacing tone and response. It can be seen that at the fastest speeds the response lags behind the tone, but as the intervals lengthen, the response begins to ant icipate the tone, with longer leads as the inter- vals lengthen. In agreement with Hary and Moore (1985) and other researchers (Fraisse & Voil laume, 1971; Kristof- ferson, 1976), it was found that the responses tended to precede the pacing pulse, at least for the longer intervals. Hary and Moore (1987) repor t an average lead of 24 ms at 700-ms intervals, remarkably close to the 27 ms observed at 700 ms in this study, even though the parad igms dif- fered.
Correlations between adjacent intervals
One of the expectat ions based on the model of a disconti- nuity in t iming mechanism over the range of intervals ob- served was that subjects would have more del iberate con- trol over the onsets of indiv idual responses in the longer range of intervals and would be more l ikely to adjust inter- val dura t ion in response to a perceived error in perfor- mance. For this reason one would expect correla t ion coef- ficients between adjacent intervals to differ for short and long intervals. The autocorre la t ions for ad jacent intervals (lag 1) were calculated for each subject, interval, and trial. The resulting averages are shown in Table 3. It can be seen that there is considerable individual var iabi l i ty for the shorter intervals, but that subjects behave more uni formly for the longer intervals. A boots t rapping procedure was used to ascertain the significance of correlat ion coeffi- cients. For example, trial number 72 by subject A, on the 300-ms interval, y ie lded a correla t ion coefficient of - 0 . 1 7 . All o f the intervals for that trial were r andomly arranged, and a correla t ion coefficient was computed for the re- sultant data. This was repeated 500 t imes so that a distribu- t ion could be constructed. In this par t icular case the distri- but ion of 500 correla t ion coefficients had a mean of -0.031, with an SD of 0.055. This permit ted the statement that the - 0 . 1 7 correlat ion coefficient obta ined for the ex- per imenta l trial was significantly different from zero. The
Table 2. Average discrepancy between pacing signal and response for the various intervals
Interval duration (ms)
180 210 240 270 300 400 500 600 700 800 900 1000
M +8 +3 - 1 0 - 1 4 - 1 8 - 1 7 - 1 9 - 1 8 - 2 7 - 3 4 - 2 9 - 4 8 SD 10 16 1"4 16 20 15 16 13 14 17 12 22
M = Mean interval in ms by which the response led ( - ) or followed (+ ) the signal
Table 3. Correlations between interval durations of adjacent intervals for subjects for all of the tested intervals
180 210 240 270 300 400 500 600 700 800 900 1000
r 0.14 0.08 -0.08 -0.08 -0.08 -0.07 -0.10 -0.10 -0.14 -0.20 -0.20 -0.25 SD 0.17 0.15 0.13 0.10 0.04 0.07 0.01 0.02 0.03 0.02 0.07 0.06
Each correlation coefficient is based on the averaged coefficients computed for each trial, for each subject
41
positive values at the two fastest speeds (180 and 210) are explained by inadequate performance; subjects show systematic drifts between response and pacing pulse at these speeds; this was interpreted as showing indepen- dence of the series of pacing pulses from the series of re- sponses (Gottman, 1981, p. 19).
Conclusion
With regard to the question of whether there is a sudden change in variability of ITIs near intervals of 300 ms, an affirmative answer can be given. The clearest indication was provided by a sudden increase in the SDs of ITIs near 300 ms, with less clear indications of an equivalent change for the error (gap between response and pacing tone) in re- lation to interval duration and the lag-1 autocorrelations. The interval duration in the range of 300 ms was remark- ably close to the range determined by Kristofferson (1976) with a different paradigm, and to Wing and Kristoffer- son's (1973 a) study, which used a similar paradigm. Using a continuation, rather than a synchronization, paradigm and separating out timer-delay variance from response- delay variance, Wing and Kristofferson (1973b) obtained somewhat different results. Timer-delay variance was lin- early related to interval duration, while the relationship between response-delay variance and interval duration was variable for different subjects, with at least one of them showing a somewhat linear increase of response- delay variance with increasing interval duration. Unfortu- nately, the study did not explore intervals beyond 350 ms; the results from two of our subjects suggest that the sudden change could well occur anywhere between 300 and 400 ms. Wing and Kristofferson suggest that the relative importance of the two sources of variance might vary in relation to the duration of the interval.
Does this sudden change in the SD imply the presence of a different set of timing mechanisms at shorter and longer intervals? The answer depends on one's model of timing. One model would see timing attributed to the use of a constant internal "clock" that provides the temporal resolution against which the duration of events is evaluat- ed (e.g., P6ppel & Logothetis, 1986). According to this model, the externally produced event would interact with this clock much as the operator of a stopwatch interacts with the watch by defining the duration of an interval. The existence of such an internal clock has been questioned by Creelman (1962), Treisman (1963), and Michon (1967). A fundamental problem with an internal clock that has a constant clock rate is that the agent or mechanism that "reads" the clock in order to time behavior must itself have some appreciation of time. A more promising model holds that the externally produced interval selects timing circuits in the brain that are matching the duration of that interval. In other words, the event does not instruct the brain to es- tablish a circuit (learning de novo). This model is in keep- ing with the current emphasis on selective, rather than in- structive, processes in sensory-motor processing (Edel- man, 1979). The underlying assumption, then, is that there is a very large number of circuits capable of defining inter- vals within the limits of behaviorally meaningful values. The fact that subjects can adequately repeat a given inter- val after having experienced it only once supports the se- lection model of timing.
How does this model relate to the performances of sub- jects who try 1:o synchronize their tapping with a pacing
source? The model assumes that the basic mechanism un- derlying timed behavior is similar across the interval ranges sampled. So the sudden change in variability of in- tertap intervals at the shorter end of the range is not due to a change in the basic mechanism, but to other factors. What could these be? First, there is the aspect of strict per- formance limitations. Wing and Kristofferson (1973b) ob- served that their subjects had difficulties with the shorter intervals in the 170-ms range, and in our study synchroni- zation was difficult at the 180-ms-interval duration for three subjects, while the fourth had difficulty tapping at this rate altogether. The second factor relates to the mode in which movement is initiated. At the shorter intervals, an automatic mode of responding is probably used, with rela- tively little freedom to adjust intervals or the ability to an- alyze discrepancies between pacing source and movement. For instance, the subjects who could tap at 180-ms inter- vals were not aware of the fact that their movements were badly synchronized with the tapping source.
At longer intervals, subjects become aware of discrep- ancies, and the movements appear to be issued in a more controlled mode, so that individual tapping movements are separately experienced. The increase in the variability of intertap intervals is suggested as occurring when the subject changes from a predominantly automatic mode of tapping to a more controlled mode.
With an increase of intervals, attention becomes more and more important in the maintenance of attention; to- wards 1,000 ms the task has some aspects of a vigilance task. It is suggested here that the relative increase of vari- ability of intervals toward the long intervals that results in the sort of U-shaped function described with considerable agreement in the literature (Bartlett & Bartlett, 1959; Fraisse, 1982; Michon, 1967; Stevens, 1886; Wagner, 1971 ; Woodrow, 1932), is due to attentional factors. These investigators, with the exception of Wagner (1971), agree that somewhere between 300 and 800 ms there is an opti- mal range below and above which variability shows a rela- tive increase. Wagner's (1971) study on scale playing gives a U-shaped function in a different region, with SDs high in the range below 100-ms intervals, minimal in the range of 100-160-ms intervals, and increasing again as the rate slows towards 500 ms intervals. Wagner's study differs from the other because his subjects did not use the same finger repetitively, but, as is normal in scale playing, a suc- cession of different fingers.
How can the discrepancy between this and other stud- ies that look at repetitive movements of a single finger be explained? One possibility lies in the possible difference between synchronization and continuation paradigms. However, according to Michon (1967) there is no discern- ible difference in performance between the continuation paradigm, where subjects continue to tap at the same pace after the pacing source has been silenced, and the syn- chronization paradigm, where subjects tap with the pacing source throughout the trial as long as intervals of 1,000 ms and shorter ones are used. Perhaps the larger number of trials in this study is a factor. At longer intervals even the slightest lapse of attention can produce a marked loss in regularity and subject motivation is very important. Note that the very best SDs reached by subjects performing at the longest interval (1,000 ms) were as small as the best values in the 400-ms range; and that subjects were in the position to develop optimal strategies. Two of the subjects
42
who per formed at 1,000 ms, for instance, s tayed in the "down" posi t ion for half of the dura t ion (almost exactly 500 ms), bisecting the 1,000-ms interval. The third subject stayed in the "down" posi t ion for slightly under 100 ms. It is quite likely that this subject made the sort of p repara tory movements descr ibed by Kristofferson (1976).
In summary, the present study suggests that in the pro- duct ion of intervals there is a poin t at which automat ic product ion gives way to control led product ion, and the transi t ion poin t that is subjectively exper ienced can be documented quantitatively. Because the t ransi t ion does not involve a categorical change (such as the shift f rom rod to cone vision), the sudden increase of intertap-inter- val var iabi l i ty at shorter intervals and the poin t at which relative increases in var iabi l i ty begin to show at longer in- tertap intervals are sensitive to pract ice and at tent ional ef- fects within and between individuals.
Acknowledgements. This work was supported by a National Sciences and Engineering Research Council of Canada Grant No. A7054.
Special thanks to Karin Mertins, Shari Schwartz, and Aldo Tersigni, for supporting the author with the patience required for this study.
References
Bartlett, N. R., & Bartlett, S. C. (1959). Synchronization of a mo- tor response with an anticipated sensory event. Psychological Review, 66, 203-218.
Creelman, C. D. (1962). Human discrimination of auditory dura- tion. Journal of the Acoustical Society of America, 34, 582-593.
Edelman, G. M. (1979). Group selection and phasic reentrant sig- naling: a theory of higher brain function. In G. M. Edelman & V. B. Mountcastle, The mindful brain (pp. 51-100). Cam- bridge, Mass.: MIT Press.
Fraisse, P. (1982). Rhythm and Tempo. In D. Deutsch (Ed.), The psychology of music (pp. 149-180). New York: Academic Press.
Fraisse, P., & Voillaume, C. (1971). Les r6p6res du sujet dans la synchronization et darts la pseudo-synchronization. Annie Psychologique, 71, 359-369.
Gottman, J.M. (1981). Time-series analysis. Cambridge: Cam- bridge University Press.
Hary, D., & Moore, G.P. (1985). Temporal tracking and syn- chronization strategies. Human Neurobiology, 4, 73-77.
Hary, D., & Moore, G.P. (1987). Synchronizing human move- ment with an external clock source. Biological Cybernetics, 56, 305-311.
Kristofferson, A. B. (1976). Low-variance stimulus-response laten- cies: deterministic internal delays? Perception & Psychophys- ics, 20, 89-100.
Michon, J. (1967). Timing in temporal tracking. Soesterberg, Netherlands: Institute for Perception RVO-TNO.
P6ppel, E., & Logothetis, N. (1986). Neural oscillations in the hu- man brain. Naturwissenschaften, 73, 267-268.
Stevens, L. T. (1886). On the time sense. Mind, 11, 393-404. Treisman, M. (1963). Temporal discrimination and the indiffer-
ence interval: implications for a model of the internal clock. Psychological Monographs, 77, issue 576.
Wagner, C. (1971). The influence of the tempo of playing on the rhythmic structure studied at pianist's playing scales. In J. Vredenbregt & J. Wartenweiler (Eds.), Medicine and Sport, V. 6, Biomechanics II (pp. 129-132). Baltimore: University Park Press,
Wing, A. M. (1982). Timing and coordination of repetitive biman- ual movements. Quarterly Journal of Experimental Psychology, 34A, 339-348.
Wing, A. M., & Kristofferson, A. B. (1973a). The timing of inter- response intervals. Perception & Psychophysics, 13, 455-460.
Wing, A. M., & Kristofferson, A. B. (1973b). Response delays and the timing of discrete motor responses. Perception & Psycho- physics, 14, 5-12.
Woodrow, H. (1932). The effects of rate of sequence upon the ac- curacy of synchronization. Journal of Experimental Psychol- ogy, 15, 357-379.
Received December 8, 1988/January 4, 1989


![Interval Trees Store intervals of the form [l i,r i ], l i](https://static.fdocuments.us/doc/165x107/56649c745503460f94927149/interval-trees-store-intervals-of-the-form-l-ir-i-l-i-.jpg)
![Interval Trees. Useful for representing a set of intervals –E.g.: time intervals of various events Each interval i has a low[i] and a high[i] –Assume.](https://static.fdocuments.us/doc/165x107/56649e555503460f94b4c8a0/interval-trees-useful-for-representing-a-set-of-intervals-eg-time-intervals.jpg)