1 Dr. Meral SÖNMEZOĞLU Yeditepe University Hospital Neutropenic Fever (Febril neutropenia)

The relationship between students’ use of ICT for social communication and their computer and information literacyMeral Alkan1 and Sabine Meinck2*
Purpose, significance of research and theoretical frame workIn the last decades we encountered rapid developments in information and communica-tion technologies. The inclusion of the worldwide web into daily life brought new and important implications also for education. Most of the schools and educational systems started providing extensive computer networks for their students and these are increas-ingly becoming main components of the teaching and learning environment, but so far little is known about the effectiveness and use of these technologies (Fraillon et al. 2014). Conclusions from research carried out in the field are partly contradictory. Many authors who examined computer use and student achievement found they were positively related
Abstract
This study investigates the relationship between students’ use of information and communication technology (ICT) for social communication and their computer and information literacy (CIL) scores. It also examines whether gender and socioeconomic background moderates this relationship. We utilized student data from IEA’s Inter-national Computer and Information Study (ICILS) to build multivariate regression models for answering the research questions, and accounted for the complex sample structure of the data by using weights for all statistical analyses, employing jackknife repeated replication for variance estimation. Students who frequently use the internet for messaging and participation in social networks (i.e., at least once a week) scored on average 44 points higher than those who use ICT for the same purpose only less than once a week or never. The direction of this effect was the same in all 21 participating educational systems, the difference ranging from 19 to 75 points (always statistically significant). We continued the analysis by testing whether the relationship is moder-ated by gender; as girls use more often ICT for social communication and have higher CIL scores on average. After controlling for the gender effect the CIL scores between the two examined groups decreased only by 2 points on average. Even after including students’ socio-economic background into the model, the difference in CIL between the two groups of interest declined only little—to 32 points on average across all countries. The difference remained to be statistically significant in all countries but one. The results suggest a strong relationship between students’ CIL proficiency level and the frequency of their use of electronic devices for social communication; hence, respective skills needed at schools and later on at the workplace are reflected in their use outside of school and for socializing.
Open Access
© 2016 The Author(s). This article is distributed under the terms of the Creative Commons Attribution 4.0 International License (http://creativecommons.org/licenses/by/4.0/), which permits unrestricted use, distribution, and reproduction in any medium, provided you give appropriate credit to the original author(s) and the source, provide a link to the Creative Commons license, and indicate if changes were made.
RESEARCH
Alkan and Meinck Large-scale Assess Educ (2016) 4:15 DOI 10.1186/s40536-016-0029-z
*Correspondence: [email protected] 2 IEA Data Processing and Research Center, Hamburg, GermanyFull list of author information is available at the end of the article
Page 2 of 17Alkan and Meinck Large-scale Assess Educ (2016) 4:15
(e.g., Becker 1994; Hativa 1994; Kozma 1991; Kulik and Kulik 1987; Liao 1992; Osun-ade 2003; Ryan 1991; Van Dusen and Worthren 1994; James and Lamb 2000; Attewell and Battle 1999; Sivin-Kachala 1998; Weaver 2000; Weller 1996; Wenglinsky 1998). Wen et al. (2002) suggest that there is a positive relationship between the number of com-puters available at school and students’ science achievement. Alspaugh (1999) reports that computer use has no effect on students’ achievement in reading, mathematics, sci-ence or social studies. There is also a number of studies that identified negative relation-ships between computer use and student achievement (Ravitz et al. 2002; Papanastasiou 2002, 2003). Papanastasiou (2002) who analysed the results of TIMSS, found a negative relationship between computer use and achievement in a number of countries such as Cyprus, Hong Kong and United States of America. According to this study, students who use computers most frequently in the classroom were lowest achievers in TIMSS in 1995. Papanastasiou (2003) and Papanastasiou et al. (2005) found that computer use does not have a positive nor negative effect on students’ science achievement based on PISA results, but the way of computer use affects science achievement.
Most of the international studies focused so far on the relation of ICT use and stu-dents’ competencies in reading, science and mathematics. The amount of research dedi-cated on computer and information literacy is very limited and most studies examine mainly internet access and online use (Olafsson et al. 2014). In the computer and infor-mation literacy (CIL) area, the first cross-national study is ICILS (Fraillon et al. 2014). It assesses the extent to which students know about, understand, and are able to use infor-mation and communication technology (ICT). The main purpose of ICILS is to deter-mine how well students are prepared for study, work and life in the digital age. With the information age the term “digital natives” was coined for the generation born in the early 1980s, also referred to as the first members of the millennial generation (Prensky 2001). In his article, Prensky claimed that “the arrival and rapid dissemination of digital tech-nology in the last decade of the twentieth century” had changed the way students think and process information, making it difficult for them to excel academically being exposed to outdated teaching methods. However, according to the ICILS results, although students have had an increased amount of exposure to technology, it does not necessarily imply that they are digital natives. In all the participating countries, on aver-age 17 % of the students did not even achieve the lowest level of CIL determined by the study. On average, only 2 % of the students achieved the highest level with a maximum of 5 % in Korea (Fraillon et al. 2014).1
This finding raises the question how so called digital natives use twenty first century tech-nology in daily life. It is known from the literature that age plays a significant role in the usage of computers and internet. As shown in Fig. 1 (Zichuhr and Madden 2012), and Fig. 2 (TurkStat 2014) below, there was a steady increase in internet use across all age groups in Turkey and the US. In the beginning of the current century, however, the younger age groups use internet more often compared to the older age groups in both countries.
1 See Fraillon et al. 2014 for detailed explanations of the determined CIL levels.

Page 3 of 17Alkan and Meinck Large-scale Assess Educ (2016) 4:15
In most European countries, as shown in Fig. 3, more than 80 % of young people (aged 16–29) used a computer on a daily basis. In all countries, percentages of the daily use of computers among young people is higher than for the whole population (Eurostat 2014).
Fig. 1 Internet use by age group in America, 2000–2012 (Source: Zichuhr and Madden 2012)
0.010.020.030.040.050.060.070.080.0
2002 2004 2006 2008 2010 2012 2014 2016
Internet use by age group in Turkey
16-24 25-34 35-44 45-54 55-64l 65-74
Fig. 2 Internet use by age group in Turkey, 2004–2014 (Source: TurkStat 2014)
Fig. 3 Proportion of people who used a computer on a daily basis, 2014 (%). Source: Eurostat (2014)

Page 4 of 17Alkan and Meinck Large-scale Assess Educ (2016) 4:15
Further, literature suggests that many children engage in a wide range of online activi-ties. ICT use by students has expanded to Internet, e-mail, chat, programming, graph-ics, spreadsheet, online shopping, online searching for literature and other educational materials. The students mostly use ICT for general purposes, i.e., communication, word processing, entertainment, etc. rather than for educational means (Mahmood 2009). According to Olafsson et al. (2014), the most common online activities of 9–16 years olds in Europe are: using internet for school work (85 %), playing games (83 %), watch-ing video clips (76 %) and instant messaging (62 %). Communication via the internet is ubiquitous; often schoolwork is accompanied by chatting and texting. A study published by Gokcearslan and Seferoglu (2005) showed that—at that time—Turkish students’ main focus is on playing games instead on learning activities.
The internet use has high rates among young people when it is compared to the whole population in the EU-28 for basic skills such as using a search engine (94 %) or sending an e-mail with attachments (87 %), while more than two-thirds of young people posted messages online (72 %), just over half used the internet for calling people (53 %) and around one-third (32 %) used peer-to-peer file sharing services. The proportion of young people of posting messages online was 34 percentage points higher than the average for the whole population (Eurostat 2014; Fig. 4).
Already in 2003 Prensky reported that young Americans talk more than 10.000 h on the phone and send more than 200.000 e-mails and text messages until the age of 21. A study conducted in the US found that 80 % of online teens use social network sites, Face-book being the most popular, with 93 % of those teens reporting its use (Lenhart 2012). In 2014, according to number of active users, Facebook is the most popular social media platform with 1184 billion users (Digital/Ajanslar 2014). In 2015, Facebook is still most popular social media platform among young people and 71 % of all teens from 13 to 17 use Facebook, 52 % of them use Instagram and 41 % use Snapchat. (Pew Research Center 2015)
“The use of social networks among children research report” focused on the use of social media among 9–16 year olds in Turkey showed that 85 % of students have com-puters at home, 70 % of all students get online at least once a day and 66 % use social media at least once a day, spending 72 min on average. This shows that most of the time spent on internet is dedicated to social media. The same study shows that 99 % of the children who have a social media account use Facebook. 60 % of the children reported
Fig. 4 Proportion of people who used selected internet skills, EU-28 (data from 2013; source: Eurostat 2014)
Page 5 of 17Alkan and Meinck Large-scale Assess Educ (2016) 4:15
that they don’t study enough because of spending too much time on Facebook, 25 % of them said that they spend less time with their parents and friends (TIB 2011).
The most common online social activities for young people in the EU-28 in 2014 included sending and receiving e-mails (86 %) and participating on social networking sites (82 %)—for example, Facebook or Twitter, by creating a user profile, posting messages or making other contributions—while close to half (47 %) of all young people in the EU-28 uploaded self-created content, such as photos, videos or text to the internet (Eurostat 2014).
Summarizing the literature, the high importance of students’ use of ICT for social com-munication in their daily life is evident. But does this type of ICT use enhance students’ CIL skills? Or, does it even rather have a negative effect, because less time remains for “worthwhile” computer usage, such as learning activities? This study examines the relation-ship between students’ use of ICT for social communication and their computer and infor-mation literacy and attempts to contribute to a deeper understanding of this relationship.
Methods and data sourcesStudents’ data of ICILS was used to explore the hypotheses. ICILS gathered data from almost 60,000 Grade 8 (or equivalent) students and 35,000 teachers in more than 3300 schools from 21 countries or education systems within countries. These data were aug-mented by contextual data collected from school ICT-coordinators, school principals, and the ICILS national research centres.
Students completed a computer-based test of CIL that consisted of questions and tasks presented in four 30-min modules. Each student completed two modules randomly allo-cated from the set of four so that the total assessment time for each student was 1 h.
After completing the two test modules, students answered (again on computer) a 30-min questionnaire. It included questions relating to students’ background character-istics, their experience and use of computers and ICT to complete a range of different tasks in school and out of school, and their attitudes toward using computers and ICT (Fraillon et al. 2014).
IEA’s IDB Analyzer was utilized for all statistical analyses, including the estimation of percentages, means and regression models. The IDB analyzer takes the complex data structure of ICILS data into account by applying sampling weights and employing jack-knife repeated replication for variance estimation. Comparisons between dependent samples were conducted using regression models in order to account for the covariance between the comparative groups.
Analysis resultsWe first analysed the relationship between students’ CIL score and their use of ICT for social communication. In the ICILS study, the student questionnaire included three questions that require students to rate the frequencies of their use of ICT applications. From these questions four scales were derived. One of them was “Students’ use of ICT for Social Communication” (S_USECOM). The students were asked to identify the fre-quency with which they were using the internet for various communication and infor-mation exchange activities outside of school. The response categories were “never”, “less than once a month”, “at least once a week but not every day” and “every day”. S_USECOM had an average reliability of 0.74 (Fraillon et al. 2015).

Page 6 of 17Alkan and Meinck Large-scale Assess Educ (2016) 4:15
The index variable (“S_USECOM”) consists of the following items:How often do you use the Internet outside of school for each of the following activities?
1. Posting comments to online profiles or blogs.2. Uploading images or videos to an [online profile] or [online community] (for exam-
ple. Facebook or YouTube).3. Using voice chat (for example Skype) to chat with friends or family online.4. Communicating with others using messaging or social networks [for example instant
messaging or (status updates)].
We could identify indeed a relationship between students’ CIL score and their use of ICT for social communication: in all educational systems participating in ICILS (further for simplicity referred to as “countries”), the CIL score increased along with an increase of students’ scale score in “Use of ICT for social communication”. This relationship was statistically significant in 16 out of 21 countries. However, the relation was weak; the explained variance of the CIL score was less than 10 % in most countries. We continued the analysis by investigating further the relationship between CIL and each of the four variables constructing the scale score for “Use of ICT for social communication”.
Posting comments to online profiles or blogsThere were no consistent patterns for relations between the reported frequencies for this variable in most countries except for Chile, Thailand and Turkey—the countries with relatively low CIL average scores. In these three countries, the CIL score increased along with an increasing frequency of postings.
Uploading images or videos to an [online profile] or [online community] (for example. facebook or youtube)Interestingly, students with a medium frequency of ICT use for uploading images or vid-eos had an average CIL score of 20 more points than those who reported to either never do that or do it every day. This pattern could be observed in all countries and was statis-tically significant in all countries but three (Republic of Korea, Turkey, Canada—New-foundland and Labrador).
Using voice chat (for example Skype) to chat with friends or family onlineNo clear patterns could be identified for relationships between the CIL scores and fre-quencies of ICT usage for voice chats.
Communicating with others using messaging or social networks [for example instant messaging or (status updates)]Apparently this variable had the closest relationship with CIL among the variables con-structing the index variable (“S_USECOM”): as shown in Fig. 5, the more frequent stu-dents use ICT for communication using messaging or social networks the higher was their CIL score, a finding that generally holds in all countries. Looking at the cross-coun-try average, mean CIL scores of students who never use the internet for communication

Page 7 of 17Alkan and Meinck Large-scale Assess Educ (2016) 4:15
are as low as 463 points while are as high as 522 points for students who do that on a daily basis (see Table 1).
For further in-depth analysis we decided to simplify the data by collapsing categories, resulting in a dichotomous variable. The split was taken between the response catego-ries where the difference in CIL scores was the greatest. Referring to the patterns visible
Fig. 5 Average CIL scores by ICT use for communicating with others using messaging or social networks
Table 1 Frequencies of ICT use for communicating with others using messaging or social networks (cross-country average) and CIL score
Average CIL score SE of average CIL score
Never 463 2.0
Less than once a month 476 2.2
At least once a month but not every week 490 1.9
At least once a week but not every day 513 1.2
Every day 522 0.9

Page 8 of 17Alkan and Meinck Large-scale Assess Educ (2016) 4:15
in Fig. 5, CIL scores of students reporting to use ICT for communication at least once a week or even every day were rather close to each other; also, no large differences in CIL scores occurred for students using ICT for communication less than once a week (or never). Therefore we collapsed the respective categories accordingly. This procedure split the countries’ target populations into two groups of varying proportions, as can be seen in Fig. 6. On average, three-fourth of the students use the Internet for communica-tion more than once a week. This proportion is less in Thailand and Turkey.
Comparing the resulting two groups of students, we found an average difference in CIL scores of 44 points on favor of students using ICT for social communication more frequently. The direction of the effect was the same in all countries and ranged from 19 points difference in Switzerland to as much as 75 points in the Slovak Republic (refer to Table 2, Model 1, coefficients of E-communication). In all countries, the difference was found to be statistically significant. Since these results were rather striking, we wondered if this effect was moderated by other variables. Consequently we set up various multi-variate regression models in order to control for such effects.
Fig. 6 Proportion of students by use of ICT for communicating with others using messaging or social net-works

Page 9 of 17Alkan and Meinck Large-scale Assess Educ (2016) 4:15
Table 2 Regression coefficients
Country Variable Model 1 Model 2 Model 3
Australia Constant 509.9 501.4 512.2
E-communication 40.8 * 38.0 * 29.1 *
Gender 21.2 * 18.3 *
SES 28.2 *
Chile Constant 449.1 441.7 452.9
E-communication 54.4 * 51.8 * 38.3 *
Gender 18.4 * 18.9 *
SES 31.6 *
Croatia Constant 478.5 472.9 483.4
E-communication 40.5 * 39.4 * 29.3 *
Gender 13.2 * 14.0 *
SES 22.5 *
Czech Republic Constant 533.9 530.9 535.3
E-communication 23.1 * 21.2 * 18.0 *
Gender 9.2 * 8.2 *
SES 19.6
Germanya Constant 497.7 492.1 502.0
E-communication 36.2 * 34.8 * 25.6 *
Gender 13.9 * 15.0 *
SES 24.8 *
Republic of Korea Constant 519.2 504.4 507.2
E-communication 41.1 * 37.1 * 34.9 *
Gender 33.6 * 33.6 *
SES 17.4 *
Lithuania Constant 443.1 439.4 460.1
E-communication 61.6 * 59.9 * 42.6 *
Gender 10.7 * 8.9 *
SES 24.6 *
Norway (Grade 9) Constant 495.9 487.3 497.8
E-communication 46.8 * 44.5 * 34.8 *
Gender 21.2 * 22.0 *
SES 19.4 *
Poland Constant 508.9 505.8 511.8
E-communication 32.5 * 30.6 * 25.1 *
Gender 10.0 * 8.4 *
SES 28.0 *
Russian Federationb Constant 468.5 466.2 477.8
E-communication 57.0 * 55.5 * 44.4 *
Gender 7.2 * 6.1 *
SES 20.2 *
Slovak Republic Constant 454.0 450.5 467.6
E-communication 74.6 * 73.5 * 59.2 *
Gender 8.8 * 10.0 *
SES 29.3 *
Slovenia Constant 496.2 485.5 488.0
E-Communication 20.6 * 17.4 * 15.2 *
Gender 26.8 * 27.8 *
SES 18.5 *

Page 10 of 17Alkan and Meinck Large-scale Assess Educ (2016) 4:15
Gender as moderating variableIt is known from the literature that girls spend on average more time on social network sites and use them more actively than boys (Duggan and Brenner 2013). Lenhart (2012)
* Statistically significant (p < 0.05) coefficientsa Met guidelines for sampling participation rates only after replacement schools were includedb Country surveyed the same cohort of students but at the beginning of the next school yearc Due to missing occupation codes no SES variable was derived, hence Model 3 was not applicable
Table 2 continued
Country Variable Model 1 Model 2 Model 3
Thailandb Constant 342.7 340.9 350.3
E-communication 65.5 * 65.2 * 45.4 *
Gender 3.9 7.2
SES 34.5 *
Turkey Constant 331.6 329.6 344.2
E-communication 58.0 * 58.2 * 44.0 *
Gender 3.9 3.7
SES 27.2 *
Ontario, Canada Constant 523.5 515.4 524.8
E-communication 31.8 * 28.2 * 20.8 *
Gender 22.6 * 21.2 *
SES 19.2 *
Newfoundland and Labrador, Canada
Constant 501.9 490.4 496.3
E-communication 35.4 * 28.9 * 27.1 *
Gender 30.4 * 27.8 *
SES 22.0 *
Countries not meeting sample requirements
Denmark Constant 525.9 520.3 528.1
E-communication 19.5 * 17.9 * 13.1
Gender 14.7 * 13.9 *
SES 19.2 *
Hong Kong, SAR Constant 480.3 472.5 499.3
E-communication 50.9 * 48.9 * 34.6 *
Gender 18.9 * 12.8 *
SES 11.1 *
Netherlands Constant 496.1 488.8 Not includedc
E-communication 49.5 * 48.0 *
Gender 17.7 *
SES
Switzerland Constant 511.9 508.7 508.1
E-communication 18.7 * 18.4 * 20.1 *
Gender 7.1 8.8
SES 17.0 *
City of Buenos Aires, Argen-tina
Constant 416.8 416.8 427.9
E-communication 56.4 * 56.4 * 48.0 *
Gender 0.1 −0.2
SES 37.2 *
Cross-national average Constant 475.5 469.6 478.8
E-communication 43.6 * 41.6 * 32.5 *
Gender 14.9 * 14.3 *
SES 23.6 *
Page 11 of 17Alkan and Meinck Large-scale Assess Educ (2016) 4:15
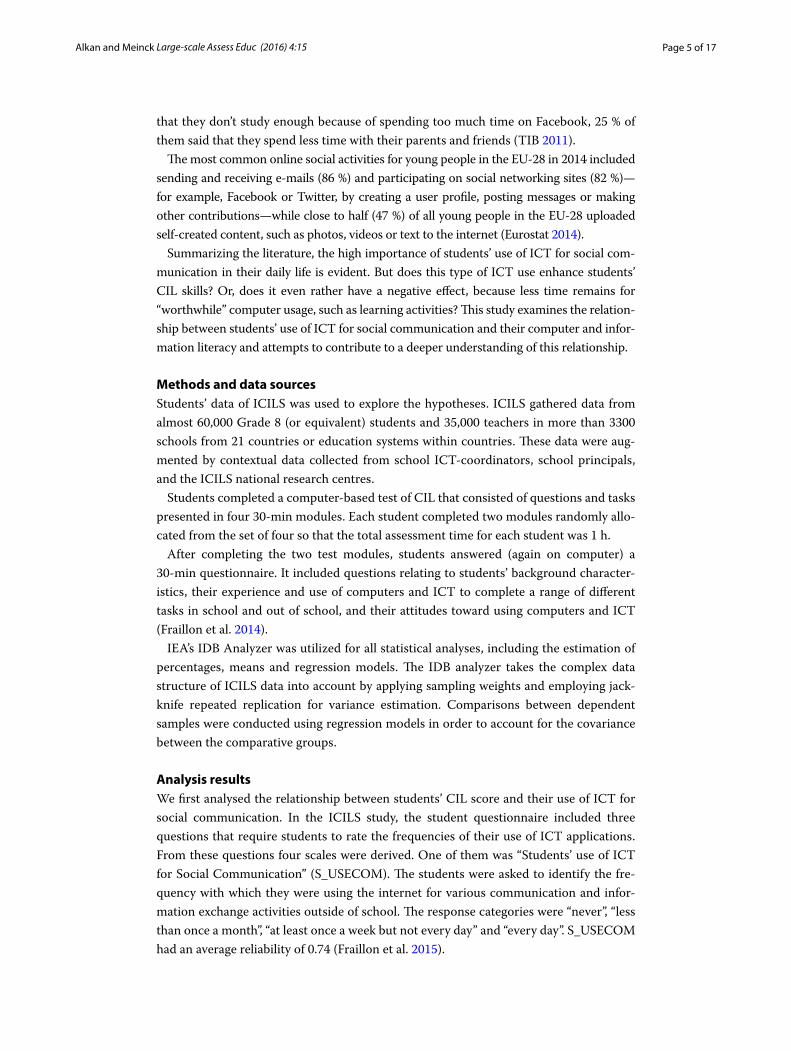
reported that some 95 % of teenagers use the internet in the US. 42 % of girls who use the internet report to video-chat, while only about a third of boys engage in that activ-ity. Girls are also more active in their texting and mobile communication behaviours (Lenhart et al. 2010). Our own study confirms this finding for all ICILS countries as can be seen in Fig. 7—except for Turkey. Interestingly, in Turkey (highlighted by the black arrow in Fig. 7) boys report to use the Internet for social communication more often than girls. The differences of the gender group percentages are statistically significant in all countries.
Although gender is a major determinant in CIL scores of ICILS, it did hardly moder-ate the difference in CIL scores between the two groups presented in Fig. 5. The group differences remained significant in all countries (see Model 2 in Table 2, coefficients of E-communication.
Socio-economic background as moderating variableIn a next step we included the national index of students’ socio-economic background (variable “S_NISB”) into the model, reasoning that the availability of internet access and communication devices may depend on the socio-economic status (SES) of the students.
The “digital divide”—referring to the gap between those who do and those who do not have access to ICT’s (Warschauer 2003)—generally affects individuals who are unem-ployed or in low-skilled occupations, and who have a low income and/or a low level of education. Students from families with a lower SES tend to be less confident and capa-ble in navigating the Web to find credible information (Adler 2014). Also Adegoke and Osoyoko (2015) support the theory that SES influences students’ access (exposure) to
Fig. 7 Percentages of students using ICT for communicating at least once a week by gender

Page 12 of 17Alkan and Meinck Large-scale Assess Educ (2016) 4:15
ICT and internet. The findings of Hargittai (2010) suggest that even when controlling for basic Internet access, among a group of young adults, SES is an important predictor of how people are incorporating the Web into their everyday lives. Bozionelos (2004) showed that SES had a direct positive relationship with computer experience and an indirect negative relationship with computer anxiety. The findings are supportive of the digital divide and they imply that information technology may in fact be increasing ine-qualities among social strata in their access to employment opportunities.
After controlling for both, gender and SES, the difference in CIL between our two groups of interest declined to 32 points on average across all countries. However, the dif-ference remained to be statistically significant in all countries but one (Denmark).
Table 2 presents regression coefficients of all three discussed models; Fig. 8 presents the differences in CIL scores of students using ICT for social communication more vs. less than once a week for all three considered models (coefficient of “E-communication” in Table 2). Evidently, this difference is hardly moderated in any country by gender, while the socio-economic status plays a larger role. In twelve out of twenty countries, after controlling for gender and SES, the examined difference in the CIL score decreases by more than 10 points. Only in Switzerland neither SES nor gender seemed to be
Fig. 8 Differences in CIL scores of students using ICT for social communication more vs. less than once a week by model

Page 13 of 17Alkan and Meinck Large-scale Assess Educ (2016) 4:15
associated with the difference in CIL scores between the two groups of interest, i.e., the coefficient of E-communication remains constant across the three models.
Further variables with potential moderating effectsWe also investigated the effect of further variables that may have moderated the found relationship and thereby could have affected the presented relationship in significant ways. We identified such variables based on evidence from the literature, evidence from ICILS (Fraillon et al. 2014) or simply by applying common sense. It would exceed the purpose of this paper to present all details of these analyses; however, the following par-agraphs give some major findings.
While girls use ICT more often for social communication, boys use it more often for playing games (Rideout and Foehr 2010). This is also evident from ICILS data and is presented as cross-country average in Fig. 9. The patterns are similar for all participating countries. However, there was no general relation between using ICT for playing games and CIL except for Turkey and Thailand, where an increased frequency of gaming was related with increasing CIL scores.
Further, one may argue that the overall use of computers could have a moderating effect on the studied relationship. However, including the respective variable into the regression model proofed to not change much the effect of ICT use for social com-munication on CIL and also did not enhance the explained variance of the CIL score significantly.
Discussion and conclusionsThe arrival and rapid dissemination of digital technology in the last decade of the twen-tieth century raises the question how so called digital natives use technology in daily life and what relevant skills they need to develop in order to participate effectively in the
Fig. 9 Using a computer for playing games (outside of school) by gender (estimated percentages across all participating countries)

Page 14 of 17Alkan and Meinck Large-scale Assess Educ (2016) 4:15
digital age. From the literature, the high importance of students’ use of ICT for social communication in their daily life is evident. In this paper we tried to answer the question if this type of ICT use enhances students’ CIL skills or if it—on the opposite—perhaps even rather has a negative effect, because less time remains for “worthwhile” computer usage, such as learning activities.
We first analyzed the relationship between students’ CIL score and their use of ICT for social communication. The CIL score increased along with an increase of students’ scale score in “Use of ICT for social communication” in all educational systems participating in ICILS. This relationship was statistically significant in 16 out of 21 countries. How-ever, the relation was weak. We continued the analysis by investigating further the rela-tionship between CIL and each of the four variables constructing the index “Use of ICT for social communication”. We found out that the variable which has the closest relation-ship with CIL was “Communicating with others using messaging or social networks [for example instant messaging or (status updates)]”, while other variables comprising the index showed different or no patterns related with CIL.
For accommodating further analysis on this variable, we decided to split students’ data into two groups. We collapsed the five original categories of the variable into two cat-egories, reflecting the use of messaging or social networks “at least once a week or even every day” versus “less than once a week (or never)”.
Comparing the resulting two groups of students, we found a large average difference in CIL scores (44 points) favoring students using ICT for social communication more frequently. The direction of the effect was the same in all countries; the difference ranged from 19 points in Switzerland to as much as 75 points in the Slovak Republic. Since these results were rather striking, we examined whether this effect was moderated by other variables such as SES and Gender. We found however that the moderating effect of these variables on the observed relationship was weak or even negligible in all participating countries. In other words, the relation between the use of ICT for communicating with others using messaging or social networks and CIL scores was still high and consistent across countries when controlling for SES and Gender.
This positive and cross-nationally observed relationship was rather unexpected, espe-cially because the relationship between the communication index created by ICILS and the CIL scores was weak. Trying to understand this phenomenon, we considered the nature of messaging and participation in social networks. We see that it actually includes posting comments, uploading and downloading images and videos—hence, these fea-tures are no different than the separate items creating the social communication index. In fact the single item basically contains the other index items. Possibly the written com-munication portion included makes the difference, or the actual widespread of activi-ties involved in messaging/electronic social networking explains the indistinct positive relationship with CIL. In future cycles of ICILS it may be worthwhile to review the index items accordingly.
To explore this phenomenon further, we also should focus on the CIL construct. As Fraillon et al. (2014) pointed out in the ICILS international report, the CIL construct was conceptualized in terms of two strands:
Strand 1; collecting and managing information, focuses on the receptive and organiza-tional elements of information processing and management,

Page 15 of 17Alkan and Meinck Large-scale Assess Educ (2016) 4:15
Strand 2; producing and exchanging information, focuses on using computers as pro-ductive tools for thinking, creating, and communicating.
When we consider the interactive nature of social media, it can be assumed that they provide students with a medium for collecting and managing information as antici-pated in Strand 1 and also for producing and exchanging information as conceptualized in Strand 2. Hence, this item seems truly be related with both strands of the CIL con-struct, which may be one reason for the close relationship. Lacking of an experimen-tal design, this study cannot make causal inferences on the relation between CIL and e-communication. Therefore we cannot conclude if frequent use of ICT for communica-tion enhances CIL skills, or if in turn students with high CIL use more frequently ICT for social communication.
Future studies should also monitor the use of social networks in education further. Students should not be expected to accomplish high skills in using information and computer technology and at the same time expect them to keep this aspect of their per-sonality outside of their social life. Rather, it is worth to explore the additional learn-ing opportunities arising from electronic tools and media out- but also and especially inside schools. According to findings from Fraillon et al. (2014), there is a need in many countries to equip teachers with the respective knowledge to use ICT (including social communication tools) in their teaching. Utilizing social media for teaching may hold the potential to increase CIL for all students independently from their gender and SES back-grounds; and thereby avoid that students with low CIL or limited access to ICT may increasingly lack opportunities to actively participate in the modern society.
As a matter of fact, nowadays messaging and Facebook or other social networks became a part of students’ daily life. As parents, teachers and educators, our responsibil-ity is to help our children to benefit from social networks educationally.
Authors’ contributionsMA developed the research questions, conducted the literature research and drafted significant parts of the manuscript. SM developed the research design, conducted data compilation, the statistical analysis and interpretation of results and drafted significant parts of the manuscript. Both authors have given final approval of the manuscript version to be published and agree to be accountable for all aspects of the work in ensuring that questions related to the accuracy or integrity of any part of the work are appropriately investigated and resolved. All authors read and approved the final manuscript.
Author details1 Ministry of National Education, Ankara, Turkey. 2 IEA Data Processing and Research Center, Hamburg, Germany.
AcknowledgementsThe authors are thankful to Diego Cortes for his very useful comments while reviewing this paper.
Competing interestsThe authors declare that they have no competing interests.
Received: 23 September 2015 Accepted: 3 August 2016
ReferencesDigital/Ajanslar, (2014). http://www.dijitalajanslar.com/internet-ve-sosyal-medya-kullanici-istatistikleri-2014/.Adegoke, S., & Osoyoko, M. (2015). Socio-economic background and access to internet as correlates of students achieve-
ment in agricultural science. International Journal of Evaluation and Research in Education (IJERE), 4(1), 16–21.Adler, B., (2014). News literacy declines with socioeconomic status. Colombia Journalism Review, http://www.cjr.org/
news_literacy/teen_digital_literacy_divide.php.Alspaugh, J. W. (1999). The relationship between the number of students per computer and educational outcomes.
Journal of Educational Computing Research, 21(2), 141–150.Attewell, P., & Battle, J. (1999). Home computers and school performance. Information Society, 15, 1–10.
Page 16 of 17Alkan and Meinck Large-scale Assess Educ (2016) 4:15
Becker, H. J. (1994). Mindless or mindful use of integrated learning systems. International Journal of Educational Research, 21, 65–79.
Bozionelos, N. (2004). Socio-economic background and computer use: the role of computer anxiety and computer experience in their relationship. International Journal of Human Computer Studies, 61(5), 725–746.
Duggan, M., Brenner, J., (2013). The demographics of social media Users—2012. Pew internet and American life project. http://www.pewinternet.org/Reports/2013/Social-media-users.aspx.
Eurostat, (2014). Being young in Europe today-digital world. http://www.ec.europa.eu/eurostat/statistics-explained/index.php/Being_young_in_Europe_today_-_digital_world
Fraillon, J., Ainley, J., Schulz, W., Friedman, T., & Gebhardt, E. (2014). Preparing for life in a digital age: The IEA International Computer and Information Literacy Study international report. Berlin: Springer.
Fraillon, J., Ainley, J., Schulz, W., Friedman, T., & Gebhardt, E. (2015). ICILS 2013 Technical Report.Gokcearslan, S., & Seferoglu, S. (2005). Öğrencilerin evde bilgisayar kullanımına ilişkin bir çalışma. Pamukkale: Eğitim Bilimleri
Kongresi.Hargittai, E. (2010). Digital Na(t)ives? Variation in internet skills and uses among members of the “Net Generation”. Socio-
logical Inquiry, 80, 92–113. doi:10.1111/j.1475-682X.2009.00317.x.Hativa, N. (1994). What you design is not what you get (WYDINWYG): Cognitive, affective, and social impacts of learning
with ILS—an integration of findings from six-years of qualitative and quantitative studies. International Journal of Educational Research, 21, 81–111.
IEA. (2014). Press Release, Brussels.James, R., & Lamb, C. (2000). Integrating science, mathematics, and technology in middle school technology-rich envi-
ronments: A study of implementation and change. School Science and Mathematics, 100, 27–36.Kozma, R. B. (1991). Learning with media. Review of Educational Research, 61, 179–211.Kulik, J. A., & Kulik, C. L. C. (1987). Review of recent literature on computer-based instruction. Contemporary Education
Review, 12, 222–230.Lenhart, A., 2012. Teens and video. Pew Internet and American Life Project. http://www.pewinternet.org/2012/05/03/
teens-online-video/.Lenhart, A., Purcell, K., Smith, A., Zickuhr, K., (2010). Social media and mobile Internet use among teens and young adults. Pew
Internet and American Life Project. http://www.pewinternet.org/~/media//Files/Reports/2010/PIP_Social_Media_and_Young_Adults_Report_Final_with_toplines.pdf.
Liao, Y. K. (1992). Effects of computer-assisted instruction on cognitive outcomes: A meta-analysis. Journal of Research on Computing and Education, 24, 367–380.
Mahmood, K. (2009). Gender, subject and degree differences in university students’ access, use and attitudes toward information and communication technology (ICT). International Journal of Education and Development using Infor-mation and Communication Technology (IJEDICT), 5(3), 206–216.
Olafsson, K., Livingstone, S., Haddon, L. (2014). Children’s use of online technologies in Europe, a review of the European evidence base, http://www.eukidsonline.net
Osunade O., (2003). An Evaluation of the Impact of Internet Browsing on Students’ Academic Performance at the Tertiary Level of Education in Nigeria http://www.rocare.org/smallgrant_nigeria2003.pdf
Papanastasiou, E. (2002). Factors that differentiate mathematics students in Cyprus, Hong Kong, and the USA. Educational Research and Evaluation, 8, 129–146.
Papanastasiou, E. (2003). Science literacy by technology by country: USA, Finland and Mexico. Making sense of it all. Research in Science and Technological Education, 21(2), 129–146.
Papanastasiou, E. C., Zembylas, M., & Vrasidas, C. (2005). An examination of the PISA database to explore the relationship between computer use and science achievement. Educational Research and Evaluation, 11(6), 529–543.
Pew Research Center, (2015). http://www.pewinternet.org/2015/04/09/teens-social-media-technology-2015/pi_2015-04-09_teensandtech_01/
Prensky, M. (2001). Digital natives, digital immigrants, on the horizon. Bradford: MCB University Press.Ravitz, J., Mergendoller, J., & Rush, W. (2002). Cautionary tales about correlations between student computer use and
academic achievement. Paper Presented at Annual Meeting of the American Educational Research Association, New Orleans
Rideout, V.J., Foehr, U.G., Roberts D.F. (2010). Generation M: Media in the lives of 8-to 18-year-olds. Henry J. Kaiser Family Foundation. http://www.files.eric.ed.gov/fulltext/ED527859.pdf
Ryan, A. W. (1991). Meta-analysis of achievement effects of microcomputer applications in elementary schools. Educa-tional Administration Quarterly, 27, 161–184.
Sivin-Kachala, J. (1998). Report on the Effectiveness of Technology in Schools, 1990–1997. Washington, DC: Software Pub-lisher’s Association.
TIB, (2011). Çocukların Sosyal Paylaşım Sitelerini Kullanım Alışkanlıkları Araştırması, http://www.guvenliweb.org.tr/istatis-tikler/files/Cocuk_sosyal_paylasim_arastirma_raporu.pdf
TurkStat, (2014). Information and Communication Technology (ICT) usage survey in households & individuals. http://www.tuik.gov.tr/PreTabloArama.do
Van Dusen, L. M., & Worthren, B. R. (1994). The impact of integrated learning system implementation on student out-comes: Implications for research and evaluation. International Journal of Educational Research, 21, 13–24.
Warschauer, M. (2003). Dissecting the “digital divide”: A case Study in Egypt. The Information Society: An International Journal, 19(4), 1.
Weaver, G. C. (2000). An examination of the National Educational Longitudinal Study (NELS: 88) Database to probe the correlation between computer use in school and improvement in test scores. Journal of Science Education and Technology, 9, 121–133.
Weller, H. (1996). Assessing the impact of computer-based learning in science. Journal of Research on Computing in Educa-tion, 28, 461–486.
Wen, M. L., Barrow, L. H. & Alspaugh, J. (2002). How Does Computer Availability Influence Science Achievement. Paper pre-sented at the Annual Meeting of the National Association for Research in Science Teaching, New Orleans.

Page 17 of 17Alkan and Meinck Large-scale Assess Educ (2016) 4:15
Wenglinsky, H. (1998). Does it compute? The relationship between educational technology and student achievement in math-ematics. Princeton: Policy Information Center, Educational Testing Service.
Zichuhr, K., Madden, M. (2012). Older adults and internet use. http://www.pewinternet.org/2012/06/06/older-adults-and-internet-use/


![LEADER ICT System User Guide Introduction to CRM - Pobal to CRM... · The LEADER ICT System, utilises Dynamics CRM [Customer Relationship Management] , which is a Microsoft solution](https://static.fdocuments.us/doc/165x107/5abf90957f8b9a8e3f8e6832/leader-ict-system-user-guide-introduction-to-crm-pobal-to-crmthe-leader-ict.jpg)