The relationship between specific gravity and percentage ... · PDF file112 AMERICAN POTATO...
12
1976) SCHIPPERS: SPECIFIC GRAVITY AND DRY MATTER 111 THE RELATIONSHIP BETWEEN SPECIFIC GRAVITY AND PERCENTAGE DRY MATTER IN POTATO TUBERS1, z P. A. Schippers 2 Abstract Specific gravity and percentage dry matter were determined for 1269 potato samples taken over a period of six years. The correlation coefficient between these properties over the whole material was 0.912 and the regres- sion equation was: % dry matter = -217.2 + 221.2 (specific gravity). When the material was broken down into smaller, logically defined groups, such as a single cultivar, regression lines often deviated from this general line, although in most cases the correlation coefficients were still quite high. This means that the quantitative relationship between specific gravity and dry matter content was not sufficiently stable to serve as a general measure of prediction under all conditions. It seems probable that various production areas of the United States will have to develop the line which is best suited to their conditions, and that some cultivars may require separate lines. Resumen Se determin6 la gravedad espec~fica y el porcentaje de materia seca en 1269 muestms de papa tomadas sobre un periodo de seis afios. El coeficiente de correlacion entre estas propiedades sobre el total del material fue 0.912 y la ecuacirn de regresirn fue: % materia seca = 217.2 + 221.2 (gravedad especifica) Cuando el material fue separado en pequefios, 16gicamente definidos, grupos tales como un solo cultivar, las lineas de regresirn a menudo se desviaban de esta linea general, aunque en la mayoria de los casos los coeficientes de correlacirn fueron aun muy altos. Esto significa que la relacirn cuantitativa entre gravedad especifica y contenido de materia seca no fue suficientemente estable para servir como una medida general de prediccirn bajo todas las condiciones. Parece probable que varias areas de produccirn de los Estados Unidos tendrhn que desarrollar la linea que m~is se adapte a sus condiciones y que algunos cultivares puedan requerir lineas separadas. Introduction The importance of dry matter content of potato tubers in relation to texture of the cooked or baked tuber or to yield and quality of processed 'Paper No. 691, Department of Vegetable Crops, Cornell University, Ithaca, New York 14853. zSenior Research Associate, Department of Vegetable Crops, Cornell University. Long Island VEgetable Research Farm, Riverhead. New York 11901. 3This work was carried out with support of Hatch funds (Project 408), Received for publication September 8, 1975.
-
Upload
vuongtuong -
Category
Documents
-
view
215 -
download
1
Transcript of The relationship between specific gravity and percentage ... · PDF file112 AMERICAN POTATO...
1976) SCHIPPERS: SPECIFIC GRAVITY AND DRY MATTER 111
T H E R E L A T I O N S H I P B E T W E E N S P E C I F I C G R A V I T Y A N D P E R C E N T A G E DRY M A T T E R IN P O T A T O TUBERS1, z
P. A. Schippers 2
Abstract
Specific gravi ty and percentage dry matter were determined for 1269 potato samples taken over a period of six years. The correlat ion coefficient be tween these propert ies over the whole material was 0.912 and the regres- sion equation was:
% dry mat ter = -217.2 + 221.2 (specific gravity). When the material was broken down into smaller, logically defined
groups, such as a single cult ivar, regression lines often deviated f rom this general line, al though in most cases the correlat ion coefficients were still quite high. This means that the quantitat ive relationship be tween specific gravity and dry mat ter content was not sufficiently stable to serve as a general measure of prediction under all conditions. It seems probable that various product ion areas of the United States will have to develop the line which is best suited to their conditions, and that some cultivars may require separate lines.
Resumen
Se determin6 la gravedad espec~fica y el porcentaje de materia seca en 1269 mues tms de papa tomadas sobre un periodo de seis afios. El coeficiente de correlacion entre estas propiedades sobre el total del material fue 0.912 y la ecuaci rn de regres i rn fue:
% materia seca = 217.2 + 221.2 (gravedad especifica) Cuando el material fue separado en pequefios, 16gicamente definidos,
grupos tales como un solo cultivar, las lineas de regres i rn a menudo se desviaban de esta linea general, aunque en la mayoria de los casos los coeficientes de corre laci rn fueron aun muy altos. Esto significa que la relacirn cuantitativa entre gravedad especifica y contenido de materia seca no fue suficientemente estable para servir como una medida general de prediccirn bajo todas las condiciones. Parece probable que varias areas de producc i rn de los Estados Unidos tendrhn que desarrollar la linea que m~is se adapte a sus condiciones y que algunos cultivares puedan requerir lineas separadas.
Introduction
The impor tance of dry mat ter content of pota to tubers in relation to texture of the cooked or baked tuber or to yield and quality of processed
'Paper No. 691, Department of Vegetable Crops, Cornell University, Ithaca, New York 14853. zSenior Research Associate, Department of Vegetable Crops, Cornell University. Long Island VEgetable Research Farm, Riverhead. New York 11901. 3This work was carried out with support of Hatch funds (Project 408), Received for publication September 8, 1975.
112 AMERICAN POTATO JOURNAL (Vol. 53
product has been reported in many publications (for reviews see 3, 10, 12). The advantage of measuring the percentage dry matter by the rapid and simple method of specific gravity is obvious. It remains to be shown that the relationship between specific gravity and dry matter not only is qualita- tively close, witness the many correlation coefficients of 0.85 and higher reported in the literature (1, 4, 8, 15), but also quantitatively stable. Con- scious attempts to investigate this, however, are few (1, 14). Vanasse et al. (14) found significant differences in regression equations derived from samples of different cultivars or different locations, but considered these differences of little practical importance. Agle and Woodbury (1) found differences due to growing season in the cultivar Russet Burbank and, sometimes, a tendency for the regression coefficients to increase during storage.
A regression analysis of the results of measurements published by Behrend et al. (2) on which a well known table is based (Maercker's table) shows that there were significant differences between the regression lines calculated for subgroups of their material, depending on the years in which the samples were taken and on who did the determination (1872 and 1873 (n= 28) by Abesser, 1874 and 1875 (n= 72) by Holdefleiss and 1876 and 1877 (n=44) by Morgen). The slope of the line fitting the results of Holdefleiss was significantly steeper than the one calculated for the results of Morgen. The level of the line calculated for the material of Abesser was significantly lower than the levels of both other lines.
An analysis of the material published by Hals and Buchholz (6) shows that the line calculated for their 1907 samples (n=74) was significantly different in both level and slope from the line calculated for their 1908 samples (n=70).
The data of Tuorila (13) indicate that soil type had an influence on me relationship, since the regression line calculated for samples from oligo- trophic peat soil was at a significantly higher level than the line calculated for samples of the same harvest date for eutrophic peat soil.
Regression lines can be constructed from the results of Porter et al. (7) indicating that they were dependent on growing conditions. The line rep- resenting the samples (n=21) from Long Island, New York, was at a significantly lower level (approximately 1% in dry matter) than the one from Idaho (n=25), but there was no difference in slope.
A commonly used regression line is the one published by von Scheele et al. (8) that was based on European cultivars and growing conditions. Fitzpatrick et al. (5) stated categorically that it is not satisfactory under American conditions. They felt it would be possible to produce, through a cooperative project using standardized procedures, a common regression line with narrow confidence limits. The examples previously mentioned, however, suggest that it is very unlikely that a regression formula will be found that is suitable under all conditions.
1 9 7 6 ) SCHIPPERS: SPECIFIC GRAVITY AND DRY MATTER 113
A large number of specific gravity and dry matter measurements had been taken at this station over the years and it seemed likely that the collection and organization of these data would contribute to the knowl- edge of the relationship between these two factors, particularly since nearly all samples were grown at the same location. The present paper is the result of these studies.
Methods
Specific gravity measurement--Specific gravity was determined by calculating the quotient weight in air
weight in air minus weight in water Sample sizes varied according to the type of experiment. A sample weight of 5 kg was normal for measurements shortly after harvest, but if specific gravity was measured during or after storage experiments, the weights were usually 2.0 to 2.5 kg.
Dry matter determinations--Sectors were cut lengthwise out of each of 12 to 15 tubers, which insured a proportional representation of all tuber tissues, and destroyed in a blender after adding an equal weight of water. Duplicate samples of approximately 40 g of slurry were weighed into 10 cm Petri dishes and dried for 16 hours at 70°C in a ventilated oven. Since the surface area of the material in the dishes was large and the thickness not more than 5 ram, the relatively short drying time of 16 hours was more than adequate. A temperature of 70°C or slightly lower was maintained in order to prevent the starch from gelatinizing. The resulting dry matter was a very friable substance which was easily removed from the dishes.
Statistical analysis--Correlation coefficients and regression equa- tions with standard errors were calculated, and the significance of differ- ences in level and slope between comparable lines was established in paired comparisons by the method mentioned by Snedecor (11).
Material
The results of 1269 samples from field and storage experiments were subdivided into four groups as follows.
I. Variety trials--The material in this group came from variety trials which were carried out in 1969, 1970, 1971 and 1972. In 1%9 the variety trial consisted of 18 cultivars in duplicate in which the determinations were carried out on October 20, 1%9. In addition, one sample of each cultivar was stored at 5°C, one at 7.5°C and one at 10°C until December 26, 1969, when the experiment was terminated and the specific gravity and dry matter content determined. There were also 32 lines in an observational trial of breeding material in which the deterraina~vns were done on Oc- tober 7, 1969. (Total 1%9:122 samples). In 1970 there were 25 cultivars in the variety trial. The specific gravity was determined on September 21,
114 AMERICAN POTATO JOURNAL (Vol. 53
1970; the dry matter was determined on November 26, 1970, after the tubers had been stored at 7.5°C. (Total 1970: 25). In 1971 the variety trial consisted of 41 cultivars in which the determinations were done on October 27, 1971. In addition, 12 samples of the cultivar Norchip were included which came from various places within the State of New York. The determinations were done in November 1971. (Total 1971: 53). In 1972 there were 36 cultivars in the variety trial. Specific gravity was determined on October 10 and dry matter content on November 20, 1972, in tubers from two field replications. (Total 1972: 72). The total number of samples of these four years of variety trials was 272.
H. Storage experimentswln these trials potato tubers were kept in closed metal containers in which the temperatures and relative humidities were kept constant (9). Temperatures were always 7.5, 10.0 and 12.5°C, relative humidities were in 1971 approximately 70, 80 and 100%, in 1972 they varied from 60 to 100% in five steps, and in 1973, 65, 70 and 95%. Every year there were 144 samples stored in these containers, four in each, but in 1971 two samples were lost. The total number was 430.
In 1971 the cultivar Norchip was sampled eight times, every fourth week, starting November I4, 1971, and ending May 22, 1972. In 1972 the variety Katahdin was sampled four times: December 13, 1972, January 17, February 12 and March 28, 1973. In 1973 Hudson, Katahdin, Kennebec and Russet Burbank were sampled April 2, 1974.
III. Nitrate studies--Samples of Katahdin tubers of varying maturity were collected from plots with different nitrogen fertilization treatments. Tubers were harvested at weekly intervals, starting July 11 in 1972, June 20 in 1973 and July 8 in 1974. At each harvest date samples of 8 (1972) or 9 (1973 and 1974) treatments were harvested in duplicate. Specific gravity and dry matter content were determined the same day. Total: 427.
IV. Variety-fertility--In 1974, a similar experiment included five va- rieties (Alamo, Cascade, Hudson, Katahdin, Superior) and four nitrogen fertilization treatments. Weekly harvests began July 1, 1974. There were 140 samples.
Results
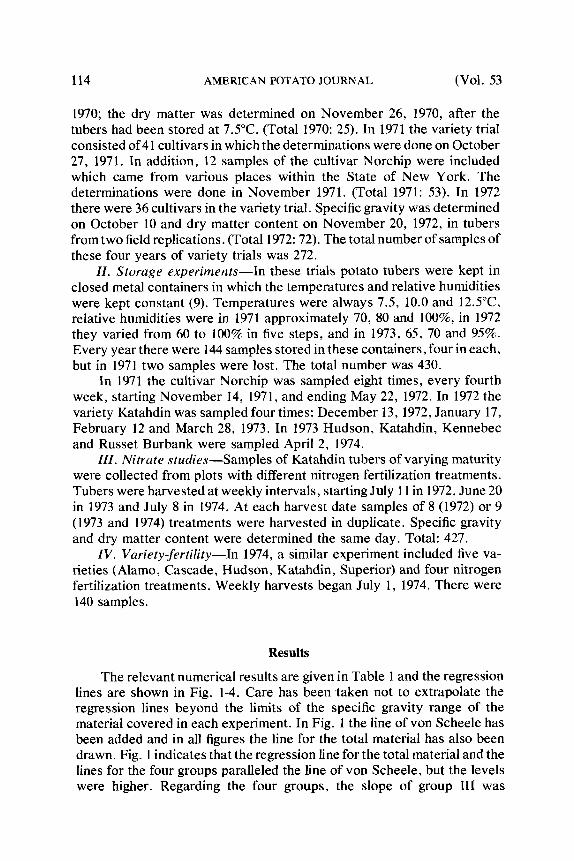
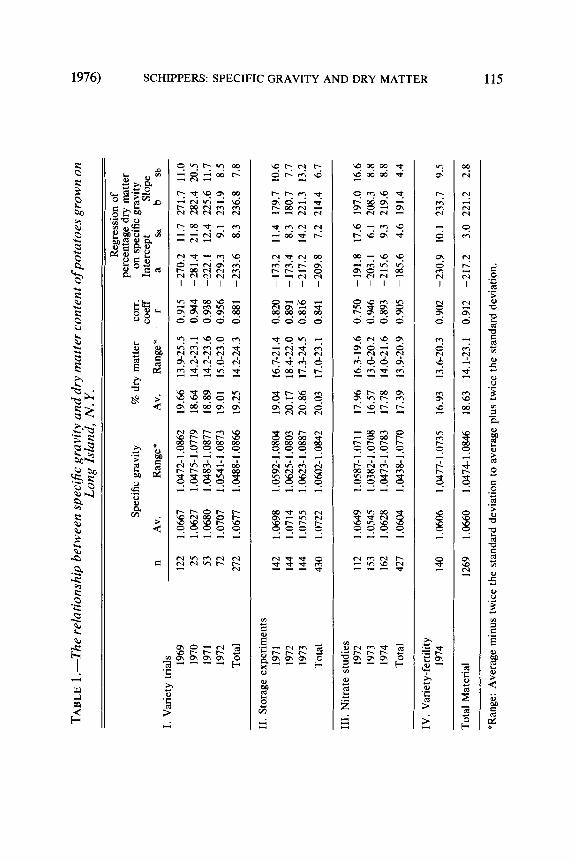
The relevant numerical results are given in Table 1 and the regression lines are shown in Fig. 1-4. Care has been taken not to extrapolate the regression lines beyond the limits of the specific gravity range of the material covered in each experiment. In Fig. 1 the line of von Scheele has been added and in all figures the line for the total material has also been drawn. Fig. 1 indicates that the regression line for the total material and the lines for the four groups paralleled the line of von Scheele, but the levels were higher. Regarding the four groups, the slope of group III was
TA
BL
E 1
.--T
he r
elat
ions
hip
betw
een
spec
ific
gra
vity
and
dry
mat
ter
cont
ent
of p
otat
oes
grow
n on
L
ong
lsla
nd,
N.
Y,
".4
I. V
arie
ty t
rial
s 1969
19
70
1971
19
72
Tot
al
Spe
cifi
c gr
avit
y
Av.
R
ange
*
Reg
ress
ion
of
per
cen
tag
e dr
y m
atte
r %
dry
mat
ter
corr
. o
n s
peci
fic
grav
ity
coef
f In
terc
ept
Slo
pe
Av.
R
ange
* r
a sa
b
sb
122
1.0
66
7
1.04
72-1
.086
2 1
9.6
6
13.9
-25.
5 0.
915
-27
0.2
1
1.7
271
.7
I1.0
25
1
.06
27
1.
0475
-1.0
779
18
.64
1
4.2
-23
.1
0.94
4 -2
81
.4
21.8
28
2.4
20.5
53
1
.06
80
1.
0483
-1.0
877
18
.89
14
.2-2
3.6
0.93
8 -,
222.
1 1
2.4
225
.6
11.7
72
1
.07
07
1.
0541
-1.0
873
19
.01
15
.0.2
3.0
0.95
6 -2
29
.3
9.1
231.
9 8.
5
272
1.0
67
7
1.04
88-1
.086
6 1
9.2
5
14
.2-2
4.3
0
.88
1
-23
3.6
8.
3 23
6.8
7.8
0'3 ¢3
rn
ta-I
¢3
II.
Sto
rage
ex
per
imen
ts
1971
19
72
1973
Tot
al
142
1.0
69
8
1.05
92-1
.080
4 1
9.0
4
16.%
21.4
0.
820
-17
3.2
1
1.4
17
9.7
10.
6 14
4 1
.07
14
1.
0625
-1.0
803
20.1
7 18
.4-2
2.0
0.8
91
-1
73
.4
8.3
180.
7 7.
7 14
4 1
.07
55
1.
0623
-1.0
887
20.8
6 17
.3-2
4.5
0.81
6 -2
17
.2
14
.2 2
21
.3
13.2
430
1.0
72
2
1.06
02-1
.084
2 20
.03
17
.0-2
3.1
0
.84
1
-20
9.8
7.
2 21
4.4
6.7
~3
-]
Z
III,
Nit
rate
stu
dies
19
72
1973
19
74
Tot
al
112
1.0
64
9
1.05
8%1.
0711
17
.96
16.3
-19.
6 0.
750
-19
1.8
1
7.6
19
7.0
16
.6
153
1.0
54
5
1.03
82-1
.070
8 1
6.5
7
13
.0-2
0.2
0.
946
-20
3.1
6.
1 20
8.3
8.8
162
1.0
62
8
1.04
73-1
.078
3 1
7.7
8
14.0
-21.
6 0.
893
-21
5.6
9.
3 21
9.6
8.8
427
1.0
60
4
1.04
38-1
.077
0 1
7.3
9
13.%
20.9
0.
905
-18
5.6
4.
6 19
1.4
4.4
-]
rn
IV.
Var
iety
-fer
tili
ty
1974
14
0 1
.06
06
1.
0477
-1.0
735
16
.93
13
.6-2
0.3
0.9
02
-2
30
,9
10
.1 2
33.7
9.
5
Tot
al M
ater
ial
1269
1
.06
60
1.
0474
-1.0
846
18
.63
1
4,1
-23
.1
0.91
2 -2
17
.2
3.0
221.
2 2.
8
*Ran
ge:
Ave
rage
min
us t
wic
e th
e st
anda
rd d
evia
tion
to
aver
age
plus
tw
ice
the
stan
dard
dev
iati
on.
L~
116 AMERICAN POTATO JOURNAL (Wol. 53
significantly (P<O.OI) less than the slopes of the other three lines. All differences in level were highly significant.
~d,m.
?-,6
2 0
I,'1 /l-I
/ J / .6
t y . S " . /
I I i | I
1.05 1.06 1.07 LO8 LOg $oG>
FIG. I. Regression lines of percentage dry matter on specific gravity (l: Variety trials; 2: Storage experiments; 3: Nitrate studies; 4: Variety-fertility; 5: Total material; 6: von Scheele's line).
Differences Between Years An unbiased assessment of the year influence is not possible since in
many cases this influence was at least partly confounded with the cultivar influence. For instance, the cultivars included in the variety trials were different each year, and in the storage experiments Norchips were used in 1971, Katahdin in 1972 and these two plus two others in 1973. Still, the finding of significant differences between years would prove that the rela- tionship between specific gravity and dry matter content is not constant, regardless which of the influences predominates.

1976)
% d.m.
Z.S
ZO
J
SCHIPPERS: SPECIFIC GRAVITY AND DRY MATTER 117
J J
f
J
J
d
J
2S
20
i I i I 1 P i I I
1.05 1.06 1.07 1.08 1,06 1.06 1.07 1.08 1.09 $,G.
FIG. 2. Regression lines of percentage dry matter on specific gravity (a: Variety trials; b: Storage experiments; c: Nitrate studies; d: Variety-fertility; Broken lines: Total material).
I. Variety trials--The results of the 1971 trial were such that its regression line virtually coincided with the line for the total material (Fig. 2a. All differences in level between the various years were highly significant except the one between 1969 and 1970. Differences in slope were significant except those between 1969 and 1970 and between 1971 and 1972. Since the dry matter determinations were done much later than the specific gravity measurements in the 1970 samples, this may be an explanation for the steepness of the line, but this cannot be an explanation for the 1969 samples.
H. Storage experiments--The regression coefficient for 1973 was gre- ater (P<0.01) than the regression coefficients in both other years (Fig. 2b). The level of the line of 1971 was significantly (P<0.01) lower than the other lines. However, differences in both respects were small.
III. Nitrate studies. Differences in slope among the lines for the three years were nonsignificant, but all differences in level, although small, were highly significant (Fig. 2c).

118 AMERICAN POTATO JOURNAL (Vol. 53
Influences Within Years In some experiments the material was divided into smaller groups in
order to identify the influences at work. Results are shown in the form of regression lines only (Fig. 3 and 4).
I. Variety trials. In the trial of 1969 five subgroups were made: the observational trial shortly after harvest, the variety trial shortly after harvest, and the variety trial after storage at 5, 7.5 and 10°C. There were no differences in slope between any two of the subgroups of the variety trial, but there were significant differences in level between the observational trial and the other groups. The regression lines of the observational trial and the other groups combined are given in Fig. 3a. The correlation coefficients were 0.910 and 0.919, respectively.
In 1971 a distinction can be made between the regular variety trial (r= 0.953) and Norchip samples of various origins (r= 0.873). There was a
qb d.m.
s, S c
zo J . ' l " ~
is
d
J
J J
U
J J
I I k , t I i i
i . 06 1-06 LOT 1,08 L O g L 0 6 1,06 I.OT
i m
1,08 L09 S.G.
FIG. 3. Regression lines of percentage dry matter on specific gravity (a: Variety trial 1969, 1. regular variety trial, 2. observational trial; b: Variety trial 1971, 1. regular variety trial, 2. Norchips of various origins; c: Storage experiments 1972; 1. December, 2. January, 3. February, 4. March; d: Storage experiments 1973, 1. Hudson, 2. Katahdin, 3. Kennebec, 4. Russet Burbank; Broken lines; Total material).
1976) SCHIPPERS: SPECIFIC GRAVITY AND DRY MATTER 119
significant difference in slope but no difference in level between groups (Fig. 3b).
H. Storage experiments---Results of the eight sampling dates in 1971 were analyzed separately and in this very homogeneous material differ- ences in specific gravity and percentage dry matter were too small for high correlations to appear. When sampled after four weeks of storage, the correlation coefficient was only 0.633, and after eight weeks 0.690. At later dates the influence of the strongly varying storage conditions became visible in the spread in specific gravity of the material, and the correlation coefficient rose until it became stable at approximately 0.92 after 24 weeks of storage. There were no differences in slope between lines, but the level of the line in January (after twelve weeks of storage) was unexplainably at a much higher level than the others.
The four sampling dates of 1972 gave much greater differences. The line for December (first sampling date) had a regression coefficient which was greater (P<0.01) than the other three lines, and the levels for the February (r=0.813) and March (r=0.912) sampling dates were at a higher (P<0.01) level than the December (r=0.811) and January (r= 0.957) lines (Fig. 3c).
In 1973, when four varieties were stored for only one period, all differences in level were highly significant. The fact that these lines oc- cupied such varying levels greatly affected the overall regression coefficient of the experiment (Fig. 3d). While the regression coefficients for the four varieties separately varied from 156 to 178, the overall regression coefficient was 221. The data for Russet Burbank in particular, fell outside the swarm of dots. The correlation coefficients were 0.857 for Hudson, 0.758 for Katahdin, 0.652 for Kennebec and 0.837 for Russet Burbank.
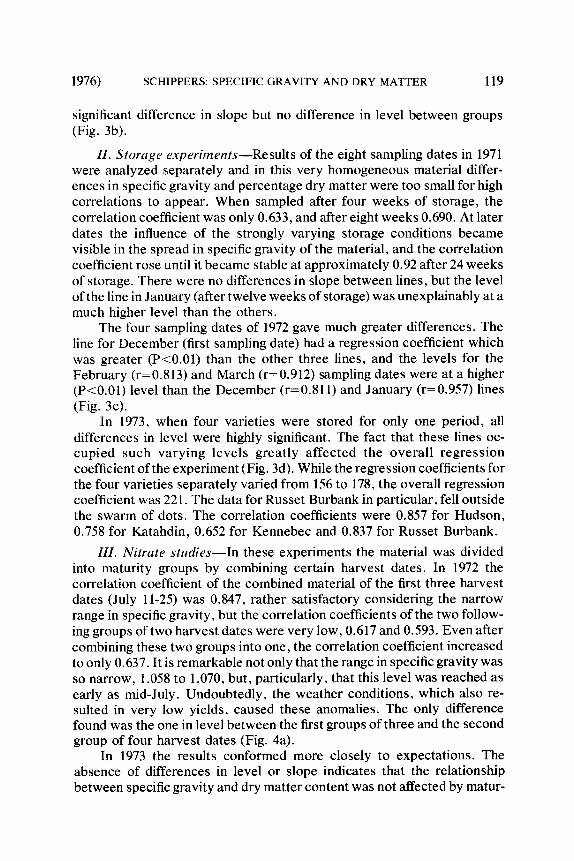
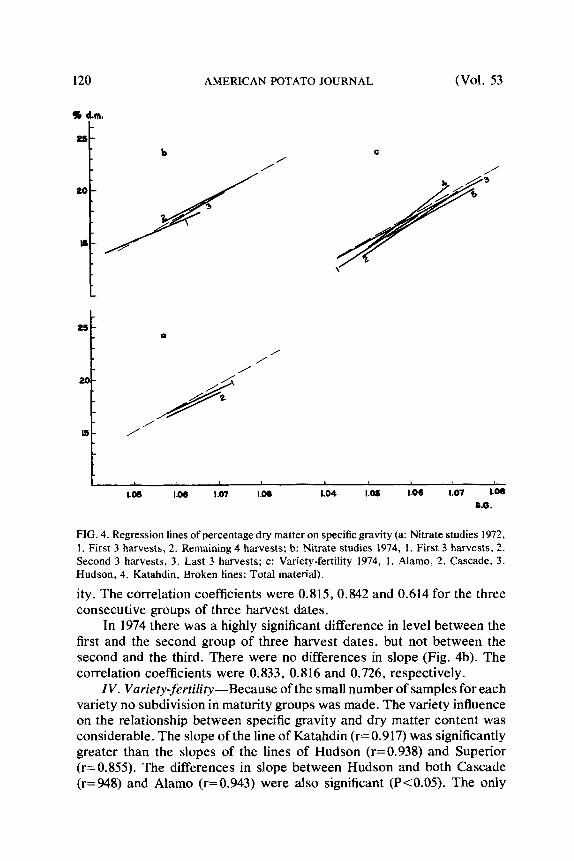
IlL Nitrate studies--In these experiments the material was divided into maturity groups by combining certain harvest dates. In 1972 the correlation coefficient of the combined material of the first three harvest dates (July 11-25) was 0.847, rather satisfactory considering the narrow range in specific gravity, but the correlation coefficients of the two follow- ing groups of two harvest dates were very low, 0.617 and 0.593. Even after combining these two groups into one, the correlation coefficient increased to only 0.637. It is remarkable not only that the range in specific gravity was so narrow, 1.058 to 1.070, but, particularly, that this level was reached as early as mid-July. Undoubtedly, the weather conditions, which also re- sulted in very low yields, caused these anomalies. The only difference found was the one in level between the first groups of three and the second group of four harvest dates (Fig. 4a).
In 1973 the results conformed more closely to expectations. The absence of differences in level or slope indicates that the relationship between specific gravity and dry matter content was not affected by matur-
120 AMERICAN POTATO JOURNAL (Vol. 53
~(p elm.
MS
ZO
J
J J J
f 26
20
J J
Q
f J
J J
1.06 LOe 1.07 1.08 i.04 LOIS 100 1.07 1.08 $.G.
FIG. 4. Regression lines of percentage dry matter on specific gravity (a: Nitrate studies 1972, 1. First 3 harvests, 2. Remaining 4 harvests; b: Nitrate studies 1974, 1. First 3 harvests, 2. Second 3 harvests, 3. Last 3 harvests; c: Variety-fertility 1974, 1. Alamo, 2. Cascade, 3. Hudson, 4. Katahdin, Broken lines: Total material).
ity. The correlation coefficients were 0.815, 0.842 and 0.614 for the three consecut ive groups of three harvest dates.
In 1974 there was a highly significant difference in level be tween the first and the second group of three harvest dates, but not be tween the second and the third. There were no differences in slope (Fig. 4b). The correlation coefficients were 0.833, 0.816 and 0.726, respectively.
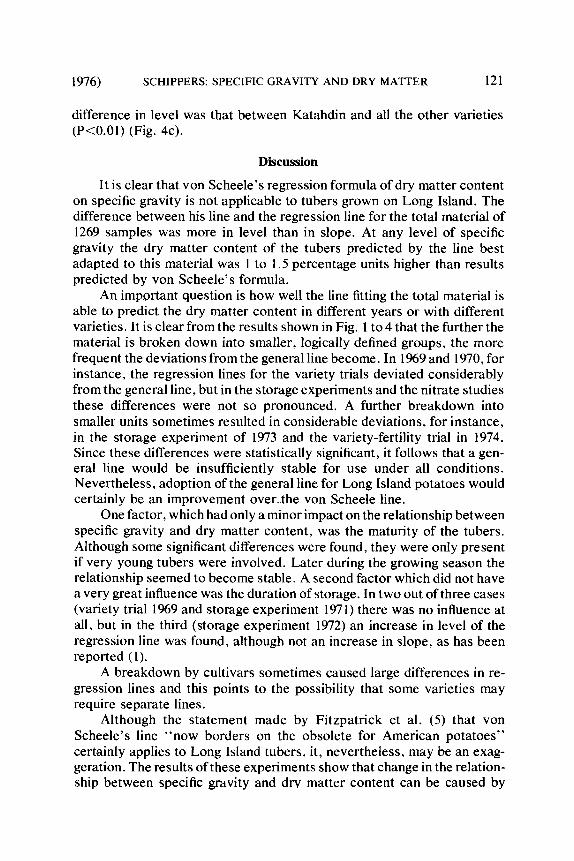
IV. Variety-fertility--Because of the small number of samples for each variety no subdivision in maturi ty groups was made. The variety influence on the relationship between specific gravity and dry mat ter content was considerable. The slope of the line of Katahdin (r= 0.917) was significantly greater than the slopes of the lines of Hudson (r=0.938) and Superior @=0.855). The differences in slope be tween Hudson and both Cascade (r=948) and Alamo (r=0.943) were also significant (P<0.05). The only
1976) SCHIPPERS: SPECIFIC GRAVITY AND DRY MATTER 121
difference in level was that between Katahdin and all the other varieties (P<0.01) (Fig. 4c).
Discussion
It is clear that von Scheele's regression formula of dry matter content on specific gravity is not applicable to tubers grown on Long Island. The difference between his line and the regression line for the total material of 1269 samples was more in level than in slope. At any level of specific gravity the dry matter content of the tubers predicted by the line best adapted to this material was 1 to 1.5 percentage units higher than results predicted by von Scheele's formula.
An important question is how well the line fitting the total material is able to predict the dry matter content in different years or with different varieties. It is clear from the results shown in Fig. 1 to 4 that the further the material is broken down into smaller, logically defined groups, the more frequent the deviations from the general line become. In 1969 and 1970, for instance, the regression lines for the variety trials deviated considerably from the general line, but in the storage experiments and the nitrate studies these differences were not so pronounced. A further breakdown into smaller units sometimes resulted in considerable deviations, for instance, in the storage experiment of 1973 and the variety-fertility trial in 1974. Since these differences were statistically significant, it follows that a gen- eral line would be insufficiently stable for use under all conditions. Nevertheless, adoption of the general line for Long Island potatoes would certainly be an improvement over..the von Scheele line.
One factor, which had only a minor impact on the relationship between specific gravity and dry matter content, was the maturity of the tubers. Although some significant differences were found, they were only present if very young tubers were involved. Later during the growing season the relationship seemed to become stable. A second factor which did not have a very great influence was the duration of storage. In two out of three cases (variety trial 1969 and storage experiment 1971) there was no influence at all, but in the third (storage experiment 1972) an increase in level of the regression line was found, although not an increase in slope, as has been reported (l).
A breakdown by cultivars sometimes caused large differences in re- gression lines and this points to the possibility that some varieties may require separate lines.
Although the statement made by Fitzpatrick et al. (5) that von Scheele's line "now borders on the obsolete for American potatoes" certainly applies to Long Island tubers, it, nevertheless, may be an exag- geration. The results of these experiments show that change in the relation- ship between specific gravity and dry matter content can be caused by

122 AMERICAN POTATO JOURNAL (Vo l . 53
various factors and that, under certain conditions, von Scheele's line still might be satisfactory. In fact, in some publications, particularly from Idaho, results have been reported which agree with von Scheele's line (15). In view of this, the hope expressed by Fitzpatrick et al. (5) that it should be possible to produce a regression curve with narrow confidence limits suitable for industrial use for all of the United States seems too optimistic. It seems more likely that regression formulas will have to be adapted to growing areas and possibly also to cultivars.
Literature Cited
1. Agle, W. M. and G. W. Woodbury. 1968. Specific gravity-dry matter relationship and reducing sugar changes affected by potato variety, production area and storage. Am. Potato J 45: 11%131.
2. Behrend, P., M. Maercker and A. Morgen. 1880. Ueber den Zusammenhang des spezifischen Gewichts mit dem Staerkemehl- und Trockensubstanzgehalt der Kartof- feln, sowie ueber die Methode der Staerkebestimmung in den Kartoffeln. Die Landw. Versuchs-Stationen 25: 107-165.
3. Burton, W. G. 1966. The potato; a survey of its history and of factors influencing its yield, nutritive value, quality and storage. 2nd ed., p. 188 ft. H. Veenman & Zonen N. V., Wageningen, Holland.
4. Dunn, L. E. and R. E. Nylund. 1945. The influence of fertilizers on the specific gravity of potatoes grown in Minnesota. Am, Potato J 39: 275-288.
5. Fitzpatrick, T. J., W. L. Porter and G, V. C. Houghland. 1969. Continued studies of the relationship of specific gravity to total solids of potatoes. Am Potato J 46: 120-127.
6. Hals, S. og Y Buchholz. 1909. Om bestemmelse av poteternes indhold av tc~rstof og stivelse ved Reimanns potetvegt. Tidsskrift for det norske Landbruk 16: 303-312.
7. Porter, W. L., T. J. Fitzpatrick and E. A. Talley. 1964. Studies of the relationship of specific gravity to total solids of potatoes. Am Potato J 41: 329-336.
8. Scheele, C. von~ G. Svensson and J. Rasmusson. 1936. Die Bestimmung des Staer- kegehalts and der Trockensubstanz der Kartoffel mit Hilfe des spezifischen Gewichts. Die Landw. Versuchs-Stationen 127:67-96.
9. Schippers, P. A, 1971. The influence of storage conditions on various properties of potatoes. Am Potato J 48: 234-245.
10. Smith, O. 1968. Potatoes: Production storing, processing, p. 499 ft. The Avi Publishing Company, Inc., Westport, Connecticut.
11. Snedecor, G. W. 1956. Statistical methods applied to experiments in agriculture and biology. 5th ed., p. 394 ff. Iowa State College Press, Ames, Iowa.
12. Talburt, W. F. and O. Smith. 1967. Potato processing, p. 262 if, 345 ft, 397 ff, 420 if, 480 ft. The AVI Publishing Company, Inc., Westport, Connecticut.
13. Tuorila, P. 1929. Untersuchungen ueber die chemische Zusammensetzung der Kartoffeln in Finnland. Suomen Suoviljelysyshdistys, Tieteellisia Julkaisuja 11:73 pp.
14. Vanasse, A., I. D. Jones and H. L. Lucas. 1951. Specific gravity-dry matter relationship in potatoes. Am Potato J 28: 781-791.
15. Woodbury, G. W. and W. W. Weinheimer. 1965. Specific gravity-solids correlations in Russet Burbank with respect to point of origin and storage history. Am Potato J 42: 98-104.