THE RELATIONSHIP BETWEEN RETIREMENT BENEFITS AUTHORITY...
69
THE RELATIONSHIP BETWEEN RETIREMENT BENEFITS AUTHORITY INVESTMENT GUIDELINES AND FINANCIAL PERFORMANCE OF PENSION SCHEMES IN KENYA PRESENTED BY FRANKLIN MWENDA MIRITI D63/64001/2011 A RESEARCH PROJECT SUBMITTED IN PARTIAL FULFILMENT OF THE REQUIREMENTS FOR THE AWARD OF THE DEGREE OF MASTER OF SCIENCE IN FINANCE, SCHOOL OF BUSINESS, UNIVERSITY OF NAIROBI. OCTOBER 2014
-
Upload
vuongquynh -
Category
Documents
-
view
214 -
download
0
Transcript of THE RELATIONSHIP BETWEEN RETIREMENT BENEFITS AUTHORITY...

THE RELATIONSHIP BETWEEN RETIREMENT BENEFITS
AUTHORITY INVESTMENT GUIDELINES AND FINANCIAL
PERFORMANCE OF PENSION SCHEMES IN KENYA
PRESENTED BY
FRANKLIN MWENDA MIRITI
D63/64001/2011
A RESEARCH PROJECT SUBMITTED IN PARTIAL FULFILMENT
OF THE REQUIREMENTS FOR THE AWARD OF THE DEGREE
OF MASTER OF SCIENCE IN FINANCE, SCHOOL OF BUSINESS,
UNIVERSITY OF NAIROBI.
OCTOBER 2014

ii
DECLARATION
This project is my original work and has not been submitted for a degree in any other
university.
Signed…………………………………. Date…………………………………………
Franklin Mwenda Miriti
D63/64001/2011
This research project has been submitted for examination with my approval as the
supervisor on behalf of School of Business, University of Nairobi.
Signed……………………………………. Date…………………………………………
Mr. Mirie Mwangi
Lecturer, Department of Finance and Accounting.
School of Business,
University of Nairobi.

iii
ACKNOWLEDGEMENT
I am greatly indebted to my supervisor Mr. Mirie Mwangi who guided me in fine tuning
the topic of my research, gave me guidance and encouragement throughout the project.
Your direction, assistance, witty and constructive criticism enabled me to give my very
best. I am truly grateful for your time, effort and patience throughout the course of this
project. I wish to thank the University of Nairobi, School of Business for designing and
availing such a relevant program. Much thought, effort and research must have gone into
the planning. I would like to thank all the lecturers who taught me; you surely have
impacted tremendous knowledge into me. Last but not least, I would like to thank God
for giving me the resources and ability to start and complete my studies.

iv
DEDICATION
I wish to dedicate this research project to my parents, Mr. and Mrs. Miriti and my
siblings Kimathi, Karimi and Sam for their support and encouragement. To aunt Flora
and my friends, thanks for always challenging me to do better.

v
TABLE OF CONTENTS
DECLARATION ................................................................................................................ ii
ACKNOWLEDGEMENT ................................................................................................. iii
DEDICATION ................................................................................................................... iv
TABLE OF CONTENTS .................................................................................................... v
LIST OF TABLES ........................................................................................................... viii
ABBREVIATIONS ........................................................................................................... ix
ABSTRACT ........................................................................................................................ x
CHAPTER ONE ............................................................................................................... 1
INTRODUCTION............................................................................................................. 1
1.1.1 Background of the Study ............................................................................... 1
1.1.2 Financial Performance of Pension Schemes .................................................. 1
1.1.3 Regulator‟s Investment Guidelines and Financial Performance .................... 3
1.1.4 Pension Industry in Kenya. .......................................................................... 11
1.2 Research Problem ....................................................................................................... 12
1.3 Objectives of the Study ............................................................................................... 15
1.4 Value of the Study ...................................................................................................... 15
CHAPTER TWO ............................................................................................................ 17
LITERATURE REVIEW .............................................................................................. 17
2.1 Introduction ................................................................................................................. 17
2.2 Theories Guiding the Study ........................................................................................ 17
2.2.1 The Theory of Economic Regulation ............................................................ 17
2.2.2 Modern Portfolio Theory .............................................................................. 20
2.2.3 Efficient Market Hypothesis ......................................................................... 22
2.4 Empirical Studies ........................................................................................................ 27
2.4.1 Empirical Studies in Kenya .......................................................................... 27
2.4.2 Empirical Studies in Other Countries. .......................................................... 30
2.5 Summary of Literature Review ................................................................................... 32

vi
CHAPTER THREE ........................................................................................................ 34
RESEARCH METHODOLOGY .................................................................................. 34
3.1 Introduction ................................................................................................................. 34
3.2 Research Design ......................................................................................................... 34
3.3 Population of the study ............................................................................................... 34
3.4 Sampling Technique ................................................................................................... 35
3.5 Data Collection ........................................................................................................... 35
3.6 Data Analysis and the Research Model ...................................................................... 35
3.7 Test of Statistical Significance ................................................................................... 37
CHAPTER FOUR ........................................................................................................... 38
DATA ANALYSIS, RESULTS AND DISCUSSION ................................................... 38
4.1 Introduction ............................................................................................................... 38
4.2 Descriptive Statistics ................................................................................................... 38
4.3 Inferential Analysis ..................................................................................................... 39
4.4 Correlation Results ..................................................................................................... 40
4.5 Regression Analysis .................................................................................................... 42
4.5.1 Model Summary ........................................................................................... 42
4.5.2 ANOVA ........................................................................................................ 43
4.5.3 Coefficients ................................................................................................... 44
4.6 Discussion of Research Findings ................................................................................ 45
CHAPTER FIVE ............................................................................................................ 47
SUMMARY, CONCLUSIONS AND RECOMMENDATIONS ................................ 47
5.1 Introduction ................................................................................................................. 47
5.2 Summary of Research Findings .................................................................................. 47
5.3 Conclusion .................................................................................................................. 48
5.4 Recommendations ....................................................................................................... 49
5.5 Limitations of the Study ............................................................................................. 50
5.6 Suggestions for Further Research ............................................................................... 51

vii
REFERENCES ................................................................................................................ 52
APPENDICES .................................................................................................................. xi
Appendix I: Table G ................................................................................................... xi
Appendix II: Sample Data ......................................................................................... xii
Appendix III: Residual Statistics .............................................................................. xiii

viii
LIST OF TABLES
Table 4.1: Descriptive Statistics and Distribution of Variables ........................................ 39
Table 4.2: Correlation Matrix ........................................................................................... 40
Table 4.3 Model summary ................................................................................................ 43
Table 4.4. Analysis of Variance (ANOVA) ...................................................................... 43
Table 4.5: Coefficients ...................................................................................................... 44

ix
ABBREVIATIONS
ALM - Asset and Liability Management
CEE - Central and Eastern Europe
EMH - Efficient Market Hypothesis
MPT - Modern Portfolio Theory
OECD - Organisation for Economic Co-operation and Development
PF - Pension Fund
RBA - Retirement Benefits Authority
RBS - Retirement Benefits Scheme
SR - Sharpe Ratio
WB - World Bank
x
ABSTRACT
Data used in the study was for the period 2003 to 2009. The Retirement Benefit Authority
investment guidelines which became effective in 2001 classifies investment assets as
cash and demand deposits in institutions licensed under the Banking Act in the republic
of Kenya, fixed deposits and time deposits in institutions also licensed under the same
Act, commercial paper and corporate bonds, government securities, preference and
ordinary shares of quoted companies in East Africa, immovable properties and units in
property Unit Trust Schemes incorporated in Kenya ,guaranteed funds, offshore
investments in bank deposits, government securities and rated corporate bonds and
investment in any other approved investments that should not exceed five percent . These
guidelines stipulate the maximum in percentage terms that provident pension funds
should invest in each of the specified assets. Though investment guidelines became
effective from 2001, provident funds did not manage to adjust their investment portfolios
due to various technicalities which included appointment of fund managers, custodians,
trustees and an actuary. The study findings reveal that the different asset classes have
varying effects on investment incomes of pension funds and ultimately on the overall
financial performance of the pension funds. Therefore, fund managers should be selective
in the RBA asset in which they invest while at the same time ensuring diversification of
their investment portfolios. With the application of RBA guidelines, pension schemes
have experienced reduced risk and reduction of variability in returns from year to year, an
indication of more stable earnings.

1
CHAPTER ONE
INTRODUCTION
1.1.1 Background of the Study
Mutua (2003) defines a Retirement Benefits Scheme, also known as a Pension Plan, as
any scheme or arrangement, whether established by a written law for the time being
under force or by any other instrument, under which a person is entitled to benefits in the
form of payments, determined by age, length of service, amount of earnings or otherwise
and payable primarily upon retirement, death, termination of service or upon the
occurrence of any other event as may be specified in such written law or any other
instrument. Brigham and Gapenski, 1995 p.961 as quoted in Wanyama (2001) state that
most companies and practically all government departments have some type of employee
pension plan. As an investment vehicle, it seeks to provide individuals with a sufficient
and consistent source of income after retirement when they are no longer earning a
regular income from employment. A Pension Fund, therefore, is the pool of assets
purchased using the contributions of its members with the aim of financing their
retirement benefits.
1.1.2 Financial Performance of Pension Schemes
According to Hlavac (2011), recent reform actions triggered mainly by the World Bank
(1994) report move us into the situation in which a significant part of the future pension

2
provisions are becoming directly dependent on the future discounted yields that are to be
delivered by these assets. However, the increased linkage between the levels of future
pensions and the performance of invested assets leads the participants into the situation
when part of their retirement income will be subject to the market uncertainties connected
with the investment process.
Its potential consequences can be well documented on the recent financial crisis. To back
up the last statement with numbers, according to the estimates of Antolin and Stewart
(2009), the financial losses of Organisation for Economic Co-operation and Development
pension funds in 2008 topped up to $3.5 trillion or to about 20% of its total asset value in
relative terms. The OECD (2010) states that around $1.5 trillion have been already
regained in 2009; but still, the investment losses experienced in 2008 have not yet been
fully recovered by most of the OECD countries.
Rudolph (2010) asserts that the development of performance measurement framework
specific to the pension funds industry is a relatively new topic in the academic literature.
In fact, the impulse for the development of industrial specific evaluation framework
tracks back to Campbell and Viceira (2002). In their work they emphasized the objective
of the pension industry which is to ensure an adequate retirement income to future
pensioners, and which is thus naturally different from the other forms of collective
investment that are primarily concerned with the short-term asset maximization. Different
objectives then define a different timeframe over which the performance should be

3
tracked, and which are also associated with the different levels of risk tolerance. Their
work started to change the way researchers think about the portfolio and investment
characteristics of pensions. Since then, a vast amount of academic research has been
targeted to the development of optimal asset-allocation strategies incorporating
fundamentals of life-cycle savings and management of risk.
Hlavac (2011) continues to state that inspite of the different objectives of pension
industry and other forms of collective investment, the typical approaches used to measure
the PFs performance have been so far mostly identical to the ones applied to other types
of investment opportunities. Possibly, due to the relatively short time period for the
implementation of new theoretical findings, most of the empirical research in the area of
evaluation of pension funds‟ performance mostly focused on the aspect whether the
scheme delivered a reasonable rate of return over some observation period. Naturally, this
approach does not necessarily represent the above mentioned objectives of the funded
pension schemes. This means that to compare the monthly or annual returns may not be
totally meaningful, unless measured against a specific (set of) benchmark(s) that comply
with the above mentioned objectives.
1.1.3 Regulator’s Investment Guidelines and Financial Performance
Chirchir (2007) argues that there are two broad reasons why governments establish
regulations of the pension funds industry. One is consumer protection i.e. to provide a
framework of rules that can help prevent the excesses and failures of a market if entirely

4
left on its own devices. The other reason is maintenance of stability in the pensions
industry i.e. pension funds are a public good that justifies a more elaborate framework of
regulation and supervision.
Fixing quantitative restrictions on investments is a global phenomenon as is evidenced by
the many countries that have established regulations governing investment of pension
funds. Quantitative regulations of investment funds take various forms. It could be
restriction on industry structure where specific institutions can carry out the fund
management business. For example, the Chilean pension reform established a new
pension fund management industry. It could also be regulation of fund performance. In
this case pension funds must guarantee an absolute return on investment. The returns are
chosen based on the industry‟s average performance. This is the case in Germany and
Chile. Lastly, it could be through regulations that impose limits on the share of
investment assets held by pension plans. Typically these consist of setting ceilings
(maximum) or floors (minimums) on the fund that can be invested in given assets. Floors
are less frequent, Chirchir (2007).
Different countries have adopted different degrees of pension regulations. Many
countries start off with stringent regulations but relax over time as the industry matures.
Srinivas and Yermo (1999) cite Chile as an example. After 18 years of excessive
regulations on investment of pension funds, Chile is continuously revoking and relaxing
some of the quantitative restrictions on investment of pension funds. A pension fund

5
there can invest a maximum 40% in equities, 20% in commercial paper, 50% in
government securities, 5 % self-investments and 12% in foreign investments. In
Argentina 98% of pension funds must be invested in Argentinean investments. South
Africa pension funds must be invested within allowable limits as directed in the Pension
Fund Act 1956, section 19and Regulation 28. US pension sector, the largest and most
established in the world has no set regulations on investments of pension funds. It is a
fully liberalised sector wholly reliant on the “prudent man rule” of investments after a
undergoing through a period of restricted investments. United Kingdom (UK) regulates
all the aspects of pension administration save investments, which remains unregulated.
They too follow the principle of prudent man rule after a time of restricted investments.
The retirement benefits Act devotes several sections in the Retirement Benefits Act and
Retirement Benefits Regulation that provides directives or guidelines on investment of
pension funds. These are contained in the Retirement Benefits Act 1997, sections 38 (1)
(b), 39 and 40, Regulation 31 (1) of the retirement benefits (Individual Retirement
Benefits Schemes) regulations 2000 and regulation 38 (1) of the Retirement Benefits
(Occupational Retirement Benefits Schemes) Regulations 2000. Section 38 makes
distinct restriction on the use of funds. Scheme funds cannot be used to make direct or
indirect loans or invested in a bank, non-banking financial institutions, insurance
company, or building society with a view to securing a loan. The Act bars direct loaning
of scheme funds to any person or the use of scheme fund as loan collateral apart from

6
housing. This changed in 2008 following the passing of the Finance Bill to allow
members to utilize their accumulated retirement benefits savings for acquiring mortgages.
Section (17-20) deals with the revised trust deed and rules and provides that RBS must
amend and revise their trust deeds as per the guidelines specified in the quoted sections of
the Act. The trust deed and rules is the constitution of the scheme and it sets out the name
of the sponsor, trustees and their duties and powers. The rules are the operational details
of the RBS and they set out eligibility to membership benefits, contributions, persons
eligible for receiving benefits, conditions of eligibility to benefits, and how disputes can
be resolved.
Section 37 requires all schemes to have a prudent investment policy. This is the
investment management agreement section of the regulations, Mutua (2003). Regulation
37 of the retirement benefits (occupational retirement benefits schemes) Regulations
2000 stipulates the requirements for preparation of the investment policy, which must be
prepared under the advice of a professional investment advisor and submitted to the
Authority. The statement of the schemes‟ investment policy is expected to be revised and
updated every three years. Legal notice No. 61 of 2006 made it mandatory for scheme
trustees to submit their written investment policy to the RBA every three years. It
requires that scheme trustees must appoint a fund manager who must be registered with
RBA. A duly signed contractual fund management agreement should be submitted to
RBA. Fund managers are expected to; advise the trustees on available investment
7
vehicles and expected risks and returns for each vehicle, make tactical asset allocation
decisions based on the strategic asset allocation contained in the investment policy,
undertake research at company, sector and country levels, to manage the portfolio so as to
ensure liquidity is available to meet the retirement benefits schemes needs, to provide
periodic reports to the trustees and the RBA on holdings and transactions and to provide
the RBA with any information that may jeopardize members and sponsors benefits.
The investment regulations in Kenya require that unless a scheme opts to invest in
guaranteed fund or pooled fund, investments of scheme funds should be guided by the
stipulated percentage limits. These limits are stipulated in Regulation 38 and Table G of
the Retirement Benefits Regulations. These investment guidelines provide maximum
limits only and do not require schemes to invest in a particular class of assets i.e. the
investment provisions act as guidelines and the Authority does not specify the assets in
which scheme should investment. It is left to the scheme to entirely select the assets they
deem best suitable to give the best optimal return in accordance to the scheme‟s
fundamentals. However, such limits can be exceeded under special cases which are
beyond the control of the scheme that include increase in market price of assets, bonus
issues and transfer of investment from one class of asset to another. The duration of time
that schemes can hold investments above the required ceilings is limited to ninety days.
Schemes must rebalance their investments within the ninety days.
8
Legal notice No. 96 of 2007 amended the investment guidelines to allow investment in
Ugandan and Tanzanian equities as domestic equities. It also allowed schemes to invest
in non-listed bonds and other instruments issued by private companies provided that the
bond/instrument had been rated by a credit rating agency registered by the Capital
Markets Authority. Mutuku (2007) submits that offshore investments are limited to bank
deposits, government securities, quoted equities, rated corporate bonds and offshore
collective investment schemes reflecting these assets. Further, investment in “any other
asset” category requires prior approval of the RBA following application by the scheme.
Custodial agreement (section 10) provides that scheme trustees must appoint a custodian
who must be registered with the RBA and that a duly signed contractual agreement
should be submitted to RBA. Custodians provide safe custody of securities, financial
instruments and documents of title to assets. They are required to settle all transactions in
accordance with the instructions received from the manager, receive and credit RBS
accounts with dividend, interest and other income due to them, and provide accurate and
timely reports to trustees and the RBA on holdings and transactions as they relate to the
various schemes.
Section 28(I) deals with annual audited accounts and provides that a scheme must keep
proper books of account and records and prepare annual audited statements in the
prescribed format. Section 31 provides for actuarial valuation and states that trustees
must submit an Actuarial valuation/review/certificate to the RBA. The actuarial report

9
determines the solvency of a RBS given According to this section, Actuaries are expected
to provide advice on the schedule of contributions, pension formula, benefits to be paid
out whenever a member leaves and approve the design of new schemes.
Chirchir (2007) argues that adherence to regulator‟s investment policies is expected to
lead to improved financial performance in the following ways. First, it reduces conflict of
interests arising between the fund sponsors and the ultimate beneficiaries of the fund.
Impositions of limits on self-investments protect the scheme from undue exposure and
bankruptcy of the sponsors. The larger the pension funds than the sponsor‟s fund the
more vulnerable the scheme to interference. Recent phenomenon experienced in the
recent past illustrates the need for quantitative restrictions on investment of pension
funds. Studebaker Corporation scandal, Maxwell Scandal and the more recent Enron
debacle led to loss of pension funds. In the three cases, employers (sponsors) secretly
diverted pension funds to bail themselves out of falling profits. Unfortunately, they
collapsed inflicting double tragedy to the employees –loss of their jobs and their life time
savings.
The collapse of Enron has resulted in a public debate regarding the rationale behind
investing in company‟s own stock. The Enron-case showed that employees carry the risk
of these investments. Meulbroek (2002) studied company stock investments in defined
contribution pension plans. Some of her ideas can be applied to defined benefit plans as
well. Meulbroek states that investing in the sponsor‟s stock is inefficient for all
10
stakeholders, because the pension fund carries a firm-specific risk, which could be
diversified away. Also Even and Macpherson, (2004) state that investing pension assets
in a single stock (i.e. sponsor) is contrary to basic diversification and therefore, a pension
fund that holds sponsor‟s stock can provide the same rate of return as diversified portfolio
but it is increasing the risk borne by its members. Pension funds, therefore, require a set
of internal statutes and external regulations to ensure that they are managed in the best
interest of beneficiaries. Pension funds, therefore, require a set of internal statutes and
external regulations to ensure that they are managed in the best interest of beneficiaries.
Secondly, these regulations help in fixing problems in the pension industry. Stringent
regulations are sometimes required to fix problems in a sector that is chaotic, non-
performing and where stakeholders have lost faith and confidence in. Once order and
direction is restored, the rules can be relaxed. For example, according to the Journal of
pension economics as quoted in Chirchir (2007), the pension reform in Chile was
implemented with excessive regulation in an effort to redeem the industry that was
plagued with under funding. Eighteen years after, much success measured by labor force
participation, pension fund assets, and benefits growth has been realised. Today, more
than 95 percent of Chilean workers have their own pension savings accounts; assets have
grown to over $34 billion, or about 42 percent of gross domestic product. Now that the
system has matured, beneficiaries understand their pension obligation and rights and fund
managers are experienced, Chile is contemplating relaxing the pension regulations.
11
Thirdly, lack of experience and expertise on investment in particular of managing risks,
leads to poor portfolio decisions and therefore, quantitative restrictions tend to act as
guidance until experience is gained, (Chirchir 2007). Trustees may have had little or no
contact with the financial services and providers; and may also not be knowledgeable and
aware of their investments mandate. They may thus engage in investments strategies that
are not in the interest of the fund. Fund managers too may lack the expertise to engage in
diversification strategies by themselves.
1.1.4 Pension Industry in Kenya
In Kenya, the pension industry is regulated by the Retirement Benefits Authority, a body
established by an Act of Parliament. According to Chirchir (2007), until 1997, the
pension industry in Kenya was by and large unregulated. The few regulations relevant to
retirement benefits were in the Income Tax Act and the Trustees Act governing the
industry. There were no specific regulations on investments, other than that exempting all
those schemes registered with income tax from the withholding tax imposed on
investment income.
In 1997, the government enacted the Retirement Benefits Act and in 2000, approved the
Retirement Benefits Regulation as new legislations to govern the entire management and
administration of the pension industry. The industry regulations were gazetted to come
into effect in October 2001.It is through this Act that investment guidelines of pension
funds were drawn and subsequently came into force. By and large, the RBA Act was

12
enacted with five major objectives. Firstly, to regulate & supervise the management of
retirement benefits schemes. Secondly, to protect the interests of members and sponsors
of pension schemes. Thirdly, to promote the development of the retirement benefit sector,
fourthly to advise the Minister on the national policy and to implement Government
policies and fifthly to perform such other functions as are conferred by the Act (Kiptanui,
2003).
It‟s expected that pension schemes that comply with RBA investment guidelines will
benefit from better financial performance in form of high share dividends, interests on
debentures and bank loans and more shares in companies which are quoted at the Stock
Exchange as well as benefit from diversification.
1.2 Research Problem
Prior to the introduction of the Retirement Benefits Act, Pension funds were not
prudently invested, Chirchir (2007). For example, funds were invested in a
disproportionate portfolio mix of assets which were unprofessionally selected. Thus there
was little diversification leading to exposure of schemes. Trustees did not have the
necessary know how of selecting assets. This meant that members were denied growth of
their funds as the schemes did not attain optimal returns on their investments. It also
further meant that that value of funds was not preserved. It became apparent that
government‟s intervention was needed.
13
Since the inception of RBA, pension schemes have either restructured their investment
portfolio or re-assessed their investment returns to be compliant with the Act. The Act
required the pension schemes to meet various mandatory requirements aimed at ensuring
high and secure retirement incomes for the members, Rono, Bitok and Asamoah (2010).
Investment guidelines in the rules sought to ensure that schemes diversified their risk by
reducing the extreme reliance on real estate investments. This was done by the
establishment of guidelines on the maximum proportions of the scheme funds that were
to be invested as prescribed in regulation 38. Specifically a limit of 30% on immovable
property was set. Most scheme stakeholders consider the limits an important introduction
by the regulatory authority since many schemes had earlier concentrated on the
acquisition of real estate at prices that were far too high and therefore without the
possibility of making returns for the scheme members.
However, according to the Institute of Economic Affairs, considering the issue of the
investment guidelines and the limits that it places on instruments, some consider that
those limits were set too conservatively. Their problems with the guidelines relate to the
limits set for other instruments such as corporate debt in Kenya. In prescribing the
maximum that a scheme may devote to corporate bonds at 15%, these stakeholders feel
that the regulations may constrain the development of capital markets on corporate
bonds. Many feel that the regulations should have allowed for a far higher limit to enable

14
schemes to take advantage of this underdeveloped market. This study will seek to
establish whether this limitation has affected pension schemes negatively or positively.
Asset allocation is a key determinant of returns for pension schemes. In the UK Blake,
Lehmann, and Timmermann, (1999) examined the asset allocations of a sample of 364
UK occupational pension funds who retained the same fund manager over the period
1986-1994. They found that the total return was dominated by asset allocation.
Kenyan studies on pension funds performance include Mutua (2003) who studied the
extent of compliance with the retirement benefits Act by retirement benefits schemes in
Kenya. The objectives of her study included finding out the extent of compliance,
identifying difficulties faced by schemes that had not fully complied and finding out the
relationship between the extent of compliance with all the Retirement Benefits Act
requirements and the financial performance of pension schemes. Financial performance
in the study was measured by the changes in fund values. Thus the study differs from the
current one in the measurement of the compliance variable. Since the schemes have
ninety days to rebalance their portfolios where they are out of line, it will be assumed that
all funds were compliant and the research will compare changes in fund values before
and after implementation of the investment guidelines.
The study, therefore, seeks to fill the knowledge gap on the effect of the investment
guidelines on financial performance in the Kenyan pension industry. In particular, the
15
study is in furtherance to the suggestion by Mutua (2003) for further research to establish
the impact of investment guidelines table on the financial performance of RBS. The
question is: what is the relationship between the investment guidelines and financial
performance of RBS?
1.3 Objectives of the Study
The objectives of the study are to establish the relationship between adherence to
retirement benefits authority investment guidelines and financial performance of pension
schemes in Kenya.
1.4 Value of the Study
The study is expected to provide useful insights to various categories of stakeholders. The
RBA and the government in general would be interested to know whether the regulations
they have put in place have achieved the desired objectives. This is important given that
pension systems and retirement benefits schemes are necessary for developing countries
like Kenya not only to secure people‟s livelihoods after retirement, but also due to the
fact that retirement schemes provide an avenue for mobilizing savings for long-term
investments. This has led to increased prominence for the pension and retirement benefits
industry since it serves the economy variously. This is by ensuring that individuals have
savings that may be used to sustain their standards of living after retirement and in the
process providing funds for development. The government would thus be interested in
knowing how well the sector is doing financially as this has implications on the overall

16
performance of the economy. Furthermore, RBA and the government would be interested
to know if the findings of the study justify the efforts and the resources put into
regulating the sector.
The data and information availed by the study could be of significance to academicians
and professional service providers i.e. people and firms that provide advisory and
consultancy services to RBS and the RBA. This study may enable them to conduct
further research.
17
CHAPTER TWO
LITERATURE REVIEW
2.1 Introduction
This chapter will review some of the risk-adjusted performance measures and an
accounting ratio that is used in some OECD countries to measure financial performance
of pension schemes. Theories that are expected to guide the study will also be reviewed.
A review of the general regulatory framework surrounding pension schemes in Kenya
will be done with emphasis on the investment guidelines for pension schemes as
specified by the Retirement Benefits Act. Finally, empirical studies, both from Kenya and
other countries will be reviewed.
2.2 Theories Guiding the Study
2.2.1 The Theory of Economic Regulation
The theory of economic regulation was proposed by George Stigler in 1971. Stigler
(1971) observed that the government, with its machinery and power, was a potential
resource or threat to every industry in the society. The most important element of the
theory of economic regulation is its integration of the analysis of political behavior with
the larger body of economic analysis, Peltzman (1976). This means that interest groups
can influence the outcome of regulatory processes by providing financial or other support
to politicians. The central task of the theory, as propagated by Stigler, is to explain who
will receive the benefits or burdens of regulation, what form regulation will take and the

18
effects of regulation upon the allocation of resources. According to Stigler, there are two
views of regulation that are widely held. First view is that regulations are instituted
mainly to ensure protection and benefit of the public at large or a significant subclass of
the public. Second view is that the political process defies rational explanation and that
there are regulations that have a negative impact on the regulated industry.
The theory of regulation proposes four benefits that the state or the government can
provide to an industry. The first benefit is a direct subsidy of money. However, an
industry with power to obtain government favors will not usually use this power to get a
direct subsidy of money. This is because unless the list of beneficiaries can be limited by
an acceptable device, whatever amount of subsidy the industry can obtain will be shared
among a growing number of rivals.
The second benefit the state can provide is control over entry by new rivals. There is
considerable discussion in economic literature of the rise of peculiar price policies,
vertical integration and similar devices to retard the rate of entry of new firms into
oligopolistic industries. The general hypothesis given by the economists was that every
industry or occupation that has enough political power would seek for control of entry.
The third benefit is the ability to affect substitutes and complementary products. An
industry will seek to suppress the production of substitute products but seek to promote
the production of goods that are complimentary to its own products. The fourth benefit

19
that an industry would seek to derive is the ability to fix prices. Even the industry that has
put in place barriers to entry will often want price controls administered by a body with
coercive powers. If the number of firms in the regulated industry is even moderately
large, price discrimination will be difficult to maintain in the absence of public support.
Where there are no diseconomies of scale for the individual firm, price control is
essential to achieve more than competitive rates of return.
However, these various political benefits are not obtained by the industry in a pure profit
maximizing form. The regulation theory further notes that the political process erects
certain limitations upon the exercise of cartel policies by an industry. First, the
distribution of control of the industry among the firms in the industry is changed. In an
unregulated industry, each firm‟s influence upon price and output is proportional to its
share of industry output. Political decisions take account of the political strength of the
various firms, so small firms have a larger influence than they would have in an
unregulated industry. The second limitation is that procedural safeguards required of
public processes are costly. The delays, which are dictated by both law and bureaucratic
thoughts of self-preservation, can be large. Finally, the political process automatically
admits powerful outsiders to the industry‟s council. In conclusion, Stigler emphasizes
that these limitations upon political benefits are predictable and they must enter into the
calculus of the profitability of regulation of an industry.

20
Posner (1974) defines economic regulation as government intervention in the market. He
refers to economic regulation as taxes and subsidies of all sorts as well as explicit
legislative and administrative controls over rates, entry, and other facets of economic
activity. Two main theories of economic regulation have been proposed. One is the
„public interest‟ theory. It holds that regulation is supplied in response to the demand of
the public for the correction of inefficient or inequitable market practices. The second
theory is the „capture‟ theory. This theory states that regulation is supplied in response to
the demands of interest groups struggling among themselves to maximize the incomes of
their members.
According to Posner, two assumptions seem to have typified thought about economic
policy. One is that economic markets were extremely fragile and apt to operate
inefficiently if left alone and the other was that government regulation was virtually
costless. However, if this theory was correct, we would find regulation imposed mainly in
highly concentrated industries (where the danger of monopoly is greatest) and in
industries that generate substantial external costs or benefits, which is not the case.
2.2.2 Modern Portfolio Theory
MPT is an overall investment strategy that seeks to construct an optimal portfolio by
considering the relationship between risk and return (Correia et al., 2003). This theory is
“…generally perceived as a body of models that describes how investors may balance
risk and reward in constructing investment portfolios.” (Holton, 2004: p. 21) as quoted in
21
Wang (2008). MPT is otherwise known as portfolio management theory (Reilly,
1989).The main indicators used in MPT are the alpha and the beta of investment (Hobbs,
2001). Beta is a measurement of volatility of an asset or a portfolio relative to a selected
benchmark, usually a market index. A beta of 1.0 indicates that the magnitude and
direction of movements of returns for an asset or a portfolio are the same as those of the
benchmark. A beta value greater than 1.0 indicates a higher volatility, and a beta value
less than 1.0 indicates a lesser volatility when measured against the benchmark (Yao et
al., 2002). Alpha calculates the difference between what the portfolio actually earned and
what it was expected to earn given its level of systematic risk, beta value. A positive
alpha indicates return of the asset or the portfolio exceeds the general market expectation.
A negative alpha indicates return of the asset or the portfolio falls short of the general
market expectation (Yao et al., 2002).
According to Wang (2008), although the growth of MPT has been both normative and
theoretical, there are some general issues associated with MPT (Compass Financial
Planner Pty Ltd., 2007). One, volatility is a measure of risk in a historical period. One
relies heavily on historical data when attempting to predict the future. It can also be
understood as a measure of uncertainty that quantifies how much a series of investment
returns varies around its mean or average. Volatility is represented by standard deviation
(Yao et al., 2002). 2) Second, one should not put too much faith in an “efficient” portfolio
performing well if world markets become unstable for a little while (Harvey et al, 2000).
A study done by Merrill Lynch in 1979 showed that a typical diversified investment

22
portfolio eliminates so much of the specific risk, that roughly 90 percent of all the
portfolio risk is market risk, therefore if market is unstable, an investor should not be
disappointed if the portfolio is not performing (Derby Financial Group, 2008).
Further to the issues that are associated with MPT, the implementations of this theory
have also been limited. The three major reasons for the limited implementation of MPT
are (Elton et al., 1976: p. 1341) the difficulty in estimating and identifying the type of
data necessary for correlation matrices, the time and expenses needed for generating
efficient portfolios i.e. the costs associated with solving a quadratic programming
problem (the input data requirements are voluminous for portfolios of a practical size
(Renwick, 1969)) and finally the difficulty in educating portfolio managers to express the
risk-return trade-off in terms of co-variances, returns and standard deviations (Renwick,
1969).
2.2.3 Efficient Market Hypothesis
This hypothesis is relevant to the study in relation to how the investment portfolios of
investment schemes are managed. The results of the study will help understand whether
these investments should be regulated or whether investment managers were more
efficient before the guidelines came into effect. An efficient market is assumed for the
concept of passive management approach (Hobbs, 2001). The “Efficient market
hypothesis (EMH) is the set of arguments leading to the assertion that market prices fully
23
reflect available information.” (Tucker et al., 1994: p.580) as quoted in Wang (2008).
EMH is a set of implications that are associated with each different form of the market.
There are three forms of the EMH. One is the weak form which assumes that current
security prices fully reflect all security market information, including the historical
sequence of prices, price changes, trading volume and any other market information such
as odd lot transactions (Reilly, 1989). Therefore, technical analysis is of no use when
attempting to outperform the market; it is merely an approach that is used in the hope of
predicting future trends (Hobbs, 2001). Yet, this form of the EMH suggests that future
security prices cannot be predicted by the use of historical prices, this means that future
cannot be predicted by using historical data, that further suggests that whatever happened
in the past is unlikely to happen in the future, thus stock prices behave according to a
random walk (Malkiel, 1999).
The second form of EMH is the semi-strong one which asserts that security prices adjust
rapidly to the release of all new public information; thus security prices fully reflect all
public information (Cuthbertson et al., 2004). Thus, fundamental analysis is of no use in
outperforming the market, instead it is used in the hope of identifying new information
(Correria et al., 2003).

24
Finally, the strong-form of the EMH contends that security prices fully reflect all
information, whether it might be public or private (Reilly, 1989). In other words, not even
insider information can be used in the quest to outperform the market.
2.3 Determinants of Financial Performance of Pension Schemes
Investment returns is one of several factors that will determine the performance of
pension funds to provide retirement income to their members and ability to deliver
adequate future pension. Prudent investment demands a diversified portfolio which often
includes a mix of equity investments, fixed-income securities (corporate or government)
and cash deposits. Therefore, asset allocation will influence the investment returns. There
may be differences in assets allocation for the different types of schemes and these can be
partly explained in defined benefit occupational plans by the liability structure, whereas
in defined contribution personal plans the differences are justified mainly by the
investment regulations in each country, Tapia (2008). Adherence to government
quantitative restrictions especially in countries that do not have well developed capital
markets, enough expertise to handle complex investments and a population that has
investment experience who can audit fund managers is expected to increase investment
returns. For instance, restrictions in foreign denominated assets are geared towards
limiting losses in the wake of global financial turmoil in international financial markets.
Administrative costs and investment management fees that need to be paid for scheme
running are another determinant of financial performance. Administrative costs are

25
important, with very different costs for different types of scheme. According to Barr
(2006), the First Report of the Pensions Commission shows that individual accounts tend
to have higher charges and occupational schemes lower charges and that state schemes
are generally the cheapest to run. The unweighted mean annual management charge for
personal pensions in the UK is about 1 per cent of a person‟s pension accumulation.
Under plausible assumptions, a charge of 1 per cent over a working life will reduce the
accumulation by about 20 per cent (Diamond, 2004, p.3) as quoted in (Barr 2006), that is,
a person‟s pension will be 20 per cent lower than otherwise for each 1 per cent of
administrative charge. Clearly, a major issue for policy makers is the way in which
pensions generally, and charges in particular, are regulated, a central issue in Nugée and
Persaud (2006), as quoted in Barr (2006).
Various countries have designed a variety of mechanisms to reduce costs, including the
imposition of caps on fees (Central and Eastern European countries), centralization of
collections and the use of blind accounts (Latvia and Sweden), lotteries that allocate new
contributors among funds (Chile and Poland), and paperless transactions in Estonia
(Hlavac 2011). Collective pension arrangements established by employers and employee
associations can also be an effective way to keep costs low, especially when the funds
established achieve sufficient scale e.g. as in Netherlands, Denmark, and Iceland.
Density of contributions is also an important factor that has affected the pension benefits
in countries with large informal sectors. This is the extent to which people make regular
26
contributions, Barr (2006). According to Arenas (2005) as quoted in Hlavac (2011), the
density of contributions in Latin American countries is only about 50 percent. Individuals
with a low density of contributions are likely to face low accumulated assets at retirement
age, and therefore are likely to have low retirement incomes. Arenas and Lago (2006)
report an average deficit in Chile of between 1981 and 2004 of 5.7% of GDP, projected
to continue at about 5% of GDP for the period 2005-2010. The deficit is caused by the
fiscal cost of transition; and that cost is increased because policy makers over-estimated
contribution density and hence underestimated the costs of the pension guarantee and the
social assistance pension. Similar problems arise in other countries for similar reasons.
The retirement age is also an important factor that affects the performance of pension
funds. Because the accumulation period is shorter in countries that allow individuals to
retire earlier, individuals are likely to receive lower retirement income. As a
consequence, governments in some countries have been raising the official retirement age
or have introduced incentives to delay retirement. For example, the UK Pensions
Commission (2005) suggests that state pensionable age in the UK, currently 65, should
rise after 2020 by about one year every decade reaching 68 or 69 by 2050. The capacity
of funded individual account systems to deliver retirement income will be further
challenged in this respect as life expectancy continues to increase in virtually all
countries.
27
According to Chirchir (2007), of all the above, the demographic profile of the fund
influences the investment portfolio of any one scheme the most. The demographic relief
describes the age of the scheme as young, middle and the retired age set groups. Asset
allocation in each set group is different because of the time horizon that automatically
determines the liabilities levels hence the investments are made to match the assets and
the liabilities.
2.4 Empirical Studies
2.4.1 Empirical Studies in Kenya
Mutua (2003) studied the extent of compliance with the retirement benefits Act by
retirement benefits schemes in Kenya. The objectives of her study included finding out
the extent of compliance, identifying difficulties faced by schemes that had not fully
complied and finding out the relationship between the extent of compliance and the
financial performance of pension schemes. She used fund values for the years ending
years 2000 and 2001 to measure the financial performance of schemes. She analysed
these against compliance parameters including extent of submission of amended trust
deeds and rules, submission of investment management agreement, custodial services
agreement, annual audited accounts and actuarial report. Findings from her study
indicated that the relationship between the extent of compliance and financial
performance was positive but weak.

28
Kusewa (2007) studied the impact of regulation of the retirement benefits sector on the
financial performance of occupational pension schemes in Kenya. Her research sought to
establish if the findings by Mutua (2003) with regard to financial performance of
retirement benefits schemes still held. The study covered a longer period i.e. five years
before and five years after the enactment of the regulations in year 2000. In her study, the
indicators of financial performance used were the total contributions from members for
the year and fund values at year end. According to the study, increase in total
contributions is influenced by the number of members in the scheme, the member‟s pay
(where the pension is a proportion of the salary) and the additional voluntary
contributions made by members. The fund value at the end of the year is the balance of
total contributions and investment income net of the withdrawal benefits and other
expenses. This is what is reinvested in the scheme to give a return to members. The fund
value, therefore, gives an indication of the size of the scheme in terms of its assets value.
The average annual percentage increase in the size of the fund was used as an indicator of
financial performance. The results of her study indicate that financial performance of
retirement benefits schemes was better in the period under which regulations have been
in place.
Wanyama (2001) studied the implications of investment guidelines under Retirement
Benefits Act (1997) and Regulations 2000 on the pension schemes and provident funds
investment portfolios in Kenya. The results of the study suggested that some schemes had
to take several measures in order to comply with the new guidelines or risk penalties
29
from the RBA. Some of those measures included terminating fixed deposits prematurely
and thus losing interest in order to comply. His research was based on finding out the
levels of investment in the prescribed asset classes by the sampled pension schemes and
comparing this to the prescribed limits.
Rono, Bitok and Asamoah (2010) studied the impact of the RBA act on investment
returns to pension funds in Kenya. Their study determined that the annual return for RBS
in the previous three years ranged from ten percent to twenty seven percent, sometimes
falling below the annual inflation rate. They established that Kenyan pension funds were
in compliance with the regulations requiring that they maintain solvency of 80% and
above. They established that the overall weighted returns before the implementation of
the RBA guidelines was low (average scale of 1.9) as compared to after (average scale of
3.7). From their research, an analysis of the trend, however, showed that long-run
performance had slowed down and that there was need for the country to adopt a unified,
harmonized and transparent regulatory framework that will integrate the pension system
in order to ensure sustainability in funding and mobilize adequate funds to cater for the
increasing population of beneficiaries. They suggested the formation of a pension risk
insurance fund as well as systematic indexation of pension benefits to inflation in order to
protect pension funds from inflationary risks.

30
2.4.2 Empirical Studies in Other Countries
Alestalo and Puttonen (2005) studied asset allocation in Finnish pension funds. Their
paper empirically examined the strategic asset allocation and the asset/liability issues in
the Finnish defined benefit pension funds. The results indicated that there was a
relationship between the liability structure and the asset allocation. While pension funds
with younger participants had more equity exposure, more mature pension funds had
more fixed income investments. Wide dispersion in asset allocations was also found
between the funds. One fund held its entire portfolio in fixed income securities whereas
other funds had none or only few fixed income holdings. Equity investments also varied
dramatically, ranging from 0 percent to over 70 percent of the asset allocation. The same
applied to investments in a sponsor, real estate investment and money market
investments. In their data analysis, they found that a portion of these different asset
allocations was explained by the liability structure, but another part remained
unexplained.
The other variables affecting strategic asset allocation of a pension fund were not obvious
and they could include factors such as regulatory environment, historical reasons, mean-
variance optimization instead of ALM, sponsor‟s own preferences or pension fund‟s
irrationality. Since asset allocation influences investment returns, the effect of the
regulatory environment on financial performance is the subject of the current study.

31
In the UK Blake, Lehmann, and Timmermann (1999) examined the asset allocations of a
sample of 306 UK occupational pension funds who retained the same, externally
appointed fund manager over the period 1986-1994. They used nine years of monthly
information on the holdings in eight asset classes of the pension funds. According to their
study, the UK pension fund managers faced the smallest set of externally imposed
restrictions and regulations on their investment behavior of any group of institutional
investors anywhere in the world. They were free to invest in any asset class, in any
currency denomination and in any amount although they faced trustee resistance to the
use of derivatives in the early part of the period. The UK fund managers also did not face
any substantive regulatory controls or real threat of litigation over imprudent behavior
over the period of the study. This general absence of constraints on investment behavior
enabled the researchers to identify the genuine investment skills of the group of fund
managers.
In their study, for each asset class, each fund reported initial market value and net
investment, the mean (time-weighted) asset value, income received and returns over the
month. They found that the total return was dominated by asset allocation i.e. there was a
slow mean reversion in the funds‟ portfolio weight towards a common, time-varying
strategic allocation.
Hlavac (2011) focused on the comparison of financial performance of the Czech
voluntary private pension scheme with five other reformed private pension schemes in

32
the region of Central Eastern Europe i.e. Bulgaria, Croatia, Hungary, Poland and Slovak
Republic. Using periodic scheme returns covering the last ten years, he estimated the
schemes Sharpe ratios for four reference benchmarks i.e. returns on the local 3-month
Treasury bills, returns on the local 10-year government bonds, returns on the German 3-
month Treasury bills and returns on the German 10-year government bonds.
The findings suggested that except for Poland none of the schemes managed to beat its
long-term domestic benchmark (10-year government bonds) as the Sharpe ratios
estimates turn out to be negative. The highest underperformance was found in the case of
the Czech Republic. Such poor results were assigned to the presence of restrictive annual
minimum return guarantees and ineffective legislation arranging the PF costs allocation.
Tapia (2008a) gathered data for 23 OECD countries over the period 2000-2005, and he
also did not find a clear connection between the real returns of the scheme and the
standard deviation of these returns. However, he points out that most of the countries
experienced the low levels of returns with the relatively low levels of volatility.
2.5 Summary of Literature Review
The pension fund investment guidelines were formulated with the aim of solving the
problems that the pension sector has faced in the past (Mutua, 2003). These include
unfunded schemes especially in the public sector. Odundo E, Njoroge S, Mutuku N &
Chirchir N. (2002) state that this arrangement where retirement benefits are paid out of
33
recurrent cash flows places extreme pressure on a firm‟s financial position and eventually
it may be unable to meet its obligations to retirees.
The other major problem was poor investments whereby funds were placed in low
yielding and poorly diversified schemes resulting in poor returns and inability to even
meet the scheme administration costs. (Daily nation 06/05/2002 p.15 as quoted in Mutua,
2003). It is thus expected that adherence to the RBA investment guidelines will boost the
financial performance of the various pension funds in Kenya.

34
CHAPTER THREE
RESEARCH METHODOLOGY
3.1 Introduction
This section looks at the way the research process was carried out. It includes a
discussion on research design, the population, the sample and sampling methods, data
collection methods, measures of variables and data analysis.
3.2 Research Design
This is the methodical investigation into a subject in order to discover facts, to establish
or revise a theory, or to develop a plan of action based on the facts discovered to make a
detailed plan of the form or structure of something, emphasizing features such as its
appearance, convenience, and efficient functioning. A multiple regression model design
was adopted to establish the relationship between seven independent variables and the
dependent variable.
3.3 Population of the study
Population target is a group of individuals or items that share one or more characteristics
from which data can be gathered and analyzed. The population was 1188 being the
number of occupational retirement benefits schemes registered with the RBA in Kenya as
at October 2013. This information was obtained from the RBA website. A random
sample of 28 RBS was selected for the purpose of this study.

35
3.4 Sampling Technique
Systematic random sampling was used to pick a sample of 28 RBS from the above
population.
3.5 Data Collection
Data collection methods are ways of getting information, often in the form of facts or
figures obtained from experiments or surveys, used as a basis for making calculations or
drawing conclusions. The data used consists of secondary data which was collected from
the RBA. The data was collected for the period 2006 to 2013.
3.6 Data Analysis and the Research Model
Data analysis is the examination of something in detail in order to understand it better or
draw conclusions from it which in this case was the data that was collected. Data
collected was stored in spread sheet where different operations were conducted. The
presentation of the data was through summary statistics.
A multiple regression model was used to analyze the data to further explain potential
differences or similarities between samples by analyzing the following independent
variables: cash and demand deposits, fixed deposits and time deposits, commercial paper
and corporate bonds, government securities, preference and ordinary shares, immovable
property and guaranteed funds. The independent variables were measured by comparing
the returns of each of the independent variable in seven years. The dependent variable

36
was measured by adding up the returns of the independent variables. A comparison in
returns of the portfolio was done on similar schemes in terms of fund value which have
invested in property and the schemes which have not invested in property. The researcher
used a seven year period trend. The researcher adapted a multiple regression model. This
was done through statistical package for social sciences version (SPSS 17). The
“grouping variable” was the return on investment for ten asset classes for the twenty eight
pension funds while the “testing variable” was the financial performance.
Y=Financial Performance
X1= Property,
X2 = Government securities,
X3= Quoted equity,
X4 = Unquoted equity,
X5 = Commercial paper,
X6 = Fixed and time deposits,
X7 = Cash and demand deposits
X8 = Offshore investments
X9 = Guaranteed investments
X10 = Others

37
3.7 Test of Statistical Significance
The study will use t-statistics and p –value to test if the coefficient of the explanatory
variables is statistically significant in causing a variation in the dependent variable. P
value greater than 0.05 (P>0.05) implies that the variable is statistically insignificant.
However, p value less than 0.05 (p<0.05) indicates that the variable in question is
significant in explaining the variation the dependent variable.

38
CHAPTER FOUR
DATA ANALYSIS, RESULTS AND DISCUSSION
4.1 Introduction
This chapter presents the results found from the data analysis. It therefore consists of
the data analysis presentation and interpretation of findings. The objective of this
study was to evaluate the relationship between retirement benefits authority
investments guidelines and financial performance of pension schemes in Kenya.
4.2 Descriptive Statistics
The data collected was used to compute the mean of Cash and demand Deposits, Fixed
deposits and Time Deposits, Commercial Paper and Corporate Bonds, Government
Securities, Preference and Ordinary Shares of Quoted Companies, Immovable
Properties, Guaranteed funds and offshore investments in bank deposits, Unquoted
Equity, Other Investments and Financial performance of retirement benefit schemes.
Table 4.1 shows that the mean value for cash and demand deposits was 23.46 million
shillings, fixed deposit and time deposit has a mean of 117 million, commercial papers
and corporate bonds was 81.835 million, government securities was 1.350 billion
shillings, Preference and Ordinary Shares of Quoted Companies was 905.4 million,
Immovable Properties was 654.8 million, Guaranteed funds 1.4 million shillings, offshore

39
investments 33.9 million shillings while for other investments it is 28.28 million
shillings.
Table 4.1: Descriptive Statistics and Distribution of Variables
Million
SHS. X1 X2 X3 X4 X5 X6 X7 X8 X9 X10
MAXIMUM 4570 5460.1 4168 231.3 398.14 607.3 267.4 1019 27.68 637.81
MINIMUM 0 0 0 0 0 0 0 0 0 0
MEAN 654.8 1350.4 905.4 11.92 81.835 117 23.46 223.9 1.4082 28.28
MEDIAN 227.4 549.14 210.7 0 24.471 30.08 0 33.91 0 0.0089
STD DEV. 965.6 1687.3 1179 44.09 102.75 170.8 64.21 354 5.6069 120.85
Source: Research data
Where investments in each class are:
X1= Property,
X2 = Government securities,
X3= Quoted equity,
X4 = Unquoted equity,
X5 = Commercial paper,
X6 = Fixed and time deposits,
X7 = Cash and demand deposits
X8 = Offshore investments
X9 = Guaranteed investments
X10 = Others
40
4.3 Inferential Analysis
The study conducted inferential analysis using Pearson correlation coefficient, ANOVA
and regression analysis. ANOVA was used to test the hypothesis that the means among
independent (factors) and dependent variables (financial performance) are equal,
therefore shows the significance of the association between the two. Correlation
coefficient was used to test linear dependence (association) between financial
performance and the individual independent variables. Regression analysis was used to
measure the relationship between individual independent variables and the dependent
variable when they act together. The regression analysis will be of the form:
4.4 Correlation Results
The study sought to establish the association between individual independent variables
and financial performance of the same within the period (2003 – 2008). Pearson
correlation coefficients were used to test the hypothesis for the study. The result is
presented in table 4.3 below:

41
Table 4.2: Correlation Matrix
Y X1 X2 X3 X4 X5 X6 X7 X8 X9 X10
Y 1.000
X1 0.732 1.000
X2 0.938 0.598 1.000
X3 0.682 0.565 0.753 1.000
X4 -0.141 -0.071 -0.152 -0.112 1.000
X5 0.755 0.567 0.741 0.827 -0.119 1.000
X6 0.563 0.527 0.649 0.723 -0.115 0.427 1.000
X7 0.158 -0.011 0.278 0.285 -0.102 0.132 0.190 1.000
X8 0.214 0.156 0.355 0.678 -0.057 0.480 0.313 0.457 1.000
X9 -0.187 -0.154 -0.184 -0.180 -0.068 -0.176 -0.169 -0.095 -0.147 1.000
X10 0.231 0.145 0.107 0.245 0.087 0.582 -0.029 -0.078 -0.107 -0.061 1.000
Source: Research data
Where the investments in each asset class is by the following symbols:
Y=Financial Performance
X1= Property,
X2 = Government securities,
X3= Quoted equity,
X4 = Unquoted equity,
X5 = Commercial paper,
X6 = Fixed and time deposits,
X7 = Cash and demand deposits
X8 = Offshore investments
X9 = Guaranteed investments
X10 = Others
42
The results show that there is a low but positive relationship between financial
performance and Cash and demand Deposits (0.158). There is a high positive correlation
between financial performance and fixed deposits and Time Deposits (0.563), between
financial performance and Commercial Paper and Corporate Bonds (0.755), positive
correlation between Government Securities and financial performance (0.938), positive
correlation between Preference and Ordinary Shares of Quoted Companies and financial
performance (0.682), positive correlation between financial performance Immovable
Properties (0.732), and Other investments (0.231). However, there is a negative
correlation between financial performance and Guaranteed funds (-0.187) and unquoted
equity (-0.141).
4.5 Regression Analysis
The study sought to determine the goodness of fit for the regression analysis using the
correlation coefficient between the overall independent variables and financial
performance of RBA after the guidelines and the coefficient of determination from the
same. Coefficient of determination established the strength of the relationship between
the dependent and independent variables.
4.5.1 Model Summary
Determination coefficients (R2) were also carried out to determine the strength of the
relationship between independent and dependent variables. The study established R2 of
0.955. R2
of 0.955 indicates that 95.50% of the variation in financial performance is
43
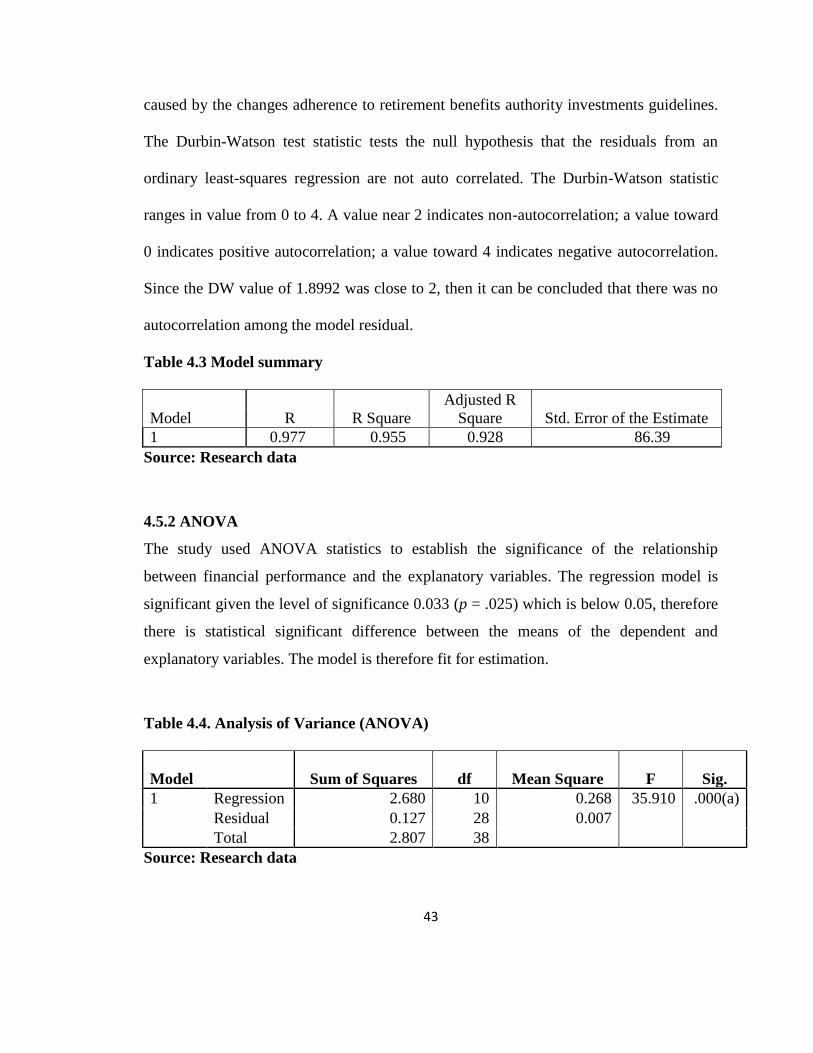
caused by the changes adherence to retirement benefits authority investments guidelines.
The Durbin-Watson test statistic tests the null hypothesis that the residuals from an
ordinary least-squares regression are not auto correlated. The Durbin-Watson statistic
ranges in value from 0 to 4. A value near 2 indicates non-autocorrelation; a value toward
0 indicates positive autocorrelation; a value toward 4 indicates negative autocorrelation.
Since the DW value of 1.8992 was close to 2, then it can be concluded that there was no
autocorrelation among the model residual.
Table 4.3 Model summary
Model R R Square
Adjusted R
Square Std. Error of the Estimate
1 0.977 0.955 0.928 86.39
Source: Research data
4.5.2 ANOVA
The study used ANOVA statistics to establish the significance of the relationship
between financial performance and the explanatory variables. The regression model is
significant given the level of significance 0.033 (p = .025) which is below 0.05, therefore
there is statistical significant difference between the means of the dependent and
explanatory variables. The model is therefore fit for estimation.
Table 4.4. Analysis of Variance (ANOVA)
Model Sum of Squares df Mean Square F Sig.
1 Regression 2.680 10 0.268 35.910 .000(a)
Residual 0.127 28 0.007
Total 2.807 38
Source: Research data
44
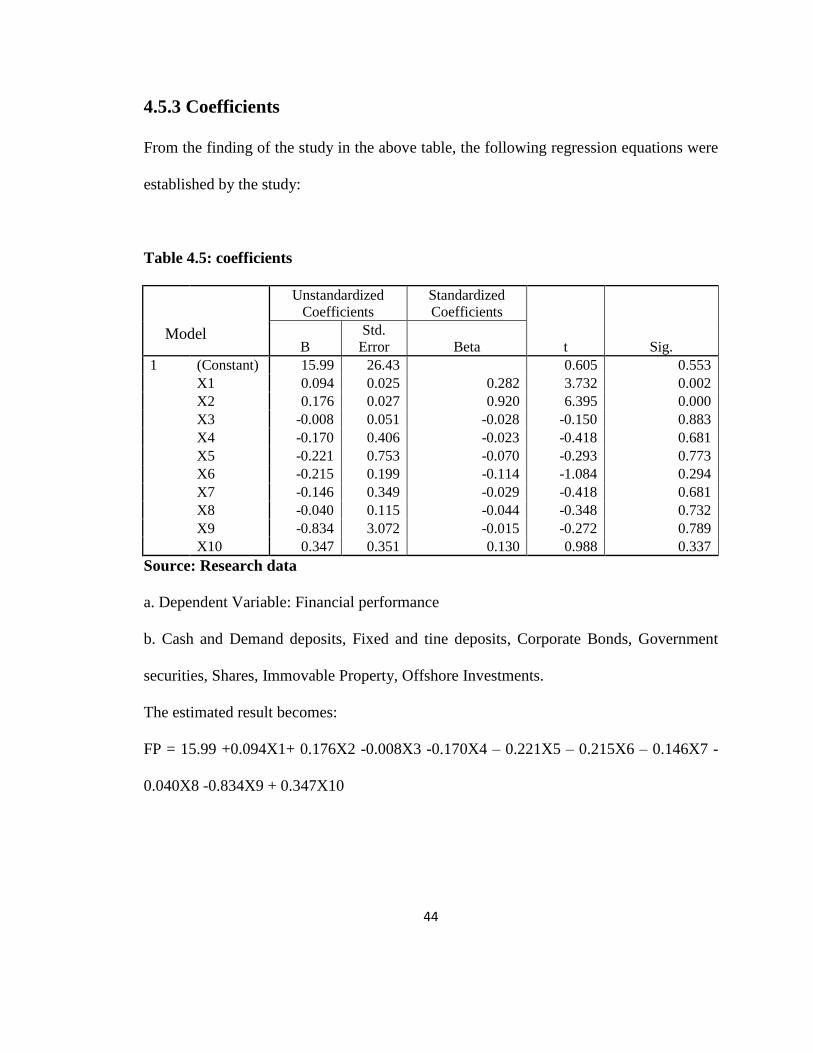
4.5.3 Coefficients
From the finding of the study in the above table, the following regression equations were
established by the study:
Table 4.5: coefficients
Unstandardized
Coefficients
Standardized
Coefficients
t Sig. B
Std.
Error Beta
1 (Constant) 15.99 26.43 0.605 0.553
X1 0.094 0.025 0.282 3.732 0.002
X2 0.176 0.027 0.920 6.395 0.000
X3 -0.008 0.051 -0.028 -0.150 0.883
X4 -0.170 0.406 -0.023 -0.418 0.681
X5 -0.221 0.753 -0.070 -0.293 0.773
X6 -0.215 0.199 -0.114 -1.084 0.294
X7 -0.146 0.349 -0.029 -0.418 0.681
X8 -0.040 0.115 -0.044 -0.348 0.732
X9 -0.834 3.072 -0.015 -0.272 0.789
X10 0.347 0.351 0.130 0.988 0.337
Source: Research data
a. Dependent Variable: Financial performance
b. Cash and Demand deposits, Fixed and tine deposits, Corporate Bonds, Government
securities, Shares, Immovable Property, Offshore Investments.
The estimated result becomes:
FP = 15.99 +0.094X1+ 0.176X2 -0.008X3 -0.170X4 – 0.221X5 – 0.215X6 – 0.146X7 -
0.040X8 -0.834X9 + 0.347X10
Model

45
4.6 Discussion of Research Findings
The estimated model indicates that RBA will realize an average financial performance of
15.99 units if the investment guidelines are not observed by the pension schemes in
Kenya. Cash and demand deposits have positive relationship with financial performance
of pension schemes. A unit increase in cash and deposits as investments guidelines will
lead to 0.146 units decrease in the financial performance of pension schemes. A unit
increase in fixed deposit and times deposits as investment guidelines will lead to 0.215
units decrease in the profitability of pension schemes. A unit increase in commercial
paper and corporate bonds will lead to 0.221 units decrease in profitability of the pension
schemes. The Research data indicates a negative relationship between preference and
ordinary shares of quoted companies with financial performance of pension schemes. A
unit increase in preference and ordinary shares of quoted companies will lead to 0.008
units decrease in financial performance of pension schemes.
Investment in Government securities will lead to an increase in the profitability of
financial performance of pension schemes. A unit increase in immovable properties by
pension funds will lead to 0.094 units increase in financial performance of pension
schemes. A unit increase in guaranteed funds and offshore investments in bank deposits
will lead to 0.834 units decrease in the profitability of pension schemes.
The results are a contrast to the investment appetite for the public pension scheme in
Kenya i.e. the NSSF which has heavily invested in the real estate sector and has plans to

46
further increase their property portfolio. Investment in property yields 0.094 per every
unit invested while there are more profitable classes of investment such as investment in
government securities which has a yield of 0.176 for every unit invested.
This findings were in line with Mutuku (2007) who by submitting that offshore
investments are limited to bank deposits, government securities, quoted equities, rated
corporate bonds and offshore collective investment schemes reflecting these assets,
Further established that investment in “any other asset” category requires prior approval
of the RBA following application by the scheme. The study finding is similar Blake,
Lehmann, and Timmermann, (1999) who examined the asset allocations of a sample of
306 UK occupational pension funds who retained the same, externally appointed fund
manager over the period 1986-1994. According to their study, the UK pension fund
managers faced the smallest set of externally imposed restrictions and regulations on their
investment behavior of any group of institutional investors anywhere in the world. They
were free to invest in any asset class, in any currency denomination and in any amount
although they faced trustee resistance to the use of derivatives in the early part of the
period. The UK fund managers also did not face any substantive regulatory controls or
real threat of litigation over imprudent behavior over the period of the study.
47
CHAPTER FIVE
SUMMARY, CONCLUSIONS AND RECOMMENDATIONS
5.1 Introduction
This chapter concludes this research study. It presents the findings, recommendations and
conclusions. It briefly discusses Research data which are based on the objective of
determining the relationship between the RBA investment guidelines and financial
performance of pension schemes in Kenya. It further highlights the limitations of the
study and finally suggests recommendations for practical and further research.
5.2 Summary of Research Findings
The research discusses the relationship between investment guidelines and financial
performance of RBS in Kenya. The RBA introduced the investment guidelines in the year
2001 to guide the investments of RBS to ensure that they are well diversified to manage
risk exposure to various investments. RBS are allowed temporary deviations from
guidelines but this must be corrected within 90 days and therefore compliance was
assumed for all RBS for the period after the guidelines came into effect. The aim of the
study was to establish if the investment guidelines had a positive impact on the financial
performance of pension schemes in Kenya.
Even and Macpherson, (2004) state that investing pension assets in a single stock (i.e.
sponsor) is contrary to basic diversification and therefore, a pension fund that holds
48
sponsor‟s stock can provide the same rate of return as diversified portfolio but it is
increasing the risk borne by its members. Pension funds, therefore, require a set of
internal statutes and external regulations to ensure that they are managed in the best
interest of beneficiaries. Pension funds, therefore, should have a set of internal statutes
and external regulations to ensure that they are managed in the best interest of
beneficiaries.
The study also established that cash and demand deposits positively influence the
financial performance of pension schemes in Kenya. Fixed deposits and times deposits
have positive impact on the profitability of pension schemes. The study findings also
revealed that increase in the application of commercial paper and corporate bonds as
guidelines positively affect the financial performance of pension schemes. Increase in
preference and ordinary shares of quoted companies increases the profitability of pension
schemes. The study also established that immovable properties and guaranteed funds and
offshore investments in bank deposits positively impacts on the profitability of the
pension schemes.
5.3 Conclusion
From the findings, there was a positive relationship on the introduction of investment
guidelines by the RBA on the financial performance of RBS. RBA should enforce
guidelines that promote fixed deposits for pension schemes. Fixed deposits increase
capital base for investments which generates more revenue for the members. Retirement
49
benefit authority should buy preference and ordinary shares of quoted companies as a
way of diversification in investments.
From the study findings adherence to regulator‟s investment policies lead to improved
financial performance by reducing conflict of interests arising between the fund sponsors
and the ultimate beneficiaries of the fund. Impositions of limits on self-investments
protected the scheme from undue exposure and bankruptcy of the sponsors. The larger
the pension funds than the sponsor‟s fund the more vulnerable the scheme to interference.
Investing in the sponsor‟s stock is inefficient for all stakeholders, because the pension
fund carries a firm-specific risk, which could be diversified away.
5.4 Recommendations
As the RBS regulator, the RBA should publish comprehensive industry statistics on a
regular basis. This will empower the public with information on the retirement industry
performance and thus facilitate making of informed decisions with regards to choosing
which RBS to join. It will also make it easier for scholars conducting research on the
industry to get the necessary data. Financial performance would also improve as fund
managers would strive to outperform their peers.
The RBA should strengthen the compliance department and ensure more compliance
with its regulations particularly the investment guidelines. This is because a number of
50
schemes are not in compliant and this could expose pensioners‟ funds to inflationary risks
and financial losses.
The RBA should also partner with local institutions of higher learning especially post-
graduate business schools and faculty in order to facilitate quality research into the issues
affecting the financial performance of the pension industry in Kenya. For example, how
the investment guidelines as expressed in the asset classes relate to an optimal asset
allocation. This is by facilitating collection of data on financial performance before the
year 2000 when the guidelines came into effect and comparing this to performance after.
5.5 Limitations of the Study
The researcher experienced a number of constraints while undertaking the research. The
major limitation was that fund managers were unwilling to provide data required for the
study. This was however obtained from the RBA. Getting data for the period before the
year 2000 was also very challenging since the RBA was not in place at that time. Lack of
enough local literature on similar research was also a major challenge.
Most of the research literature on financial performance available was from European
countries such as Britain and the Czech Republic and Latin America especially Chile.
Local literature was mostly focused on measuring the level of compliance with the RBA
guidelines and not the financial performance of RBS. Therefore, most of the studies did
not have a local feel.

51
Complete data was not available for all the independent variables for all the years and
thus the results could be distorted for the years when a particular asset class performed
beyond the norm.
5.6 Suggestions for Further Research
Further research is suggested on the effect of active fund management versus passive
fund management on financial performance. This is by comparing financial performance
of funds where fund managers invest in guaranteed schemes only versus those that pursue
a diversification strategy.
Further research and investigation should also be carried out on why there is a negative
relationship between financial performance and investment in government securities. The
result might vary because different government regimes adopt different monetary and
fiscal policies in terms of corporate management.
Future studies should be conducted to assess effectives of investment undertaken by the
pension schemes and if such investments have positive impact on the financial status of
the members of the scheme.
52
REFERENCES
Alestalo N. & Puttonen V. (2005). Asset allocation in Finnish Pension Funds.
Accepted for publication in Journal of Pension Economics and Finance.
Antolin, P. (2008). Pension Fund Performance. OECD Working Papers on Insurance and
Private Pensions, No. 20, OECD publishing.
Antolin, P. & F. Stewart. (2009). Private Pensions and Policy Responses the Financial
and Economic Crisis. OECD Working Papers on Insurance and Private Pensions
No. 36, OECD publishing.
Aragon, G. & Ferson, W. (2006). Portfolio Performance Evaluation. Foundations and
Trends in Finance 2(2), 83–190.
Arenas, A. & Mesa, C. (2006). The structural pension reform in Chile: Effects,
comparisons with other Latin American reforms, and lessons. Oxford Review of
Economic Policy, 22(1).
Barr, N. (2006). Pensions: Overview of the issues. Oxford Review of Economics Policy,
22(1).
Brown, S. & Warner, J. (1980). Measuring Security Price Performance. Journal of
Financial Economics, 8, 205-258.
Campbell, J. Y. & Viceira, L. (2002). Strategic Asset Allocation: Portfolio Choice for
Long-term Investors. Oxford University Press.
Chirchir, S. (2007). The Rationale for quantitative Portfolio Ceilings on Investment of
Retirement Benefits funds: The case for Kenya. RBA 2007.
Correia, C., Flynn, D., Uliana, E. & Wormald, M. (2003). Financial Management, Fifth
Edition, Juta & Co. Ltd.
Cuthbertson, K. & Nitzsche, D. (2004). Quantitative Financial Economics: Stocks,
Bonds & Foreign Exchange, Second Edition, John Wiley & Sons, Ltd.
Davis, E. (2002). The Regulation of Funded Pensions: A Case study of the United
Kingdom. A perspective on Pension Fund Investments Wordwide.
Derby Financial Group (2008) Modern Portfolio Theory.
Diamond, A. (2004). Social Security. American Economic Review 94/1, 1-24

53
Downie, J. (2008). The essentials of Retirement Fund Management in Southern Africa.
Butterworth publishers, Berea, KwaZulu-Natal.
Elton, E., Gruber, M. & Padberg, M. (1976). Simple Criteria for Optimal Portfolio
Selection. Journal of Finance, 31(5), 1341- 1357.
Even, W. & Macpherson, D. (2004). Company Stock in Pension Funds. National Tax
Journal 57(2), 299-313.
Government of Kenya: Budget Changes – Kenya Finance Bill 2007.
Government of Kenya: The Retirement Benefits Act, 1997.
Gregory, A. & Tonks, I. (2004). Performance of Personal Pension Schemes in the UK.
Xfi Centre for Finance and Investment, University of Exeter.
Harvey, C., Travers, K., & Costa, M. (2000). Forecasting Emerging Market Returns
Using Neural Networks, Emerging Markets Quarterly, Summer Edition, pp. 1-12
Hills, J. (2006). A New Pension Settlement for The Twenty-First Century? The UK
Pensions Commission’s Analysis and Proposals. Oxford Review of Economic
Policy, 22(1).
Hlaváč, J. (2011). Financial performance of the Czech private pension scheme: Its
current position and the comparison with other CEE countries. IES Working Paper
9/2011. IES FSV. Charles University.
Hobbs, J. (2001). Can South African Fund Managers Add Enough Active Value to
Domestic Investment Portfolios? Unpublished BSc Honors Project in Mathematics
of Finance, University of Witwatersrand, Johannesburg.
Holton, G. (2004). Defining Risk. Financial Analysts Journal, 60(6), 19-25
Jensen, M. (1968). The performance of mutual funds in the period 1945-1964. Journal of
Finance 23, 389–416.
Kiptanui T. (2003). A new Dawn in Retirement Benefits. 19th Trustee Training Seminar.
Kuder, G. & Richardson, M. (1937). The theory of the estimation of test reliability.
Psychometrika, 2, 151-160.
Kusewa L. 2007. The impact of regulation of the retirement benefits sector on the
financial performance of occupational pension schemes in Kenya. Unpublished
master‟s project, University of Nairobi.

54
Malkiel, B. (1999). The Random Walk Down Wall Street. W. W. Norton & Company,
Inc.
Meulbroek, L. (2002). Company Stock in Pension Plans: How Costly is it? The Pension
Institute Discussion Paper PI-0205.
Mutua (2003). A Survey of the extent of Compliance with the Retirement Benefits Act by
Retirement Benefits Schemes in Kenya. Unpublished master‟s project, University of
Nairobi.
Mutuku N. (2007). The Kenyan Pension Fund Market. Stanbic Bank Investors Seminar,
Nairobi..
Njuguna R.C. 2010. Impact of retirement benefits regulations on the cost efficiency of
retirement benefits schemes in Kenya. Unpublished master‟s project,
University of Nairobi.
Nugée, J. & Persaud, A. (2006). Redesigning Regulation of Pensions and Other
Financial Products. Oxford Review of Economic Policy, 22(1).
Odundo E, Njoroge S, Mutuku N, & Chirchir N. (2002). Paper on Pension Sector
Reform and Capital Markets Development in Kenya. Retirement Benefits
Authority, Nairobi.
OECD. (2010). Pension Markets in Focus. Issue 7.
Peltzman, S. (1976).The economic theory of regulation after a decade of deregulation.
Brookings Papers: Microeconomics.
Posner R.A. (1974). Theories of economic Regulation. The Bell Journal of Economics
and Management Science, 5(2), 335-358.
Reilly, F. (1989). Investment Analysis and Portfolio Management. Third Edition, The
Dryden Press
Renwick, F. (1969). Asset Management and Investor Portfolio Behaviour. Journal of
Finance, 24(2) 181-206
Retirement benefits Authority, http://www.rba.go.ke/
Rudolph, H.P., Hinz., R., Antolin, P. & Yermo J. (2010). Evaluating the Financial
Performance of Pension Funds. Chap. 1 in Investment Performance of
Privately Managed Pension Funds, World Bank, Washington, D.C.

55
Sharpe, W. F. (1966). Mutual fund performance. Journal of Business 1(part II), 119–138.
Srinivar, S. & Yermo, J. (1999). Do investment Regulations compromise Pension Fund
Performance? Evidence from Latin America. The World Bank, Washington DC.
Stigler, G. (1971). The Theory of Economic Regulation. The Bell Journal of Economics
and Management Science, 2(1), 3-21.
Tapia, W. (2008). Comparing Aggregate Investment Returns in Privately Managed
Pension Funds: An Initial Assessment. OECD Working Papers on Insurance and
Private Pensions, (21), OECD publishing.
The Retirement Benefits (Occupation Retirement Benefits Schemes) Regulations 2000.
Tucker, A., Becker, K., Isimbabi, M. & Ogden, J. (1994). Contemporary Portfolio
Theory and Risk Management, West Publishing Company.
Treynor, J. (1965). How to rate management of investment funds. Harvard Business
Review,43,63-75
UK Pensions Commission. (2005). A New Pension Settlement for the Twenty-First
Century: Second Report of the Pensions Commission. London: TSO, 2005,
downloadable from http://www.pensionscommission.org.uk
Wang, S. (2008). Modern Portfolio Theory Tools: A Methodological Design and
Application. Unpublished Master of Science in Engineering Project, University of the
Witwatersrand, Johannesburg. Downloaded on 3rd
October, 2012 from
http://www.wiredspace.wits.ac.za.
Wanyama R. (2001). Pension Schemes and Provident Funds Investment Portfolios in
Kenya: Implications of Investment Guidelines under Retirement Benefits Act (1997)
and Regulations 2000. Unpublished MBA project, University of Nairobi.
Wickramanayake, J. (1998). Central Provident Fund and Savings in Singapore: An
Empirical Analysis. Savings and Development, Quarterly review no. 4, 435
World Bank (1994). Averting the old age crisis. World Bank Policy Research Report,
World Bank, Washington, D.C.
World Bank Pension Reform Primer: Portfolio Limits,
http://go.worldbank.org/THY2HZ9TSO

56
World Bank (1994). Averting the old ages crisis. World Bank Policy Research Report,
World Bank, Washington, D.C.
World Bank Pension Reform Primer: Portfolio
Limits,http://go.worldbank.org/THY2HZ9TSO.
Yao, F., Xu, B., Adams, P. & Doucet, K. (2002). Streetsmart Guide to Managing Your
Portfolio: An Investor’s Guide to Minimizing Risk and Maximizing Returns.
McGrawHill.

xi
APPENDICES
Appendix I: Table G
Item Asset category Maximum %
of
Aggregate
market value
1 Cash and Demand Deposits in institutions licensed under the Banking Act of the
Republic of Kenya
5%
2 Fixed Deposits, Time Deposits and Certificates of Deposits in institutions licensed
under the Banking Act of the Republic of Kenya
30%
3 Commercial Paper, Corporate Bonds, Mortgage Bonds and loan stocks approved
by the Capital Markets Authority and collective investment schemes incorporated
in Kenya and approved by the Capital Markets Authority reflecting this category
15%
4 Kenya Government Securities and collective investment schemes incorporated in
Kenya and approved by the Capital Markets Authority reflecting this category
70%
5 Preference shares and ordinary shares of companies quoted in a stock exchange in
Kenya, Uganda or Tanzania and collective investment schemes incorporated in
Kenya and approved by the Capital Markets Authority reflecting this category
70%
6 Unquoted shares of companies incorporated in Kenya and collective investment
schemes incorporated in Kenya and approved by the Capital Markets Authority
reflecting this category
5%
7 Offshore investments in bank deposits, government securities, quoted equities and
rated Corporate Bonds and offshore collective investment schemes reflecting these
assets
15%
8 Immovable property in Kenya and units in property Unit Trust Schemes
incorporated in Kenya and collective investment schemes incorporated in Kenya
and approved by the Capital Markets Authority reflecting this category
30%
9 Guaranteed Funds 100%
10 Any other assets 5%

xii
Appendix II: Sample Data
ID X1 X2 X3 X4 X5 X6 X7 X8 X9 X10
2003 21 632.00 558.58 551.95 2.06 34.51 73.06 0.00 696.66 0.00 0.46
100 19.77 604.70 88.98 0.00 24.13 124.83 41.80 0.00 0.00 7.71
538 1,361.50 146.36 76.36 44.85 0.00 12.80 0.00 0.00 0.00 6.34
628 208.56 300.22 146.59 0.00 22.20 30.01 1.74 0.00 0.00 0.20
1,395 2.94 3.11 0.46 0.00 0.05 0.26 0.00 0.00 0.00 0.02
2004 16 232.80 2,498.29 1,587.83 0.00 101.26 0.00 267.36 930.17 0.00 3.76
107 1,006.25 4,788.24 967.19 0.00 124.86 230.00 20.84 89.95 0.00 0.00
210 1,210.54 1,169.48 2,063.19 22.66 206.67 104.68 0.00 970.89 0.00 0.63
278 32.50 67.10 64.74 1.79 2.83 0.00 0.00 19.20 0.00 0.00
822 285.37 539.71 304.24 1.25 41.50 20.00 0.00 82.00 11.75 0.00
2005 16 336.00 2,565.16 2,442.61 0.00 238.13 0.00 118.00 1,018.87 0.00 1.64
37 0.00 72.14 24.20 0.00 7.10 12.07 0.00 2.03 0.00 0.00
206 455.80 269.99 0.06 0.50 16.63 18.82 0.00 0.00 0.00 0.00
214 90.50 303.81 146.60 231.33 21.67 6.36 0.00 47.14 0.00 93.83
299 54.00 155.67 65.04 0.00 3.93 15.29 0.00 15.64 0.00 0.00
2006 30 40.40 955.95 203.09 11.72 24.81 160.41 0.00 0.00 0.00 0.00
107 1,536.91 5,405.84 1,708.56 0.00 249.57 308.45 9.61 331.49 0.00 0.00
203 222.00 259.60 218.30 1.23 23.10 55.08 0.00 91.64 0.00 0.00
1,184 0.00 0.00 0.00 0.00 0.00 0.00 0.00 0.00 27.68 0.00
2007 100 40.85 951.58 528.62 0.00 59.13 107.97 0.00 129.07 0.00 31.35
200 1,382.50 2,790.23 2,142.17 0.00 81.25 607.33 197.62 269.82 0.00 3.73
210 1,531.50 1,727.45 3,435.44 16.39 156.76 559.28 0.00 993.21 0.00 0.00
2008 107 1,500.27 5,460.13 4,167.72 0.00 230.07 453.07 0.00 490.19 0.00 0.16
278 35.00 43.27 31.83 0.00 3.33 17.51 0.00 8.90 0.00 0.00
299 88.50 198.42 124.14 0.00 22.64 30.14 0.00 20.68 0.00 0.00
2009 24 0.00 95.55 33.88 0.00 17.90 1.21 0.00 2.84 0.00 0.00
383 1,457.00 2,439.89 2,508.18 0.00 398.14 106.44 0.00 59.54 0.00 637.81
454 4,569.66 3,440.03 1,720.03 0.00 179.21 221.75 0.00 0.00 0.00 4.19
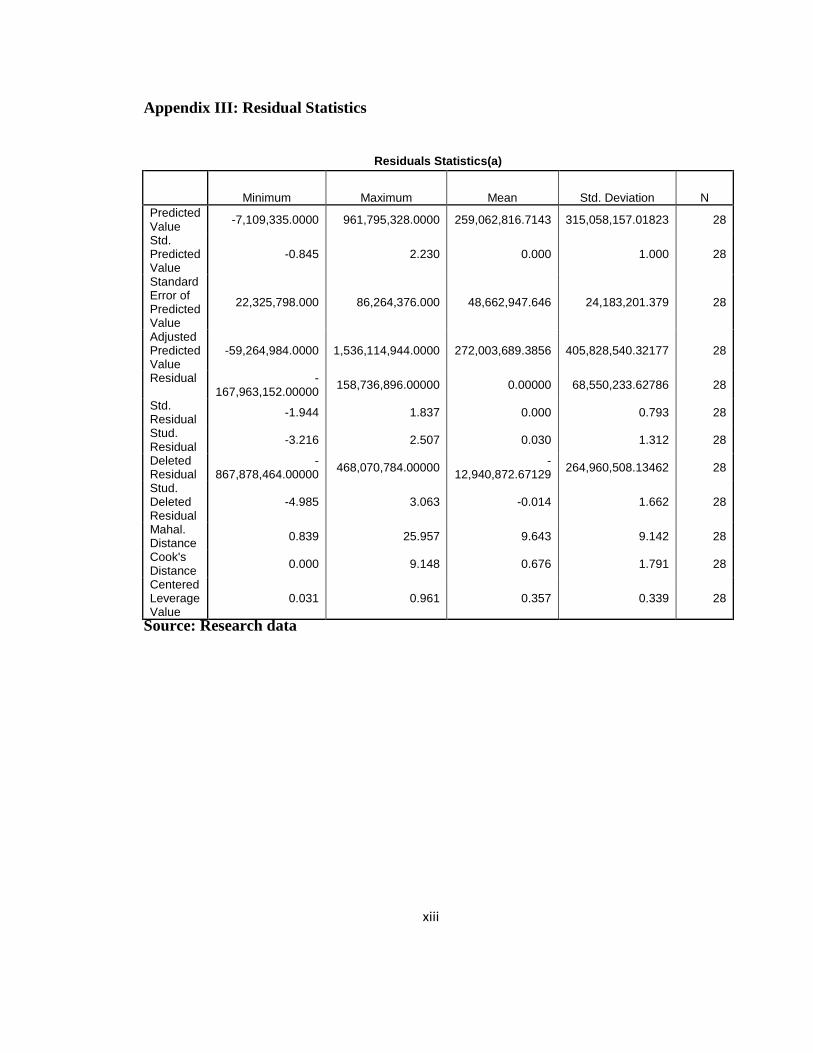
xiii
Appendix III: Residual Statistics
Residuals Statistics(a)
Minimum Maximum Mean Std. Deviation N
Predicted Value
-7,109,335.0000 961,795,328.0000 259,062,816.7143 315,058,157.01823 28
Std. Predicted Value
-0.845 2.230 0.000 1.000 28
Standard Error of Predicted Value
22,325,798.000 86,264,376.000 48,662,947.646 24,183,201.379 28
Adjusted Predicted Value
-59,264,984.0000 1,536,114,944.0000 272,003,689.3856 405,828,540.32177 28
Residual -167,963,152.00000
158,736,896.00000 0.00000 68,550,233.62786 28
Std. Residual
-1.944 1.837 0.000 0.793 28
Stud. Residual
-3.216 2.507 0.030 1.312 28
Deleted Residual
-867,878,464.00000
468,070,784.00000 -
12,940,872.67129 264,960,508.13462 28
Stud. Deleted Residual
-4.985 3.063 -0.014 1.662 28
Mahal. Distance
0.839 25.957 9.643 9.142 28
Cook's Distance
0.000 9.148 0.676 1.791 28
Centered Leverage Value
0.031 0.961 0.357 0.339 28
Source: Research data