The Relationship Between Personality Characteristics and Job

Institutionen för fysik, kemi och biologi
Examensarbete 16 hp
The relationship between personality and basal
metabolic rate in Red Junglefowl (Gallus
gallus)
Åsa Näsström
LiTH-IFM- Ex--13/2793--SE
Handledare: Hanne Løvlie, Linköpings universitet
Jordi Altimiras, Linköpins universitet
Examinator: Anders Hargeby, Linköpings universitet
Institutionen för fysik, kemi och biologi
Linköpings universitet
581 83 Linköping

Rapporttyp Report category
Examensarbete
C-uppsats
Språk/Language
Engelska/English
Titel/Title:
The relationship between personality and basal metabolic rate in Red Junglefowl (Gallus gallus)
Författare/Author:
Åsa Näsström
Sammanfattning/Abstract:
‘Animal personality’ refers to individual behavioural differences that are consistent over time and context.
Physiological constraints are suggested to underlie this constraint in behavioural plasticity. As energy is required for
physiological processes that generate behaviour, energy metabolism could be a proximate explanation for personality.
Currently, the most coherent framework linking behaviour, metabolism and life history-traits is still poorly tested
empirically, and studies are showing contradicting results. Therefore, I here aim to explore this relationship further by
investigating the relationship between basal metabolic rate (BMR) and personality in Red Junglefowl (Gallus gallus).
Birds used had known responses in personality assays, and their metabolic rates were measured by determining
oxygen consumption in standardized conditions throughout the night using an open respirometry system. BMR was
negatively correlated with time spent foraging, and positively correlated with time spent being vigilant. Considering
foraging an ‘activity’ (due to its energy-demand), my results support the allocation model, a model that assumes that
an animal has a fixed amount of energy, thus that an energetic trade-off occur between competing energy requiring
processes such as BMR and activity. Hence, an animal with low BMR has more energy to spend on activity.
However, I do not consider vigilance as an energy-demanding activity; hence this relationship cannot be interpreted
in this framework. Taken together, my results show a relationship between personality and BMR, although their
relationship still needs further investigation to understand the causality and consequences of it.
ISBN
LITH-IFM-G-EX—13/2793—SE
__________________________________________________
ISRN __________________________________________________
Serietitel och serienummer ISSN
Title of series, numbering
Handledare/Supervisor Hanne Løvlie, Jordi Altimiras
Ort/Location: Linköping
Nyckelord/Keyword:
Allocation model, basal metabolic rate, behaviour, chicken, oxygen consumption, personality traits
Datum/Date
2013-05-30
URL för elektronisk version
Institutionen för fysik, kemi och biologi
Department of Physics, Chemistry and
Biology
Avdelningen för biologi
Instutitionen för fysik och mätteknik
Table of contents
1 Abstract ............................................................................................... 2
2 Introduction ......................................................................................... 2
3 Materials and methods ........................................................................ 4
3.1 Animals and management ............................................................ 4
3.2 Metabolic rate measurements....................................................... 4
3.3 Morphological measurement ....................................................... 5
3.3.1 Plumage scoring ....................................................................... 5
3.4 Behavioural responses .................................................................. 6
3.5 Calculations and statistical analysis ............................................. 6
4 Results ................................................................................................. 7
4.1 Sex differences and plumage score .............................................. 7
4.2 Relationships between variation in behaviour and BMR ............ 9
4.3 Weight loss, tarsal length and comb size ................................... 13
5 Discussion ......................................................................................... 14
6 Conclusion ........................................................................................ 17
7 Acknowledgments ............................................................................. 17
8 References ......................................................................................... 17

2
1 Abstract
‘Animal personality’ refers to individual behavioural differences that are
consistent over time and context. Physiological constraints are suggested
to underlie this constraint in behavioural plasticity. As energy is required
for physiological processes that generate behaviour, energy metabolism
could be a proximate explanation for personality. Currently, the most
coherent framework linking behaviour, metabolism and life history-traits
is still poorly tested empirically, and studies are showing contradicting
results. Therefore, I here aim to explore this relationship further by
investigating the relationship between basal metabolic rate (BMR) and
personality in Red Junglefowl (Gallus gallus). Birds used had known
responses in personality assays, and their metabolic rates were measured
by determining oxygen consumption in standardized conditions
throughout the night using an open respirometry system. BMR was
negatively correlated with time spent foraging, and positively correlated
with time spent being vigilant. Considering foraging an ‘activity’ (due to
its energy-demand), my results support the allocation model, a model that
assumes that an animal has a fixed amount of energy, thus that an
energetic trade-off occur between competing energy requiring processes
such as BMR and activity. Hence, an animal with low BMR has more
energy to spend on activity. However, I do not consider vigilance as an
energy-demanding activity; hence this relationship cannot be interpreted
in this framework. Taken together, my results show a relationship
between personality and BMR, although their relationship still needs
further investigation to understand the causality and consequences of it.
2 Introduction
Traditionally, behaviours were considered to be highly plastic and an
individual was therefore predicted to be able to perform the optimal
behaviours for any given situation (Sih et al. 2004). However, it is now
becoming clear that individuals of the same population may perform
different behaviours in the same situation, or similar behaviour in
different situations (Stamps 2007). This observation implies that there are
limitations to the behavioural plasticity of individuals (Sih et al. 2004).
This has been termed ‘animal personality’ and refers to individual
behavioural differences that are consistent over time and/or context
(Gosling 2001, Sih et al. 2004, Reale et al. 2007, Biro and Stamps 2010).
Recent studies have observed animal personalities in a wide range of
species including mammals, birds, fish, reptiles, amphibians, molluscs,
spiders, cephalopods and arthropods (reviewed by Gosling 2001, Stamps
2007). When investigating variation in animal personality, the most
commonly observed behavioural traits are boldness/shyness,

3
aggressiveness, exploration, activity and sociability (Gosling 2001, Reale
et al. 2007, Biro and Stamps 2008, Careau et al. 2008). Empirical studies
indicate that these behavioural traits are positively related to food intake,
productivity and other life-history traits (Biro and Stamps 2008).
Correlations among behavioural traits might also exist, for example; an
individual expressing high aggressiveness might also be bolder, more
exploratory and active (Sih et al. 2004, Biro and Stamps 2008).
According to Careau and co-workers (2008), physiological constraints
may underlie consistent individual differences in behaviour (i.e.
personality). Energy metabolism could be a proximate explanation for
personality, since energy is required for the physiological processes that
generate behaviours (Biro and Stamps 2010). Careau and Garland (2012)
suggests a link between energy metabolism and personality, and link
these to the proactive-reactive life-history continuum, also termed as
variation in individuals’ ‘pace of life’. Individuals within a population
can vary in their life-history strategies (Dall et al. 2004, Biro and Stamps
2008). Studies on birds and mammals suggests that a proactive individual
is characterised as bold, with higher levels of activity and aggressiveness,
while a reactive individual is shyer, with low activity and aggressiveness
(Careau et al. 2008, Reale et al. 2010). A proactive individual is therefore
predicted to have a fast pace of life and is further expected to live a short
life with high growth rate and be highly fecund (Biro and Stamps 2010).
A proactive strategy is suggested to require a higher metabolic rate than a
reactive life strategy (Careau et al. 2008). The higher energy requirement
may generate a positive relationship between a proactive strategy and
resting metabolic rate (Reale et al. 2010). A survey by Biro and Stamps
(2010) shows a positive correlation between metabolic rate and proactive
behaviour in birds, fish, mammals, crustaceans and insects. Several
studies support these findings (Careau et al. 2011, Martins et al. 2011,
Killen et al. 2011), while others fail to find such a relationship (Kane et
al. 2008, Lantova et al. 2011). According to Careau and Garland (2012),
the positive relationship between metabolic rate and personality is only
weakly supported on an individual level. For example, earlier studies on
birds show that resting metabolic rate is reduced when increasing the
energy invested in activity (Deerenberg et al. 1998, Wikelski et al. 1999).
Contrary, Mathot and co-workers (2009) showed a positive correlation
between basal metabolic rate and foraging behaviour in birds. Therefore,
the currently most coherent framework that links behaviour, metabolism
and life history-traits (i.e. the idea that individuals differ in their pace of
life) still need to be further investigated empirically as studies so far have
given inconclusive results of the predicted relationship. The here
presented study therefore aimed to explore this relationship further by
4
investigating if there are correlations between basal metabolic rate and
personality traits in Red Junglefowl (Gallus gallus).
3 Materials and methods
3.1 Animals and management
The animals used in this study were adult Red Junglefowl (ca. 1 year of
age), 17 hens and 16 roosters with known behavioural scores in
personality assays, according to the methods used in Thorpe (2013). The
birds were housed at Linköping University’s chicken facility at Vreta
Naturbruksgymnasium. 7-5 hours before each trial when oxygen
consumption was measured (see below), birds were transported to
Linköping University where the trials were performed. Each trial started
in the afternoon and lasted throughout the night. In the morning when the
trial was complete, birds were transported back to Vreta animal facility.
During the time the birds were housed at the university, they were kept in
an indoor enclosure (140 x 70 cm) with wood shavings and ad libitum
access to food and water.
3.2 Metabolic rate measurements
Metabolic rate is measured by an animal’s O2-consuption or CO2-
production per unit of time (Careau et al. 2008). To determine the birds’
basal metabolic rate (BMR), their O2-consumption was measured. The
experimental set-up for the metabolic measurement used in the current
study was an open respirometry system with an air pump pushing air
through four respiration chambers (CurTec) that were placed in a
thermostatic chamber (type 3001, Rubarth ® apparate GmbH). This
allowed me to measure simultaneously four individuals per trial. Two
types of chambers were used: 10 L for hens (diameter of 274 mm and a
height of 283 mm), 15 L for roosters (diameter of 274 mm and with a
height of 327 mm) due to the larger size of the male birds. The flow of air
through the chambers was set to 2-2.5 L/min. The air flow through the
chambers was measured with a multichannel flow measurement system
(FB8, Sable Systems Inc.). The system was set to collect sequential
outflow samples for three minutes in each chamber and a baseline, which
resulted in a cycle of 15 minutes throughout the 16 hours each bird was
tested. The baseline is a measurement of the O2-concentration in the air
before going into the chambers. The air from the chambers and baseline
was analysed with a gas analysis system FOXBOX (Sable Systems Inc.).
Before the air entered the gas analysis system, it passed through a drying
column (60 ml) with Drierite (Hammond Drierite) to eliminate moisture
from the incoming air. Temperature sensors (iButton, type DS1921L;
5
Maxim/Dallas Semiconductor Corp.) were placed in the chambers to
monitor the temperature inside the chambers during the trials. A
temperature sensor was also placed inside the thermostatic camber to
measure and enable me to account for incubator temperature. Each bird
was measured once since the individual differences in BMR are assumed
to be consistent (Biro and Stamps 2010).
Resting and basal metabolic rate are the most common methods when
studying energy metabolism in vertebrates (Careau et al. 2008). Basal
metabolic rate is defined as the metabolic rate in the thermoneutral zone
when an adult individual is inactive, post-absorptive and non-
reproductive (McNab 1997). Resting metabolic rate (RMR) is a slightly
less strict measurement as the individual does not need to be post-
absorptive (Careau et al.2008). The metabolic measurement in this study
will be considered as basal metabolic rate (BMR) because the birds were
post-absorptive, as they did not have access to food and water while
inside the thermostatic camber for 16 hours. The birds, however, will be
in their reproductive cycle as it is more or less ‘chronic’ in domesticated
species, and the birds used were kept on 12:12 light: dark cycles,
simulating the breeding season.
3.3 Morphological measurement
Before a trial started, the comb length and comb height of each individual
was measured, as well as the tarsal length (all measured in mm by the use
of a digital calliper). These measurements were taken to investigate their
potential relationship with variation in BMR. Tarsal length is a measure
of how large the bird is, as a more conservative complement to the actual
weight, which may change over short intervals for various resons. Comb
size is commonly used as a surrogate measure for variation in levels of
reproductive hormones (Eitan et al. 1998).
BMR is affected by body mass; an animal with higher body mass is
expected to have a higher BMR (McNab 2008). To account for the
individuals’ mass-differences, the birds’ weight (in grams) was noted
before and after each trial to be able to calculate the mass-specific BMR
of individuals. The chambers’ weights were also noted before and after
each trial to determine how much of the birds’ weight losses were due to
defecation.
3.3.1 Plumage scoring
The hens varied greatly in their plumage cover; some had complete
coverage and some were very feather-pecked. This may affect the
metabolic rate of individuals due to that plucked individuals do not have

6
the same amount of insulation as hens with full plumage. The lack of
insulation may thus result in a higher BMR value because of the extra
metabolic effort needed to maintain a normal, stable body temperature. I
therefore scored the plumage of all hens in categories 1 – 4 in a
descendent scale where 1was scored as having full, or close to full
plumage, and 4 being almost completely plucked on the neck, back and
wings.
3.4 Behavioural responses
Different behavioural responses were recorded in personality assays
when the birds were younger, at 34 and 40 weeks of age. These
observations were conducted by Hanne Thorpe as part of her master
thesis (Thorpe 2013). In a novel arena test, just after being introduced to
the arena, ‘latency to walk’ was recorded as a measure of nervousness,
and ‘number of movements’ in the arena was used as a measure of
activity. Variation in ‘vigilance’ and ‘foraging’ among individuals were
quantified by the time a bird spent being alert or foraging, respectively. A
novel object test was used to quantify variation in neophobia by recording
‘latency to first head movement’ and ‘latency to stand’ in a tonic
immobility test, were used as two measures of fearfulness. In a startle
test, the ‘instant response’ and ‘vigilance’ after the simulated predator
attack had occurred were used as measures of how the birds handle
stressful situations. See Thorpe (2013) for further details on the
behavioural responses recorded.
3.5 Calculations and statistical analysis
Variation in O2-consumption per unit of time of each individual (VO2)
was calculated using a customised LabView programme and based on the
values of each individual from the in- and out-respirometer oxygen
concentrations and air flow used. The program averaged the oxygen
concentrations from the last minute in each respirometer in every 15
minute cycle. This way, a full trial of 16 h provided 64 measurements of
metabolic rate for each individual. To get the basal metabolic rate of an
individual, mean values were calculated from the four lowest consecutive
values for each individual. This represents the hour where each individual
had the lowest metabolic rate during the night and is here used as the
individuals’ basal metabolic rate. These basal metabolic rate values can,
after adjusting for mass-differences, be interpreted as metabolic rate in ml
of O2 h-1
g-1
. To obtain the mass-specific BMR, the individual metabolic
rate values were divided by the individual’s weight after completion of a
trial, id est at a time when the gastrointestinal tracts would be almost
empty.

7
Variation in BMR explained by sex was investigated using a Mann-
Whitney U test. To investigate how variation in the plumage scoring of
hens might relate to variation in BMR, a one-way ANOVA was used.
Categories 2 and 3 were pooled due to low sample sizes. Category 1 was
referred to as ‘full plumage’, category 2 and 3 as ‘intermediate’ and
category 4 as ‘plucked’.
To compare behavioural responses and BMR independent of the observed
sex differences, sex-centred mass-specific BMR was calculated for all
individuals. This was done by calculating the mean mass-specific BMR
for each sex and subtracting this mean from each individual mass-specific
BMR.
The behavioural responses used to correlate with the BMR values of
individuals, were from the same individuals, but from when it was at an
age of 40 weeks (Thorpe 2013). To determine which behaviours where
more consistent within individuals, and to further correlate with
metabolic rate, each behaviour was correlated within individuals between
responses obtained at 34 and 40 weeks of age, by the use of Spearman
rank correlations. Those behaviours that had the highest correlation
coefficient between the two were the most interesting to investigate, since
this showed consistency in behaviours suggesting that there is an
underlying constraint (e.g. BMR).
Correlations between mass-specific BMR and the morphological
measures comb length, comb height and tarsal length were analysed
though independent Pearson correlations.
Spearman rank correlations were conducted in Statistica 10, all other
analyses were conducted in Minitab 16.
4 Results
4.1 Sex differences and plumage score
There was a great difference in mass-specific BMR between the sexes;
roosters had a lower BMR compared to hens (mean ± standard error (SE);
roosters, 0.610 ± 0.085 ml of O2 h-1
g-1
; hens; 0.818 ± 0.145 ml of O2 h-1
g-1
, P < 0.01). In addition, hens had a larger intra-sex individual variation
in their mass-specific BMR in comparison to the roosters (range
minimum to maximum: hens, 0.637 - 1.153 ml of O2 h-1
g-1
; roosters,
0.488 - 0.844 ml of O2 h-1
g-1
). This larger range in mass-specific BMR of
hens could in principle be explained by the larger spread in plumage
variation among the hens, compares to among the roosters (where all had
full plumage). Indeed, I found that hens that were plucked had a

8
significantly higher mass-specific BMR than hens of full or intermediate
plumage (Figure 1, F = 7.90, P < 0.01).
Figure 1. Mass-specific BMR among Red Junglefowl hens of different plumage scores (mean ± SE; full plumage: 0.728 ± 0.069, intermediate: 0.735 ± 0.091, plucked: 0.940 ± 0.133; full plumage; N=5, intermediate; N=5, plucked; N=7).
Due to the significant differences between plucked hens and hens with
full or intermediate plumage, the plucked hens were removed from the
data when comparing variation in mass-specific BMR between the sexes.
Removing these hens from the data elucidated sex differences in BMR
without the values being affected by the thermoregulatory effects that the
lack of insulation may have had. This sex comparison again showed that
roosters had a significantly lower mass-specific BMR than hens (Figure
2, U = 155.0, P < 0.01).
0,5
0,75
1
Full plumage Intermediate Plucked
Plumage score
Mas
s-sp
ecif
ic B
MR
(O
2 h
-1 g
-1)

9
Figure 2. Mass-specific basal metabolic rate (mean ± SE; roosters: 0.604 ± 0.021 ml of O2 h
-1 g-1; hens: 0.732 ± 0.076 ml of O2 h-1 g-1) in female and male
Red Junglefowl after the removal of feather pecked hens from the data. N=16 for roosters and N=10 for hens.
4.2 Relationships between variation in behaviour and BMR
The behavioural response assays involved four different types of tests
(novel arena, novel object, startle and tonic immobility) with a number of
different behaviours observed in each test. Some of these behavioural
responses showed consistency over time, but most did not (Table 1, see
Thorpe 2013 for further details).
0
0,2
0,4
0,6
0,8
1
Females Males
Mas
s-sp
ecif
ic B
MR
(O
2 h
-1 g
-1)
10
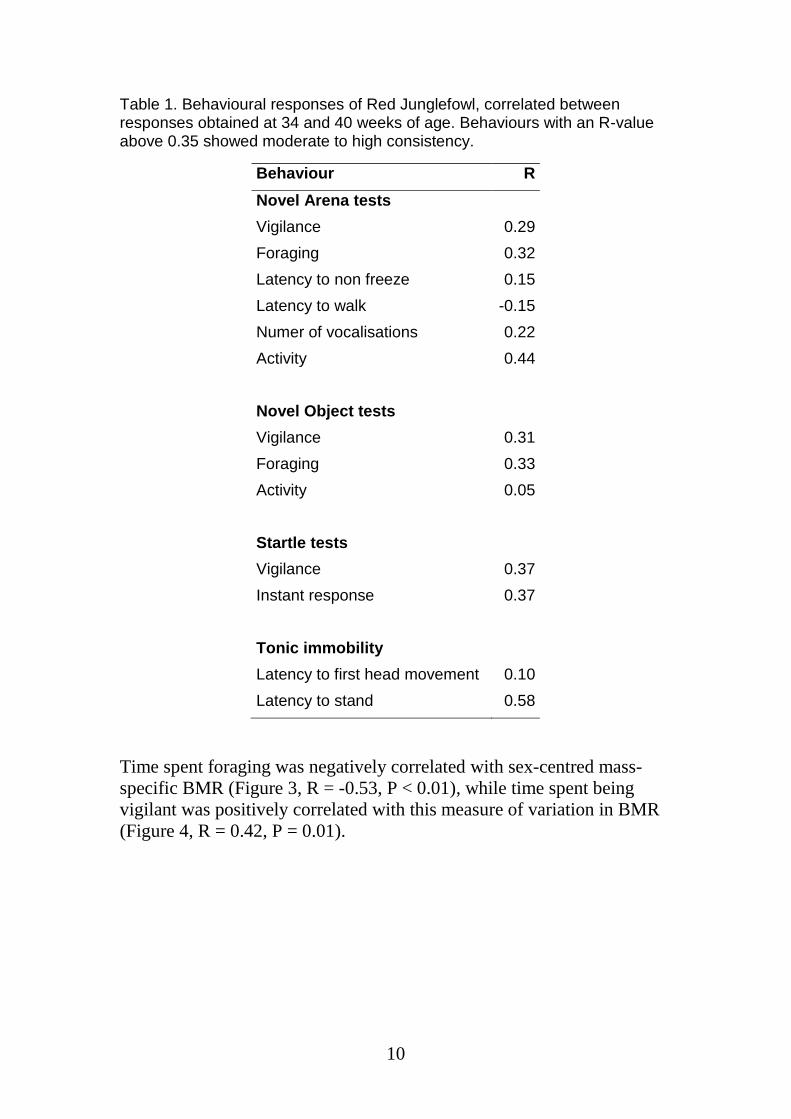
Table 1. Behavioural responses of Red Junglefowl, correlated between responses obtained at 34 and 40 weeks of age. Behaviours with an R-value above 0.35 showed moderate to high consistency.
Behaviour R
Novel Arena tests
Vigilance 0.29
Foraging 0.32
Latency to non freeze 0.15
Latency to walk -0.15
Numer of vocalisations 0.22
Activity 0.44
Novel Object tests
Vigilance 0.31
Foraging 0.33
Activity 0.05
Startle tests
Vigilance 0.37
Instant response 0.37
Tonic immobility
Latency to first head movement 0.10
Latency to stand 0.58
Time spent foraging was negatively correlated with sex-centred mass-
specific BMR (Figure 3, R = -0.53, P < 0.01), while time spent being
vigilant was positively correlated with this measure of variation in BMR
(Figure 4, R = 0.42, P = 0.01).

11
Figure 3. Correlation between time spent foraging during novel arena test and sex-centred mass-specific basal metabolic rate in Red Junglefowl.
Figure 4. Correlation between time spent being vigilant during novel arena test and sex-centred mass-specific basal metabolic rate in Red Junglefowl.
When looking at the sexes separately, roosters and hens show similar
patterns in foraging and vigilance (Figure 5 and 6).
0
25
50
75
100
-0,2 -0,1 0 0,1 0,2 0,3 0,4
Fora
gin
g (p
erce
nt
of
tim
e)
Gender-centred mass-specific BMR
0
25
50
75
100
-0,2 -0,1 0 0,1 0,2 0,3 0,4
Vig
ilan
ce (
per
cen
t o
f ti
me)
Gender-centred mass-specific BMR

12
0
25
50
75
100
0,5 0,6 0,7 0,8 0,9 1 1,1 1,2
Fora
gin
g
Mass-specific BMR
0
25
50
75
100
0,5 0,6 0,7 0,8 0,9 1 1,1 1,2
0
25
50
75
100
0,5 0,6 0,7 0,8 0,9 1 1,1 1,2
VIg
ilan
ce
Mass-specific BMR
0
25
50
75
100
0,5 0,6 0,7 0,8 0,9 1 1,1 1,2
Vig
ilan
ce
Mass-specific BMR
Figure 5. The relationship between time spent foraging during novel arena test and basal metabolic rate in Red Junglefowl. Roosters = black diamonds, hens =open diamonds.
Figure 6. The relationship between time spent being vigilant during novel arena test and basal metabolic rate in Red Junglefowl. Roosters = black diamonds, hens =open diamonds.

13
Variation in foraging and vigilance among individuals was strongly,
negatively correlated (R = -0.90, P < 0.05) explaining the opposing
relationships between the two behaviours and variation in BMR.
For other behaviours investigated, the relationship with sex-centred mass-
specific BMR were non-existing or weak (Table 2). Table 2. Correlations between behavioural responses and sex-centred mass-specific BMR in Red Junglefowl. (Correlations that show a significant relationship between sex-centred mass-specific BMR and behavioural responses are marked with an asterisk *.)
Behaviour R P
Novel Arena tests
Vigilance 0.42 0.01*
Foraging -0.53 0.001*
Latency to non-freeze -0.05 0.80
Latency to walk 0.16 0.37
Number of vocalisations 0.05 0.79
Activity
0.05 0.80
Novel Object tests
Vigilance 0.42 0.02*
Foraging -0.42 0.01*
Activity
-0.03 0.87
Startle tests
Vigilance 0.30 0.09
Instant response
-0.05 0.79
Tonic Immobility tests
Latency to first head movement -0.26 0.14
Latency to stand -0.08 0.66
4.3 Weight loss, tarsal length and comb size
The mean body weight of the roosters after they were taken out of the
chambers was 1190.0 ± 70.3 g (mean ± SE). Thus they had lost on
average 4.1 ± 1.2 % of their weight from before the trial started. Out of

14
this weight loss, approximately 40 % was due to defecation. This means
that the roosters lost 2.3 ± 0.5 % of their body weight during the 16 h
trial. The mean body weight of the hens after they were taken out of the
chambers was 796.2 ± 94.9 g. They had lost on average 6.9 ± 2.5 % of
their weight from before the trial started. Out of this weight loss
approximately 50 % was due to defecation. This means that the hens had
lost an average of 3.3 ± 1.8 % of their body weight during the 16 h trial.
There were large differences in comb length, comb height and tarsal
length between the sexes (Table 3). However, in neither sex were any of
these trait related to variation in mass-specific BMR (hens, R = 0.02, P =
0.94; roosters, R = 0.03, P = 0.92; comb length: hens, R = -0.13, P = 0.63;
roosters, R = -0.41, P = 0.12; comb height: hens, R = 0.07, P = 0.937;
roosters, R = -0.28, P = 0.30). No morphological measures showed any
relationship with BMR (Rs < 0.2, P > 0.2).
Table 3. Variation in morphological measures of Red Junglefowl roosters and hens. (Values are given as mean ± standard error).
Comb length
(mm)
Comb height
(mm)
Tarsal length
(mm)
Roosters 90.7 ± 6.7 49.8 ± 6.0 72.2 ± 3.1
Hens 34.2 ± 5.8 15.6 ± 3.7 60.2 ± 3.2
5 Discussion
This study found that hens have a higher mass-specific BMR than
roosters, but also that certain behavioural responses scored in personality
assays correlated with variation in BMR combined for the two sexes.
A reason for the hens’ higher BMR compared to the roosters could be due
to egg production. When an egg is produced, new cells are formed and
this is a metabolically costly process. According to Wolfenson and co-
workers (1978), a laying hen produces an egg weighing 50-70 g during a
short laying cycle. Out of the egg’s weight, 25-35 g of albumen and 5-6 g
of shell are produced during this short period. Out of the hen’s body
weight, this daily production is equivalent to 1.5 % (Wolfenson et al.
1978). Empirical studies have shown that metabolic rate is increased
during the production of eggs (Nilsson and Råberg 2001, Vezina et al.
2006). The increase in metabolic rate during egg laying is individual and

15
varies between 16-27 % (Vezina et al. 2006), but is proportional to egg
size; it is more costly to produce a larger egg and maintain larger oviducts
(Nilsson and Råberg 2001). Thus, the metabolic cost of egg production
may be a contributing factor to the hens’ overall higher mass-specific
BMR in comparison to the roosters. Previous studies on Red Junglefowl
have also shown that roosters have a lower BMR than hens, in support of
the findings in my study (Hammond et al. 2000).
Recent studies shows that feather pecked hens consume more food than
less feather pecked hens (Su et al. 2006, de Haas et al. 2010). The
increased food consumption is thought to be the consequence of an
increase in heat production, which is effected by various factors such as
BMR, plumage cover and physical activity (Su et al. 2006). This
indicates that a feather pecked hen with low plumage-cover has less
insulation and therefore must increase its’ BMR to increase the heat
production, which increases the energy requirement and therefore also
food consumption. This is, in some ways, in contradiction to the findings
of my study, which show that feather pecked hens forage less than hens
with full plumage. On the other hand, my study supports the findings that
feather pecked hens have a higher BMR than hens with full plumage and
that this indicates that the higher BMR of the feather pecked hens is due
to lack of insulation.
No morphological measures showed any link to variation in mass-specific
BMR, suggesting that only mass was of importance in explaining
variation in metabolic rate.
Not all behaviours showed a significant relationship with BMR; some of
these behaviours were not correlated between 34 and 40 weeks of age,
thus no relationships were predicted with BMR.
Careau and co-workers (2008) hypothesised two different mechanistic
models of how variation in BMR and activity may be related, within
individuals. The models are called ‘the performance model’ and ‘the
allocation model’ (Careau et al. 2008). The idea for the performance
model comes from aerobic-capacity model for evolution of endothermy
and suggests that an increased activity level leads to an increase in
maximal aerobic metabolic rate, which in turn leads to an increase in
RMR/BMR (Careau et al. 2008, Nespolo et al. 2011, Careau and Garland
2012). This means that the performance model predicts a positive
relationship between BMR and activity because an individual with higher
BMR is able to support a higher activity level (Careau et al.2008, Careau
and Garland 2012). In contrast to the performance model, the allocation
model assumes that an animal has a fixed amount of energy (Careau et al.
2008, Careau and Garland 2012). This means that an energetic trade-off
16
must occur between competing energy requiring processes such as BMR
and activity. The trade-off that occurs means that the allocation model
predicts a negative relationship between BMR and activity (Careau et al.
2008, Careau and Garland 2012). Ergo, an animal with low BMR has
more energy to spend on being active. Both the performance model and
the allocation model are supported by the literature (see references in
Careau et al. 2008, Careau and Garland 2012).
In the discussion of personality and variation in metabolic rate by Careau
and co-workers, activity is defined as an individual’s physical activity in
terms of muscular movement leading to locomotion (Reale et al. 2007,
Careau and Garland 2012). I therefore consider foraging as recorded in
the birds I measured metabolic rate on, as activity, since the birds move
around in their search for food (thus performed physical activity leading
to locomotion). The results from my study show that sex-centred mass-
specific BMR and foraging are negatively correlated, which means that
my results support the allocation model. The birds with high BMR have
less energy to spend on foraging because of the energetic trade-off and
therefore spend less time on food search. On the other hand, the birds
with low BMR have more energy to allocate to other energy-demanding
activities such as foraging and can therefore spend more time searching
for food. My study also showed a positive relationship between sex-
centred mass-specific BMR and how much time a bird spent being
vigilant. However, I do not consider vigilance as an energy-demanding
activity, hence; it cannot be applied to these models. Although, this
positive relationship was expected; birds that spend more time foraging
spend less time being vigilant and vice versa. As suggested by Sih and
co-workers (2004) and later by Biro and Stamps (2008), correlations
among behavioural traits typically exist. An individual that is considered
to be active and spends a lot of time foraging might then be expected to
spend less time being vigilant and by extension, this individual may be
considered as bolder, compared to an individual that spend more time
being vigilant and less time searching for food. As predicted by the
allocation model, this bolder, more active individual has a lower BMR.
Due to the energetic trade-off, this individual has more energy to allocate
to other energy demanding processes, which is why the individual is
more active. Of course, this relationship can be turned on its head as well;
an individual that spends less time foraging and more time being vigilant
may be considered as shyer and less active. This shyer, less active
individual has a high BMR, which is why it has less energy to spend on
activity, since activity is an energy demanding process.
Although this study has contributed to determining the relationship
between personality traits and BMR, more empirical studies are still

17
needed to fully understand the relationship between behaviour,
metabolism and life history-traits.
6 Conclusion
My findings show that there is a correlation between basal metabolic rate
and personality traits in Red Junglefowl. This correlation suggests that
there may be physiological constraints underlying behavioural plasticity.
However, the nature of this relationship needs to be investigated further
for us to better understand the underlying mechanism of variation in
animal personality.
7 Acknowledgments
I would like to thank my supervisors Hanne Løvlie and Jordi Altimiras
for their assistance and guidance throughout the study. I would also like
to thank Lejla Bektic for her help with handling the birds.
8 References
Biro P and Stamps J (2008) Are animal personality traits linked to life-
history productivity? Trends in Ecology and Evolution. 23, 361-368.
Biro P and Stamps J (2010) Do consistent individual differences in
metabolic rate promote consistent individual differences in behavior?
Trends in Ecology and Evolution. 25, 653-659.
Careau V and Garland Jr. T (2012) Performance, Personality, and
Energetics: Correlation, Causation, and Mechanism. Physiological and
Biochemical Zoology. 85, 543–571.
Careau V, Thomas D, Humphries MM and Reale D (2008) Energy
metabolism and animal personality. Oikos. 117, 641-653.
Careau V, Thomas D, Pelletier F, Turki L, Landry F, Garant D and Reale
D (2011) Genetic correlation between resting metabolic rate and
exploratory behaviour in deer mice (Peromyscus maniculatus). Journal of
evolutionairy biology. 24, 2153-2163.
Dall S, Houston A and McNamara J (2004) The behavioural ecology of
personality: consistent individual differences from an adaptive
perspective. Ecology Letters. 7, 734–739.

18
Deerenberg C, Overkamp G, Visser G and Daan S (1998) Compensation
in resting metabolism for experimentally increased activity. Journal of
Comparative Physiology B. 168, 507-512
Eitan Y, Soller M and Rozenboim I (1998) Comb size and estrogen levels
toward the onset of lay in broiler and layer strain hens under ad libitum
and restricted feeding. Poultry Science. 77, 1593–1600
Gosling S (2001) From mice to men: What can we learn about
personality from animal research? Psychological Bulletin. 127, 45-86.
de Haas E, Nielsen B, Buitenhuis A, Rodenburg T (2010) Selection on
feather pecking affects response to novelty and foraging behaviour in
laying hens. Applies Animal Behaviour Science. 124, 90-96.
Hammond K, Chappell M, Cardullo R, Lin R-S, Johnsen T (2000) The
mechanistic basis of aerobic performance variation in red junglefowl.
Journal of Experimental Biology. 203, 2053-2064.
Kane S, Garland Jr. T and Carter P (2008) Basal metabolic rate of aged
mice is affected by random genetic drift but not by selective breeding for
high early-age locomotor activity or chronic wheel access. Physiological
and Biochemical Zoology. 81, 288–300.
Killen S, Marras S and McKenzie D (2011) Fuel, fasting, fear: routine
metabolic rate and food deprivation exert synergistic effects on risk-
taking in individual juvenile European sea bass. Journal of Animal
Ecology. 80, 1024–1033.
Lantová P, Zub K, Koskela E, Šíchová K and Borowski Z (2011) Is there
a linkage between metabolism and personality in small mammals? The
root vole (Microtus oeconomus) example. Physiology & Behavior. 104,
378–383.
Martins C, Castanheira M, Engrola S, Costas B and Conceicao L (2011)
Individual differences in metabolism predict coping styles in fish.
Applied Animal Behaviour Science. 130, 135–143.
Mathot K, Godde S, Careau V, Thomas D and Giraldeau L-A (2009)
Testing dynamic variance-sensitive foraging using individual differences
in basal metabolic rates of zebra finches. Oikos. 118, 545-552.
McNab B (1997) On the utility of uniformity in the definition of basal
rate of metabolism. Physiological Zoology. 70, 718-720.
19
McNab B (2008) An analysis of the factors that influence the level and
scaling of mammalian BMR. Comparative Biochemistry and Physiology
Part A: Molecular & Integrative Physiology. 151, 5-28.
Nespolo R, Bacigalupe L, Figueroa C, Koteja P, and Opazo J (2011)
Using new tools to solve an old problem: the evolution of endothermy in
vertebrates. Trends in Ecological Evolution. 26, 414–423.
Nilsson J and Råberg L (2001) The resting metabolic cost of egg laying
and nestling feeding in great tits. Oecologia 128, 187-192.
Reale D, Garant D, Humphries, MM, Bergeron P, Careau V and
Montiglio P-O (2010) Personality and the emergence of the pace-of-life
syndrome concept at the population level. Philosophical Transactions of
the Royal Society B. 365, 4051–4063.
Reale D, Reader S, Sol D, McDougall P and Dingemanse N (2007)
Integrating animal temperament within ecology and evolution. Biological
Reviews. 82, 291–318.
Sih A, Bell A, and Johnson J (2004) Behavioral syndromes: an ecological
and evolutionary overview. Trends in Ecology and Evolution. 19, 372-
378.
Stamps J (2007) Growth-mortality tradeoffs and ‘personality traits’ in
animals. Ecology Letters. 10, 355–363.
Su G, Kjaer J, Sørensen P (2006) Divergent Selection on Feather
Pecking Behavior in Laying Hens Has Caused Differences Between
Lines in Egg Production, Egg Quality, and Feed Efficienct. Poltry
Science. 85, 191-197
Thorpe H (2013) The ontogeny of personality in red junglefowl (Gallus
gallus). Master’s thesis, Linköping University LiTH-IFM- Ex13/2777SE.
Vezina F, Speakman J and Williams T (2006) Individually variable
energy management strategies in relation to energetic costs of egg
production. Ecology. 87, 2447-2458.
Wikelski M, Lynn S, Breuner J, Wingfield J andKenagy G (1999) Energy
metabolism, testosterone and corticosterone in white-crowned sparrows.
Journal of Comparative Physiology A. 185, 463-470.
Wolfenson D, Berman A, Frei Y and Snapir N (1978) Measurement of
blood flow distribution by radioactive microspheres in the laying hen
20
(Gallus domesticus). Comparative Biochemistry and Physiology A. 61A,
549-554.