The Relationship Between Organisational Culture, Strategy ...
66
THE RELATIONSHIP BETWEEN ORGANISATIONAL CULTURE, STRATEGY AND PERFORMANCE - A SURVEY OF COMPANIES LISTED IN THE NAIROBI STOCK EXCHANGE OPANDE OGOT D61/P/7977/00 ^wsfiaiTiy of A RESEARCH PROJECT SUBMITTED IN PARTIAL FULFILMENT OF THE REQUIREMENTS FOR THE AWARD OF THE DEGREE OF MASTER OF BUSINESS ADMINISTRATION, SCHOOL OF BUSINESS, UNIVERSITY OF NAIROBI 2006
Transcript of The Relationship Between Organisational Culture, Strategy ...
THE RELATIONSHIP BETWEEN ORGANISATIONAL CULTURE, STRATEGY
AND PERFORMANCE - A SURVEY OF COMPANIES LISTED IN THE NAIROBI
STOCK EXCHANGE
OPANDE OGOT D61/P/7977/00
wsfiaiTiy of
A RESEARCH PROJECT SUBMITTED IN PARTIAL FULFILMENT OF THE REQUIREMENTS FOR THE AWARD OF THE DEGREE OF MASTER OF BUSINESS ADMINISTRATION, SCHOOL OF BUSINESS, UNIVERSITY OF NAIROBI
2006
DECLARATION
This project is my own original work and has not been submitted for a degree in any other university
The project has been submitted with my approval as the university supervisor
2

DEDICATION
To the Almighty Father, for his unpredictable, unique, and very able hand that
uplifted me throughout my education.
Many thanks to my immediate family - my wife Patih, daughter Evette and son
Elvis for their unwavering love, support and cooperation during the many evenings
and week ends, and in many a cases, late night times I was not there for them in
order to attend to my stiff work and study schedules. Special thanks to Pat for her
financial support that started me off in pursuit of this important level of my studies.
May the Almighty abundantly bless Mrs O. Sassi, through the Save the Children
Fund of Starehe Boys' Centre and School and the Christian Children's Fund (CCF),
through Kendu Bay Self Help Project, that co- sponsored my secondary and high
school education. Thank you very much!
To my mum, Angelina, whose perseverance, and hard work, kept me orl track, and,
Agus, for his encouragement that kept me working harder. To my brother, Gabby,
for academic rivalry since secondary days.
3
ACKNOWLEDGEMENTS
My special gratitude goes to Prof. Peter K'obonyo, under whose able guidance,
incisive critique of my ideas and proposals helped me in researching this very
demanding area. His contributions challenged me to seek for more, and in so doing,
enabled me to successfully complete this technical piece. Many thanks Professor and
I wish you the very best in your academic and other endeavours.
This piece of work was also supported by the contributions and critique by a number
of lecturers in the Department of Business Administration. Special recognition goes
to Mr Maalu, Ms Otttbok, and Dr Ogutu for energizing me to develop strong
interest in the area of strategy and support in undertaking research in this area of
strategic management.
A number of my classmates were very supportive during our precursor classes and
group presentations. In this aspect, Messers Bashir, Ouma, and Gitonga S. M were,
great team players that always made our teams stand out of the crowds.
A number of people were very special in the preparation of data collection
instruments, the data collection, summary, and analysis and their efforts are
sincerely appreciated. Many thanks to the Centre for Independent Research team,
particularly Akal, Paul and Jeremiah for processing the primary data and Mr
Nduati for collecting the secondary data from the Nairobi Stock Exchange, my
colleagues - Judy Macharia's dedication and able efforts in typing, editing and
printing my private work at odd times in the office; Liz Njue, for supporting her,
and Catherine Kagwe for dropping and sending the questionnaires by securicor.
Special thanks to Erique, for his editing assistance at short notice. Finally, thank you
to all those who were able to assist in the achievement of this goal, but whom I
cannot all list their contribution in this page. May God guide you in all your
endeavours.
4
TABLE OF CONTENTSDECLARATION.......................................................................................................................................................... 2
DEDICATION............................................................................................................................................................. 3
ACKNOWLEDGEMENTS....................................................................................................................................... 4
ABSTRACT.................................................................................................................................................................. 7
CHAPTER ONE - INTRODUCTION.................................................................................................................... 9
1.1 Background.....................................................................................................................................................91.1.1 Organisation's Culture.............................................................................................................................. 91.1.2 Cultural Types............................................................................................................................................ 91.1.3 Concept of Strategy.................................................................................................................................. 101.1.4 Types of Strategy.......................................................................................................................................101.1.5 Organisation's Performance.................................................................................................................... 101.1.6 Link between Culture, Strategy and Performance.............................................................................. 111.1.7 Uniqueness of Firms Listed in the Nairobi Stock Exchange..............................................................11
1.2 Statement of the Research Problem........................................................................................................ 121.3 Objectives of the study...............................................................................................................................141.4 Significance of the Study........................................................................................................................... 14
CHAPTER TWO - LITERATURE REVIEW ...................................................................................................... 15
2.1 Corporate Strategy......................................................................................................................................152.2 Corporate Culture....................................................................................................................................... 202.3 Organisation's Performance.....................................................................................................................242.4 Corporate Strategy, Culture and Performance.................................................................................... 27
CHAPTER THREE - RESEARCH METHODOLOGY................................................................................... 31
3.1 Introduction................................................................................................................................................. 313.2 Research Design.... ..................................................................................................................................... 313.3 Population.....................................................................................................................................................313.4 Data Collection............................................................................................................................................ 32
CHAPTER FOUR - DATA ANALYSIS AND INTERPRETATIONS........................................................33
4.1 Data Analysis............................................................................................................................................... 334.2 Culture Types.............................................................................................................................................. 344.3 Strategy Types............................................................................................................................................. 364.4 Culture, Strategy Types and Performance.............................................................................................42
CHAPTER FIVE - DISCUSSION, CONCLUSIONS AND RECOMMENDATIONS..........................51
5.1 Introduction................................................................................................................................................. 515.2 Discussion and Conclusions..................................................................................................................... 515.3 Challenges and Recommendations........................................................................................................ 54
5
LIST OF TABLES AND FIGURES
Table 1.1: Dominant Culture Types.......................................................................................35
Table 1.2: Frequency of the Extent of Culture Consideration........................................ 36
Table 1.3: Strategy Types Analysis Schedule..................................................................... 36
Table 1.4 - Corporate Strategy Practices............................................................................ 38
Table 1.5: Share Prices............................................................................................................. 40
Table 1.6: Culture, Strategy Types, Performance, and Performance Ranking............. 42
Figure 1.1 - Company Average Share Prices - September 2004 to September 2005...43
Figure 1.2: Share Price Comparison - Agriculture Sector - Sept 04 to Sept 05........... 44
Figure 1.3: Monthly Average Share Prices - Commercial and Service Sector - Sept 04 to Sept 05 ................................................................................................................................... 45
Figure 1.4: Monthly Average Share Prices - Finance and Investment - Sept 04 to Sept 05................................................................................................................................................. 47
Figure 1.5 - Monthly Average Share Prices - Industrial and Allied Sector - Sept 04 to Sept 05........................................................................................................................................48
Figure 1.6: - Monthly Average Share Prices - Alternative Investment Market Segment - Sept 04 to Sept 05 .................................................................................................49
6
ABSTRACT
This researcher aimed at establishing the relationship, if any, between culture,
strategy and performance of firms listed at the Nairobi Stock Exchange. Available
literature showed that most corporate leaders understand that a clear and directed
strategy is needed to achieve business success. However, they often disregard the
role of culture with regards to strategy, yet the two factors are critical for the success
of an organisation. The researcher noted that in order to study these two factors and
the third one, performance, the ideal population was that which espouse known
performance measure variables such as share prices, price index, and public
declaration of their performance. The companies listed at the stock exchange, not
only met these considerations, but also were known to be bound by certain
minimum requirements to qualify for listing. Those requirements would generally
require that the firms undertake certain culture and strategy choices geared towards
the attainment of high performance.
Whereas a number of studies had been undertaken in the certain aspects of culture
and strategy types, strategic planning, strategy formulation and implementation,
many of such studies, had left a number of research gaps. Many of them, such as
Gregory (2003),Frese et al (2003), Aosa (1992), Mahindra (2002), Kariuki (2001) were
either broad or only addressed certain aspects of culture or strategy. None of these
studies considered the relationship between the culture, strategy choices and their
resultant influence on performance. The researcher set to find this relationship.
The researcher had two objectives, first, to establish the extent to which firms listed
at the Nairobi Stock Exchange consider organisation's culture in their strategy, and
second, establish the relationship between corporate culture types, strategy types
and performance by these companies.
The researcher used a survey of all the 48 firms that were listed at the Nairobi Stock
Exchange as at 15th September 2005. Likert Scale questionnaires with questions
framed on the basis of pre-designed operational definitions of the Schneider's four
7
culture types - control, collaboration, cultivation and competence; and Miles and
Snow's strategy types of defender, prospector, analyser and reactor, were designed,
and used, in collecting primary data from the company managers responsible for
planning and strategy, human resources or finance. This was aimed at collecting
relevant data. Secondary data on companies share prices for the previous thirteen
months were then collected to obtain the share price for the first Wednesday of the
month. This was to reduce costs of the research while at the same time deriving the
share prices over a period of high performance and that long enough to observe a
trend. The average thirteen - months share prices were used to rank the companies
from number one to sixteen as these was the total number that participated.
The primary data was analysed using the SPSS and a chi - square test was run to
test the relationship between culture, strategy and performance. To do this, a null
hypothesis was set that, the choice of culture and strategy types do not determine
performance levels, and the alternative hypothesis was that they do determine
performance.
The researcher observed that the chi - square test could not be relied on as the
counts, that is, the observed frequencies, were less than the minimum required count
of 5 for the correct use of the chi - square statistic. Consequently, the researcher used
tabular analysis of the culture, strategy and average share prices to determine the
relationship.
The first objective of the study was established as the researcher found that 94.5 per
cent of the firms listed at the Nairobi Stock Exchange considered culture in their
strategy. It was not, however, noted that the response was rather low to be able to
determine the relationship and that whereas the relationship existed to some extent,
there were no clear and consistent observation of the relationship between culture,
strategy and performance. Hence, it was noted that some factors other than the
culture-strategy choices could be the main contributors to performance of these
companies.
8
CHAPTER ONE - INTRODUCTION
1.1 Background
Competitiveness and standards of performance are determined not just within a
particular industry or sector. Customer expectations of service standards, for
example, on speed or reliability, become universal benchmarks crossing all
industries and public services. It is this need for increased competitiveness and
demanding shareholders who expect to have the highest performance and therefore
returns to their investments, that strategy to attain these expectations is becoming a
popular area for researchers, teachers and students of strategic management
(Johnson and Scholes, 2002).
1.1.1 Organisation’s Culture
Various scholars have defined the concept of organisation's culture. Hofstede (2003)
argues that most people who write about organisation's culture would probably
agree that it is: holistic, referring to a whole which is more than the sum of its parts;
historically determined, reflecting the history of the organisation; related to the
things anthropologists study like rituals and symbols; socially constructed, created,
and preserved by the group of people who together form the organisation; soft,
(although Peters and Waterman assure their readers that 'soft is hard' ); and difficult
to change.
1.1.2 Cultural Types
Schneider (1994) indicates that there are four core culture types, namely: control,
collaboration, competence and cultivation. He characterizes control culture by
certainty and predictability; collaboration culture type primarily by synergy;
competence culture, with distinction; and lastly, cultivation culture with enrichment.
9
1.1.3 Concept of Strategy
The concepts and theories of strategy have their antecedents in military strategy.
Strategy is about winning (Grant, 1998). According to Johnson and Scholes (2002)
strategy is the direction and scope of an organisation over the long term, which
achieves advantage for the organisation through its configuration of resources
within a changing environment and fulfils stakeholders' expectations. Strategy is a
unifying theme that gives coherence and direction to the actions and decisions of an
individual or organisation.
1.1.4 Types of Strategy
Miles and Snow (1978) identify four strategy types that firms practice in order to face
their environmental challenges. These are defenders, prospectors, analyzers and
reactors strategy types. Defenders always focus on protecting their market segments
and tend to ignore developments outside these segments. Prospectors tend to
continually search for opportunities and experiment with potential responses to
emerging environmental factors. Analyzers use formalized structures and processes
to operate in both stable and evolving markets. Lastly, reactors are those
organisations that are often unable to effectively respond to environmental dynamics
because they lack a relevant strategy-structure relationship.
1.1.5 Organisation's Performance
The International Labour Organisation (2005) defines organisation performance as
"the achievement of high levels of performance, profitability and customer
satisfaction by enhancing skills and engaging the enthusiasm of employees". A
survey carried out by the International Labour Organisation in the United Kingdom,
joint commitment to a series of principles (the success of the enterprise, respect for
legitimate interests of different parties and building trust) and a number of practices
(flexible job design, quality related practices, direct participation in work - related10
decisions and representative participation on wider policy issues) have a positive
link with "employee attitudes and behaviour, internal organisation performance and
external criteria of sales and profits".
1.1.6 Link between Culture, Strategy and Performance
Most leaders understand that a clear and directed strategy is needed to achieve
business success, but the role of leadership and culture with regards to strategy is
often unappreciated. If leaders do not develop the skills necessary to execute a
strategy and corporate culture lacks the attributes necessary to support the strategy,
the strategy will fail. Assessing what your organisation has and developing what
your organisation needs is critical to achieve strategic objectives (HCG, 2005).
1.1.7 Uniqueness of Firms Listed in the Nairobi Stock Exchange
Capital markets foster the mobilisation of savings into productive investments by
providing an outlet for accumulated capital (savings and allocating the capital to
investments that bring the greatest value to the economy (CMA, 2005). In Kenya,
this role is performed by the Capital Markets Authority (CMA). It sets out
requirements to be met for a company to quality for listing at the Nairobi Stock
Exchange.
The requirements to be met before a company is listed at the Nairobi Stock Exchange
generally would ensure a majority of the quoted companies are not only high
performers but also probably adopting unique cultures and strategy types. Some of
these requirements include: recorded profits in at least two of the last three years
preceding the issue of the commercial paper or the corporate bond; attainment of
forty per cent or more of the ratio of funds generated from operations to total debt
for the three trading periods preceding the issue; adequacy of working capital for
both the issuer on its own and to the group and ensuring that the directors and
senior management of an applicant must have collectively appropriate expertise and
11 01s NA1HO*.,LS55RA£W
experience for the management of the group's business and that the details of such
expertise must be disclosed in the issue information memorandum (CMA, 2005).
It is therefore probable that companies listed at the Nairobi Stock Exchange may
adopt specific strategy and culture types to enable them meet these expectations by
the public, both existing and potential investors.
1.2 Statement of the Research Problem
The link between strategy, culture and performance cannot be underscored. A
number of studies have been carried out on strategy and performance but largely
out in different context from that of Kenya. Strategy is sensitive to context and time.
Lahey (2001) researched on the impact of strategic planning on organisation's
effectiveness and culture but did not consider financial performance, the four culture
types and also strategy types as postulated by Miles and Snow.
Gregory (2003) studied the impact of formal strategic planning on financial
performance in the food - processing sector. Whereas the results of the strategic
planning tools used in his study revealed a positive financial performance as
measured by the three-year pre-tax return on assets, he simply considered whether
the organisations practiced strategic planning and if this practice was related to
performance. His research was based on only the food - processing sector and he
therefore recommends a study on other sectors namely, manufacturing, service,
financial sectors as well. Blackburn (1989) researched on strategic and operational
planning uncertainty, and performance in small firms. His study also stressed on the
relationship between strategic planning and financial performance but omitted
culture and strategy types used. Again it considered only small firms
Close here in South Africa, Zambia and Zimbabwe, Frese, et al (2003) carried out
three different studies in each of the countries on the psychological action strategy
types as practiced by business owners of African - origin and their success levels.
12
These studies again did not unearth the culture types of the businesses and were
biased to entrepreneurs of African origin.
A number of studies have also been carried out here in Kenya. Aosa's (1992) research
was very broad as it covered strategic planning, strategy formulation and
implementation in large manufacturing companies in Kenya. He recommends
studies in specific areas. Mahinda (2002) studied the Influence of Culture on Human
Resource Practices by Manufacturing Firms Registered by the Kenya Association of
Manufacturers. She not only restricted her research to one industry but also
considered only the human resource aspects of strategic management. Furthermore,
she never compared culture versus strategy choices and their impact, if any, on
performance. Consequently, she observed that a further research adding incision
into culture and performance would perhaps improve research findings. Similarly,
Kariuki (2001) studied the aspects of culture and their effects on the marketing
strategies in the beverage industry in Kenya. Again this was industry specific and
neglected not only cross-industry analyses cognizance of the fact that culture of an
organisation is multidimensional. Furthermore, his study underscored performance
as the main driving force for strategy. It addressed the question: why do companies
in the beverage industry make strategic choices?
As has been noted by the high priests of strategy such as Andrews (1971) that
strategy is sensitive to context, what happens in the agricultural sector is likely to
differ from what happens in the manufacturing industry or financial sectors at any
given time. Strategy is also process sensitive. Research findings keep changing with
time such that what happened a year ago may not hold now. It is therefore evident
from the foregoing research literature that no previous study, at least in Kenya, has
explored the relationship between culture, strategy and performance. Even the
foregoing studies that were done in other parts of the world were carried out in
different environmental conditions and time and may need to be replicated in the
Kenyan environment. No doubt this study is very timely!
13

1.3 Objectives of the study
a) To establish the extent to which companies listed in the Nairobi Stock
Exchange consider organisation's culture in their strategy
b) To estabhsh the relationship between corporate culture types, strategy
types and performance.
1.4 Significance of the Study
a) To managers and strategic analysts - tire study will espouse a better
understanding of organisation's culture and strategy and their
relationship, if any, in the context of overall company performance.
b) To researchers and students of strategic management - the study will act
as a point of reference and further research
14
CHAPTER TWO - LITERATURE REVIEW
2.1 Corporate Strategy
Andrews (1971) defines strategy as the pattern of objectives, purposes or goals and
the major policies and plans for achieving these goals, stated in such a way as to
define what business the company is in, or is to be in, and the kind of company it is
or is to be. Strategy is the overall plan for deploying resources to establish a
favourable position (Grant 1998).
Strategy is how a business defines and attacks its short- and long-term goals. This
involves an internal and external analysis of the firm, an understanding of the firm's
competitive advantage and the design and execution of a strategy taking into
account the business's strengths and competitive advantages while mitigating risks
and threats. The primary purpose of strategy is to guide management decisions
toward superior performance through establishing competitive advantage.
All organisations are faced with the challenges of strategy development; some from
a desire to grasp new opportunities, others to overcome significant problems
(Johnson & Scholes, 2002). These scholars see strategy as being concerned with the
complexity arising out of ambiguous and non - routine situations with the
organisation - wide rather than operation - specific implications. Strategy
development involves understanding the competitive position of the firm, making
strategic choices and putting strategy into action.
Thompson (1997) found that many companies have no goals at all, other than cost
reduction, or the boss hides them in his head. He notes further that in order to be
successful, organisations must be strategically aware, must understand how
changes in their competitive environment - some of which they may have started,
and others to which they will have to react, - are unfolding.
In spite of a wide range of different models of strategy, a company requires a
strategy to make long run decisions on how to meet the customers' demand, how to15
tap new markets, how to distinguish themselves from their competitors, how to keep
relationship with their suppliers, employees and how to deal with challenges from
both inside and outside of the company.
Businesses operate in an ever-dynamic environment. They adjust and adapt to
environmental dynamism through a variety of strategic orientations. Strategy,
therefore, is instrumental to the survival of the firm. As Miles and Snow (1994)
indicated, firms that match their situation to the environment can improve their
performance, while those that do not court failure. The relationship between the firm
and its environment, in the strategy-making context, has two major dimensions.
First, the firm's basic mission or scope should match its environment. Second, it
should aim at having a competitive edge with other firms that are also trying to get
that match.
Strategies are formulated to adapt to, respond to, or shape the environment (Johnson
and Scholes 1999; Mintzberg 1994). With any significant change in the level of
uncertainty, a change in strategy is necessary to keep the organisation in harmony
with its environment. Environmental uncertainty plays a central role in strategy
formulation, for it affects not only the availability of resources to the firm and the
value of its competencies and capabilities, but also customer needs and
requirements, as well as the competition.
Corporate strategy can also be seen as simply how a business defines and attacks its
short- and long-term goals. This involves an internal and external analysis of the
firm, an understanding of the firm's competitive advantage and the design and
execution of a strategy taking into account the business's strengths and competitive
advantages while mitigating risks and threats (Musselman, 2005)
There are a number of strategy typologies and taxonomies in the strategic
management literature (see, for example, Miller and Friesen 1978; Abell 1980; Porter
1980; Chrisman, Hofer, and Boulton 1988; Segev 1989). However, the Miles and
Snow (1978), strategic orientation typology has been accepted as a robust description
16
of the strategic behaviour of firms trying to adapt to their uncertain environment. It
reflects a broad and holistic perspective to strategy conceptualization (Venkatraman
1989). It is widely adopted in strategy research Snow and Hrebiniak 1980; Shortell
and Jazac 1990; Ramaswamy et al. 1994; James and Hatten 1995).
Miles and Snow (1978) based on an in-depth cross-industry study of a relatively
small sample of large corporations, developed a theory that there are three superior
performing business types and all others are average or less than average. Their
theory holds that in order to be superior, there must be a clear and direct match
between the organisation's mission/values (their definition), the organisation's
strategies (their basic strategy set), and the organisation's functional strategies (their
characteristics and behaviour).
Miles and Snow (1978) suggest that organisations develop a systematic and
identifiable pattern of behaviour toward environmental adaptation. The major
elements of adaptation and the relationships among them are conceptualized by
what they call an "adaptive cycle" over time. The cycle embodies different business
strategies representing organisations' response to the competitive environment. An
organisation's strategy addresses three types of problems, which represent the
dimensions of the "adaptive cycle:" the entrepreneurial, the engineering, and the
administrative. The entrepreneurial problem relates to how an organisation orients
itself to the marketplace, that is, its market-product domain. The engineering
problem refers to the organisation's technical system, that is, technology and
processes used to produce its products and services. The administrative problem is
about how an organisation attempts to coordinate and implement its strategies, that
is, structure, control, and process issues.
Miles and Snow (1978) classify firms by their adaptive decision patterns into
prospectors, defenders, analyzers, and reactors. It is this Miles and Snow model of
the strategic orientation typology that I propose to use to identify the various
strategies as may be practiced by companies listed on the Nairobi Stock Exchange.
The four strategy types are explained below:
17

"Defenders are organisations which have narrow product-market domains, with top
managers having high expert in their organisation's limited area of operation but do
not tend to search outside their narrow domains for new opportunities." (Miles and
Snow, 1978, p. 29). A defender's basic strategies revolve around aggressive
maintenance of prominence within its chosen market segment, ignore developments
outside of this domain, penetrate deeper into current markets, and normally, growth
occurs cautiously and incrementally.
Corporate characteristics and behaviour of a defender include a single core
technology, often vertically integrated; updates current technology to maintain
efficiency; stable structure and process; dominant coalitions are finance and
production; planning is intensive, not extensive; promote from within; functional
structure; extensive division of labour and high degree of formalization; centralized
control; vertical information flows; simple and inexpensive coordination; and
managers evaluated on efficiency versus the past
"Prospectors are organisations which almost continually search for market
opportunities, and they regularly experiment with potential responses to emerging
environmental trends. Thus, these organisations often are the creators of change and
uncertainty to which their competitors must respond." (Miles and Snow, 1978, p. 29).
Their basic strategies include: broad domain, in a continuous state of development;
monitoring a wide range of environmental conditions, trends, and events; creation of
change in their industries; growth primarily from new markets and new products;
and uneven, spurt-like growth.
Prospector organisations are often not efficient; exhibit changing structure and
technology; frequent prototype production, multiple technologies normally
preferred in people not machines; have dominant coalitions in marketing and
research and development; key executives are likely to come from outside than
inside, and have a shorter tenure than defender's. Prospectors practice broad
planning, that is not intensive; have product based structure; less division of labour,18
low formalization; results-oriented controller; information flow to decentralized
decision-makers; have complex and expensive coordination; confront and resolve
conflict directly; and finally benchmark with similar organisations in managerial
appraisal organisations
"Analyzers are organisations which operate in two types of product-market
domains, one relatively stable, the other changing. In their stable areas, these
organisations operate routinely and efficiently through use of formalized structures
and processes. In their more turbulent areas, top managers watch their competitors
closely for new ideas, and then rapidly adopt those which appear to be the most
promising." (Miles and Snow, 1978, p. 29). Analysers basic strategy include a
mixture of products and markets, some stable, others changing; successful imitation
through extensive marketing surveillance; avid follower of change; and growth
normally occurs through market penetration; though it may also occur through
product and market development.
These companies exhibit dual technology as a core characteristic; moderate
efficiency; dominant coalition in marketing, applied research, and production; an
intensive and comprehensive planning:; a matrix, functional and product structure;
difficult control and must be able to trade off efficiency and effectiveness; a
coordination that is both simple and complex; managerial focus is dual efficiency
versus past, effectiveness versus similar organisations
"Reactors are organisations in which top managers frequently perceive change and
uncertainty occurring in their organisation's environments but are unable to respond
effectively. Because this type of organisation lacks a consistent strategy-structure
relationship, it seldom makes adjustments of any sort until forced to do so by
environmental pressures." (Miles and Snow, 1978, p. 29). The basic strategy common
in these organisations include, the failure by management to articulate a viable
organisation's strategy; or management articulates an appropriate strategy, but
technology, structure, and process are not linked to strategy appropriately; and/or
19

management adheres to a particular strategy-structure relationship that is not
relevant to the environment
2.2 Corporate Culture
The pattern of dynamic relationships at the organisation level is culture, which
explains why organisation culture is so powerful that its impact supersedes all other
factors (Kottler & Heskett, 1992). Culture, "how we do things around here in order to
succeed" is an organisation's way, identity, and pattern of dynamic relationships
reality. It has everything to do with implementation and how success is actually
derived. No management idea, no matter how good, will work in practice if it does
not fit the culture of the entity.
According to Pearce and Robinson (2003) organisation's culture is the set of
important assumptions (often unstated) that members of an organisation share in
common. An organisation's culture is similar to an individual's personality - an
intangible yet ever present theme that provides meaning, direction, and the basis of
action. Insightful leaders nurture key themes or dominant values within their
organisation that reinforce the competitive advantage they posses or seek, such as
quality, differentiation, cost, and speed.
Thompson and Strickland (1996) define an organisation's culture as the policies,
practices, traditions, philosophical beliefs, and ways of doing things. An
organisation's culture and associated values dictate the w ay decisions are m ade, the
objectives of the organisation, the type of competitive advantage sought, the
organisation structure and systems of management, functional strategies and
policies, attitudes towards managing people and information systems.
Mahinda (2002) states that organisations, just like people, have personalities and
attitudes. Company attitudes are manifested in how they handle their business. They
may be a rough and ready "let's get things done type of company, or one which is
rather bureaucratic and likes to do things strictly by the book". The attitudes of the
20
companies' employees are also part of their culture, and may have developed in
response to their treatment by the company over the years.
The most typical beliefs that shape organisation's culture include a belief in superior
quality and service, a belief in the importance of people as individuals, and a faith in
their ability to make a strong contribution, a belief in the importance of the details of
execution, "the nuts and bolts of doing the job well", a belief that customers should
reign supreme, et cetera (Pearce and Robinson, 2003).
Culture in the business environment can be seen by tangible things such as the
corporate management philosophy articulated in a mission statement. Companies
also create operating principles that typically define the way a company interacts
with its customers and employees. While these things are important to put in
writing, it is the more intangible aspect of culture that sets one business apart from
another. Culture establishes and underpins; order, structure, membership criteria,
conditioned for judging effective performance, communication patterns,
expectations and priorities, the nature of reward and punishment, the nature and
use of power, decision making practices, and management practices (Schineider,
1994).
The notions "organisation's culture" draws attention not only to what is observed in
the way an organisation formally goes about its business, but also to the less obvious
and more implicit informal characteristics that influence how decisions are made in
practice and how people actually treat each other at work. It is those informal, latent
and implicit aspects of an organisation that are increasingly being acknowledged as
important facets of an organisation's make-up and which profoundly influence its
behaviour and the well being of staff (Walton, 1997).
The perceived impact of organisation's culture on individual behaviour has been
articulated for many years. Carol (1982) observed that culture, like morals, laws, and
customs, shapes behaviour and is something that older generations hand down to
21
younger ones. Hofstede (1991) linked culture to a collective programming of minds
of one group that differentiates them from other groups. He believes that this
programming is derived from one's social culture.
Understanding and assessing the organisations culture can mean the difference
between success and failure in today's fast changing business environment,
(Hagberg & Heifetz, 2001). The culture of an organisation operates at both conscious
and unconscious levels and it drives the organisation and its action. It is somewhat
like 'the operating system" of the organisation. It guides how employees think, act
and feel. It is dynamic and fluid, and it is never static. They further assert that if
the organisation wants to maximize its ability to attain its strategic objectives, it must
understand if the prevailing culture supports and drives the actions necessary to
achieve its strategic goals.
A shared narrative of the past lays the foundation for culture. Too often today's
companies casually cast aside their historical roots in favour of what is in vogue. In
doing so, they often forsake the core values and beliefs that have contributed to their
success. They become rootless, sterile enterprises stalking whatever fashionable
economic opportunity comes along. How do we balance the tradition that keeps us
anchored and the innovation that keeps us current? That is one of the many
dilemmas today's corporate leaders wrestle with. The trick is to maintain core values
while attiring peripheral practices to deal with contemporary issues (Deal &
Kennedy, 2000)
While no one organisation has a pure culture throughout, every successful
organisation has a core culture. The core culture is central to the functioning of the
organisation, forming the nuclear core for how that organisation operates in order to
succeed. It is critical that this core or lead culture is aligned with the organisation's
strategy and core leadership practices. This alignment is central to any organisation's
effectiveness. Without it, focus is lost and energy wasted as people, systems and
processes work at cross-purposes with one another (Colins & Porras, 1994)
22
Schneider (1994) indicates that there are four core cultures: control, collaboration,
competence and cultivation. Leaders create one of these four core cultures,
consciously and/or unconsciously, from their own personal history, nature,
socialization, experiences, and perception of what it takes to succeed in their market
place. The following are the meanings of the four culture types:
Control: The culture is all about certainty. It fundamentally exists to ensure
certainty, predictability, safety, accuracy, and dependability. Fundamental issue in a
control culture is to preserve, grow, and ensure the well being and success of the
organisations per se. The organisation as a system comes first. Accordingly, the
design and framework for information and knowledge in the control culture is built
essentially around the goals of the organisation, and the extent to which those goals
are met. This culture is centred on organisation's goal attainment.
Collaboration: This culture is all about synergy. It fundamentally exists to ensure
unity, close connection with the customer, intense dedication to the customer.
Experiential knowing means that the fundamental issue in a collaboration culture is
the connection between people's experience and reality. The organisation moves
ahead through the diverse collective experience of people from inside and outside
the organisation. Collaboration culture people know something when diverse
collective experience has been fully utilized. This culture is centred on unique
customer goal attachment.
Competence: This culture is all about distinction. It fundamentally exists to ensure
the accomplishment of unparalleled, unmatched products or services. This is the
culture of uniqueness per se, of one-of-a-kind products or services. Conceptual
systematism means that the fundamental issue in a competence culture is the
realization of conceptual goals, particularly superior, distinctive conceptual goals.
The framework for information and knowledge is built essentially around the
conceptual system goals of the organisation and the extent to which those goals are
met. This culture is centred on conceptual goal attainment.
23
Cultivation: This culture is all about enrichment. It fundamentally exists to ensure
the fullest growth of the customer, fulfilment of the customer's potential, the raising
up the customer. This culture is all about the further realization of ideals, values,
and higher order purposes. Evolutional knowing means that the fundamental issue
in the cultivation culture is the connection between the values and ideals of the
organisation and the extent to which those values and ideals are being
operationalized. The key emphasis in this culture is the connection between what is
espoused and what is put into operation. This is culture on value - centred goal
attainment.
2.3 Organisation's Performance
Conventionally an organisation's performance can be gauged using its current
financial data. The most commonly used financial data is the earnings per share.
Indexes are used as a measure of the performance of the stock and bond markets
worldwide. Indexes are a valuable tool for investors to use in tracking the
performance of their own investments. Investors need only to look at the meltdown
of the stock prices that took place over the last few years to see how much money
can be lost. Whether the markets go up or down, indexes will reflect the changes of
the underlying stocks in the index. The more you understand the risk of the
investments you are considering, the less surprised you will be at the outcome
(Stollsteimert, 2000).
Another commonly used but non - financial measure of performance is
benchmarking. To achieve best practices and to stay competitive, many companies
realize that it is no longer enough to benchmark against their own previous
performance or to rely solely on financial statistics; they must benchmark against
their peer groups to gain an exceptional understanding of their current and future
levels of performance. Smart goal setting and consistent measurement using devices
such as indexes give a company the flexibility it will surely need to survive and
thrive tomorrow (Stollsteimert, 2000).
24

Performance is critical for excellence and survival of a company. Indeed companies
listed on the Nairobi Stocks Exchange (NSE) are expected to meet certain minimum
performance standards such as the levels of profitability and total capital employed.
Besides, quotation on the stock exchange enables them not only to enjoy prestige but
also raise capital through sale of shares to the public (NSE, 2005).
Corporate performance research is active in terms of empirical studies but faces
criticism regarding its limited theoretical foundation and its narrow focus. The
works collected in Harvard Business Review on Measuring Corporate Performance,
including the three groundbreaking articles on the balanced scorecard offer
manager's practical guidance for measuring their intangible assets (customer
relationships, internal business processes, and employee learning) and aligning
corporate strategy accordingly. The balanced scorecard offers the most complete
purpose-built application for managing business performance in today's complex
and rapidly changing business environment. Unlike business intelligence,
scorecarding, and desktop tools, it combines performance metrics, initiative
management, budgeting and planning, and reporting in a single, structured
environment (Stollsteimert, 2000).
The numbers are in. You met your goals. But how did you set your goals? Most
likely you set your expectations based on your company's performance last year and
the year before. This formula is fine if you're content to maintain the status quo. The
modern way of measuring a company's performance is by benchmarking against the
performance of its peers in the same industry. Once reserved for larger companies
who could afford it, today small and midsize manufacturers are benchmarking their
positions in the marketplace as well. The Internet has enabled a more level playing
field as manufacturers enter the information economy. With the analysis of specific
financial data, benchmarking enables manufacturers to understand how their
performance rates within their industry segment and identifies opportunities for
improvement. The more data that companies have in key financial areas (for
example, inventory turns, days of payables and receivables, operating ratios), the
25
more opportunities those companies will find to improve performance, cash flow,
and profits (Stollsteimert, 2000).
Benchmarking can first and foremost be helpful in understanding what level of
performance one can reasonably expect. From there, a company can begin to
quantify the gap between goals and current performance. Knowing where the
problems are is tantamount to solving them, and finding solutions is easier when
you know where to look. Benchmark ratios are measurable and comparable, which
makes them ideally suited for management-by-objective incentive programs. They
help keep the company focused on the controllable aspects of a business. Success
and failure can be easily evaluated. Focus should be placed on improving the
operational activities that directly affect cash position, profitability, and
productivity. Operational activities such as inventory accuracy, bill-of-material
accuracy, and planning and scheduling are the key drivers of manufacturing. By
understanding, quantifying, and tracking these drivers, manufacturers stand to gain
efficiencies of enormous magnitude (Stollsteimert, 2000).
Benchmark ratios provide an objective standard by which to measure performance.
By tracking key measurements at regular intervals, busy executives can pay closer
attention to those key factors that affect the company's bottom-line performance. At
a minimum, the executive team should review progress monthly and manage
performance until goals are achieved. As with most things in business, the value of
this process grows dramatically as the appropriate attention and resources are
dedicated to it. The more times this process is executed (benchmark, set goals,
review progress, repeat), the more proficient a company becomes at realizing
improved performance (Stollsteimert, 2000).
Benchmark ratios enable current and future stakeholders to objectively evaluate a
company's condition. Lenders, creditors, investors, and employees will use them to
better understand the company's strengths and weaknesses. All that is needed are
twelve specific financial data points in the areas of assets, liabilities, and income
26

Market Connection Benchmark outlines performance as a measure of a company's
market focus. The benchmark of performance measures the company's business
segment average, aspects of market orientation activities that generally provides
focus for understanding the employees role within the company that includes
making a profit for the owners and their moral and organisation's commitment and
a skilful management of the customer interactions to increase customer retention, the
magnitude of each purchase and the bottom - line. Studies on corporate
performance cover an organisation's environmental and social responsibility
assessments policy, turnover, and capitalization.
My study recognizes that it will be very costly in terms of time and money to
research on all the performance variables and stakeholders of the companies listed in
the NSE - the employees, creditors, the government, the general public. I therefore
propose to consider only the financial performance variables in this study.
2.4 Corporate Strategy, Culture and Performance
Studies on the link between culture and organisation's performance are a relatively
recent phenomenon. Thomas Peters and Robert Waterman (1982) told managers that
an organisation's success depends on having a strong culture, and laying down a
formula for such a culture. They state that without exception, the dominance and
coherence of culture proved to be an essential quality of the excellent companies.
Moreover, the stronger the culture and the more it was directed toward the
marketplace, the less was the need for policy manuals, organisation charts, or
detailed procedures and rules.
A company's strategic actions typically reflect its cultural traits and managerial
values. In some cases, a company's core beliefs and culture even dominate the choice
of strategic moves. This is because culture-related values and beliefs become so
embedded in management's strategic thinking and actions that they condition how
the enterprise responds to external events. Such firms have a culture-driven bias
about how to handle strategic issues and what kinds of strategic moves it will
consider or reject Strong cultural influences partly account for why companies gain27
reputations for strategic traits as technological leadership, product innovation,
dedication to superior craftsmanship, proximity for financial wheeling and dealing,
desire to grow rapidly by acquiring other companies, strong people - orientation, or
unusual emphasis on customer service or total customer satisfaction (Thomson and
Strickland, 1996).
Scholars of organisation's culture have sought to find the key to unlock the mystery
and power of culture and its influence on the performance of organisations and
groups. Barrett and Bass (1976) observed that, most research in industrial and
organisation's psychology is done within one cultural context. This context puts
constraints upon both our theories and our practical solutions to the organisation's
problems.
Lahey (2001) researched on the impact of strategic planning on organisation's
effectiveness and culture. This study, never addressed the need to align culture to
strategy and how this impacts on performance. Gregory (2003) carried out a research
on the impact of formal strategic planning on financial performance in the food -
processing sector. Whereas the results of the strategic planning tools used in his
study revealed a positive financial performance as measured by the three-year pre
tax return on assets, he first, never considered the cultural perspective on
performance, and second, took only a sectoral analysis.
Blackburn (1989) researched on the strategic and operational planning uncertainty,
and performance in small firms. This study also stressed on the relationship between
strategic planning and financial performance. It is imperative to note that
performance of companies need not be acknowledged from only the financial
performance as is the case in the aforementioned studies in this area. Performance of
a company includes the level of satisfaction by other stakeholders - customers,
employees, shareholders, suppliers, the community, the government, investors,
creditors, et cetera.
Johnson and Scholes (2002) observed that this formalization may reflect difficulties
in changing strategies, within a hierarchical or deferential system. Peters and
28

Waterman (1982) wrote: "without exception, the dominance and coherence of
culture proved to be an essential quality of the excellent companies. Moreover, the
stronger the culture and the more it was directed toward the master place, the less
need was there for policy manuals, organisation charts, or detailed procedures and
rates. In these companies people way down the line know what they are supposed to
do in most situations because the handful of guarding values is crystal clear.
However, close to Kenya, in the South and Central African counties of South Africa,
Zambia and Zimbabwe, Frese, et al (2003) carried out three different studies on the
psychological action strategy characteristics in African business owners and success
in. This study identified four psychological strategy characteristics: Complete
Planning (planning ahead and actively structuring the situation), Critical Point
Strategy (working on and planning the most difficult and most important point
first), Opportunistic Strategy (proactive orientation on opportunities with little
planning and deviation from any goals when new opportunities are perceived), and
Reactive Strategy (which implies that one reacts to the situation; thus the owner is
neither proactive nor planning). The two underlying dimensions in this study are
proactivity and planning. A reactive strategy is not proactive and does not plan.
Opportunistic strategy does not plan, but is highly proactive in finding opportunities
to be exploited. Critical point plans to a certain extent and is proactive to a certain
extent, and finally complete planning is both proactive and planning, Frese, et al
(2003).
Results showed that in all the above three studies, there is enough evidence
revealing that a reactive strategy is negatively related to success. This means that
those owners who react to the situation, who make decisions only after the market or
other people tell them to, who do not attempt to influence their environment do
worse in every environment. Results on planning are also relatively similar —
planning is positive in Zambia and in Zimbabwe, although in South Africa only
Critical Point Planning is significantly related to success. The most important
difference occurs with opportunistic strategy. This strategy is only significantly and
positively related to success in South Africa but not so in the other two countries.
29
One possible interpretation is to look at cultural differences: In South Africa, there is
a higher degree of uncertainty avoidance than in the other two countries (as shown
by the GLOBE data). This would actually imply a culture mis-fit hypothesis.
Uncertainty avoidance suggest that one should plan to overcome anxieties related to
the future. South Africa is the only country in which a non-planning opportunistic
strategy is positively related to success. Those who behave uncharacteristically for
their culture (and do not plan, but go about things opportunistically) are better off
than those who have a fit of their strategy and their culture, Frese, et al (2003).
Mahinda (2002) based her research on the Influence of Culture on Human Resource
Practices by Manufacturing Firms Registered by the Kenya Association of
Manufacturers. First, her research was industry specific and limited to
manufacturing sector. Strategy is process and context sensitive. Research findings in
the manufacturing sector may therefore be very different from those of other sectors
such as agricultural, service, or financial.
In line with this setback she recommended further research based on other
sectors/industries. Second, her research was limited in that it did not unearth the
link, if any, between an organisation adopting strategic planning on performance.
Thirdly, she observed that a further research adding incision into culture and
performance would perhaps improve research findings. Lastly, she notes that
manager's risk ignoring organisation's culture in the process of making strategic
decisions at their own peril. More importantly, strategy in one industry need not be
the same in the other industry. Hence, the need to study these inter - industry
differences.
Kariuki (2001) carried out a research investigating the aspects of culture and their
effects on the marketing strategies in the beverage industry in Kenya. Again this was
industry specific and neglected cross-industry analysis. Strategy in the beverage
industry need not be similar to that in another industry like Financial and
Investment. Moreover, this study did not address the effect of culture on strategic
planning and resultant performance.
30

CHAPTER THREE - RESEARCH METHODOLOGY
3.1 Introduction
In this chapter the various steps for executing the study were out in order to achieve
the objectives of the study. These steps include the research design, population, data
collection instruments, data collection procedures and finally data analysis and
interpretation
3.2 Research Design
The researcher used a survey to explore the relationship between organisational
culture, strategy and performance of companies listed at the Nairobi Stock
Exchange. Pre-designed operational definitions of the four culture types - control,
collaboration, competence and cultivation, and the four Miles and Snow's strategy
types of defenders, prospectors, analysers and reactors were used in identifying the
dominant culture and strategy types
A survey design was deemed more appropriate since this study covered cross
sectional studies. This was important to capture the adoption of culture in strategic
practices by companies in different variations and the resultant performance.
3.3 Population
This was a census study of all the forty eight (48) firms that were listed on NSE Price
Index as at 15th September 2005. The researcher used census method because there
was the fear that non response might be high given that all the targeted respondents
were normally very busy employees of the companies and therefore may not spare
time for interviews or in filling the questionnaires.
31

3.4 Data Collection
Likert scale questionnaires were used to collect primary data. To increase the
response the questionnaires were sent to two managers - the head of planning and
that of human resources or the head of finance as were applicable. This was also to
ensure that the questionnaires were answered by people responsible for culture
and/or planning. Due to his busy schedule, the researcher sent the questionnaires by
either drop or courier.
All the questionnaires were enclosed with addressed return stamp envelops. It was
deemed these measures would increase the response chances.
Secondary data on the financial performance indicators, notably, Earnings per Share,
(EPS), share prices and the price index for the twelve months, October 2004 to
September 2005 were obtained from the Nairobi Stock Exchange. The researcher
used the one year share prices to espouse the individual company performance over
time. The choice of one year was made to first, contain the cost of the research and,
second, reduce the possibility of strategy or culture types in use by individual
companies changing over a longer period.
32

CHAPTER FOUR - DATA ANALYSIS AND INTERPRETATIONS
4.1 Data Analysis
Data were analysed using descriptive statistics such as tables, frequencies, averages,
rankings and graphs. Tabular analyses using averages were used to identify the
dominant cultures and strategy types. Secondly, average share prices were used as
performance indicators in ranking the companies. Thirdly, graphical analyses were
used to show the periodic trends of the share prices as a measure of the performance
of the companies over the thirteen months and compare intra industry. Chi - square
was to be Used to test the significance of the relationships between strategy,
corporate culture and organisation's performance. However, its use was
discontinued after the researcher noted that the expected frequency count was less
than 5 for all the questions.
Sixteen companies, namely: Kakuzi Limited, Sasini Tea and Coffee Limited, Kenya
Airways Limited, Marshalls (E.A) Limited, Nation Media Group, Barclays Bank
Limited, National Bank of Kenya Limited, B.O.C Kenya Limited, Crown Berger
Limited, Olympia Capital Holdings Limited, E.A. Cables Limited, Mumias Sugar
Company Limited, Kenya Power and Lighting Company Limited, Express Limited,
Williamson Tea Kenya Limited and Kapchorua Tea Company Limited completed
the questionnaire.
These companies were categorized by sectors at the Nairobi Stock Exchange as
shown below:
Agricultural
1. Kakuzi Limited
2. Sasini Tea and Coffee Limited
33

Commercial and Services
3. Kenya Airways Limited
4. Marshalls (E.A) Limited
5. Nation Media Group
Finance and Investment
6. Barclays Bank Limited
7. National Bank of Kenya Limited
Industrial and Allied
8. B.O.C Kenya Limited
9. Crown Berger Limited
10. Olympia Capital Holdings Limited
11. E.A. Cables Limited
12. Mumias Sugar Company Limited
13. Kenya Power and Lighting Company Limited
Alternative Investment Market Segment
14. Express Limited
15. Williamson Tea Kenya Limited
16. Kapchorua Tea Company Limited
In order to observe confidentiality, each company was randomly represented by a
letter from the alphabet which was consistently used throughout the analysis. The
letters ranged from A to Q.
4.2 Culture Types
The researcher used questions (a), (b) and (c) to determine the extent to which
control culture was practiced; (d) and (e), collaboration; (f) and (g), competence; and
finally, question (h), the cultivation culture. The Likert Scale was interpreted thus:
No Response = 0, Not at all = 1; Not Quite = 2; Fair Extent = 3; Good Extent = 4; and
Great Extent = 5. The respondents were asked to rate the extent to which the
34

company considered organisational culture when making strategic decisions. The
scales ranged from 1 (Not at all) to 5 (Great extent). The results are presented in table
1.2.
Table 1.1 below summarizes the results of the culture types using the foregoing
criteria:
Table 1.1: Dominant Culture Types
Company/Q uestion (a) (b) (c) (d) (e) (f) (g) (h) D om inant C ulture Type(s)
A 4 5 5 4 4 4 4 4 Control
B 4 4 5 4 4 4 4 4 ControlC 4 5 4 5 5 4 3 3 Collaboration
D 3 3 4 4 4 4 4 4 Collaboration, competence and Cultivation
E 4 3 3 2 3 3 3 2 Control and CompetenceF 5 5 5 5 4 4 5 5 Control and CultivationG 2 4 5 5 4 4 3 4 CollaborationH 5 4 4 4 5 5 5 5 Competence and CultivationI 3 3 4 4 4 2 3 4 Collaboration
J 3 4 5 4 5 5 3 3 Collaboration and CompetenceK 4 4 3 2 2 3 4 4 CultivationL 3 3 4 4 4 2 4 3 CollaborationM 4 5 5 5 4 4 4 3 Control
N 4 4 4 5 5 5 5 5 Collaboration, competence and Cultivation
P 4 4 5 4 4 3 3 4 Control
Q 4 4 5 4 4 3 3 4 Control
From table 1.1, it is evident that ten or 62.5 per cent of the respondent firms practice
a dominant culture type to a good extent and only six or 37.5 per cent of them
practice a culture mix. The use of the culture types to a good or great extent,
however, is almost at 37.5 per cent and 31.25 per cent for control, collaboration,
competence and cultivation, respectively. The use of almost all these culture types is,
to a good extent, on the average.
Similarly, ten or 62.5 per cent of the companies that responded to the survey
considered control culture to a good extent, on average; while fourteen or 87.5 per
cent, on average, practiced collaboration culture, at least, to a good extent. On the
35WHTiflBnnr OF
same scale, eight or 50 per cent of the companies considered competence culture,
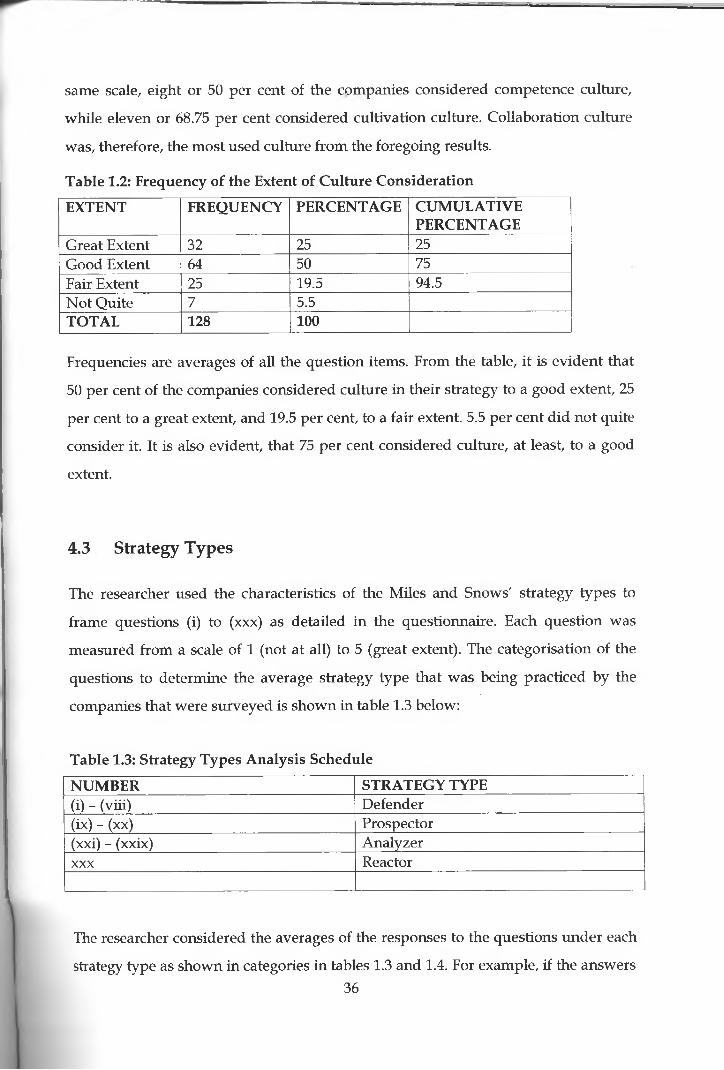
while eleven or 68.75 per cent considered cultivation culture. Collaboration culture
was, therefore, the most used culture from the foregoing results.
Table 1.2: Frequency of the Extent of Culture Consideration
EXTENT FREQUENCY PERCENTAGE CUMULATIVEPERCENTAGE
Great Extent 32 25 25Good Extent 64 50 75Fair Extent 25 19.5 94.5Not Quite 7 5.5TOTAL 128 100
Frequencies are averages of all the question items. From the table, it is evident that
50 per cent of the companies considered culture in their strategy to a good extent, 25
per cent to a great extent, and 19.5 per cent, to a fair extent. 5.5 per cent did not quite
consider it. It is also evident, that 75 per cent considered culture, at least, to a good
extent.
4.3 Strategy Types
The researcher used the characteristics of the Miles and Snows' strategy types to
frame questions (i) to (xxx) as detailed in the questionnaire. Each question was
measured from a scale of 1 (not at all) to 5 (great extent). The categorisation of the
questions to determine the average strategy type that was being practiced by the
companies that were surveyed is shown in table 1.3 below:
Table 1.3: Strategy Types Analysis Schedule
NUMBER STRATEGY TYPE(i) - (viii) Defender(ix) - (xx) Prospector(xxi) - (xxix) Analyzerxxx Reactor
The researcher considered the averages of the responses to the questions under each
strategy type as shown in categories in tables 1.3 and 1.4. For example, if the answers36

i
to questions, (i) to (viii) by a company, was, say 3.5 on the average, it was rounded
upwards to the nearest whole number to obtain the nearest upper scale of 4. This
was then interpreted to mean that this company practiced defender strategy to a
good extent, on the average. The results of the mean scores are detailed in table 1.4
37
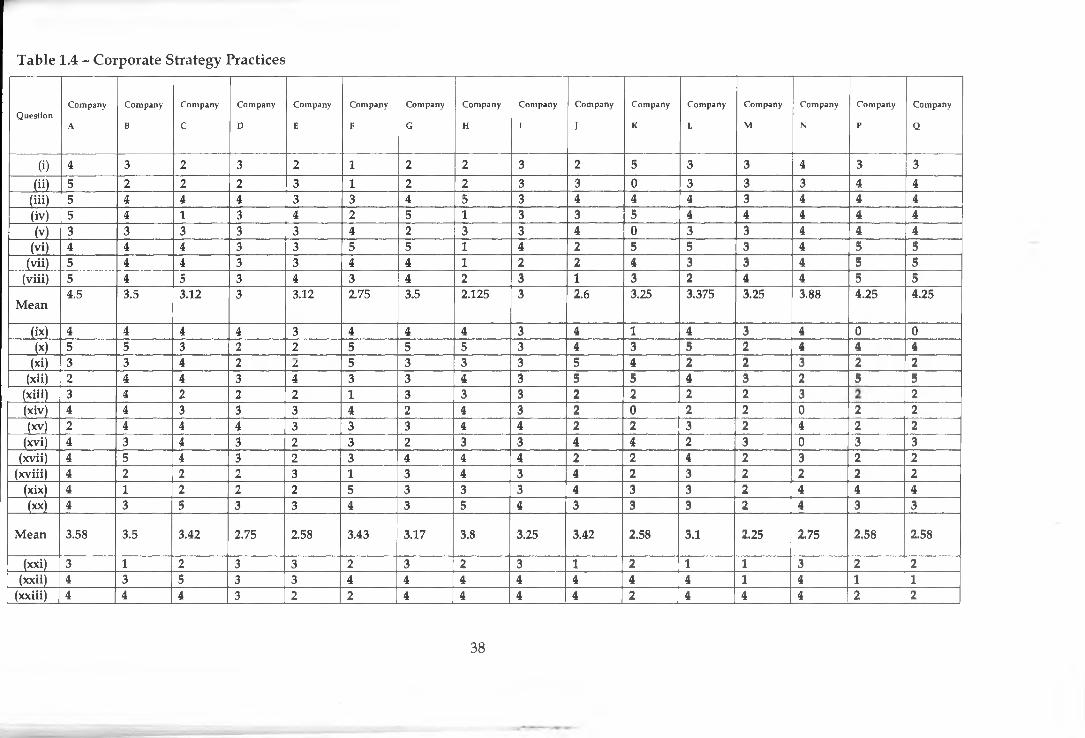
Table 1.4 - Corporate Strategy Practices
Q u e s t io nC o m p a n y
A
C o m p a n y
B
C o m p a n y
C
C o m p a n y
D
C o m p a n y
E
C o m p a n y
F
C o m p a n y
G
C o m p a n y
H
C o m p a n y
I
C o m p a n y
J
C o m p a n y
K
C o m p a n y
L
C o m p a n y
M
C o m p a n y
N
C o m p a n y
P
C o m p a n y
Q
(i) 4 3 2 3 2 l 2 2 3 2 5 3 3 4 3 3
(ii) 5 2 2 2 3 l 2 2 3 3 0 3 3 3 4 4
(iii) 5 4 4 4 3 3 4 5 3 4 4 4 3 4 4 4(iv) 5 4 1 3 4 2 5 1 3 3 5 4 4 4 4 4
(V) 3 3 3 3 3 4 2 3 3 4 0 3 3 4 4 4(vi) 4 4 4 3 3 5 5 1 4 2 5 5 3 4 5 5
(vii) 5 4 4 3 3 4 4 1 2 2 4 3 3 4 5 5
(viii) 5 4 5 3 4 3 4 2 3 1 3 2 4 4 5 5
Mean4.5 3.5 3.12 3 3.12 2.75 3.5 2.125 3 2.6 3.25 3.375 3.25 3.88 4 .2 5 4 .25
(ix) 4 4 4 4 3 4 4 4 3 4 1 4 3 4 0 0
(x) 5 5 3 2 2 5 5 5 3 4 3 5 2 4 4 T~~(xi) 3 3 4 2 2 5 3 3 3 5 4 2 2 3 2 r~2
(xii) 2 4 n r ~ 3 4 3 3 4 3 5 5 4 3 2 5 5(xiii) 3 4 2 2 2 1 3 3 y - HF- 2 2 2 3 2(xiv) 4 4 3 3 3 4 2 4 3 2 0 2 2 0 2 2(xv) 2 4 4 4 3 3 3 4 4 2 2 3 2 4 2 2
(xvi) 4 3 4 3 2 3 2 3 3 4 4 2 3 0 3 3(xvii) 4 5 4 3 2 3 4 4 4 2 2 4 2 3 2 2
(xviii) 4 2 2 2 3 1 3 4 3 4 2 3 2 2 2 2(xix) 4 1 2 2 2 5 3 3 3 4 3 3 2 4 4 4
( x x ) 4 3 5 3 3 4 3 5 4 3 3 3 2 4 3 3
Mean 3.58 3.5 3.42 2.75 2.58 3.43 3 .17 3.8 3.25 3 .42 2.58 3.1 2.25 2 .75 2 .5 8 2.58
(xxi) 3 1 2 3 3 2 3 2 3 1 2 1 1 3 2 2(xxii) 4 3 5 3 3 4 4 4 4 4 4 4 1 4 1 1
(xxiii) 4 4 4 3 2 2 4 4 4 4 2 4 4 4 2 2
38
Q u e s t io nC o m p a n y
A
C o m p a n y
B
C o m p a n y
C
C o m p a n y
D
C o m p a n y
E
C o m p a n y
F
C o m p a n y
G
C o m p a n y
H
C o m p a n y
I
C o m p a n y
J
C o m p a n y
K
C o m p a n y
L
C o m p a n y
M
C o m p a n y
N
C o m p a n y
P
C o m p a n y
Q
(x x iv ) 5 4 5 2 2 3 4 2 2 4 2 i 3 0 3 3(xxv ) 5 3 4 3 2 5 4 2 2 5 3 5 4 0 4 4
(x x v i) 4 1 3 3 2 5 4 5 3 3 2 3 1 0 2 2
(x x v ii) 2 1 2 2 3 1 2 1 3 2 2 3 1 2 2 2
(x x v iii) 4 4 3 3 4 4 1 3 3 4 3 4 3 3(x x ix ) 3 3 3 2 \ 2 ~ 3 3 IT - 4 3 2 3 A - 3 2 2
Mean 3.8 2.7 3.4 2.7 2.4 3.2 3.56 2.67 3.2 3.2 2.4 3.1 2 .1 2 .2 2.33 2.33
(xxx) 1 4 1 1 3 1 2 1 2 1 1 1 3 1 2 2
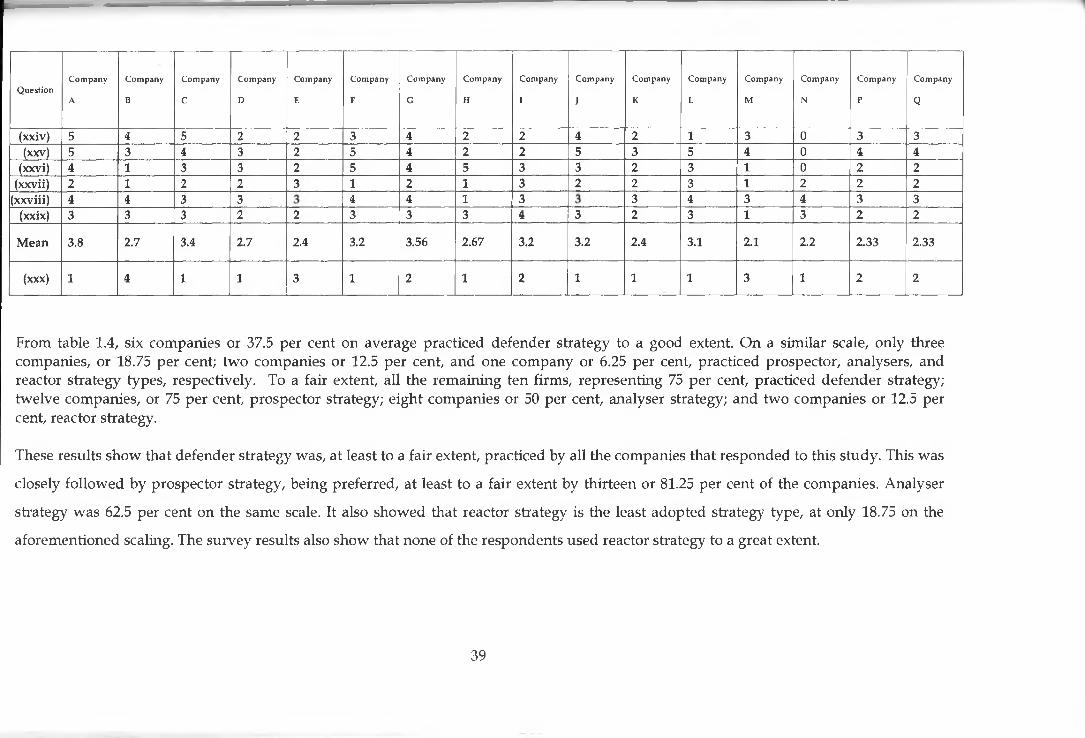
From table 1.4, six companies or 37.5 per cent on average practiced defender strategy to a good extent. On a similar scale, only three companies, or 18.75 per cent; two companies or 12.5 per cent, and one company or 6.25 per cent, practiced prospector, analysers, and reactor strategy types, respectively. To a fair extent, all the remaining ten firms, representing 75 per cent, practiced defender strategy; twelve companies, or 75 per cent, prospector strategy; eight companies or 50 per cent, analyser strategy; and two companies or 12.5 per cent, reactor strategy.
These results show that defender strategy was, at least to a fair extent, practiced by all the companies that responded to this study. This was
closely followed by prospector strategy, being preferred, at least to a fair extent by thirteen or 81.25 per cent of the companies. Analyser
strategy was 62.5 per cent on the same scale. It also showed that reactor strategy is the least adopted strategy type, at only 18.75 on the
aforementioned scaling. The survey results also show that none of the respondents used reactor strategy to a great extent.
39

Tsblc 1.5i Share Prices
Analysis for the period from first September 2004 to seventh September 2005
f ir s tSEP 04
SIXTH OCT 04
THIRD NOV 04
FIRST DEC 04
FIFTH JA N 05
SECOND FEB 05
SECOND MARCH 05
SIXTH APR 05
FOURTH MAY 05
FIRST JUNE 05
SIXTH JULY 05
THIRD AUG 05
SEVENTH SEP 05
M E A N
S H A R E
PRICE RANKA 2 9 .7 5 2 9 .5 0 3 2 .7 5 3 2 .7 5 4 0 .0 0 4 6 .0 0 4 7 .7 5 4 0 .2 5 4 5 .2 5 4 6 .0 0 6 8 .5 0 5 4 .0 0 5 1 .0 0 4 3 .3 5 8
B 2 0 .0 0 2 0 .5 0 2 2 .7 5 2 3 .0 0 2 6 .2 5 3 0 .2 5 2 7 .7 5 31 .00 3 2 .7 5 3 3 .5 0 3 6 .7 5 3 8 .0 0 3 2 .5 0 2 8 .8 5 10
C 14.10 14.55 17 .00 17.50 18.35 19.45 21 .25 2 4 .2 5 2 6 .0 0 3 9 .7 5 6 9 .5 0 7 0 .0 0 7 4 .0 0 3 2 .7 5 9
D 16.50 15 .30 15 .00 15.00 15 .00 15 .00 15 .00 15.00 15 .00 15.00 3 0 .0 0 3 0 .0 0 2 7 .0 0 18.37 13
E 1 7 6 .0 0 1 8 2 .00 1 8 0 .0 0 189 .00 1 8 0 .00 1 85 .00 1 9 7 .0 0 2 3 0 .0 0 2 4 0 .0 0 2 0 3 .0 0 1 9 6 .00 197 .00 1 8 0 .0 0 1 9 5 .00 2
F 2 0 3 .0 0 211.00 2 1 9 .0 0 215 .00 2 0 2 .0 0 2 2 0 .0 0 2 2 2 .0 0 2 0 6 .0 0 2 1 6 .0 0 2 3 9 .0 0 2 5 7 .0 0 2 5 4 .0 0 2 3 8 .0 0 2 2 3 .2 3 1
G 17.50 16.00 17.85 17.85 17.45 2 0 .0 0 19 .05 17.95 16.85 19.30 2 2 .0 0 2 4 .2 5 2 4 .2 5 19.25 12
H _ 1 3 5 .0 0 1 2 0 .00 121.00 120 .00 115.00 115.00 1 3 0 .0 0 137 .00 1 3 7 .00 1 40 .00 1 4 2 .00 146 .00 1 4 0 .0 0 130.62 3I 3 0 .0 0 2 5 .2 5 2 7 .2 5 2 7 .2 5 2 7 .7 5 31 ,00 31 .00 2 8 .0 0 2 8 .0 0 2 8 .0 0 3 0 .5 0 2 5 .0 0 3 0 .7 5 2 8 .4 4 11
J 15 .30 17.00 17 .00 16.85 15.85 15 .55 15.05 15.50 16 .50 15.05 2 5 .0 0 2 5 .0 0 2 5 .0 0 18.05 14
K 31.75 3 2 .2 5 3 4 .0 0 3 8 .5 0 5 0 .5 0 5 7 .0 0 5 9 .5 0 6 4 .0 0 7 5 .0 0 8 6 .0 0 1 3 6 .00 1 28 .00 1 3 6 .0 0 71.42 7
L 11.55 10.95 11.15 10.85 10 .70 11.85 12 .00 11.50 12.45 17.90 31 .25 2 8 .7 5 2 8 .5 0 16.11 15M 9 5 .0 0 8 8 .0 0 8 3 .0 0 8 5 .5 0 9 4 .5 0 8 6 .0 0 8 5 .0 0 8 7 .0 0 8 3 .5 0 8 9 .5 0 115.00 129 .00 1 3 2 .0 0 9 6 .3 8 6
N 9 .0 0 8 .95 8 .7 0 8 .0 0 7 .8 0 9 .9 5 9 .8 0 9 .7 5 9 .5 0 9 .0 0 14 .45 11.60 14 .60 10.08 16P 9 0 .0 0 8 6 .5 0 9 4 .0 0 100 .00 1 0 0 .0 0 117.00 117.00 118.00 118.00 118.00 1 42 .00 130 .00 1 2 0 .0 0 111.58 5
Q 1 0 0 .0 0 1 00 .00 1 0 0 .00 100 .00 1 0 0 .0 0 1 0 0 .00 1 0 0 .0 0 100 .00 1 20 .00 1 2 6 .00 185 .00 185 .00 1 6 0 .0 0 121.23 4
40

T a b le 1.5 shows share prices for each of the sixteen companies that participated in this reSearch over a thirteen month period, from
September 2004 to September 2005, a week before the companies listed as at 15* September 2005 were noted for this study. The first
Wednesday of each month was chosen for the purpose of each data. This is in line with the Effiri „ . . ™ , ,J r r *iency Pricing Theory, m which a number ofstudies on weekly share prices had revealed that share prices are higher on Wednesdays than any jg y Gf the week It was therefore
prudent to choose a time when the share prices were at their highest point because this study a.mg at establishing the relationship in the
choices of culture and strategy types to performance. The alternative would be to take the monti , , . . , , , ,J r r " luluniy average of the share prices of the sharecompanies listed at the Nairobi Stock Exchange. This, however, would be more costly in terms nc. • j t. • i , ,, . .,& y * of time ancj money. ft 1S because of this thatthe researcher preferred the use of the share prices of the first Wednesday of each month. Thp - ,r r hrean of was then used to rank the sixteencompanies in the descending order of the mean share prices. EFsing this measure, the best rankt^ , ,, , . , ,& r 6 1KQd company has the highest average shareprice while number sixteen had the lowest mean share prices. The mean share price for each , ,r r 'hpany shows the average performance ofeach of these companies that participated in this study over the period. This performance measi
relation between the Miles and Snows' strategy and culture types, and the resultantsUre was then used further to analyse the
performance as detailed in table 1.6.
41
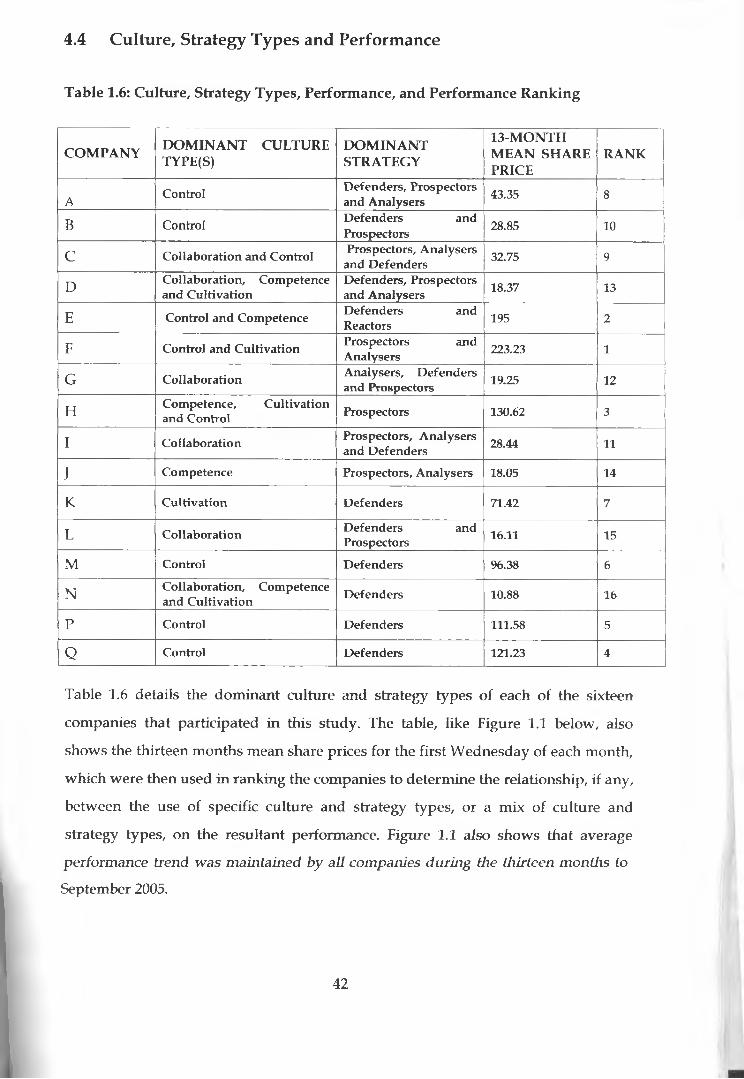
4.4 Culture, Strategy Types and Performance
Table 1.6: Culture, Strategy Types, Performance, and Performance Ranking
COMPANY DOMINANT CULTURE TYPE(S)
DOMINANTSTRATEGY
13-MONTH MEAN SHARE PRICE
RANK
A Control Defenders, Prospectors and Analysers 43.35 8
B Control Defenders and Prospectors 28.85 10
C Collaboration and Control Prospectors, Analysers and Defenders 32.75 9
D Collaboration, Competence and Cultivation
Defenders, Prospectors and Analysers 18.37 13
E Control and Competence Defenders and Reactors 195 2
F Control and Cultivation Prospectors and Analysers 223.23 1
G Collaboration Analysers, Defenders and Prospectors 19.25 12
H Competence, Cultivation and Control Prospectors 130.62 3
I Collaboration Prospectors, Analysers and Defenders 28.44 11
J Competence Prospectors, Analysers 18.05 14
K Cultivation Defenders 71.42 7
L Collaboration Defenders and Prospectors 16.11 15
M Control Defenders 96.38 6
N Collaboration, Competence and Cultivation Defenders 10.88 16
P Control Defenders 111.58 5
Q Control Defenders 121.23 4
Table 1.6 details the dominant culture and strategy types of each of the sixteen
companies that participated in this study. The table, like Figure 1.1 below, also
shows the thirteen months mean share prices for the first Wednesday of each month,
which were then used in ranking the companies to determine the relationship, if any,
between the use of specific culture and strategy types, or a mix of culture and
strategy types, on the resultant performance. Figure 1.1 also shows that average
performance trend was maintained by all companies during the thirteen months to
September 2005.
42
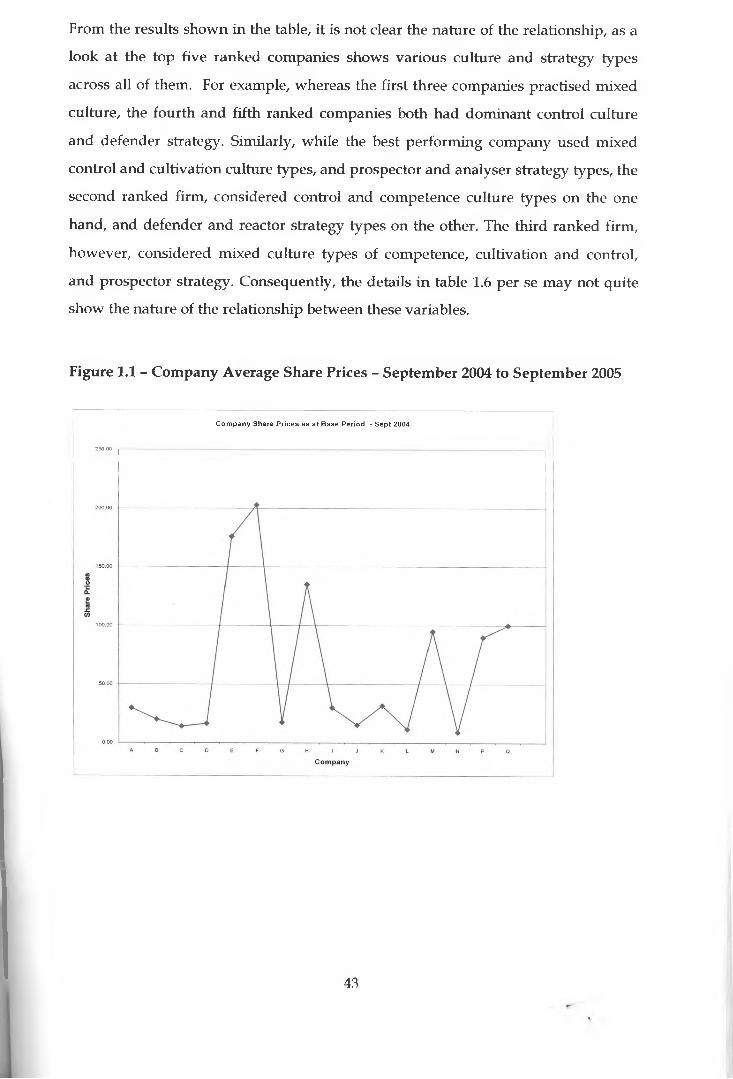
From the results shown in the table, it is not clear the nature of the relationship, as a
look at the top five ranked companies shows various culture and strategy types
across all of them. For example, whereas the first three companies practised mixed
culture, the fourth and fifth ranked companies both had dominant control culture
and defender strategy. Similarly, while the best performing company used mixed
control and cultivation culture types, and prospector and analyser strategy types, the
second ranked firm, considered control and competence culture types on the one
hand, and defender and reactor strategy types on the other. The third ranked firm,
however, considered mixed culture types of competence, cultivation and control,
and prospector strategy. Consequently, the details in table 1.6 per se may not quite
show the nature of the relationship between these variables.
Figure 1.1 - Company Average Share Prices - September 2004 to September 2005
C ompany Share Prices as at Base Period - Sept 2004
250.00 T
43
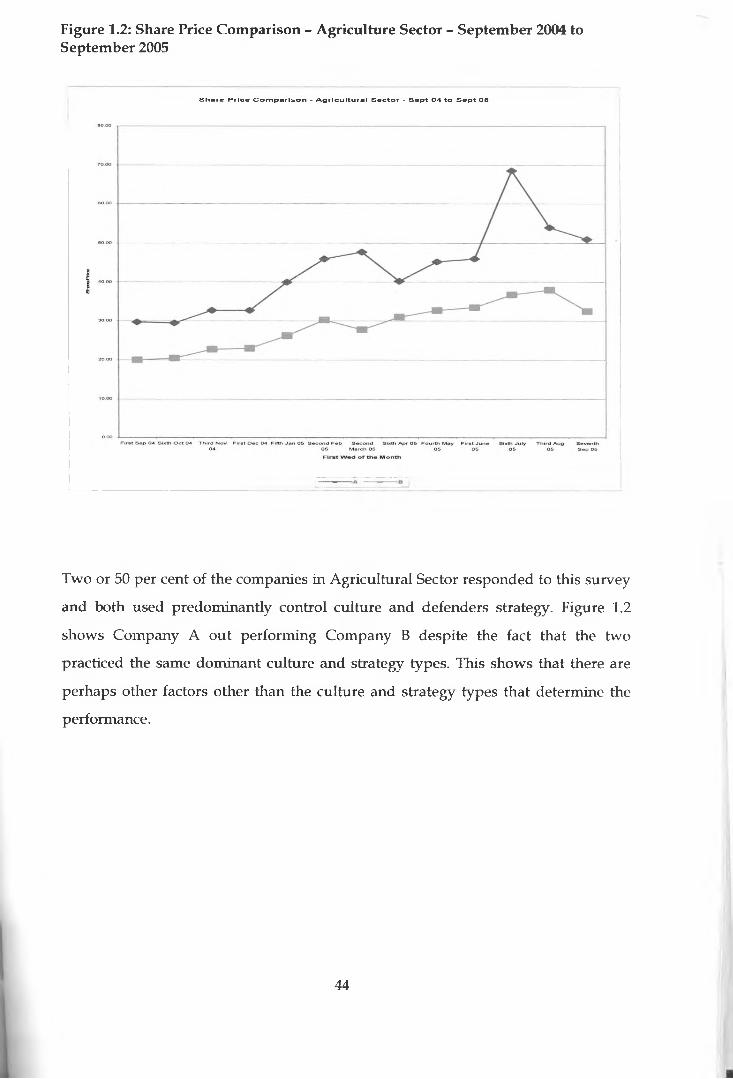
Figure 1.2: Share Price Comparison - Agriculture Sector - September 2004 toSeptember 2005
Share Price Comparison - Agricultural Sector - Sept 04 to Sept 06
Two or 50 per cent of the companies in Agricultural Sector responded to this survey
and both used predominantly control culture and defenders strategy. Figure 1.2
shows Company A out performing Company B despite the fact that the two
practiced the same dominant culture and strategy types. This shows that there are
perhaps other factors other than the culture and strategy types that determine the
performance.
44
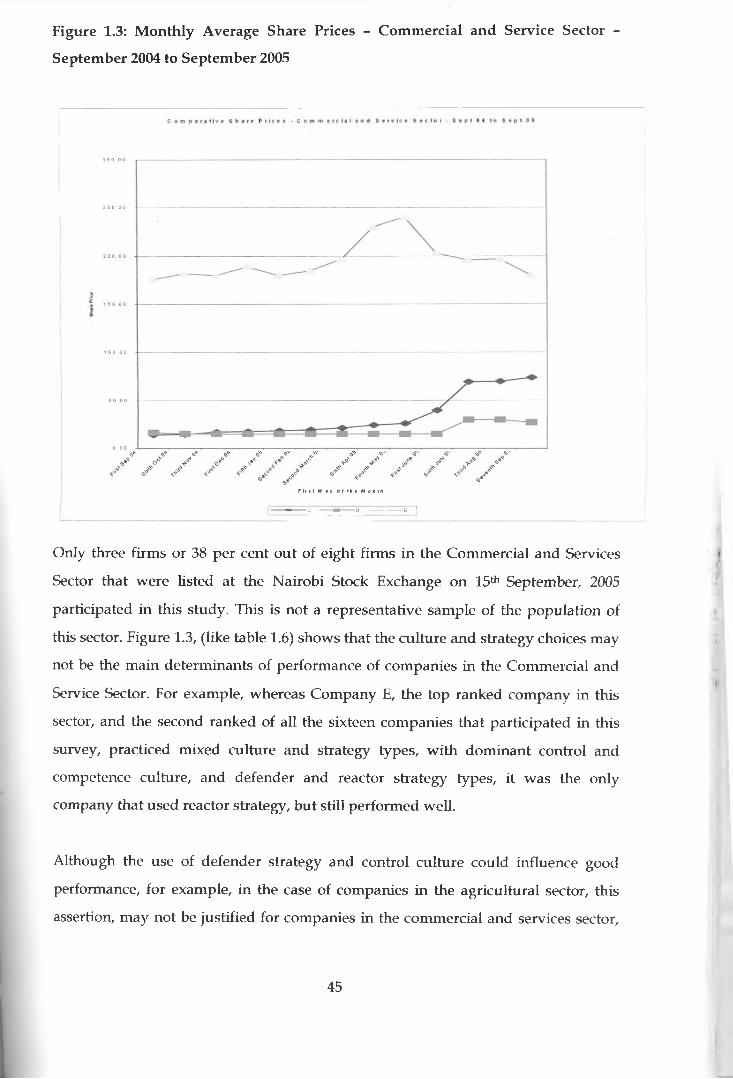
Figure 1.3: Monthly Average Share Prices - Commercial and Service Sector -
September 2004 to September 2005
F i r s I W e d o f t h e M o n t h
------C ■ ---- O --------- ------------£ I
Only three firms or 38 per cent out of eight firms in the Commercial and Services
Sector that were listed at the Nairobi Stock Exchange on 15th September, 2005
participated in this study. This is not a representative sample of the population of
this sector. Figure 1.3, (like table 1.6) shows that the culture and strategy choices may
not be the main determinants of performance of companies in the Commercial and
Service Sector. For example, whereas Company E, the top ranked company in this
sector, and the second ranked of all the sixteen companies that participated in this
survey, practiced mixed culture and strategy types, with dominant control and
competence culture, and defender and reactor strategy types, it was the only
company that used reactor strategy, but still performed well.
Although the use of defender strategy and control culture could influence good
performance, for example, in the case of companies in the agricultural sector, this
assertion, may not be justified for companies in the commercial and services sector,
45

first, because the low response rate by companies in this sector made the results
unrepresentative, and, second, due to the fact that Company C was ranked ninth,
far behind Company E despite both having considered defender strategy and control
culture in their strategy and culture mixes.
It can also be noted from figure 1.3 and table 1.6, that companies C and D had more
or less same share prices between September and December 2004, but the succeeding
months to September 2005, saw the share prices for Company C rising to position
nine compared to those of Company D at position thirteen by the end of this period.
This was a remarkable difference was noted in spite of the fact that the two
companies considered the same mixed strategy types, that is, prospector, analyser
and defender, and also collaboration as the dominant culture mix, though with a
good use control culture for Company C, and competence and cultivation cultures in
the case of Company D. Consequently, there may be other determinants of
performance by these companies other than the choice of culture and strategy types.
It is also important to note that the commercial and services sector is quite diverse in
terms of the nature of products and may therefore be influenced by many factors.
This sector covers transport, hospitality, motor dealers and some retail chains - all of
which have unique niches that are bound to be influenced by a wide range of factors
specific to them.
46
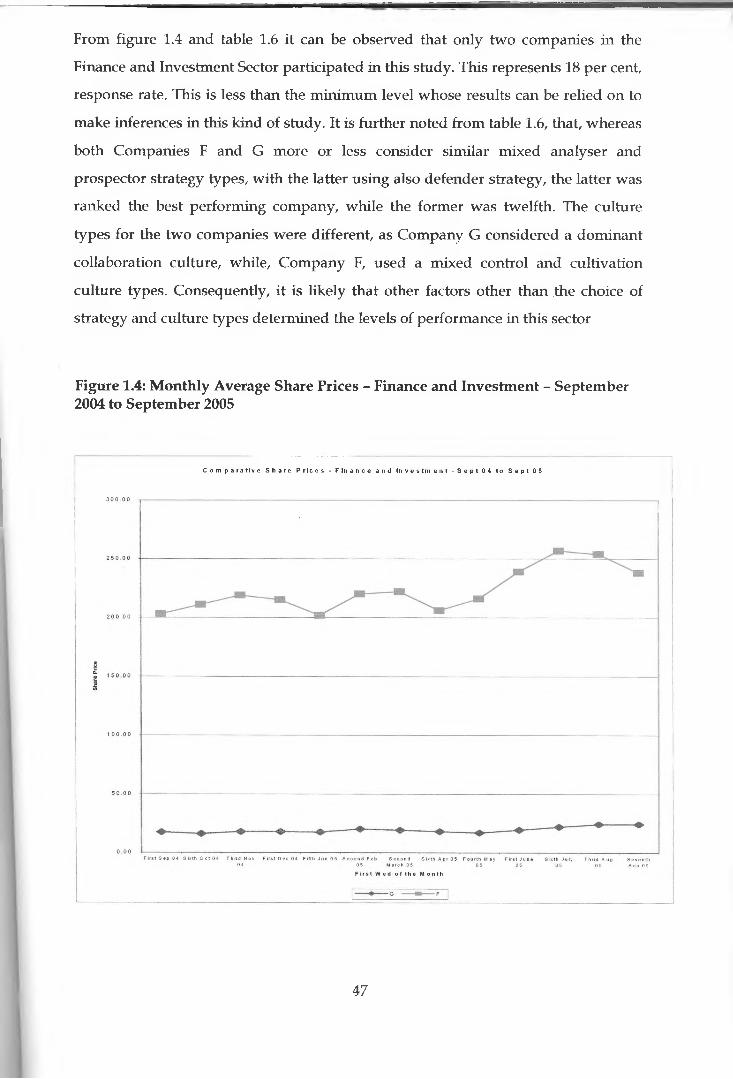
From figure 1.4 and table 1.6 it can be observed that only two companies in the
Finance and Investment Sector participated in this study. This represents 18 per cent,
response rate. This is less than the minimum level whose results can be relied on to
make inferences in this kind of study. It is further noted from table 1.6, that, whereas
both Companies F and G more or less consider similar mixed analyser and
prospector strategy types, with the latter using also defender strategy, the latter was
ranked the best performing company, while the former was twelfth. The culture
types for the two companies were different, as Company G considered a dominant
collaboration culture, while, Company F, used a mixed control and cultivation
culture types. Consequently, it is likely that other factors other than the choice of
strategy and culture types determined the levels of performance in this sector
Figure 1.4: Monthly Average Share Prices - Finance and Investment - September 2004 to September 2005
C o m p a r a t i v e S h a r e P r i c e s - F i n a n c e a n d I n v e s t m e n t - S e p t 0 4 to S e p t 05
47
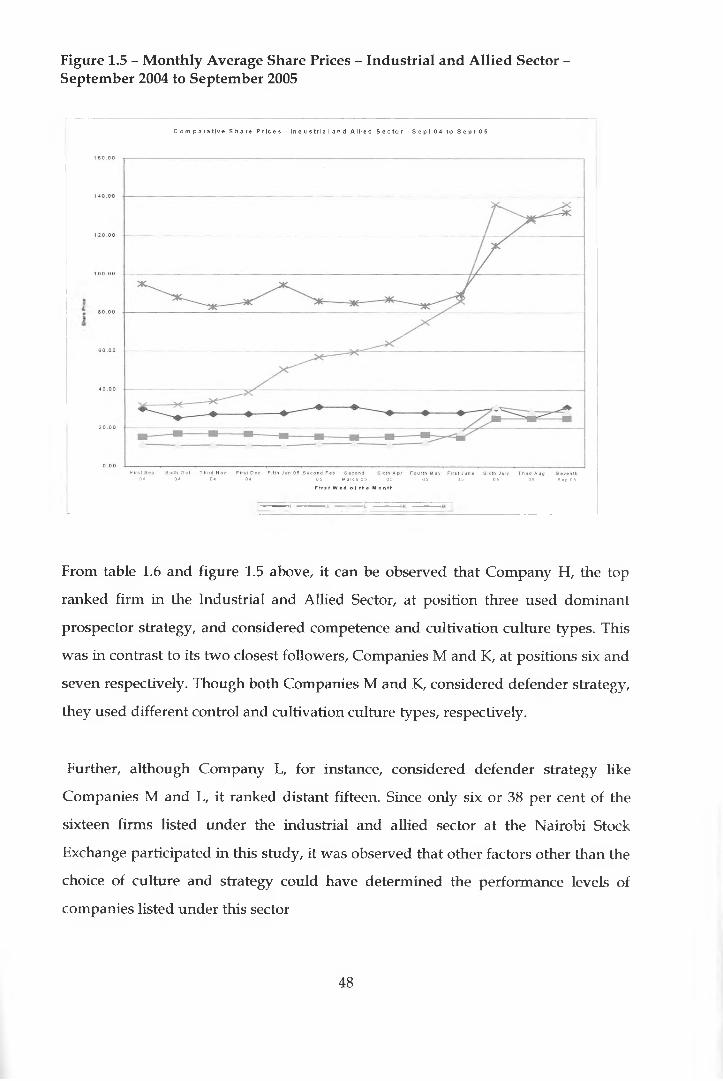
Figure 1.5 - Monthly Average Share Prices - Industrial and Allied Sector -September 2004 to September 2005
C o m p a r a t i v e Sh ar e Pr i c es - I ndust r i al and Al l ied S e c t o r - S e p t 04 to S e p t 05
04 04 04 04 05 March 05 05 05 05 05 05 Sep 05
F i r s t W e d o t t h e Mo n t h
From table 1.6 and figure 1.5 above, it can be observed that Company H, the top
ranked firm in the Industrial and Allied Sector, at position three used dominant
prospector strategy, and considered competence and cultivation culture types. This
was in contrast to its two closest followers, Companies M and K, at positions six and
seven respectively. Though both Companies M and K, considered defender strategy,
they used different control and cultivation culture types, respectively.
Further, although Company L, for instance, considered defender strategy like
Companies M and L, it ranked distant fifteen. Since only six or 38 per cent of the
sixteen firms listed under the industrial and allied sector at the Nairobi Stock
Exchange participated in this study, it was observed that other factors other than the
choice of culture and strategy could have determined the performance levels of
companies listed under this sector
48
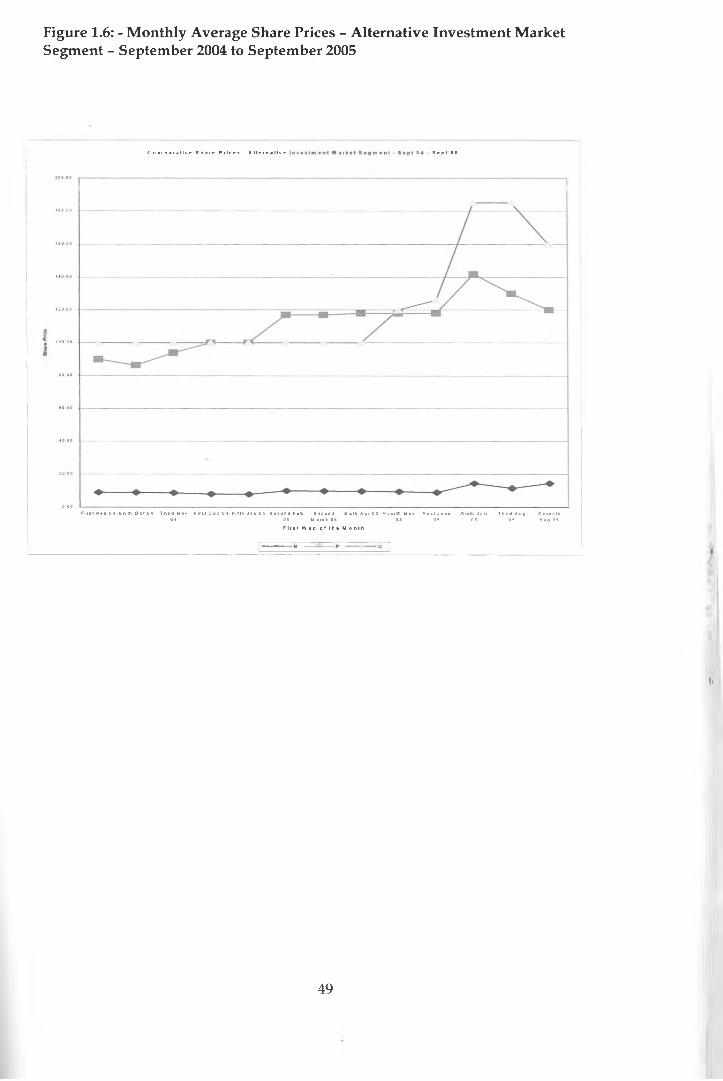
Figure 1.6: - Monthly Average Share Prices - Alternative Investment MarketSegment - September 2004 to September 2005
C o m p a r a t i v e S h a r e P r i c e s - A l t e r n a t i v e S e p t 05
First Sep 04 Sixth Oct 04 Third Nov F i rs tDe c0 4 Fifth Jan 05 Second Fab Second Sixth Apr 05 Fourth May First June Sixth July Third Aug Seventh 04 05 March 05 05 05 05 05 Sep 05
F i r s t W e d of t he M o n t h
(l
49

Of the three firms that participated in this study, Companies Q and P ranked fourth
and fifth respectively, while Company N ranked last, at position sixteen, though all
of them considered defender strategy as the dominant strategy type.
Further, although both Company Q and P used a dominant control culture,
Company N preferred a mixed collaboration, competence and cultivation culture
types. But because the three out of nine companies, represents only 33.3 per cent, this
level of participation, is low, and may not enable research findings to be validated.
Hence, it can be observed that other factors other than the consideration of culture
and strategy may have influenced performance levels of firms in the alternative
investment market segment of the Nairobi Stock Exchange.
50
CHAPTER FIVE - DISCUSSION, CONCLUSIONS AND RECOMMENDATIONS
5.1 Introduction
This chapter sets out first to revisit the objectives of the researcher as they were set in
the research proposal and whether they have been achieved. Second, it highlights
the drawbacks that were encountered in the research process. Finally, the researcher
makes recommendations for further research.
5.2 Discussion and Conclusions
As was explained in Chapter Four, it was observed that 25 per cent of the 16 firms
that responded to the research survey considered culture in their strategy to a great
extent and 50 per cent to a good extent. Since 33.3 per cent response rate was
realised, this can be taken as a representative sample. Also, all sectors were
represented in the respondents sixteen group of firms that responded. Thus, it can be
argued that 75 per cent of the companies listed at the Nairobi Stock Exchange
consider culture in their strategy to a good or great extent. In addition, another 19.5
per cent consider culture in their strategy to a fair extent. This, therefore, makes a
total of 94.5 per cent of firms that consider culture in strategy. Thus, only 5.5 per cent
do not consider any aspects of culture in their strategies. Similarly, the researcher
determined that on average 94.5 of the companies surveyed practiced mixed culture
to a fair extent as much as there was evidence of dominant culture(s). Hence the first
objective of the research was attained.
The second objective of the research was to establish the relationship between
corporate culture types, strategy types and performance. This was to be determined
using the chi - square test. The null hypothesis was that culture and strategy choices
do not determine performance levels and the alternative hypothesis was that they do
determine performance levels. The researcher noted that the chi-square test could
not be relied on as the counts, that is, the observed frequencies, were less than the
minimum required count of 5 for the correct use of the chi - square statistic.
51
Consequently, the researcher set to determine this relationship using the tabular
analysis of the culture, strategy and average share prices of the companies as
detailed in Chapter Four. Ninety per cent of the top ten performing companies in the
survey, measured by the share prices, practiced a defenders strategy. Of the ten, fifty
per cent used control culture and defenders strategy. All the top ten ranked
companies (representing 62.5 per cent), nine or ninety per cent, (see tables 1.5 and
1.1) practiced control culture to, at least, a good extent and also considered defender
strategy at least to a fair extent on average. Of the last ranked six firms using the
share prices, only two or 12.5 per cent used control culture to a good extent, that is,
companies J and N, while the other four or 25 per cent considered control culture to
a fair extent. None of these last six ranked firms used control culture to a great extent
though four of them did not quite consider defender strategy in their strategic
practices. It was therefore, determined that, the use of control culture to a good and a
fair consideration of defender strategy could enhance performance of the firm.
It was evident that all the top ten ranked companies using the share prices
considered a mixed culture in their strategy, at least to a good extent (see tables 1.1
and 1.5), and seven of them also considered prospector strategy. Since fifteen
companies considered defender and prospector strategies at least to a fair extent, on
the average, compared to nine and three for analyser and reactor strategies,
respectively, this could further confirm the fact that those companies that considered
a culture mix, with control culture as the dominant culture, and a defender and/or
prospector strategies, performed better than those that did not.
However, using the top five ranked companies as examples, the researcher found
that, the choice of culture and strategy types, do not determine performance.
Whereas the top ranked company virtually uses all culture types with dominant
control and cultivation cultures on the one hand and prospector and analyser Miles
and Snows' Strategy Types, on the other, its closest follower at number two,
practices dominant control and competence, and defender and reactor, cultures and
strategy types, respectively. Company G, which ranked third, practiced defender
52
strategy, and natured competence and cultivation as dominant culture types.
Companies Q and P at positions four and five respectively both practiced control
culture and defenders strategy. Companies Q and P incidentally are in the same
sector and it may be influenced by other factors in their culture and strategy
preference that incidentally appear to be unique
From the foregoing, it can be argued that there may be other factors other than the
choice of culture and strategy types that determine performance and therefore share
prices. Such factors may include the profitability levels, the respect and confidence
the public have for the Chief Executive Officer, the Board of Directors and senior
management, exogenous factors such as weather, insider information, et cetera.
Furthermore, the sample of sixteen firms is too small to all the forty eight companies
listed at the Nairobi Stock Exchange for the key differences to emerge. Also sectoral
differences could have played a role; yet the sectoral samples are too small, in some
cases only two or three firms. Even in cases where the total sector are four, for
example, better results would best be identified by studying all the four and not just
two.
53
5.3 Challenges and Recommendations
The researcher conducted a survey of all the companies listed at the Nairobi Stock
Exchange due to the fear of high non-response factor. He used drop and courier and
return by post due to lack of time to interview the respondents. A further census
study aimed at interviewing the respondents would perhaps increase the response
rate and results of these findings.
A research in the specific sector companies would be important to study in depth the
culture and strategy choices and any relationship with the performance of the firms.
This is so because strategy is sensitive to the context in which it is practiced.
A research using performance indicators for a different period or a longer time
would be encouraged to confirm any changes in culture and strategy choices and
their resultant effect on the performance of the firms. Again this is because strategy
is sensitive to time. Secondly, a longer period may lead to changes in other
exogenous factors that affect performance, choice of culture and strategy types.
Studies aimed at determining which factors determined and/or the degree at which
they affect the performance of the companies listed at the Nairobi Stock Exchange
should be encouraged.
Case studies in specific company culture practices and the extent at which they are
considered in strategy choices may be recommended for further research as this may
reduce the research costs in terms of time and money.
54
REFERENCES
Abell, D. F. (1980): Defining the business: The Starting Point Of Strategic Planning. Englewood Cliffs, N.J.: Prentice-Hall.
Andrews, K. (1971): The Concept of Corporate Strategy, Homewood, 1L; Irwin U.K.
Ansoff, H. I. (1965): Corporate Strategy: An Analytic Approach to Business Policy for Growth and Expansion; McGraw Hall Company.
Ansoff, I. and McDonnell, E. (1994): Implanting Strategic Management, 2nd Edition, Prentice Hall, Europe.
Aosa, E. (1983): An Emperical Investigation of Aspects of Strategy Formulation and Implementation within Large Private Manufacturing Companies in Kenya, PhD Thesis, University of Strathclyde, UK.
Burnes, B. (2000): Managing Change; a Strategic Approach to Organisation's Dynamics, 3rd Edition, Prentice Hall, London.
Bums, T., and M. Stalker (1961): The Management of Innovation. London: Tavistock.
Capital Markets Authority (2005): Online Publication.
Carol, R. H. (1982): Strategy; Overview Extended Adelphi Paper, International Institute for Strategic Studies London.
Dale Boaden R. J. and Lascelles D. (1990): Total Quality Management: Anoverview. In Dale, B.G. ed. Managing Quality, ed. B. G. Dale, 3-39, Prentice Hall, New York.
Deal, T. E. R. Kennedy (2000): Corporate Cultures and Measurable Impact on Strategy and Performance, 1st Edition.
Fahey, L., and Narayanan, V. K. (1986): Macroenvironmental Analysis for Strategic Management, West Publishing Company, New York.
Gitonga, T. (2003): Innovative Processes and the Perceived Role of the ChiefExecutive Officer in the Banking Industry, Unpublished MBA Thesis, University of Nairobi, Kenya.
Grant, R. M. (1998): Contemporary Strategy Analysis, 3rd Edition Blackwellpublishers Limited, UK.
55
Gregory A. B. (2003): Online Publication Strategic Planning and FinancialPerformance in the Food Processing Sector, Online Publication.
Hagberg and Heifetz (2001): The Learning Curve: Journal of Adult Education and Workplace Education for Corporate Culture/Organisation's Culture. Online Publication.
Hage, J. (1980): Theories of Organisations: Form, Process, and Transformation,John Wiley and Sons, New York.
Hax, A. C. and Majilufm N. S. (1990): The Strategy Concept and Process; A Pragmatic Approach, Prentice Hall, New Jersey.
Hofstede, G. H. (1992): Cultures and Organisations, Institute for Research on Intercultural Cooperation, McGraw - Hill Book International (UK) Limited, England.
International Labour Organisation (2005): Online Publication.
James, W. L. and Hatten, K. J. (1995): Further Evidence on the Validity of the Selftyping Paragraph Approach: Miles and Snow Strategic Archetypes in Banking. Strategic Management Journal 16, no. 2:161-168.
Johnson and Scholes, K. (2002): Exploring Corporate Strategy, 6th Edition, Prentice Hall, New Delhi.
Kariuki. M. (2001): An Emperical Investigation into the Aspects of Culture and their Influence on the Marketing Strategies in the Beverage Industry in Kenya, Unpublished MBA Thesis, University of Nairobi, Kenya.
Lahey, P. R., (2001): Evaluating the Impact of Strategic Planning on Organisation's Effectiveness and Culture, Institute for Court Management, Newfoundland, Canada.
Mahinda, W. (2002) : The Relationship between Organisation's Culture and Human Resource Practices in the Kenyan Manufacturing Industry, Unpublished MBA Thesis, University of Nairobi, Kenya
Maria, P. M. (2001): Perceived Service Quality: The case of Mobile Phone Services,Unpublished MBA Thesis, University of Nairobi.
Miles, et al (1978): Organisation's Strategy, Structure, and Process, McGraw-Hill Book Company, New York.
Miles, R. E. and Snow, C. C. (1994): Fit, Failure and the Hall of Fame, The Free Press, New York.
56
Miles, R. E., and Snow, C. C.(1978): Organisation's Strategy, Structure, and Process, New York, McGraw-Hill.
Miller, D., and Friesen P. H. (1978): Archetypes of Strategy Formulation. Management Science 24: 921-933.
Mintzberg, H. (1973): Strategy-making in Three Modes. California Management Review 16, no. 2: 44-53.
Mwanzi, (1991): Strategic Management Practices in Kenyan Manufacturing Sector,Unpublished MBA Thesis, University of Nairobi, Kenya.
Pearce, J.H.II and Robinson, R. B. Jr. (2003): Strategic Management, Formulation, Implementation and Control, 8th Edition, The Graw Hall/Orwin, New York, 2003.
Peters, T. and Waterman, R (1982): In Search of Excellence, Second Edition, Prentice Hall, United Kingdom.
Porter, E. M. (1980): Competitive Strategy; Techniques for Analyzing Industries and Competitors, New York: The Free Press.
Ramaswamy, K., A.S. Thomas, and Litschert, R. J. (1994): Organisation's Performance in a Regulated Environment. Strategic Management Journal 15, no. 1:63-74.
Shortell, S. M., and E. J. Jazac, (1990): Perceptual and Archival Measures of Miles and Snow's Strategic Types: A comprehensive Assessment of Reliability and Validity. Academy of Management Journal 33, No. 4: 817-832,1990.
Snow, and L. G. Hrebiniak, (1980): Strategy, Distinctive Competence, and Organisation's Performance. Administrative Science Quarterly 25: 317-335.
Steiner, G. (1979): Strategic Planning, Free Press.
Stollsteimert (2000): Improving your Bottom-line, Online Publication.
Thomson, J.L. (1997): Strategic Management, Awareness and Change, 3rd Edition, Prentice Hall, United Kingdom.
Thompson Jr. A. A and Strickland III, A. J. (1996): Strategic Management Concepts and Cases, 9th Edition, Richard Dr. Irwin, USA.
Wairegi, B. C.(2004): The Strategic Response by Life Insurance Companies in Kenya to Change in their Environment, Unpublished MBA Project, University of Nairobi, Kenya.
Walton, P. (1997): Relationship Marketing: It's Role for the Systems Integrator, Online Publication.
57
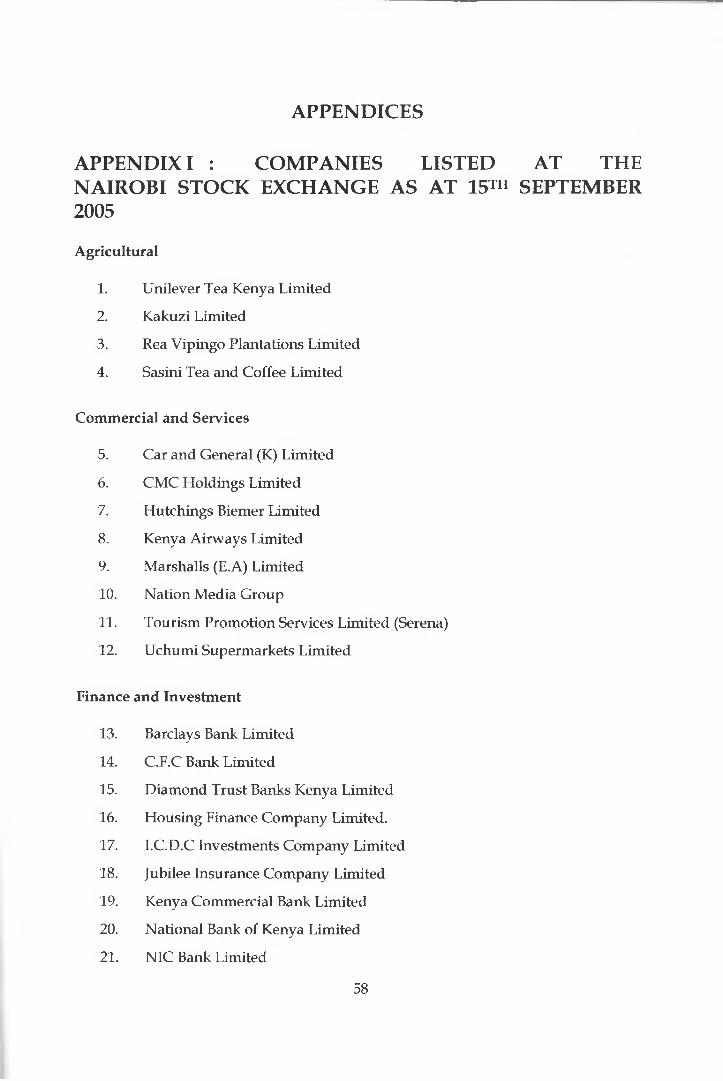
APPENDICES
APPENDIX I : COMPANIES LISTEDNAIROBI STOCK EXCHANGE AS AT 15th 2005
Agricultural
1. Unilever Tea Kenya Limited
2. Kakuzi Limited
3. Rea Vipingo Plantations Limited
4. Sasini Tea and Coffee Limited
Commercial and Services
5. Car and General (K) Limited
6. CMC Holdings Limited
7. Hutchings Biemer Limited
8. Kenya Airways Limited
9. Marshalls (E.A) Limited
10. Nation Media Group
11. Tourism Promotion Services Limited (Serena)
12. Uchumi Supermarkets Limited
Finance and Investment
13. Barclays Bank Limited
14. C.F.C Bank Limited
15. Diamond Trust Banks Kenya Limited
16. Housing Finance Company Limited.
17. I.C.D.C Investments Company Limited
18. Jubilee Insurance Company Limited
19. Kenya Commercial Bank Limited
20. National Bank of Kenya Limited
21. NIC Bank Limited
AT THE SEPTEMBER
58

22. Pan Africa Insurance Holdings Limited
23. Standard Chartered Bank Limited
Industrial and Allied
24. Athi River Mining
25. B.O.C Kenya Limited
26. Bamburi Cement Limited
27. British American Tobacco Kenya Limited
28. Carbacid Investments Limited
29. Crown Berger Limited
30. Olympia Capital Holdings Limited
31. E.A. Cables Limited
32. E.A. Portland Cement Limited
33. East African Breweries Limited
34. Sameer Africa Limited
35. Kenya Oil Company Limited
36. Mumias Sugar Company Limited
37. Kenya Power and Lighting Company Limited
38. Total Kenya Limited
39. Unga Group Limited
Alternative Investment Market Segment
40. A. Baumann and Company Limited
41. City Trust Limited
42. Eaagads Limited
43. Express Limited
44. Williamson Tea Kenya Limited
45. Kapchorua Tea Company Limited
46. Kenya Orchards Limited
47. Limuru Tea Company Limited
48. Standard Group Limited
59
APPENDIX II : QUESTIONNAIRE
Name of Your Company:........................................................
Year of Establishment:........................................................
Nature of Business:........................................................
COMPANY CULTURE, STRATEGY AND PERFORMANCE SURVEY
PURPOSE
This survey is designed to get feedback from you on the Culture and Strategy
choices by companies listed on the Nairobi Stock Exchange and how they impact on
their performance.
ANONYMITY
This survey is being distributed to a random sample of top executives of your
organisation. Your responses to this survey will be completely anonymous. All
completed surveys will be analyzed to determiiie the ciilture, strategy and
performance. Survey results will be shared with management of your organisation.
INSTRUCTIONS
Please consider each question in relation to how you view your organisation in
general. Then mark the circle that best represents your opinion, based on the scale
below. Your feedback is very important and greatly appreciated.
60
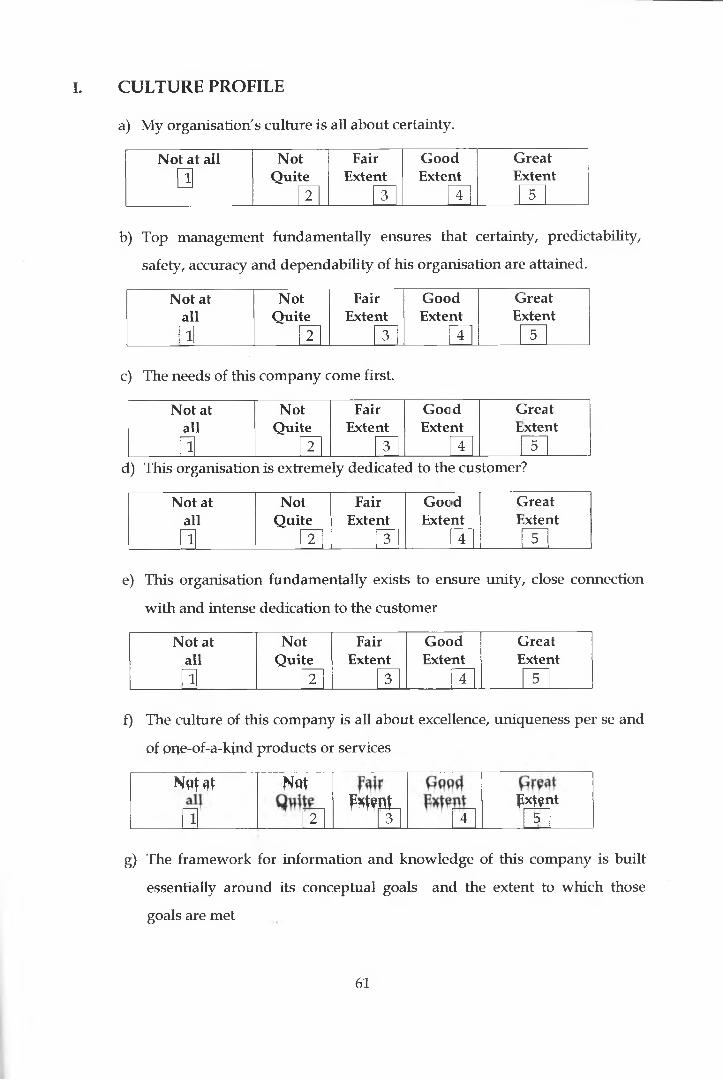
I. CULTURE PROFILE
a) My organisation's culture is all about certainty.
Not at all Not Fair Good Great
0 Quite2
Extent3
Extent4
Extent5
b) Top management fundamentally ensures that certainty, predictability,
safety, accuracy and dependability of his organisation are attained.
Not at alli
Not Fair Good GreatQuite Extent Extent Extent
2 3 m 5
c) The needs of this company come first.
Not at all
11
NoQui
tte2
FaiExte
rnt3
GooExte
dnt4
CEirea.xtei
5
tit
d) This organisation is extremely dedicated to the customer?
Not at all
______ 0 ________
NoQui
tte
2
FaiExte
rnt
3
GocExte
dnt
4
(t3reaixtei
5
itat
e) This organisation fundamentally exists to ensure unity, close connection
with and intense dedication to the customer
Not at allH
Not Fair Good GreatQuite Extent Extent Extent
2 3 4 5
f) The culture of this company is all about excellence, uniqueness per se and
of pqe-of-a-kind products or services
Not 4t mWraL px ynt
______ 1 ________ T 3 4 5
g) The framework for information and knowledge of this company is built
essentially around its conceptual goals and the extent to which those
goals are met
61
Not at All0
NotQuite
2
FairExtent
m
GoodExtent
0
GreatExtent
5
h) This company's culture mainly centres on its values and ideals
extent to which they are attained
Not at Not Fair Good Greatall Quite Extent Extent Extent
0 2 3 4 5
II. STRATEGY
i. This company aggressively maintains prominence within its chosen
market segment and ignores developments outside of this domain.
Not at Not Fair Good Greatall Quite Extent Extent Extent
0 2 3 4 5
ii. This organisation uses a single core technology, often vertically integrated
Not at all(1
Not Fair Good GreatQuite Extent Extent Extent
2 3 4 5
iii. My company has stable structure and processes
Not at all11
Not Fair Good GreatQuite Extent Extent Extent
2 3 4 5
iv. For this company, dominant coalitions are finance and production
Not at all
1
Not Fair Good GreatQuite Extent Extent Extent
2 3 4 5
v. Planning is intensive, not extensive
Not at all Not Fair Good Great0 Quite
2Extent
3Extent
4Extent
5
62
vi. The com pany operates a functional structure
Not at all
0
Not Fair Good GreatQuite Extent Extent Extent
[ 2 l 3 4 5
vii. There is extensive division of labour and high degree of formalization in
this company
x.
Not at all0
NotQuite
2
FairExtent
3
GoodExtent
4
GreatExtent
5
The company practices centralized control
Not at Not Fair Good Greatall Quite Extent Extent Extent0 0 1 3 4 5
This company has broad domain that is in a continuous s
development
Not at Not Fair Good Greatall Quite Extent Extent Extent
0 2 3 4 5
My company monitors a wide range of environmental conditions,
and events
Not at Not Fair Good Greatall Quite Extent Extent Extent
0 2 3 4 5
xi. This company's growth is primarily from new markets and new products;
and uneven, spurt-like growth.
Not at all
_____ 0 ______
NoQui
tte2
FaiExte
rnt
3
GocExte
dnt
4
(E
4reaxtei
5
t\t
This organisation exhibits changing structure and technology
Not at all
_____ 0
NoQui
tte2
FaiExte
rnt
3
GocExte
idnt
4
(E4reaxtei
5
itit
63
xiii. This com pany has frequent prototype production
Not at all
Not Fair Good GreatQuite Extent Extent Extent
2 3 4 5
xiv. This company normally prefers multiple technologies in people not
machines
Not at Not Fair Good Greatall Quite Extent Extent Extent
r a 2 3 4 5
xv. The dominant coalitions for this company are in marketing and research
and development
Not at all
n
NoQui
tte2
FaiExte
rnt3
GooExte
dnt4
CE3rea.xtei
5
tit
This organisation practices broad planning, that is not intensive
Not at all
□
NoQui
tte2
FaiExte
rnt
3
GocExte
dnt
4
(E
3reaxter
5
tit
This company has product - based structure
Not at all
□
NoQui
tte
2
FaiExte
rnt
3
GocExte
dnt
4
CE3reaxter
5
tit
My company practices less division of labour and formalization
Not at all
NoQui
tte
2
FaiExte
rnt
3
GocExte
>dnt
4
(I3reaixtei
5
itat
xix. The information flow in the company is primarily to decentralized
decision-makers.
Not at all
Not Fair Good GreatQuite Extent Extent Extent
2 3 4 5
64
XX. My organisation has a mixture of products and markets, some stable,
others changing
Not at Not Fair Good Greatall Quite Extent Extent Extent
n 2 3 4 5
xxi. This company practices successful imitation through extensive marketing
surveillance
Not at Not Fair Good Greatall Quite Extent Extent Extent
0 2 3 4 5
xxii. The growth of my company normally occurs through market penetration;
though it may also occur through product and market development.
Not at all0
NoQui
tte2
FaiExte
rnt3
GooExte
dnt4
CFirea.xtei
5
tit
xxiii. This company maintains moderate efficiency.
Not at all0
NoQui
tte2
FaiExte
rnt
3
GooExte
dnt
4
(I5reaxtei5
tit
xxiv. My organisation exhibits dual technology as a core characteristic.
Not at all
_______ 0________
NoQui
tte
2
FaiExte
rnt
3
GocExte
idnt
4
(Ejreaxtei
5
itit
xxv. This company practices an intensive and comprehensive planning
Not at all
0
NoQui
tte2
FaiExte
rnt3
GooExte
dnt4
ClUrea]xtei
5
tit
xxvi. My company uses a matrix, functional and product structure
Not at all
______ 0 ________
NotQuite
2
FaiExte
rnt
3
GocExte
idnt
4l5rea’xtei
5
tat
65

xxvii. This organisation experiences difficulties in control and must therefore be
able to trade off efficiency and effectiveness
Not at all
n
NoQui
tte2
FaiExte
rnt
3
GooExte
dnt
4
(firea.xtei
5
tit
This company uses a coordination that is both simple and complex
Not at all
______ 0 ________
NoQui
tte2
FaiExte
rnt
3
GocExte
idnt
4
(E3reaxter
5
tit
xxix. This organisation maintains a dominant coalition in marketing, applied
research, and production
Not at all11
Not Fair Good GreatQuite Extent Extent Extent
2 3 4 5
xxx. The predominant characteristic of this company include the failure by
management to articulate a viable organisation's strategy.
Not at all1
Not Fair Good GreatQuite Extent Extent Extent
2 3 4 5
Thank you