The Relationship between Method of Placement and … · Research Questions ... Chapter Two: Review...
181
i The Relationship between Method of Placement and Success in College Algebra and English Composition I at Allen Community College Regena M. Bailey Aye B.A., Baker University, 1994 M.A., Emporia State University, 1998 Submitted to the Graduate Department and Faculty of the School of Education of Baker University in partial fulfillment of the requirements for the degree of Doctor of Education in Educational Leadership ________________________________ Susan Rogers, Ph.D. Major Advisor ________________________________ Marcus Childress, Ph.D. ________________________________ Amber Anderson, Ed.D. Date Defended: January 28, 2016 Copyright 2016 by Regena M. Bailey Aye
Transcript of The Relationship between Method of Placement and … · Research Questions ... Chapter Two: Review...

i
The Relationship between Method of Placement and Success in College Algebra and
English Composition I at Allen Community College
Regena M. Bailey Aye
B.A., Baker University, 1994
M.A., Emporia State University, 1998
Submitted to the Graduate Department and Faculty of the School of Education of
Baker University in partial fulfillment of the requirements for the degree of
Doctor of Education in Educational Leadership
________________________________
Susan Rogers, Ph.D.
Major Advisor
________________________________
Marcus Childress, Ph.D.
________________________________
Amber Anderson, Ed.D.
Date Defended: January 28, 2016
Copyright 2016 by Regena M. Bailey Aye

ii
Abstract
Community colleges attract students at varying levels of ability. Colleges use
tests to place students in courses to increase the likelihood of success. Placement tests
have become controversial because it is unclear if they increase the likelihood of a
student being successful or have a negative effect on success and retention. Retention
and success are important considerations at a time when colleges are being asked to
increase the number of graduates with credentials, certificates, and degrees. In this
research study, whether or not a relationship existed between the method of placement
and student success in College Algebra (MAT105) and English Composition I (COL101)
at Allen Community College was examined. Success was defined as earning grades of A,
B, C, or P. The effect of age, gender, and the method of course delivery on success was
also explored. Age was defined as traditional or non-traditional. Non-traditional students
were age 24 and older. Data from Spring 2003 through Summer 2013 was utilized in this
study. The results of this study suggested that a relationship existed between the method
of placement and success for both math and composition. Students who were placed
using the ACT and ASSET tended to be successful. Online and concurrent students were
the exceptions because students placed for these modes of delivery using the ASSET
tended to be unsuccessful. Students who were placed using the COMPASS, the
prerequisite course, or a waiver tended to be unsuccessful. Online and concurrent math
students were the exceptions and students placed for these modes of delivery using the
COMPASS tended to be successful. Age and method of course delivery affected the
relationship while gender generally did not. No relationship existed between the method
of course placement and success for non-traditional students.

iii
Dedication
I would like to dedicate this work to my parents who have always encouraged my
efforts. Regardless of the endeavor, their words of wisdom and confidence in me
provided the necessary support network for success. I would also like to dedicate this
work to my late husband, Phillip. While he cannot physically celebrate the final steps in
achieving this goal with me, I know he proudly accompanied me throughout this journey.

iv
Acknowledgements
There are so many people to thank who helped me make this scholarly journey.
First, I want to thank my family for their support. My mother, father, and siblings have
always believed in me and encouraged my efforts. A special thank you goes to my father
for the many miles he traveled in support of my efforts. I am also thankful for the
patience and support of my friends and colleagues at Allen Community College. Special
thanks go to Mr. Jon Marshall for approving the project and encouraging my efforts. I
owe a debt of gratitude to Doug for pulling the data for my study. I owe Anne my thanks
for her knowledge of Microsoft Word and troubleshooting the table of contents. A
special thank you goes to Peg for her help with the data and statistics. Thanks are due to
my committee (Dr. Rogers, Dr. Childress, and Dr. Anderson) for their thoughtful
assistance with my work. A special thank you goes to my advisor Dr. Rogers for her
patience and support of my efforts.

v
Table of Contents
Abstract .......................................................................................................................... ii
Dedication ..................................................................................................................... iii
Acknowledgements ....................................................................................................... iv
Table of Contents ............................................................................................................v
List of Tables ............................................................................................................... viii
Chapter One: Introduction ...............................................................................................1
Background ..........................................................................................................2
Statement of the Problem .....................................................................................8
Purpose of the Study .......................................................................................... 10
Significance of the Study ................................................................................... 11
Delimitations ..................................................................................................... 11
Assumptions ...................................................................................................... 12
Research Questions ............................................................................................ 12
Definition of Terms ............................................................................................ 14
Overview of the Methodology ............................................................................ 17
Organization of the Study................................................................................... 18
Chapter Two: Review of the Literature .......................................................................... 19
Community College Students ............................................................................. 19
Placement Testing .............................................................................................. 24
Placement Tests ................................................................................................. 34
The Impact of Remediation ................................................................................ 42
The Completion Agenda .................................................................................... 50

vi
Summary ........................................................................................................... 52
Chapter Three: Methods ................................................................................................ 53
Research Design ................................................................................................ 53
Population and Sample ....................................................................................... 54
Sampling Procedures .......................................................................................... 54
Instrumentation .................................................................................................. 55
Instrumentation ACT ......................................................................................... 55
Instrumentation COMPASS ............................................................................... 56
Instrumentation ASSET ..................................................................................... 59
Cut Scores and Placement Policy ....................................................................... 61
Measurement .......................................................................................... 63
Validity and reliability ............................................................................ 64
Data Collection Procedures ................................................................................ 71
Data Analysis and Hypothesis Testing ............................................................... 71
Limitations ......................................................................................................... 76
Summary ........................................................................................................... 77
Chapter Four: Results .................................................................................................... 78
Descriptive Statistics .......................................................................................... 78
Hypothesis Testing ............................................................................................. 85
Summary ......................................................................................................... 130
Chapter Five: Interpretation and Recommendations ..................................................... 132
Study Summary ............................................................................................... 132
Overview of the problem. ................................................................................. 133
vii
Purpose statement and research questions......................................................... 133
Major findings ................................................................................................. 134
Findings Related to the Literature .................................................................... 136
Conclusions ..................................................................................................... 140
Implications for action.. .......................................................................... 141
Recommendations for future research.. ................................................... 142
Concluding remarks................................................................................ 144
References ................................................................................................................... 146
Appendices .................................................................................................................. 163
Appendix A: Baker University IRB Request ................................................... 166
Appendix B: Baker University IRB Letter of Approval .................................... 169
Appendix C: Allen Community College Letter of Approval ............................. 171

viii
List of Tables
Table 1. ACT Subtest Information ................................................................................. 56
Table 2. Allen Community College Placement Scores for English Composition I
(COL101) ....................................................................................................... 62
Table 3. Allen Community College Placement Scores for College Algebra (MAT105) .. 62
Table 4. Math Dataset - Age .......................................................................................... 78
Table 5. Math Dataset - Gender ..................................................................................... 79
Table 6. Math Dataset - Delivery Method ...................................................................... 79
Table 7. Math Dataset - Success .................................................................................... 80
Table 8. Math Dataset - Method of Placement ............................................................... 81
Table 9. Composition Dataset - Age .............................................................................. 81
Table 10. Composition Dataset - Gender........................................................................ 82
Table 11. Composition Dataset - Delivery Method ........................................................ 82
Table 12. Composition Dataset - Success ....................................................................... 83
Table 13. Composition Dataset - Method of Writing Placement ..................................... 84
Table 14. Composition Dataset - Method of Reading Placement .................................... 85
Table 15. Observed and Expected Frequencies for H1 ................................................... 87
Table 16. Observed and Expected Frequencies for H2 - Traditional Students ................. 89
Table 17. Observed and Expected Frequencies for H2 - Non-traditional Students .......... 90
Table 18. Observed and Expected Frequencies for H3 - Male Students .......................... 92
Table 19. Observed and Expected Frequencies for H3 - Female Students....................... 94
Table 20. Observed and Expected Frequencies for H4 - Burlingame/Outreach
Students ......................................................................................................... 95
ix
Table 21. Observed and Expected Frequencies for H4 - Iola Students ............................ 97
Table 22. Observed and Expected Frequencies for H4 - Online Students ....................... 98
Table 23. Observed and Expected Frequencies for H4 - Concurrent Students............... 101
Table 24. Observed and Expected Frequencies for H5 ................................................. 102
Table 25. Observed and Expected Frequencies for H6 - Traditional Students ............... 104
Table 26. Observed and Expected Frequencies for H6 - Non-traditional Students ........ 105
Table 27. Observed and Expected Frequencies for H7 - Male Students ........................ 107
Table 28. Observed and Expected Frequencies for H7 - Female Students..................... 109
Table 29. Observed and Expected Frequencies for H8 - Burlingame/Outreach
Students ....................................................................................................... 111
Table 30. Observed and Expected Frequencies for H8 - Iola Students .......................... 113
Table 31. Observed and Expected Frequencies for H8 - Online Students ..................... 114
Table 32. Observed and Expected Frequencies for H8 - Concurrent Students............... 115
Table 33. Observed and Expected Frequencies for H9 ................................................. 118
Table 34. Observed and Expected Frequencies for H10 - Traditional Students ............. 120
Table 35. Observed and Expected Frequencies for H10 - Non-traditional Students ...... 121
Table 36. Observed and Expected Frequencies for H11 - Male Students ...................... 123
Table 37. Observed and Expected Frequencies for H11 - Female Students ................... 124
Table 38. Observed and Expected Frequencies for H12 - Burlingame/Outreach
Students ....................................................................................................... 127
Table 39. Observed and Expected Frequencies for H12 - Iola Students ........................ 128
Table 40. Observed and Expected Frequencies for H12 - Online Students ................... 129
Table 41. Observed and Expected Frequencies for H12 - Concurrent Students ............. 130

1
Chapter One
Introduction
Community colleges, which were first known as junior colleges, originally
provided general education coursework paralleling the first two years at a university
(Beach, 2011). From humble beginnings, the mission of the community college
expanded. Over time, the community college added workforce development coursework
to its offerings to serve stakeholders more effectively (Beach, 2011). Community
colleges attract students who may not wish to seek a bachelor's degree and may not be as
well prepared as students who matriculate directly to a university. As a result, these
institutions provide access to higher education for a broad variety of students at varying
levels of preparation (Beach, 2011).
Before the popularity of placement tests increased, many community colleges
used self-placement. While colleges may have had recommendations, students had the
right to fail. Placement policies were permissive, and students could take courses
regardless of test scores. The open door became the revolving door. Students failed and
left community colleges. To increase the likelihood of student success, many community
colleges now use placement testing to determine student readiness (Cohen & Brawer,
2008). Allen Community College uses placement testing to determine student readiness
for math, science, English, and networking courses. College Algebra and English
Composition I are two courses students historically struggle to complete, and that require
placement test scores at many institutions (Cohen & Brawer, 1987).
Institutions choose a placement test or tests and establish cut-scores students must
meet or exceed to enroll in courses requiring placement scores (Cohen & Brawer, 1987).

2
Students who score below these levels on tests such as the ACT, ASSET, and COMPASS
complete developmental courses such as Intermediate Algebra and Pre-Composition
before beginning College Algebra and English Composition I. Placement policies are
designed to help students be more successful in courses. However, it is not known if
mandatory placement helps students at Allen Community College.
Background
Public community college history began with Joliet Junior College, which was
founded in 1901 (Joliet Junior College, 2013). The founders wanted to create a
postgraduate high school program that would parallel the first two years of a university
degree program. Enrollment grew from six students the first year to 82 students in the
sixteenth year (Joliet Junior College, 2013). The North Central Association granted Joliet
Junior College accreditation the same year (Joliet Junior College, 2013). Community
colleges quickly grew nationwide.
Junior college history in Kansas began about the time Joliet received
accreditation. In 1917, a Kansas law outlined and authorized the taxation necessary to
provide funding to support the establishment of junior colleges (Cohen & Brawer, 2008).
Iola Junior College (IJC), located on the third floor of Iola High School, was established
in 1923 under the auspices of Iola Public Schools as an extension of the high school
(Allen Community College, 2014). The Board of Education of Iola Public Schools
exercised supervision. IJC, which was supposed to serve the students of District 10,
enrolled 93 students during its first year of operations.
As junior colleges grew and gained popularity, their mission also expanded. After
World War II, a growing number of students needed workforce skills and wanted

3
transferable courses of study. Soldiers who served during World War II had military
education benefits that they could use to attend college. Junior colleges provided these
students with access to workforce training and transfer coursework.
Bogue (1950) defined the mission of the junior college as offering "a different
type of curriculum suited to the larger and ever-changing civic, social, religious, and
vocational needs of the entire community in which the college is located" (p. xvii). The
number of two-year institutions and enrollments at two-year institutions grew quickly
because junior colleges conveniently provided vocational training and transfer
coursework in the local area. Many junior colleges also had a vocational function in their
charter (Cohen & Brawer, 2008).
Since the 1960s, two-year colleges have strived to provide access to students
(Brock, 2010; Zeidenberg & Bailey, 2010). In 1965, the local school district in Iola
requested that IJC expand its service area. Rather than just serving students from District
10, students from Allen County had started to attend. Iola Junior College became Allen
County Community Junior College in 1965. Its focus shifted from enhancing high school
offerings to serving the county with courses that paralleled the first two years at a
university (Allen Community College, 2014). Construction began in 1966 on a 90-acre
campus in Iola. Classes were first offered on the Iola Campus in 1970. In the 1970s, the
name junior college declined in use and the name community college gained popularity.
As a result, Allen County Community Junior College changed its name to Allen County
Community College in 1980 (Allen Community College, 2014).
In 1991, Allen Community College built an outreach campus in Burlingame and
expanded to offer courses in communities in its service area of Allen, Coffey, Osage,
4
Woodson, southern Wabaunsee, and southern Anderson counties. The college offered
concurrent courses for high school students, evening courses at community sites, and a
growing number of day, night, and weekend courses in Burlingame. In Spring 2001,
after having experimented with the use of the Internet to enhance courses, Allen
Community College offered its first fully online course. In 2007, the college began using
the name Allen Community College in recognition of the fact that many of its students
attended classes outside the home county.
As the population in the United States has grown and the number of students
attending college after high school continued to grow, community colleges have
experienced growth as well. "Community colleges now operate in every state and enroll
half of the students who begin college in the United States" (Cohen & Brawer, 2008, p.
19). By 2012, America's 1,132 community colleges served 13 million students
(American Association of Community Colleges, 2012). In 2015, Allen Community
College enrolled over 2,500 students per semester who sought personal enrichment,
industry credentials, certificates, or associates degrees (Allen Community College, 2015).
Community college students come from a variety of backgrounds and enter higher
education at varying levels of ability. According to the American Association of
Community Colleges (AACC), 42% of attendees at community colleges are first-
generation college students (AACC, 2012). First-generation college students are the first
in their families to attend college. Students at community colleges include high school
students taking dual credit courses, students looking for transfer college coursework,
adults seeking workforce skills, and students seeking personal development. In 2012, the

5
average community college student was 28 years old with 15% of community college
students over the age of 40 (AACC, 2012).
Increasing numbers of students enrolling in colleges today need remedial
coursework. According to the 2011 Digest of Education Statistics, 42% of first-time
undergraduates in public two-year institutions took at least one remedial course (Snyder
& Dillow, 2012). The reasons undergraduates need remedial courses vary. Adult
learners often have a break in studies between high school graduation and attending
college, which can result in a need for remediation. High school students often graduate
without adequate preparation for college-level coursework. According to Adelman
(2005), "Over sixty percent of traditional-age students entering community colleges from
both the High School class of 1982 and High School Class of 1992 wound up in at least
one remedial course" (Adelman, 2005, p. xxii).
College personnel consider placing students in the appropriate courses, based on
student skill level, a key factor that influences student success. To place students
appropriately, colleges develop placement policies (Cohen & Brawer, 1987). Allen
Community College's Mandatory Placement Policy specifies, "In an effort to assure that
all students pursuing degrees or certificates at ACCC are fully prepared to succeed in
college courses, the college administers assessment tests such as the COMPASS or
ASSET to evaluate student readiness" (Allen Community College, 2012).
Misplacing students causes several issues. Students may fail courses if they are
placed above their skill level. Students may waste money on unnecessary remedial
courses if they are inaccurately placed in a course below their skill level. Students may
be bored if placed in a course below their skill level. Placement practices influence the

6
schedules created by the college and staffing needs. Instructors also struggle to teach
courses that include underprepared students. According to Hughes and Nelson (1991),
student retention is likely to improve as the accuracy of placement improves. Assessment
of student skill level and placement are important aspects of the advising and enrollment
process.
Colleges use a variety of tests to place students in coursework including the ACT,
SAT, ASSET, and COMPASS. According to ACT (2010), 47% of high school graduates
in 2010 took the ACT (ACT, 2010). Of these students, 66% earned an 18 or higher in
English, which is the standard for college readiness. Only 43% of the graduating seniors
earned a 22 or higher in math and met the benchmark for college readiness (ACT, 2010).
"Only 24% of all 2010 graduates met all four ACT College Readiness Benchmarks,
meaning that 76% were not adequately prepared academically for first-year college
courses in English Composition, College Algebra, social sciences, and Biology" (ACT,
2010, p. 19).
This study of the method of placement and student success in College Algebra
(MAT105) and English Composition I (COL101) was conducted at a public, rural
community college with about 3,000 students. Mandatory placement began at Allen
Community College in 1997 (Allen Community College, 2012). Cut-scores were
adjusted in August 2002 (Allen Community College, 2012). Based on Allen Community
College's placement policy, students can be placed based on an ACT score that is less
than three years old, an SAT score less than 3 years old, an ASSET test score, a
COMPASS test score, successful completion of prerequisite coursework, or by waiver
(Allen Community College, 2012). Few students at Allen use SAT scores for placement,

7
and few waivers are granted. Most students at Allen use ASSET, ACT, COMPASS, or
the prerequisite course for placement in College Algebra (MAT105) and English
Composition I (COL101) (Allen Community College, 2012).
At Allen Community College, students are placed into College Algebra
(MAT105) with an ACT score of 20 or higher, an ASSET score of 39 or higher on the
Intermediate Algebra assessment, a COMPASS score of 50-100 on the Algebra
assessment, or a score of 0-43 on the College Algebra assessment (Allen Community
College, 2012). At Allen Community College, placement in English Composition I
(COL101) requires an appropriate reading score and an appropriate writing score (Allen
Community College, 2012). Students can enroll in English Composition I (COL101) at
Allen Community College with ACT Reading and Writing scores of 16 or higher, an
ASSET Reading Score of 39 or higher and a Writing score of 41 or higher, or a
COMPASS Reading score of 73 or higher and a Writing score of 55 or higher (Allen
Community College, 2012).
Students who earn scores below the threshold for placement in College Algebra
(MAT105) or English Composition I (COL101) enroll in the appropriate prerequisite
course. A grade of C or better in Pre-Composition (COL011) or Intermediate Algebra
(MAT020) would allow the student to enroll in English Composition I (COL101) or
College Algebra (MAT105) at Allen Community College. Allen Community College
allows students to appeal course placement and enroll in a course one level higher than
cut-scores indicate with the approval of the Vice President for Academic Affairs (Allen
Community College, 2012). In practice, the Vice President for Academic Affairs
delegates the consideration of waivers to the deans.

8
Courses at Allen Community College are scheduled in various locations
throughout the service area. Allen Community College offers courses on its main
campus in Iola, Kansas; on its outreach campus in Burlingame, Kansas; at outreach sites
around the multi-county service area; in area high schools; and online. Courses are
scheduled in a variety of combinations. Iola Campus administrators schedule classes for
55 minutes three days a week or 85 minutes two times per week. Courses on the
Burlingame Campus meet once a week for three hours or twice a week for 90 minutes.
Courses at area high schools meet on the high school schedule, which varies from five
days a week for 50 minutes to a block schedule. Spring and fall courses meet for eight or
16 weeks, and summer courses meet for four or eight weeks (Allen Community College,
2012).
Allen Community College allows instructors to manage courses. Instructors have
the right to determine the assignment makeup of the course. Standardized outcomes and
more recently common course outlines exist to ensure students learn the same skills in
each course. Instructors sometimes develop their class materials, and others use materials
provided by the publisher to construct course materials. All instructors at Allen
Community College use common textbooks.
Statement of the Problem
Community colleges strive to provide access to higher education for the locations
they serve (Beach, 2011). Community colleges provide access by offering courses in a
variety of locations and formats including concurrent enrollment of high school students,
outreach sites in communities, and through online learning (Allen Community College,
2012). Student populations with varying levels of preparation are attracted to the courses

9
community colleges make accessible (Beach, 2011). Student success and retention are
key concerns of college leaders because of the completion agenda announced by
President Obama and funding (The White House, 2009). The completion agenda refers
to the concept that a higher percentage of students should complete their degree or
certificate, and colleges are accountable for the success of their students. Some leaders
have said states need to consider student success as criteria for funding (U.S. Department
of Education, 2011).
According to the U.S. Department of Education (2011), "Different financial
incentives . . . in state funding formulas are likely to prompt actions by individual
institutions to increase college completion" (U.S. Department of Education, 2011, p. 6).
Great pressure exists for colleges to address student success and increase completion
because students who access education at a community college often fail to complete a
degree or certificate. U.S. Department of Education statistics presented by Hudson,
Kienzl, and Diehl (2007) indicated,
Nearly four out of ten (38%) of those who enroll in occupational certificate
programs fail to earn a credential of any type within six years. Nearly six out of
ten (58%) of students seeking an associate degree in an occupational field fail to
obtain a credential of any type within six years of starting their studies. (p. 38)
This trend is not limited to occupational credentials and degrees. According to the
National Center for Education Statistics (2012), only 28% of community college students
complete a degree within four years and over 70% of students needing remediation fail to
graduate within five years. Because so many students fail to complete coursework
successfully, colleges have created placement policies to help determine whether students
10
are ready for college-level classes and to place students at appropriate levels (Armstrong,
2000).
Placement tests are often part of placement policies as are developmental courses
for those who place in courses below the college-level (Saxon and Morante, 2014).
Placement tests have come under fire for over and under placing students. Over placed
students may struggle to be successful in classes above their skill level. Under placed
students take developmental classes that lengthen their time to degree and add cost to
their program (Saxon and Morante, 2014). Students in developmental courses often do
not complete the courses or their college goals (Aud et al., 2012). Whether placement
method has affected student success at Allen Community College is not known.
Purpose of the Study
The first purpose of this study was to determine if there was a relationship
between method of placement and student success in College Algebra (MAT105) of
students who met the requirements of the mandatory placement policy using COMPASS,
ASSET, or ACT scores, by passing the prerequisite course, or by waiver. The second
purpose of this study was to determine if there was a relationship between student success
in English Composition I (COL101) of students who met the requirements of the
mandatory placement policy by use of COMPASS, ASSET, or ACT scores, by passing
the prerequisite course, or by waiver. The final purpose of the study was to determine to
what extent the relationship between how a student meets the placement requirement for
English Composition I (COL101) and College Algebra (MAT105) is affected by age,
gender, or the method of course delivery.

11
Significance of the Study
Past studies have shown that placement tests vary in their effectiveness
(Armstrong, 2000; Cohen & Brawer, 1987; Gillespie, 1993; Hughes & Nelson, 1991;
Hughes & Scott-Clayton, 2011; Isonio, 1992). Allen Community College uses several
methods to place students into math and English courses. What is not known is whether
the method of placement used at Allen Community College relates to student success in
College Algebra (MAT105) and English Composition I (COL101). Using the results of
this study, the college could adjust its placement policy. If one method of placement
leads to greater student success than the others, the policy could be rewritten to focus on
that method of placement, and if a method currently used for placement is less likely to
lead to student success, the policy can be rewritten to eliminate the less accurate method
of placement. If students completing the prerequisite course are less likely to be
successful, the curriculum may need revision. Changes in placement to focus on the most
accurate methods should have a direct impact on student success. Students may be more
likely to complete key courses required to earn degrees. This information could also help
other community colleges establish placement guidelines, contribute to state data related
to the accuracy of placement testing, and contribute to the body of knowledge on this
topic. As Allen Community College considers future placement policy in AY2015-2016,
the success or failure of previous methods is an important consideration.
Delimitations
"Delimitations are self-imposed boundaries set by the researcher on the purpose
and scope of the study" (Lunenburg & Irby, 2008, p. 134). One delimitation of this study
was that the data came from one institution. Other community colleges working on

12
placement practices might be interested in the study, but the results may not be
generalized to other institutions. Additionally, this study only included students at Allen
Community College enrolled from Spring 2003 through Summer 2013. The study used
data from Spring 2003 because that was the first semester advisors used the placement
policy adopted in 2002 for enrollment. The sample included College Algebra (MAT105)
students and English Composition I (COL101) students. All students who completed
these courses were included; however, students were only included the first time they
completed College Algebra (MAT105) or English Composition I (COL101).
Assumptions
According to Lunenburg and Irby (2008), assumptions are "Postulates, premises,
and propositions that are accepted as operational for the purposes of the research" (p.
135). Several assumptions have been made in this research study. First, it was assumed
that the data from the Campus Administrative Resource Solution (CARS), the student
information system, was accurate. This data included grades, demographic information,
and placement information. Second, there was an assumption that students who receive
the same grade did the same level of work. Several different instructors taught the
sections of the courses over the years, and grading policies may vary among instructors.
Third, there was an assumption that placement test scores are an accurate reflection of
student ability. Finally, there was an assumption that students did their best on the
placement tests.
Research Questions
According to Lunenburg and Irby (2008), research questions are "critical
components" of dissertations (p. 126). Lunenburg and Irby (2008) call research questions

13
"a directional beam for the study" (p. 126). The following research questions guided this
study:
RQ1. To what extent is there a relationship between how a student meets the
math placement requirement for College Algebra (MAT105) and student success?
RQ2. To what extent is the relationship between how a student meets the math
placement requirement for College Algebra (MAT105) and student success affected by
age?
RQ3. To what extent is the relationship between how a student meets the math
placement requirement for College Algebra (MAT105) and student success affected by
gender?
RQ4. To what extent is the relationship between how a student meets the math
placement requirement for (College Algebra) MAT105 and student success affected by
course delivery mode?
RQ5. To what extent is there a relationship between how a student meets the
writing placement requirement for English Composition I (COL101) and student success?
RQ6. To what extent is the relationship between how a student meets the writing
placement requirement for English Composition I (COL101) and student success affected
by age?
RQ7. To what extent is the relationship between how a student meets the writing
placement requirement for English Composition I (COL101) and student success affected
by gender?

14
RQ8. To what extent is the relationship between how a student meets the writing
placement requirement for English Composition I (COL101) and student success affected
by course delivery mode?
RQ9. To what extent is there a relationship between how a student meets the
reading placement requirement for English Composition I (COL101) and student
success?
RQ10. To what extent is the relationship between how a student meets the
reading placement requirement for English Composition I (COL101) and student success
affected by age?
RQ11. To what extent is the relationship between how a student meets the
reading placement requirement for English Composition I (COL101) and student success
affected by gender?
RQ12. To what extent is the relationship between how a student meets the
reading placement requirement for English Composition I (COL101) and student success
affected by course delivery mode?
Definition of Terms
To understand any study, one must first understand the terms used. Lunenburg
and Irby (2008) purport, "You should define all key terms central to your study" (p. 118).
For the purpose of this study, the following terms were defined:
American College Testing Program (ACT). The ACT is a test of college
preparedness developed by the American College Testing Program. This test includes
English, Mathematics, Reading, and Science subtests (ACT, 2014).
15
Assessment Skills for Successful Entry and Transfer (ASSET). ASSET is a
placement test developed by the American College Testing Program (ACT). This test
includes Numerical Skills, Intermediate Algebra, Reading Skills, and English Skills
subtests (ACT, 2009).
College Algebra. College Algebra (MAT105) is the course offered by Allen
Community College that satisfies the math requirement for an Associate of Arts,
Associate of Science, or Associate of General Studies degrees. Under College Algebra
(MAT105) the college catalog specifies, “Covers the same topics as MAT020 plus
logarithms, sequences, series, determinants, and matrices" (Allen Community College,
2012, p. 114).
College-level course. Allen Community College considers a course numbered
100 or above that counts for college credit and toward a degree or certificate program a
college-level course (Allen Community College, 2012).
Computer-adaptive Placement Assessment and Support System
(COMPASS). The American College Testing program developed COMPASS. This
placement test includes tests in Reading, Mathematics, and English (ACT, 2012).
Cut-score. A cut-score is a point on a test scale used to differentiate between
different groups of students (Zieky & Perie, 2004).
Developmental course. A developmental course refers to coursework below the
college-level. At Allen Community College, courses numbered below 100 are
developmental. Developmental courses, which are sometimes referred to as remedial,
prepare students to complete degree requirements such as College Algebra (MAT105)
and English Composition I (COL101)(Allen Community College, 2012).

16
Intermediate Algebra (MAT020). Intermediate Algebra (MAT020) is a
remedial course offered by Allen Community College that prepares students for College
Algebra (MAT105). The Allen Community College 2012-13 catalog relates,
“Developmental Education-MAT020 will not apply toward graduation requirements.
Covers basic topics in algebra, including the solution of linear and quadratic equations,
factoring, graphing, inequalities, rational and irrational numbers and functions” (Allen
Community College, 2012, p. 114).
Intermediate Reading (COL013). Intermediate Reading (COL013) is a remedial
course offered by Allen Community College that prepares students for English
Composition I (COL101). According to the Allen Community College 2012-13 catalog,
Developmental Education-COL013 does not apply toward graduation
requirements. Intermediate Reading is designed to prepare students for academic
and vocational reading at college level. Those skills stressed include perception
and comprehension, strategies for learning, and language development, and skills
designed to help individual read and understand college course work better. (p.
98)
Non-traditional student. A non-traditional student is any student attending
classes who is 24 years of age or older (Horn & Carroll, 1996).
Placement. Placement is the process of assessing academic preparedness for
enrollment in appropriate coursework. Allen Community College uses the ACT, ASSET,
and COMPASS tests for placement as well as prerequisite completion and waiver (Allen
Community College, 2012).
17
Pre-Composition (COL011). Pre-Composition (COL011) is a remedial course
offered by Allen Community College that prepares students for English Composition I
(COL101). According to the Allen Community College 2012-2013 catalog,
Developmental Education-COL011 does not apply toward graduation
requirements. Pre-Composition is a preparatory course, emphasizing the writing
processes that will be utilized in COL101 English Composition I. The course will
progress from short pieces of writing to longer written essays emphasizing written
focus, organization, clarity, and usage of Standard Edited English. (p. 98)
Student success. Student success is defined as earning a grade of A, B, C, or P as
the final grade in a course. For purposes of this study, students earning a grade of D, F, I,
or W were considered unsuccessful.
Traditional Student. For the purpose of this study, a traditional student is one
who pursues a college education under the age of 24 (Horn & Carroll, 1996).
Overview of the Methodology
A quantitative, descriptive research design was used in this study. Purposive
sampling was utilized in this study. The subjects for the College Algebra (MAT105)
portion of the study were students who earned a grade in College Algebra (MAT105) for
the first time at Allen Community College from Spring 2003 through Summer 2013. The
subjects for the English Composition I (COL101) portion of the study were students who
earned a grade in English Composition I (COL101) for the first time at Allen Community
College from Spring 2003 through Summer 2013. Data was extracted from the Campus
Administrative Resource Solution (CARS) or Jenzabar. Multiple 2 tests of
independence were used to test the hypotheses for the study.

18
Organization of the Study
This research study is presented in five chapters. Chapter one consisted of the
introduction, problem statement, background and conceptual framework, significance,
purpose, delimitations, assumptions, research questions, definitions of terms, and an
overview of the methodology employed. Chapter two consists of an overview of
literature related to the topic, which includes information about community college
students, placement testing, placement tests, the impact of remediation, and the
completion agenda. Chapter three includes the research design, population and sample,
sampling procedures, instrumentation, data collection procedures, of the data analysis and
hypothesis testing, and limitations. Presented in Chapter four are a discussion the data
collected and the results of the statistical analysis. Chapter five includes the study
summary, findings related to the literature, implications for action, and the
recommendations for future research.

19
Chapter Two
Review of the Literature
It is important to understand the role of the community college and the nature of
the students who enroll at community colleges. This chapter first reviews literature
related to community college students and their level of preparedness. Also included is a
discussion of remedial education, its successes, and its failures. Second, the history of
placement testing and the accuracy of placement testing are reviewed. Third, information
is provided on different placement tests used by colleges and the ability of tests to predict
student success in other studies. Fourth, the impact of remediation on students is shared.
Finally, the completion agenda and its relationship to course placement are explored.
Community College Students
Thirteen million students attended community colleges in Fall 2009 (AACT,
2012). The community college is referred to as the open door in education (Cohen &
Brawer, 2008). "Accessibility for all students who desire an education is one of the basic
tenets upon which the community college was founded" (Dodson, 1987). Mickler and
Chapel (1989) ask if, "Students should be penalized for a lifetime because they did not
acquire basic skills" (p. 4). Students who enroll at the community college come from
different backgrounds. Community college students include advanced high school
students, traditional college students, and non-traditional students. "To suggest that the
unmotivated 16 year-old high schooler never becomes a motivated 25 year-old, who sees
the value of education, is sheer fallacy" (Mickler & Chapel, 1989, p. 3). These students
have goals that range from a credential to a certificate to a degree.

20
Community college students arrive with varying levels of preparation. "Many
students enter postsecondary education institutions lacking the reading, writing, or
mathematics skills necessary to perform college-level work" (Wirt et al., 2000, p. 50).
Students arriving at colleges with varying levels of preparation is not a new problem. In
1852, Henry Tappan complained about the level of preparation of students in his
inaugural address at the University of Michigan (Maxwell, 1979). In 1862, Iowa State
College created a remedial department to assist underprepared students (Maxwell, 1979).
At Harvard, remedial coursework began in 1874 to help students who could not meet
writing requirements. Maxwell (1979) shared that by 1907, 50% of the students at
Harvard, Yale, and Princeton failed to meet admission requirements.
Institutions offer remedial courses to help students attain college-level skills. In
1961, Shaw wrote, "Two-thirds of freshmen lacked the reading skills required for college
success" (p. 337). Maxwell (1979) indicated that 350 colleges in 1915 had college
preparation departments. According to Maxwell (1979), in the 1930s reading
remediation grew. Dodson (1987) stated, "Many colleges are now requiring students
who as a result of testing indicate a need for remediation, to take remedial work before
they are allowed to enter college-level courses" (p. 59). By 1995, almost all public 2-
year and 81% of public 4-year institutions offered remedial reading, writing, or
mathematics courses (Lewis & Farris, 1996).
Scholars and political leaders agree that student success is important. Some
believe high schools use lower standards and poorly prepare students. Clark (1960)
stated, "The disjuncture between ends and means, between the open door and standards,
dooms large numbers of students to failure" (p. 162). When many students fail at the

21
community college, scholars sometimes refer to the phenomena as a revolving door.
Richardson (1983) shared, "The open door of the community college too often becomes a
revolving door when students' needs are not met and program quality decreases" (p. 1).
Critics often look at cost and contend that districts use taxpayer dollars to educate
students in high schools. Therefore, community colleges should not use taxpayer dollars
to educate the same students again in remedial courses. Senator Richard Thompson said,
"Remedial programs at colleges should be eliminated because they are more expensive
than they would be at high schools" (as cited in Jaschik, 1985, p. 20). Representative Jim
Scherer, said, "We should be spending our time and money on educating those people
who have already demonstrated the ability to learn" (as cited in Jaschik, 1985, p. 20).
Scholars disagree on the topic of whether or not students needing remedial
coursework should attend college. Some scholars believe that students who need
remedial course work should not attend college (Harwood, 1997; Marcus, 2000;
Trombley, 1998). The reasons scholars hold this position vary. Some believe institutions
lowered curriculum standards to allow students who are underprepared to complete
college (Bennett, 1994; MacDonald, 1997, 1998, 1999; Traub, 1995). These scholars
believe colleges should not lower the standards. In their opinion, students who are not
capable of college-level work should not attend college.
Other scholars believe a variety of factors impact college readiness. Young
(2002) indicated that student demographics, required college preparatory courses taken in
high school, and the quality of the college preparatory courses impact student success in
college. Boggs and Shore (2004) also cited rigor of high school curriculum and student
demographics as key factors in student success in college coursework. Others argue

22
these scholars are incorrect in the belief that students can succeed with preparation.
According to the Attewell, Lavin, Domina, and Levey (2006), the National Educational
Longitudinal Study 1988 (NELS) data showed, "The impression that remedial
coursework is taken by students with poor high school preparation or weak academic
skills is inaccurate" (p. 914).
Many first-year students are unprepared for college-level math courses. In 1990,
Sworder found that 98% of first-year students at El Paso Community College were
unprepared for college-level math. Traditional students tend to possess a higher level of
preparation for college-level courses than are non-traditional students. According to
Woodham (1998), non-traditional students, who do not enter college immediately
following high school, need remediation more often than do traditional students. Among
the subjects students struggle to complete, math appears to be difficult for many. More
students require remediation in math than in other subjects (Parsad, Lewis, & Greene,
2003). The background a student brings to college influences his or her ability to
succeed. As reported by ACT (2010), the varying levels of required college preparatory
courses in high school, as well as the rigor and content of these courses impacted student
readiness for college-level coursework. Most first-time undergraduates need remedial
coursework. In 2011, 42% of first-time undergraduates in public two-year institutions
took at least one remedial course (U.S. Department of Education, 2011). According to
Attewell et al. (2006), the NELS data also showed that public colleges are not easier than
private sector colleges, but "have created higher hurdles than their private sector
equivalents" (p. 914).

23
Some believe community colleges should offer developmental courses rather than
universities. Lewis and Farris (1996) analyzed NCES data and found that twice as many
community colleges offer developmental courses. They also discovered that four-year
schools are sometimes discouraged from offering developmental courses. Lewis and
Farris (1996) stated, “About twice as many public 2-year as public 4-year institutions
were required to offer remedial courses, while more public 4-year than public 2-year
institutions were discouraged from offering remedial education or their remedial
offerings were restricted” (p. 29). Adelman (1996) shared, “Community colleges are
better suited than four-year colleges to address a combination of multiple developmental
needs” (p. A56). Ignash (1997) agreed and stated, “Community colleges have a greater
role in addressing existing needs for remediation” (p. 15). Others believe relegating
developmental education to the community college is detrimental. Roueche and Roueche
(1999) believe universities should include developmental learners, so they have a more
diverse population in attendance. Rouche and Rouche (1999) also contend that offering
developmental courses only at community colleges will create a stigma that only
underprepared students attend two-year colleges.
Degree completion is challenging for community college students. According to
Complete College America (2011), only 40% of students graduate with a one-year
certificate within two years, and 26.6% of students finish a two-year degree within four
years. According to Complete College America (2011), 50.1% of students seeking an
associate degree require remedial courses. Among all students in one-year certificate
programs, 22.6% graduate in 1.5 years while only 13.1% of those requiring remedial
work graduate. Among all students attempting a two-year associate degree in three years,

24
13.9% graduate, but only 9.5% of those who take required remedial courses graduate.
College leaders, legislators, and others would like to see more students successfully
complete their academic goals.
While some students meet the college readiness benchmark set by ACT, others do
not. According to ACT (2010), 66% of all high school graduates taking the ACT met the
College Readiness Benchmark in English, 52% in reading, and 43% in math. The
benchmark for English is 18. The benchmark for math is 22. The benchmark for reading
is 21. However, not all students take the ACT. Generally, students who take the ACT
are those who are considered college-bound. College-bound students may choose to
attend a university or a community college. Many students who later attend a community
college did not consider themselves college-bound when in high school.
Placement Testing
Although controversial, placement testing is widely used. According to Hughes
and Scott-Clayton (2011), “The purpose of assessment is to sort students into courses
whose content and instruction differ in their levels of difficulty” (p. 3). According to
Boylan (2002), best practices in developmental education include mandatory testing and
placement. Fulton (2012) stated, “The problems in developmental education can largely
be attributed to weak assessment and placement policies and practices that often result in
many students being placed in remedial instruction they don’t need” (p.1) Community
colleges struggle to balance the open door philosophy with the need to sort students so
they can be successful.
Historically, community colleges have seen periods where placement was
required and periods when it was optional. According to Rounds and Anderson (1985),
25
the 1970s were a time when the student was seen as having the right to choose to fail.
Placement tests were often not required. By the end of the 1970s, Rounds and Anderson
(1985) indicate that there was pressure to lower dropout rates, so placement testing
gained acceptance. Morante (1989) suggested letting students have the right to fail was
likely detrimental because too many factors affected student ability to succeed. Boylan
(2002) also argued for mandatory placement. Today, placement testing is required in
some states but not in others. According to Armstrong (2001), the state of California
began requiring colleges to use placement testing in the late 1980s. Fulton (2012)
indicated that 30 states use a common placement test. In 13 of these states, the state
chooses the instrument and in 17, the system chooses the instrument. In Kansas,
individual institutions can choose the instrument, but the Placement Assessment Policy
Committee at the Kansas Board of Regents made recommendations for a statewide
placement instrument in January 2016.
Some criticize placement testing policies in the states. The decision in California
to require placement testing resulted in a lawsuit. Due to the lawsuit, the legislature
enacted a law in 1986 that requires colleges to use more than one measure for placement
(Hughes & Scott-Clayton, 2011). Saxon and Morante (2014) stated, “Whether or not
these instruments predict how students will perform once they enter their prescribed
courses is a moot point” (p. 24). Saxon and Morante (2014) continued, “It should be
considered that placement tests are measures of achievement rather than aptitude” (p. 26).
Gordon stated, “While we should be able to predict a failing grade from assessment, we
cannot and we should not attempt to, predict a passing grade” (as cited in Saxon &
Morante, 2014, p. 4).

26
Some opponents of placement testing argue that it is inaccurate due to the
processes used rather than the instruments used (Hodara, Jaggars, & Karp, 2012). In
interviews conducted with staff at 38 colleges in seven states, Hodara et al. (2012)
gathered information on placement processes from 183 respondents. Critics of the
placement process used by institutions often focus on student preparation and awareness.
According to Venezia, Bracco, and Nodine (2010), students are often unaware of
the purpose of the tests and the consequences of the tests. Venezia et al. (2010)
conducted a study that explored student perspectives and experiences regarding
placement testing. The study used data from focus groups at five community colleges in
California. The researchers also interviewed counselors at 73 colleges. According to
Venezia et al. (2010), "With so much riding on assessment and placement, it is important
that students know the requirements early in their high school years so they can master
the needed knowledge, skills, and cognitive strategies" (p. 2). Unfortunately, the results
of the study indicated many students were ill-prepared for college. A student in the
Venezia et al. (2010) study said, "[My college counselor] told me to just take easy
classes" (p. 7). Additionally, Venezia et al. (2010) shared, "Since students knew they
could attend a community college even without a high school diploma, many didn't think
they needed to prepare much beyond passing high school courses" (p. 7). The results of
the study indicated, "Fewer than half (44 percent) of the colleges that responded to the
survey indicated that they provide practice placement tests to their students" (p. 9).
Venezia et al. (2010) also determined that most students did not know the consequences
of placement testing. One student said, "I thought it was one of those tests you take just
to see what kind of field they were going to recommend" (p. 10).

27
Schools may be reluctant to share the high-stakes nature of the test with students
due to a fear that it will make students more anxious or result in the student enrolling at
an institution with lower standards for placement. Based on the results of a survey
administered by a committee convened by the Kansas Board of Regents regarding
placement testing, the cut-scores used in Kansas vary dramatically. For example, based
on a survey administered by the KBOR Placement and Assessment Policy Committee,
students with an ACT writing score of 16 or above take English Composition I (COL101)
at Allen Community College but at Fort Scott Community College, which is within
driving distance of Allen Community College, students must have an ACT writing score
of 21 to take college-level English.
According to Hodara et al. (2012), students may or may not be aware of study
materials provided on college websites. Use of study materials might increase the
likelihood of students scoring high enough to undertake college-level coursework.
Hodara et al. (2012) said, “Overall, implementing placement test review seems to
improve placement accuracy, in that it increases student access to college-level
coursework without harming their academic success” (p. 7). The results of the same
study indicated that students who completed a review course before retesting improved
their test results. About 50% of the students who completed a review course gained one
level in developmental reading and English.
Some opponents argue that placement tests fail to consider non-cognitive factors
that impact student success. According to Hodara et al. (2012), one school leader in
Wisconsin stated,

28
We found common measures, like COMPASS, did not tell us who would succeed
in programs and who would succeed in the courses. The biggest reason students
were failing was because of non-cognitive factors: weaknesses in degree choice,
a lack of social support, financial concerns, and self-efficacy. (p. 12)
Using a locally developed tool based on the Learning and Study Strategies Inventory, the
college in Wisconsin added the non-cognitive test to the cognitive results for better
placement decisions. Karp and Bork (2012) agree that both academic and non-academic
factors influence success. Karp and Bork (2012) conducted a study using qualitative data
from interviews with 96 community college students and 72 community college staff
members at three colleges in Virginia. The researchers coded their interviews so they
could analyze them for key terms. Karp and Bork (2012) determined, “Community
college success is not only about academic preparation, but it is also dependent upon a
host of equally important skills, attitudes, habits, and behaviors” (p. 1).
While some states have set cut-scores and attempted to adopt more accurate
placement tests, others defend current placement policies and see other reasons for
student failure in college-level coursework or see no better solution. According to
Hodara et al. (2012), one administrator in Oregon said, “It’s not clear what the problem
is—the students, the test, the curriculum. It might be all. But a lot of the change really
needs to come from K-12” (p. 23). An administrator from Texas blamed developmental
education for student failures in college-level work stating, “Overall, I think our system
of assessment and placement is working. I don’t think that’s the part of the
developmental education that’s giving us difficulty” (Hodara et al., 2012, p. 23). An
administrator from Georgia said, “Bigger than the COMPASS is [developmental]
29
instruction delivery. That is the real challenge” (Hodara et al., 2012, p. 24). A faculty
member from Oregon said, “Overall the perception is that placement testing is working
pretty well. Upper level management are pretty okay with it” (Hodara et al., 2012, p. 23).
Others see there may be a problem but are not ready to tackle the problem.
Another respondent said, “[Multiple measures] sounds wonderful, but I cannot think
about what measures could be implemented that would be practical, that you would have
the personnel to implement” (Hodara et al., 2012, p. 23). A third respondent stated, “We
know we need to do something different . . . There are some groups in the state that are
getting together and working on it, but I doubt that we are going to be able to come up
with a sound practice” (Hodara et al., 2012, p. 23). The difficulty of the problem leads to
a reliance on placement testing for many students.
College-bound high school students often complete the ACT before they apply to
colleges. Students can use a variety of support materials to prepare for this timed exam.
Unlike the ACT, ASSET and COMPASS testing commonly occurs after the college
admits a student and before a student enrolls. While ASSET is a series of timed tests,
COMPASS testing is untimed. Colleges sometimes provide study materials for
COMPASS and ASSET. According to Venezia et al. (2010), students often do not
prepare for placement tests. Placement testing becomes high stakes when future
enrollment is based on the scores earned on a single test.
College staff can use exams to determine student mastery of content or outcomes.
Community college students who do not show mastery take remedial courses. Placement
testing has existed since the early 1800s (Wechsler, 1977). Michael and Shaffer (1978)
and Fowler and Ross (1982) determined that achievement tests could be used effectively

30
to place students in college courses. Michael and Shaffer (1978) conducted a study using
data from the Northridge campus of a California State Universities and Colleges. The
purpose of the study was to determine whether there were relationships among placement
methods and course grades. Methods of placement compared in the study included an
English placement test and high school grade point average. Michael and Shaffer
discovered correlations between test scores and course grades. They also found
correlations between high school grade point average and course grades.
Fowler and Ross (1982) examined 34 tests to determine which test served as a
better predictor of student success in English Composition courses. They used Pearson
product moment correlations and stepwise regression analysis to analyze their data. The
sample for the study included 140 students enrolled in a composition course. Fowler and
Ross found that the English subtest of the ACT had the highest correlation with course
grades.
Cox (1985) found, "Appropriate placement has been shown to significantly
increase the student's retention rate, skill growth, and GPA" (p. 19). Most colleges use
placement tests to determine student course sequences. Ledermen, Ribaudo, and
Ryzewic (1985) found that 15% of colleges used other measures for placement instead of
tests and 98% thought testing was necessary. Rounds and Anderson (1985) stated, "Life-
changing decisions should not be made on the basis of a single test score" (p. 25). The
results of Weber's (1986) study determined,
Content-specific placement tests in combination with other student data will yield
effective assessment forming a basis for placement decisions. Performance on

31
general achievement tests (ACT or SAT) or a subsection of one achievement test
should not determine basic skills course placement. (p. 28)
Morante (1989) agreed and stated, "Never use one score on one test as the sole factor in
making placement decisions" (p. 3). Morante alluded to the fact that institutions should
use multiple measures in placement decisions. According to Lagunoff, Michaels, Morris,
and Yeagley (2012), multiple measures are a more accurate predictor of success than a
single measure in the California Community College system. The results of studies
indicate placement tests are often inaccurate in predicting course grades. According to
Linn (1990), these tests predicted only 10-30% of the variances in first-year college grade
point average. Regardless of the intricacies and difficulties of accurate placement,
advocates strongly believe in the importance of mandatory placement. Akst and Hirsch
(1991) stated, "Placement is one of the pillars on which a developmental program rests"
(p. 3).
In a study conducted by Sawyer (1996), the accuracy of placement testing was
investigated to determine whether it was dependent on how a college defines success.
Using data from a large public college in the Midwest, Sawyer compared the accuracy of
a locally developed exam and the ACT in math placement. Sawyer found ACT provided
more accurate placement when success was defined as earning a B or higher. However,
the locally developed test proved more accurate when success was defined as earning a C
or higher. Sawyer (1996) determined that the accuracy of placement testing depended on
how the college defined success.
Armstrong (2001) conducted a study in California using 3,925 students enrolled
in English and 3,719 enrolled in math during Fall 1995 at three community colleges.

32
Armstrong used predictive validity coefficients and Pearson product-moment correlations
to analyze the data to determine if placement tests predicted course grades. He also
considered student characteristics and faculty characteristics. Armstrong (2001)
determined a significant relationship existed between course grades in both math and
English and placement test scores. However, other factors such as instructor employment
status were also important to consider.
A team of researchers analyzed placement in the community college system in
Virginia. Jenkins, Jaggars, and Roksa (2009) conducted a study that analyzed placement
test scores and grades in college-level math and English courses for over 24,000 students
who enrolled in Summer or Fall 2004. Jenkins et al. (2009) determined a weak
correlation existed between placement scores and success in college-level courses.
Jenkins et al. (2009) stated, “Placement test scores in reading and writing did not predict
whether students passed gatekeeper English. Math test scores had a stronger association
with passing gatekeeper math” (p. 7).
Scott-Clayton, Crosta, & Belfield (2012), studied severe error rate (SER) in
placement and stated,
The SER combines the proportion of students predicted to earn a B or better in
college-level but instead placed into remediation (the severe under-placement
rate) with the proportion of students placed into college-level but predicted to fail
there (the severe over-placement rate). (p. 13)
Scott-Clayton et al. (2012) conducted their research using data from a large, urban
community college system and one statewide community college system. The results of
their study indicated, “Roughly one in four test-takers in math and one in three test-takers

33
in English are severely mis-assigned, with severe underplacements in remediation much
more common than severe over-placements in college-level coursework” (p. 4). The
results of the study indicated that an analysis of high school transcript information would
reduce the number of students placed inaccurately.
Community colleges attract students with varying levels of preparation and must
develop methods of determining student readiness for college coursework. Monroe
(1972) discussed the open door policy of community colleges and the use of placement
tests to help students take classes in which they have the greatest likelihood to succeed.
Cox (1985) stated, "Self-placement of students into classes is not a sound policy" (p. 4).
Monroe noted that it was problematic that few companies created placement tests
specifically for community college students. Abraham (1991) stated, "An institution that
has identified a student as academically deficient and enrolled the student has an ethical
responsibility to help the student overcome his deficiencies" (p. 28). The ACT, ASSET,
and COMPASS are tests commonly used for placement. However, ACT does not
advocate the use of test scores alone for placement (ACT, 2014).
A crucial aspect of placement testing is setting cut scores. Cut scores are often
determined in one of two ways. The first method is for an institution to set cut-scores for
its chosen placement instruments. The second method is for a state or community college
system to set cut scores for all colleges within the state or system. According to
Bettinger and Long (2009), there is little consistency in cut scores. Based on the
information provided by Fulton (2012), 28 states have common cut scores by either state
or system. Three states mandate that colleges review their cut scores periodically.
Kansas recently adopted a statewide placement instrument and statewide cut-scores.

34
ACT recommends cut scores for the ACT, ASSET, and COMPASS. ACT will also help
institutions conduct studies to review their cut-scores (ACT, 2009).
Placement Tests
Many options exist for placement testing. Some institutions use locally developed
assessments, and others purchase assessment tests from vendors. Placement testing is
popular because it is efficient and inexpensive. Hodara et al. (2012) stated, “Almost all
institutions in our sample used standardized tests as the primary measure of placement.
This process is highly efficient. Exams can be administered quickly, scored by computer,
and almost instantaneously applied to determine the placement for each student” (p. 28).
According to researchers (Grable, 1988; Lederman, Ribaudo, & Ryzewic, 1985;
Morante, 1989; Roueche, Baker, & Roueche, 1987), about half of community colleges
use locally developed measures. According to Fields and Parsad (2012), 100% of the
two-year colleges and 85% of four-year colleges reported using a test for math
placement. Based on their research, 22% of the colleges used a test other than a
standardized test for math placement. For reading placement, 53% of colleges used a test
for reading placement. Only 10% used something other than a standardized test. Only
13% of institutions use an alternative method for placement in remedial English.
Alternative placement methods include the use of other cognitive and non-
cognitive factors. Factors colleges sometimes consider include scores on other exams,
achievements, high school curriculum, faculty recommendations, and high school grade
point average. According to Fain (2012), "Adding more layers to the placement process
can be labor intensive and expensive." Also, "High school grades aren't the best measure
35
for all students, particularly the many adults who attend community colleges and have
been out of high school for years" (Fain, 2012).
The ACT is a standardized test used to determine college readiness. It is also
used for placement. ACT collects data from test scores and college grades in first-year
courses. Using this data, ACT can show that students who score at or above certain
levels have a higher likelihood of earning a B or C in college-level math and English
courses. According to ACT (2012), students who meet college readiness benchmarks
have a 75% chance of earning a grade of C or higher in college-level courses.
While ACT defends the use of its tests, researchers have also shown the ACT is
not an accurate predictor for placement in courses. Their study used data from first-time
students who graduated from high school the previous year. The study was conducted in
Florida and included 605 students. Wattenbarger and McLeod (1989) found a low
correlation between ACT scores and grades in math courses. Naumann, Bandalos, and
Gutkin (2003) conducted a study that investigated the predictive validity of self-regulated
learning variables compared to the ACT for first and second-generation students at a
large mid-Western university. The sample for this study was students in a foundations
class. Students allowed researchers to review their ACT scores, enrollment information,
and grade point averages. Students also completed a questionnaire that assessed
motivation, goals, and other factors. Naumann et al. (2003) used an independent samples
t test to compare the information for both first and second-generation students. Naumann
et al. (2003) stated, "The ACT appears to be a valid predictor of GPA for first-generation
students and should be used as an index in the college admission process" (p. 9).

36
Naumann et al. (2003) continued, "For the second-generation students, ACT was the
most significant predictor" (p. 7).
ACT (2010) set college readiness benchmarks for students using information from
98 schools and 90,000 students. According to ACT's Condition of College and Career
Readiness (2010), 40% of all high school graduates took the ACT in 2006. By 2010,
47% of graduating high school students took the ACT. In some states, the number of
students taking the ACT is between 60% and 80%.
The ASSET is a standardized test used to determine placement in many colleges.
Grable (1988) and Abraham (1991) reported community colleges frequently used the
ASSET for placement in community colleges. ASSET is popular in situations where a
paper and pencil test is necessary. According to ACT (2015), over 400 colleges use the
ASSET to assess student skills.
In a study conducted at Broward Community College in 1989, Gabe reviewed
placement test scores and grades of first-time college students entering in Fall 1986 or
1987 who took college-level courses and scored a little above the cut score or a little
below the cut score. He examined math and writing scores. Gabe (1989) found writing
students who scored just above a cut score withdrew more often those who scored below
the cut score. He also determined that many students who failed to enroll in required
remedial courses passed college-level courses at a higher rate than those who completed
the required remedial courses. Gabe (1989) determined ASSET was not a predictor of
success in college courses.
The results of research conducted by Hughes and Nelson (1991) found a low
correlation between the ASSET test and English course success. Hughes and Nelson

37
used data from Riverside Community College for their study. All new students at
Riverside Community College were required to take the ASSET as a placement test.
Using discriminant analysis for 578 instances, Hughes and Nelson looked at the
relationship between test scores and student success. Success was defined as earning a
grade of "C" or above. The results of the analysis showed that the ASSET was a weak
predictor of student success in English composition at Riverside Community College.
In the early 1990s, Krol (1993) conducted a study at Henry Ford Community
College, which is located in southeastern Michigan and used the ASSET for placement.
Krol wanted to investigate how ASSET scores, high school GPA, and academic success
were related. The researcher examined the records of 650 students enrolled in Fall 1992
in Biology, English, and Political Science. Krol used ANOVAs and Pearson correlations
to test the hypotheses. Krol found students who earned higher scores on the ASSET
earned higher grades in all three courses. The results of research conducted by Krol
(1993) determined that ASSET was a useful predictor of success for community college
students.
Shaw (1997) completed a study using data from Paradise Valley Community
College in Phoenix, Arizona. Shaw's study considered the method of placement as well
as the relationship between each method and gender. She conducted an ex post facto
study of College Algebra classes from Fall 1990 through Spring 1995. This study
included 1,529 students. Shaw used a Pearson chi-square and likelihood ratio test to
evaluate the differences in student success and placement method. Shaw found that
ASSET placement had significantly higher levels of success than self-placement. Shaw
found no difference in the success of students related to gender and placement method.
38
In a study conducted by Hartl (1997), the success of students in mathematics
courses related to ASSET scores was investigated. The sample for this study included
3,508 students who enrolled in math courses between Fall 1992 and Summer 1996 at
Northeast Iowa Community College. ASSET scores were available for 1,557 students.
Hartl used multiple regression analysis and determined that the ASSET numerical skills
score provided helpful information for placement and students who followed placement
recommendations had higher mean grades.
Hutson (1999) conducted a study at a rural, two-year college in southern
Arkansas. Hutson used multiple regression analysis to determine the relationship
between course grades and ASSET, SAT, and ACT scores for 594 students. The study
used data from Fall 1993 to Spring 1996. Hutson also analyzed if there was a difference
in students who completed a prerequisite course or placed directly into College Algebra
and found no significant difference. Hutson found a weak correlation between ACT
scores and final grade. The results of the study indicated ASSET and SAT were not
predictors of student success.
In several studies, ACT (2009) compared grades in courses to ASSET test scores.
ACT obtained data from 23 institutions chosen to be representative of those using
ASSET in the United States. Students per institution were between 30 and 382. The
success rate of students in Freshman English was .80 meaning that 80% of the students
earned a C or higher in the course. Similarly, students who scored appropriately on the
ASSET Reading Skills test had an 80% success rate in Freshman English.
COMPASS is a computerized adaptive test. Computerized adaptive tests use item
response theory (IRT). On an assessment that uses IRT, mathematical models analyze

39
responses and determine a path of questions a person answers from a pool. The number
of questions varies based on the responses. When a person misses too many questions,
he or she receives easier questions. When a person answers several questions correctly,
he or she receives harder questions. The test will move within a domain or between
domains as it determines the knowledge of the test taker. Using IRT, the test can
determine the proper course placement for a student. According to Primary Research
Group (2008), 46% of community colleges use the COMPASS test for placement.
In a study conducted by Day (1997), the predictive validity of the COMPASS
using data from the Roane County and Oak Ridge campuses of Roane State Community
College in Tennessee was examined. Day used the Pearson product-moment correlation
coefficient and independent chi-square tests to determine the relationship between course
grades and COMPASS. The sample for this study was first-time freshmen who tested in
Summer 1995. Roane State enrolls about 3,600 students and 317 volunteered for this
study. Of the 317 student volunteers, 295 took the math placement test and 281 scored
into developmental courses included in the study. Day found a significant relationship
between final course grades and COMPASS scores for Elementary Algebra. Conversely,
Day found no significant relationship between COMPASS scores and course grades in
Intermediate Algebra.
At American River College, Barr, Rasor, and Grill (2002) investigated the
relationship between COMPASS scores and course grades in English and math. The
researchers had between 50 and 723 student records in their math analysis, between 72
and 461 with reading test scores, and 419 and 1,175 with writing test scores. Using this
data, the researchers completed 27 Pearson correlations. Barr et al. (2002) reported,
40
"Students taking the COMPASS test produce scores that have little or no relationship to
final grades in these English writing, reading, mathematics and ESL courses" (p. 43).
In a study conducted at a Midwestern community college, Long (2003)
investigated the relationship between methods of placement and course grade. The study
included 2,913 first-time students and their math placement scores between Fall 2000 and
Spring 2002. Logistic regression was used to find what method of placement from
COMPASS, high school GPA, ACT, age, and gender has the strongest relationship with
course grades. Long found no relationship between mathematics placement and
successful course completion.
Waycaster (2004) conducted a study to compare the success of students placed in
developmental courses using COMPASS, ASSET, and a locally created test. Students
enrolled in developmental math at Southwest Virginia Community College between Fall
2001 and Summer 2002 were the subjects of the study. The study included 364 students;
success was based on final exam scores. Waycaster performed multiple regression to
determine how well the placement exams placed students into math courses. He found
the ASSET was the only significant predictor of student success for the final exam.
In a study conducted at an Iowa Community College, Owens (2005) compared
self-directed placement, a writing sample placement, and COMPASS placement. The
study was conducted using data from April through December 2004. Owens began her
study with 201 students, but only 117 remained for the entire study. A Pearson
correlation was used to analyze the data. While no single placement method was
accurate for all students in the study, both COMPASS and a written essay proved reliable
as single assessments.

41
Donovan and Wheland (2008) conducted a study to investigate the relationship
between ACT math scores, COMPASS scores, and success in Intermediate Algebra.
They conducted their study at a metropolitan university in Ohio. This public institution
enrolled 23,000 students. The data they analyzed was from Fall 2004 and Spring 2007.
There were 1,694 students in the sample. The researchers used an ANOVA and Tukey
HSD tests. A strong relationship between COMPASS scores and student success in
Intermediate Algebra emerged. A strong relationship between ACT math scores and
student success in Intermediate Algebra occurred.
Self (2010) completed a study of 565 freshmen taking College Algebra at a
community college in southeastern Louisiana. He looked at placement and success as
well as the difference between a three-hour course and a five-hour course. Self used first-
time students enrolling in and completing College Algebra in Fall 2006, 2007, and 2008.
Additionally, he studied the effect of demographics including age, gender, and ethnicity.
Self used a point biserial correlation matrix to find relationships between COMPASS
scores and success in College Algebra. He used discriminant analysis to analyze the
multivariate relationships. Finally, he used partial least squares to analyze how the
variables affected each other. Through correlation analysis, the results of the study
indicated a relationship between COMPASS Algebra scores and success in College
Algebra.
In a study conducted in a statewide community college system, Belfield and
Crosta (2012) analyzed tests and course grades. The sample for the study was students
who took a placement test and enrolled between Fall 2008 and Summer 2010. The
community college system studied used over 40 different placement tests including

42
ASSET and COMPASS. Belfield and Crosta (2012) narrowed the tests studied to two
including COMPASS. Replicating the study conducted by Scott-Clayton (2012), Belfield
and Crosta (2012) determined, “Placement test scores are not especially good predictors
of course grades in developmental education classes” (p. 39). The results of the study
indicated high error rates in placement. Belfield and Crosta (2012) share, “Three out of
every ten test takers is either assigned to developmental education, despite being
predicted to get at least a B in college-level English, or assigned to college-level English,
despite being predicted to fail the course” (p. 39). According to Belfield and Crosta
(2012), the COMPASS is not a strong predictor of student success in college.
Colvin (2014) analyzed whether ACT, COMPASS, or prerequisite courses were
more likely to lead to student success in math. The study was conducted at Snead State
Community College, a public, two-year institution located in Alabama. Quantitative
methodology and logistic regression were used to determine the influence of age, gender,
and ethnicity on success. Data were collected from Fall 2008 through Spring 2013 for
1,521 students enrolled in MTH100 and 682 enrolled in MTH112, but summer terms
were excluded from the study. Colvin found that students who completed a prerequisite
course were less likely to be successful in math than those placed using an ACT or
COMPASS score. Additionally, COMPASS was more accurate in predicting success
than the ACT but both were good indicators.
The Impact of Remediation
The impact of remediation is seen in both the cost and the effect it has on
students. The cost of remediation is high. Traub (2008) determined the annual cost of
43
remediation is $1.9 to $2.3 billion at community colleges and another $500 million at
four-year colleges. According to Scott-Clayton et al. (2012),
Half of all undergraduates will take one or more remedial courses while enrolled;
among those who take any the average is 2.6 remedial courses. With over three
million new students entering college each year, this implies a national cost of
nearly $7 billion dollars annually. (p. 1)
The Office of Program Policy Analysis and Government Accountability in Florida
(2006), the Arkansas Department of Higher Education (n.d.), and Ohio Board of Regents
(2006) reports estimate the cost of developmental education to be tens or hundreds of
millions of dollars annually.
Students who enroll in remedial coursework often fail to persist in college. Losak
(1982) conducted a study in which retention, graduation, and academic progress were
analyzed. The research also analyzed the results of different ethnic groups. Data were
drawn from Fall 1980 through Winter 1982 and generated 4,318 students who were full-
time, first-time college students. In this study at Miami-Dade Community College,
Losak (1982) found that less than 50% of the students who needed remediation returned.
The North Orange County Community College District was experiencing high
withdrawal rates, so a Skills Prerequisite System was created to assess student abilities
and place students. Fullerton College is located in the North Orange County Community
College District. The goal was to reduce drop rates by 5%-10%. After two years, a study
was conducted to analyze data from 1982 and determine if the system affected the drop
rate. Borst (1984) showed that at Fullerton College, mandatory placement led to a drop
rate decrease from 38% to 21%.

44
Haase and Caffrey (1984) investigated the assessment/advisement/placement
process at Sacramento City College in Fall 1983. The study involved 506 students and
followed a quantitative approach. The researchers analyzed the method of placement and
student success. Methods of placement included prerequisites courses, ACT scores, SAT
scores, TOEFL scores, and a college degree. Haase and Caffrey (1984) determined
students who followed assessment, advising, and placement guidelines were retained at a
higher level.
Oromaner (1985) discovered similar results in a study conducted at Hudson
Community College in New Jersey. His study compared information regarding full-time
students required to take remedial courses and those not required to take remedial
courses. There were 413 students in this study of which 291 need remedial courses and
122 who did not. The study followed the students between Fall 1981 and Fall 1983.
Oromaner found that students who needed no remedial courses were more likely to
persist in college.
In 1985, the National Center for Educational Statistics (NCES) reported that
students also avoid developmental coursework. Additionally, NCES reported that
personnel and enrollment systems do not always enforce mandatory placement. Plisko
and Stern (1985) reported that only 32% of students who were advised to take a remedial
math course actually enrolled in the course.
Roueche and Baker (1987), Grable (1988), and Morante (1989) recommend
schools establish mandatory placement policies. Morante (1989) stated, "Placement must
be mandatory since it borders on the unethical to know that a student lacks basic skills
but is still allowed to enroll in college courses requiring that skill" (p. 2). At Broward

45
Community College, Gabe (1989) discovered that 46% of those who took remedial
courses passed college algebra while only 25% of students who avoided remedial courses
passed college algebra. Conlin (1989) showed that 70% of the students who skipped
remedial coursework failed their college-level math course. Akst and Hirsch (1991)
noted, "The consequences of misplacement can be devastating for the student" (p. 3).
In a study conducted at Southwestern Community College, Conlin (1989)
analyzed the persistence of students enrolling in basic grammar and math. Conlin used a
random sample of 180 students for the study. These students had failed all or part of their
placement test in 1988 or 1989. Many students simply did not register for courses. For
the students who skipped a remedial math course, 90% failed or withdrew from the math
course they attempted. Conlin (1989) found that 85% of the students required to enroll in
basic grammar and 74% of the students required to enroll in basic math failed to persist in
college.
Barr and Parker (1989) conducted a study in California at 23 community colleges.
The study was conducted between Fall 1988 and 1989. The purpose of the study was to
determine student goal satisfaction, retention, and skills acquisition at the colleges. Data
were collected from pretests and posttests, surveys, and college records. Ten thousand
students were included in the study. The researchers found that student confidence in
mathematical ability increased 13% after remediation. Barr and Parker also found that
test scores increased between 27% and 98% after remediation.
A similar result was determined by Einspruch and Downing (1990). These
researchers conducted a study at Miami-Dade Community College in Fall 1989. These
researchers compared demographic information and scores on the ACT, SAT, and

46
Florida placement tests. Einspruch and Downing (1990) determined that just more than
half the students who took remedial math courses completed the courses successfully.
Sworder conducted a study in 1989 at Saddleback College. The study included
1,027 students who took a math placement test between July and August 1988 and who
took a math class between Fall 1988 and Fall 1989. Sworder (1990) discovered that 36%
of students advised to take a remedial math course enrolled in a higher-level course.
Between 36% and 44% of the students successfully completed the course in which they
enrolled regardless of the level. Sworder did not analyze the success of students who
took a course at a higher level than placement scores indicated.
Adelman (1996) stated, "The extent of a student's need for remediation is
inversely related to his or her eventual completion of a degree" (p. A56). Ignash (1997)
presented results from the High School and Beyond Study that showed students who take
more than one remedial course are less likely to succeed than those who take one
remedial course. Of the students taking no remedial courses, 43.5% earned a degree by
the age of thirty. Ignash (1997) stated, "Only 8% who took more than four remedial
courses and 13% who took three or four remedial courses" earned a degree by 1993 (p.
12).
Critics contend that students become demotivated by remedial coursework and
fail to complete their academic goals (Deil-Amen & Rosenbaum, 2002; Rosenbaum,
2011). Deil-Amen and Rosenbaum (2002) conducted a study using data from two
Midwestern community colleges. Both colleges were located in large urban areas in
Illinois. The researchers conducted interviews with students, faculty, and administrators.
The researchers observed daily life at the colleges, reviewed college catalogs, and

47
administered a student survey. One author interviewed more than 130 students and 54
staff. Together, the researchers surveyed 804 students at the two colleges regarding
goals, attitudes, experiences, and perceptions. The researchers stated, "Our study
highlighted the possibility that the stigma free approach may represent a more subtle
form of blocked opportunity" (p. 16). Deil-Amen and Rosenbaum (2002) found, "A
stigma-free approach may be contributing to students dropping out of college altogether
and hence accumulating no credentials rather than a lesser degree" (p. 16).
Bettinger and Long (2005) examined 13 years of longitudinal data collected by
the Ohio Board of Regents beginning in 1998. The researchers used regression analysis
to compare students of similar backgrounds and levels of preparation rather than all
students. Bettinger and Long (2005) found,
Students who were placed in math remediation were found to be 15% more likely
to transfer to a four-year college than students with similar test scores and high
school preparation who attended colleges with policies that did not require
placement in remedial courses (p. 24).
Students who took remedial math classes dropped out or graduated at the same rate as
those who were prepared for college-level work. The differences for students in remedial
English were not significant. Bettinger and Long (2005) showed that remediation has a
positive impact on student retention rates.
According to Attewell et al. (2006), 68% of students pass all of the developmental
writing courses in which they enroll. Similarly, 71% pass all of the developmental
reading courses. Unfortunately, only 30% pass all of the developmental math courses.
Less than 25% of community college students required to enroll in developmental classes
48
completes a degree or certificate within eight years (Attewell et al., 2006). Duranczyk
and Higbee (2006) shared, "The majority of [students] who start out at a two-year
institution never receive a baccalaureate degree" (p. 1). Attewell et al. (2006) conducted
a study of NELS data and showed that taking some remedial or developmental
coursework did not result in lower chances of earning a two-year degree. Furthermore,
the results of the study showed that students who take remedial courses in three areas are
also just as likely to graduate with a two-year degree. Attewell et al. (2006) also
determined that students who completed remedial reading courses were 11% more likely
to earn a degree. For students who take two or more remedial math courses, the chance
of completing a degree is 3% lower. For students taking remedial courses in writing,
they are more likely to graduate with a degree. Students who complete remedial
coursework are more likely to complete gateway courses successfully.
Calcagno and Long (2008) conducted a study that analyzed student age and
remediation. Using the records of 100,000 college students in Florida, Calcagno and
Long implemented a regression discontinuity design to look at the effect of remedial
coursework on success in college-level work, credit accumulation, and degree or
certificate completion. Calcagno and Long found that remedial coursework in math
slightly increased persistence to the second year of college but not persistence to
graduation.
Donovan and Wheland (2008) analyzed the records of 1,694 students who
completed Intermediate Algebra between Fall 2004 and Spring 2007 at a public,
metropolitan, open-enrollment university in Ohio. Donovan and Wheland determined
that women succeeded more often than men did in completing a developmental math

49
course. The results of their study indicated that for Intermediate Algebra, the ACT and
COMPASS are more likely to predict success for a male student than for a female
student. Donovan and Wheland (2008) determined that students who completed a
developmental math course succeed at a 50% higher rate than those who placed directly
into the course.
Rosenbaum (2011) used data from the High School and Beyond (1992) survey
and the National Education Longitudinal Studies (2000) to show, "That 80% of low-
achieving seniors with college plans will fail to get any degree in the next 8 to 10 years"
(p. 2). Rosenbaum theorized that schools failed to prepare students for the reality of
college. For example, students are not aware of the need for and importance of
placement testing. Students have inflated expectations due to a lack of information and
understanding. As a result, many do not complete a credential, degree, or even college-
level courses.
Jenkins et al., (2009) conducted a study in the Virginia Community College
system. Jenkins et al. (2009) determined that “Over one-third of those recommended to
developmental education in a given subject did not take any developmental courses in
that subject” (p. 2). Jenkins et al. (2009) also discovered, “Among those who did enroll
in gatekeeper courses, pass rates were fairly high” (p. 8) and “Gatekeeper course pass
rates also did not vary strongly by whether or not students complied with their
developmental course recommendation” (p. 9).
Among the reasons students fail to enroll in remedial courses, one finds both
student and faculty attitudes about developmental coursework. Perin (2006) conducted a
qualitative case study with students, faculty, advisors, and administrators from 15

50
community colleges in six states. Researchers visited each college and interviewed
students, faculty, advisors, and administrators. The researcher interviewed 630 people
for one hour each. The project resulted in 458 interview transcripts. Of these, 290
transcripts were selected for the study. Key terms were coded from the interviews.
Through the analysis of interview transcripts, Perin showed that faculty and advisors
worked together to help students avoid developmental courses.
The Completion Agenda
Community college students often struggle to complete their programs. Only
27.5% of the first-time, full-time degree or certificate-seeking students at community
colleges completed their program within 150% of the time required in 2005 (Snyder &
Dillow, 2012). For comparison, 58.8% of first-time, full-time degree-seeking students at
universities completed their program within 150% of the time required in 2005 (Snyder
& Dillow, 2012).
Progressively, governments and non-profit organizations have made increasing
college success part of their agendas. President Obama brought the issue of completion
to the forefront in 2009 during an address to Congress (The White House, 2009) when he
set a goal of degree completion as a national priority and said, “By 2020, America will
once again have the highest proportion of college graduates in the world.” According to
a state-level official in North Carolina quoted in Hodara et al. (2012),
The registration agenda has given way to the completion agenda and success
agenda, and so that means we have a little room to change that foolish policy of
having students do everything all in one stroke. We put some money into the
advisement of students and assessment of students, investing on the front end so
51
that students can be properly placed, saving money for colleges and students later.
(p. 27)
The president is not alone in focusing on completion.
In its Strategic Plan, the Lumina Foundation for Education (2009) made degree
completion its big goal. The Lumina Foundation for Education (2009) stated the
foundation’s goal as, “To increase the percentage of Americans with high-quality degrees
and credentials from the longstanding rate of 39 percent to 60 percent by the year 2025”
(p. 1). Other philanthropic organizations such as the Gates Foundation also contribute to
innovative programs that lead to student success.
The state of Kansas is also focusing on degree and credential completion. In
September 2010, the Kansas Board of Regents (KBOR) released its strategic plan for the
next ten years (Kansas Board of Regents, 2015). KBOR named its plan Foresight 2020.
Originally, Foresight 2020 had six goals, but the number of goals was reduced in 2012.
According to the KBOR website, the first of the three goals is to, “Increase Higher
Education Attainment among Kansans” (KBOR, 2015). KBOR (2015) wants to,
“Increase to 60 percent the number of Kansas adults who have earned a certificate,
associate or bachelor’s degree by 2020” (p. 1). Each year, KBOR provides a Foresight
2020 progress report. Each college and university that is coordinated by or reports to
KBOR have increasing degree and credential completion as a goal in its performance
agreement. Each year, KBOR considers new funding for the colleges and universities
based on the completion of performance agreement goals. Colleges that fail to meet their
goals may receive lower funding.

52
Summary
This chapter related the role of the community college and information about
students who attend community colleges. Literature related to community college
students and their level of preparation was shared. The successes and failures of remedial
education, the history of placement testing, and studies related to the accuracy of
placement testing and placement policies were reviewed. Information about placement
tests used by colleges and the predictive validity of placement tests were included. The
impact of remediation on students was discussed. Finally, the completion agenda was
described. The methodology used in this study is addressed in chapter three.
53
Chapter Three
Methods
The purpose of this study was to determine if there was a relationship between
method of placement and student success in College Algebra (MAT105) and English
Composition I (COL101). A second purpose was to determine to what extent age,
gender, or method of course delivery affected student success in these courses. Chapter
three includes the methodology used in conducting this study. This chapter provides an
explanation of the research design, population, and sampling procedures as well as a
description of the instrumentation, including measurement, validity, and reliability.
Information regarding data collection is included. Finally, contained in this chapter is an
explanation of data analysis and hypothesis testing and limitations of the study.
Research Design
This quantitative, descriptive study used archived data collected from the
Jenzabar student information system at Allen Community College. According to Aliaga
and Gunderson (2002), quantitative research is, "Explaining phenomena by collecting
numerical data that are analyzed using mathematically based methods (in particular
statistics)" (p. 81). According to Lunenburg and Irby (2008), a descriptive study looks to
"describe phenomena in our world" (p. 30), and these studies, "are important to the public
and to educators" (p. 31).
For this study, the dependent variable was success and was defined by course
grade. Grades of A, B, C, and P were defined as successful completion. Grades of D, F,
I, and W were considered unsuccessful completion. The independent variable for this
study included the method of placement (ACT scores, ASSET scores, COMPASS scores,

54
successful completion of the prerequisite course, or waiver). Independent variables also
included student age, gender, and mode of course delivery.
Population and Sample
The population for this study was community college students. The sample was
students who attended Allen Community College. Approximately 3,000 students attend
Allen Community College each semester (Allen Community College, 2012). From this
number, the study focused on students who completed College Algebra (MAT105) or
English Composition I (COL101) for the first time who earned a course grade. The
sample for the College Algebra (MAT105) portion of the study was students who earned
a course grade in College Algebra (MAT105) for the first time at Allen Community
College from Spring 2003 through Summer 2013. The sample for the English
Composition I (COL101) portion of the study was students who earned a course grade in
English Composition I (COL101) for the first time at Allen Community College from
Spring 2003 through Summer 2013.
Sampling Procedures
This study used purposive sampling. According to Lunenburg and Irby (2008),
"Purposive sampling involves selecting a sample based on the researcher's experience or
knowledge of the group to be sampled" (p. 175). Student completion of College Algebra
(MAT105) or English Composition I (COL101) at Allen Community College between
Spring 2003 and Summer 2013 served as the first criteria for inclusion in the study. A
second criterion of the study narrowed the sample to students who completed the course
under placement guidelines adopted in 2002. The third criteria of the study narrowed the
sample to only the first attempt to complete the course by a student. The third criteria

55
considered the method of placement for College Algebra (MAT105) or English
Composition I (COL101). Methods of placement used at Allen Community College
include ACT scores, ASSET scores, COMPASS scores, completion of prerequisite
courses, and waivers. Students who qualified using an SAT score were omitted.
Instrumentation
According to Lunenburg and Irby (2008), instrumentation describes, "The
psychometric adequacy of the instruments used in a study" (p. 181). Lunenburg and Irby
(2008) also noted that researchers should provide key information for each instrument
including the name, acronym, authors, key references, purpose, number of items, subtests
or subscales, definitions, response format, scoring, reliability, and validity. Instruments
used in this study include the ACT, COMPASS, and ASSET tests.
Instrumentation: ACT
ACT (2014) provides background information about the ACT, which colleges
have used as an admissions test since 1959. ACT (2014) reported that three million
students take the ACT each year and three thousand institutions use it for admission. The
ACT includes multiple-choice English, mathematics, reading, and science tests.
According to ACT (2014), the English test determines knowledge of punctuation,
grammar, usage, sentence structure, strategy, organization, and style. The mathematics
test includes algebra, geometry trigonometry subtests. Based on the information
presented by ACT (2014), the reading test was designed to assess reading comprehension
and reasoning. According to ACT (2014), the science test measures the ability of the
student to interpret, analyze, evaluate, reason, and solve problems with questions from
subjects including biology, chemistry, physics, earth science, and space science. Table 1

56
provides information regarding the number of items and time allowed for each ACT
subtest.
Table 1
ACT Subtest Information
Test Number of Items Time Allowed
English 75 45
Mathematics 60 60
Reading 40 35
Science 40 35
Note: Adapted from ACT Technical Manual (2014)
ACT (2014) claims test specifications are based on content and statistical criteria.
Students who take the ACT receive a score in each category as well as a composite score
between 1 and 36.
Instrumentation: COMPASS
ACT (2012) indicated COMPASS was developed between 1985 and 1989. ACT
set the technical and content guidelines for the exam in 1990 (ACT, 2012). According to
ACT (2012), working groups developed items for the reading, writing, and math tests.
ACT included counselors, staff, and faculty in the working groups. Stakeholders
requested that COMPASS provide both placement and diagnostic information (ACT,
2012).
Working groups determined what content would be most relevant for each area.
The groups reviewed catalogs from colleges to gather information about remedial,
college-level, and advanced courses (ACT, 2012). As the working groups developed test
items, ACT subjected the items to internal and external review (ACT, 2012).

57
Internal review involves looking at each question for fairness, content, accuracy,
and quality (ACT, 2012). Revisions occurred as the process progressed. Each item,
according to ACT (2012), was also reviewed to ensure there was only one right answer,
that answer options were convincing, and at the appropriate cognitive level. ACT also
reviewed each item to ensure it represented society accurately (ACT, 2012).
Consultants completed an external review in 1992 (ACT, 2012). According to
ACT (2012), external reviewers represented African Americans, Asian Americans,
Hispanics, Native Americans, and women. Advocacy groups were included in the
process. ACT conducted conference calls with the group members to ensure items were
appropriate. ACT then decided to remove items, revise items, or leave items (ACT,
2012). According to ACT (2012), a second external review occurred in 1997 following
the same process as the original development.
ACT used placement validity indices to estimate the probability of student
success in courses (ACT, 2012). ACT (2012) reported that the company looked at the
percentage of students who scored below the cutoff and would have failed, the percentage
who scored below the cutoff and would have succeeded, the percentage who scored at or
above the cutoff and succeeded, and the percentage who scored at or above the cutoff and
failed. According to ACT (2012), ACT determined the sum of correctly placed students
to determine validation. COMPASS varies between 59% and 72% accuracy for students
earning a C or better (ACT, 2012).
According to ACT (2012), colleges have used the COMPASS since 1993. The
COMPASS is a computer-adaptive test made up of five mathematics levels, reading, and
writing (ACT, 2012). Within mathematics, the COMPASS tests numerical skills/pre-

58
algebra, algebra, college algebra, trigonometry, and geometry. Based on information
provided by ACT (2012), the numerical skills/pre-algebra test has a pool of over 300
questions covering basic arithmetic to exponents, absolute values, and percentages.
Students who do well on the numerical skills questions, claims ACT (2012), move up to
the algebra test. The algebra portion of the mathematics test includes 300 questions
covering elementary algebra, coordinate geometry, and intermediate algebra.
ACT (2012) indicated that the college algebra portion of the COMPASS has a
pool of 210 questions and covers functions, matrices, and factorials. Students who do
well on the college algebra portion of the test move on to the geometry test. The
geometry test covers geometry and spatial reasoning with a pool of 178 questions (ACT,
2012). ACT (2012) specifies the trigonometry test assesses understanding of
trigonometry and problem solving with 146 questions in the pool.
The reading test consists of a pool of 71 passages of about 300 words each from
prose, fiction, humanities, social sciences, natural sciences, and practical reading. For
each passage, ACT (2012) claims there are up to five test questions. The total number of
items a student receives during any given attempt is based on how many questions the
student answers correctly and incorrectly. If a student answers questions correctly, the
student receives questions that are more difficult. The process continues until the student
begins to miss questions. When the student misses a certain number of questions, the
student receives easier questions. The test ends when the student cannot answer the more
difficult questions correctly and has proven mastery on the level below.
The writing skills COMPASS test, covers grammar, usage, mechanics, and
rhetorical skill with a pool of 228 multiple-choice questions. Software routes the students

59
through the test so each test taker may take a different amount of time to complete the
test. The COMPASS test report provides scores in each category and a course
recommendation based on the profile set up by the institution.
Instrumentation: ASSET
ACT (2009) developed the ASSET placement test in 1982 to assist the Los
Angeles Community College District with retention and other objectives. By 1983,
community and technical colleges all over the United States were able to use ASSET.
Between 1986 and 1988, ACT revised ASSET to meet the needs of community colleges
in placement better. According to ACT (2009), they introduced the ASSET test form
used by Allen Community College in 1989. ACT conducted tests at 23 institutions to
norm the test.
Several different forms of the ASSET placement test exist. Each form of the
ASSET placement test consists of several subtests. The ASSET subtests used by Allen
Community College include the writing skills, reading skills, numerical skills, elementary
algebra, intermediate algebra, and college algebra assessments (Allen Community
College, 2012). The writing skills test entails answering 36 multiple-choice questions
covering usage and mechanics, sentence structure, and rhetorical skills. The student is
allowed 25 minutes to test. The reading skills test entails answering 24 multiple-choice
questions covering reading comprehension. The numerical skills test contains 32
multiple-choice questions covering arithmetic and pre-algebra. The elementary algebra
test consists of 25 multiple-choice questions covering expressions, factoring,
polynomials, exponents, and linear equations. According to ACT, the intermediate
algebra test consists of 25 multiple-choice questions covering polynomials, graphs,

60
radicals, and slope. The college algebra test consists of 25 multiple-choice questions
covering exponential functions, factorials, complex numbers, and graphs of polynomials
(ACT, 2009).
ASSET development, based on information provided in ACT (2009), included
curriculum surveys at hundreds of schools across the country. Advisory panels also met
to provide input. Writers, from institutions all over the United States, then developed
questions based on the guidelines set by ACT. ACT staff reviewed the items submitted
by writers for accuracy, quality, language, and cognitive level. Reviewers from outside
ACT then reviewed the exam for soundness and fairness. The review of soundness
included instructions, content, knowledge, and skill level. The fairness review
considered multicultural perspectives and included advice from advocacy groups for
several different subgroups. Fairness reviews included groups of African Americans,
Asian Americans, Hispanic Americans, Native Americans, and women.
ACT also used analysis of differential functioning (DIF) as part of its product
development. ACT (2009) stated, "A DIF analysis compares the performance of a focal
(minority) group against a relevant base (majority) group" (p. 13). Members of each
group are chosen who have similar abilities based on the test score. ACT used the
Mantel-Haenszel common-odds ratio to compare the results of the two groups. ACT
compared data for 4,154 students at sixteen colleges in the United States in Fall 1991 to
complete DIF analysis on the Advanced Mathematics tests. For the Basic Skills Tests,
the company used 444 comparisons. Nine items were flagged out of 148 based on the
data.

61
ACT also reviews item discrimination. According to ACT (2009), item
discrimination is, "the degree to which an item differentiates between students who
performed well on the total test and those who did not" (p. 15). ACT (2009) explains,
"Correlations near zero indicate that the test did not discriminate well between able and
less able examinees" (p. 15). "Correlations between .40 and .80 indicate that the test
distinguishes well between able and less able examinees" (ACT, 2009, p. 15).
Cut Scores and Placement Policy
Each school sets cut scores for placement tests. Table 2 provides a breakdown of
the cut scores required by Allen Community College on the various placement tests in
writing and reading for students to enroll in English Composition I (COL101). Students
must meet placement requirements in both writing and reading for English Composition
I. Students may also place into English Composition I (COL101) by passing a
prerequisite course in an area in which they have a deficiency. For a writing deficiency,
students take Pre-Composition and must earn a C or higher to progress to English
Composition I. Students with a reading deficiency must pass Intermediate Reading with
a C or higher before enrolling in English Composition I. Students may also enroll in
English Composition I (COL101) using a waiver.
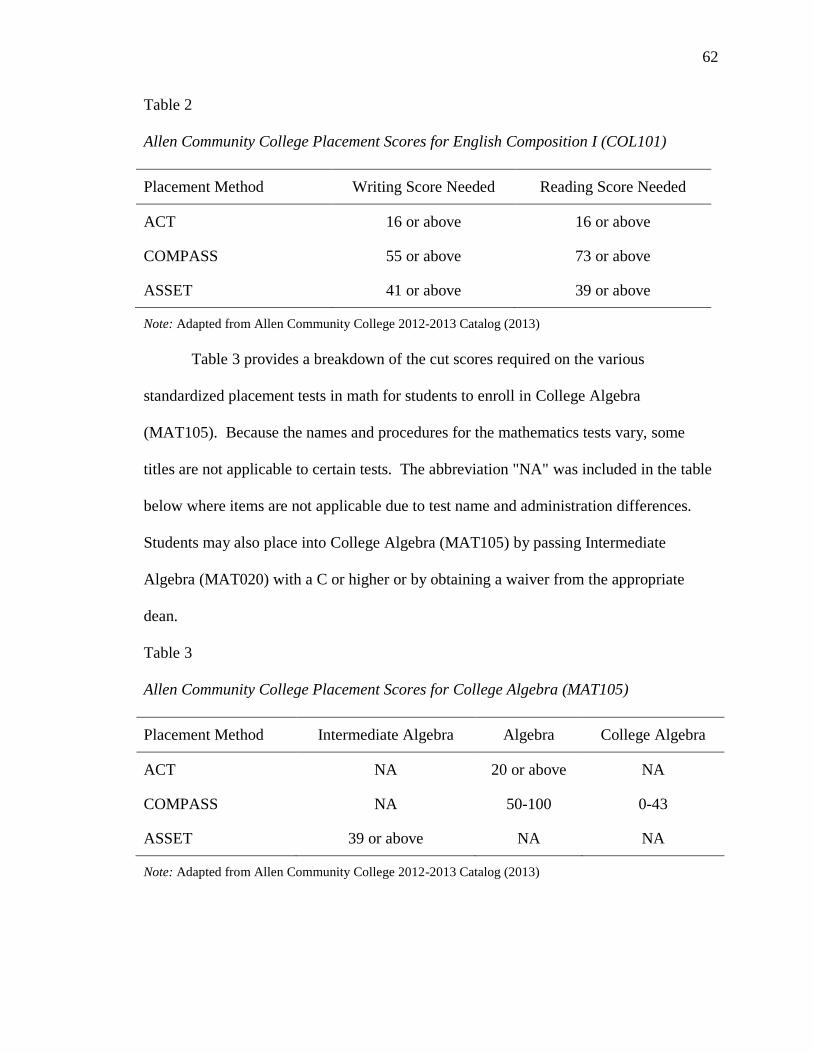
62
Table 2
Allen Community College Placement Scores for English Composition I (COL101)
Placement Method Writing Score Needed Reading Score Needed
ACT 16 or above 16 or above
COMPASS 55 or above 73 or above
ASSET 41 or above 39 or above
Note: Adapted from Allen Community College 2012-2013 Catalog (2013)
Table 3 provides a breakdown of the cut scores required on the various
standardized placement tests in math for students to enroll in College Algebra
(MAT105). Because the names and procedures for the mathematics tests vary, some
titles are not applicable to certain tests. The abbreviation "NA" was included in the table
below where items are not applicable due to test name and administration differences.
Students may also place into College Algebra (MAT105) by passing Intermediate
Algebra (MAT020) with a C or higher or by obtaining a waiver from the appropriate
dean.
Table 3
Allen Community College Placement Scores for College Algebra (MAT105)
Placement Method Intermediate Algebra Algebra College Algebra
ACT NA 20 or above NA
COMPASS NA 50-100 0-43
ASSET 39 or above NA NA
Note: Adapted from Allen Community College 2012-2013 Catalog (2013)

63
Measurement. In the Allen Community College catalog, student success is
defined as course completion with a C or higher or a grade of Pass. For research
questions 1, 2, 3, and 4 the course grade in College Algebra (MAT105) was determined
to be successful for grades of A, B, C, and P. Grades of D, F, I, and W were determined
to be unsuccessful. The method of placement variable was measured categorically, and
there were six categories. For all research questions, the method of placement included
ACT, SAT, ASSET, COMPASS, completion of the prerequisite course, or waiver. For
age, the variable was measured categorically, and there were two categories. Age was
based on the self-reported birth date listed on the student's application for admission. For
research questions 2, 6, and 8, the traditional/non-traditional status of students was
determined by considering students age 24 and over as non-traditional. All students
whose ages were under 24 were considered traditional. These categories are based on the
same definition used by the National Center for Education Statistics (2011). For gender,
the variable was measured categorically, and there were two categories. For research
questions 3, 7, and 9, the determination of gender (male or female) was based on
information reported by students on their application for admission. For Research
Questions 5, 6, 7, and 8 the course grade in English Composition I (COL101) was
defined as successful for grades of A, B, C, and P. Grades of D, F, I, and W was defined
as unsuccessful.
Delivery mode of courses varies by location. The course delivery mode was
measured categorically, and there were four categories. For research question 4, 8 and
10, the determination of delivery mode (Burlingame/Outreach, Iola, online, concurrent),
for each student, was found in the data file in the course section code from the CARS

64
system. Class meetings vary from one time per week on the Burlingame Campus in a
three-hour block, two times per week on the Burlingame Campus in two ninety-minute
sessions, three times per week on the Iola Campus for fifty-five minutes, or two times per
week on the Iola Campus for eighty-five minutes. During summer sessions, these
courses may be offered four days a week for three hours a day during a four-week session
or for three hours a day twice a week for eight weeks. Partner high schools offer these
courses on the block schedule or period schedule. Allen Community College also offers
College Algebra (MAT105) and English Composition I (COL101) online in eight-week
and sixteen-week sessions. The category concurrent means classes delivered by a teacher
employed by the high school, taught during the high school day, and taught at the high
school in accordance with the high school schedule. The category Burlingame/Outreach
describes classes delivered off campus at outreach sites or the Burlingame Campus and
offered based on the site schedule. The category online describes a course offered
asynchronously through distance education. The category Iola refers to a course taught at
the Iola Campus and based on its schedule.
Validity and reliability. According to Lunenburg and Irby (2008), "Validity is
the degree to which an instrument measures what it purports to measure" (p. 181). This
study was based on the assumption that the ACT, COMPASS, and ASSET are reliable,
which has been verified by the test providers. ACT has spent a great deal of time and
effort making sure its tests are reliable and valid. Validity can be classified as content
validity, criterion-related validity, and construct validity. According to Lunenburg and
Irby (2008), "Content validity is the degree to which an instrument measures an intended
content area," and, "is determined by expert judgment" (p.181). Criterion-related validity
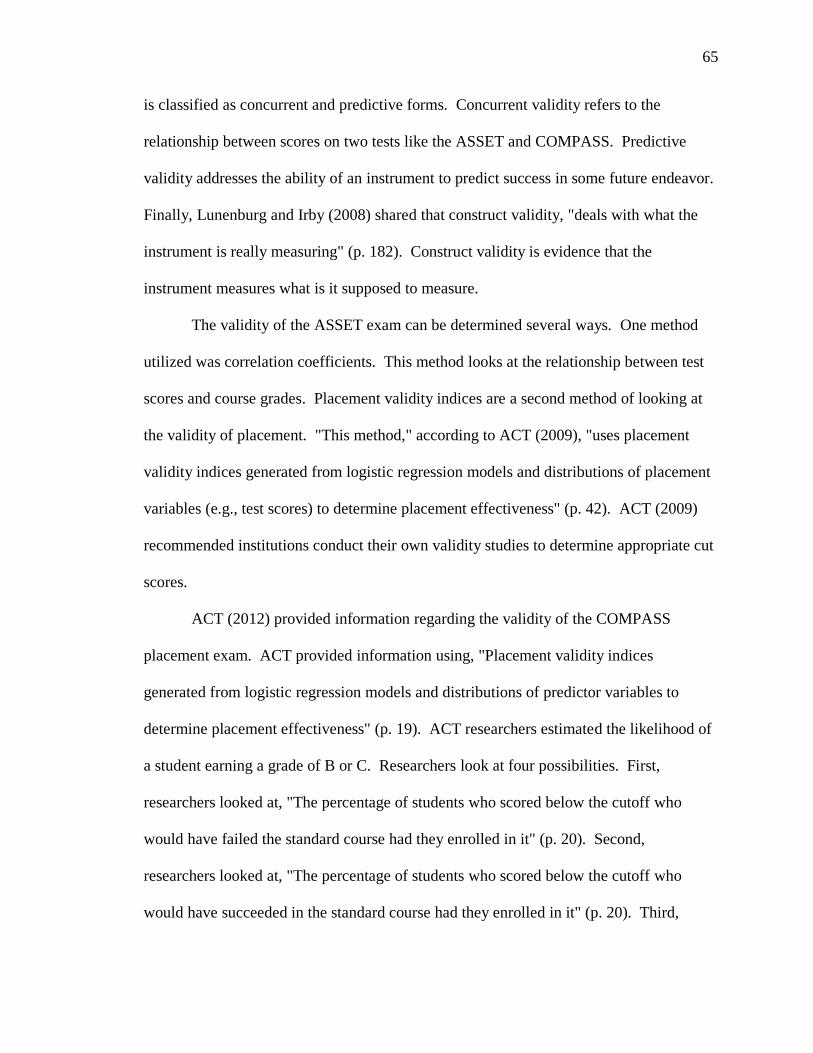
65
is classified as concurrent and predictive forms. Concurrent validity refers to the
relationship between scores on two tests like the ASSET and COMPASS. Predictive
validity addresses the ability of an instrument to predict success in some future endeavor.
Finally, Lunenburg and Irby (2008) shared that construct validity, "deals with what the
instrument is really measuring" (p. 182). Construct validity is evidence that the
instrument measures what is it supposed to measure.
The validity of the ASSET exam can be determined several ways. One method
utilized was correlation coefficients. This method looks at the relationship between test
scores and course grades. Placement validity indices are a second method of looking at
the validity of placement. "This method," according to ACT (2009), "uses placement
validity indices generated from logistic regression models and distributions of placement
variables (e.g., test scores) to determine placement effectiveness" (p. 42). ACT (2009)
recommended institutions conduct their own validity studies to determine appropriate cut
scores.
ACT (2012) provided information regarding the validity of the COMPASS
placement exam. ACT provided information using, "Placement validity indices
generated from logistic regression models and distributions of predictor variables to
determine placement effectiveness" (p. 19). ACT researchers estimated the likelihood of
a student earning a grade of B or C. Researchers look at four possibilities. First,
researchers looked at, "The percentage of students who scored below the cutoff who
would have failed the standard course had they enrolled in it" (p. 20). Second,
researchers looked at, "The percentage of students who scored below the cutoff who
would have succeeded in the standard course had they enrolled in it" (p. 20). Third,

66
researchers considered, "The percentage of students who scored at or above the cutoff
who actually succeeded in the standard course" (p. 20). Finally, the researchers
considered, "The percentage of students who scored at or above the cutoff who actually
failed in the standard course" (p. 20). Using these four criteria, researchers calculated the
percentage of students who were placed correctly for a certain cut score that is the
accuracy rate.
Using data gathered through ACT Placement Services, ACT analyzed placement
tests administered beginning in Fall 1993 and compared student success in courses to
COMPASS scores to determine predictive validity. ACT reviewed student success,
defined as a C or B or higher, in classes including English Composition and College
Algebra. For students who took the COMPASS between January 1995 and November
2001 in classes with at least 40 enrolled, students who met the Writing cut-score had a
19% greater chance of getting a B. Students who met the Reading cut-score had a 10%
greater chance of getting a B. Students who met the Intermediate algebra cut-score had a
25% greater chance of getting a B and students who met the College algebra cut-score
had a 43% greater chance of getting a B. For students who took the COMPASS between
January 1995 and November 2001 in classes with at least 40 enrolled, students who met
the Writing cut-score had a 2% greater chance of getting a C. Students who met the
Reading cut-score also had a 2% greater chance of getting a C. Students who met the
Intermediate algebra cut-score had a 5% greater chance of getting a C and students who
met the College algebra cut-score had a 20% greater chance of getting a C.
ACT (2014) addressed how the test maker determined the content validity or the
degree to which the instrument measured an intended content area. ACT used panels of

67
secondary and postsecondary instructors to determine content that reflects the first year
college curriculum. According to ACT (2014), "Students with higher ACT scores should
be more successful than students with lower ACT scores" if the content is valid (p. 116).
ACT used grades from courses at over 100 colleges to study validity. ACT used logistic
regression models to determine the likelihood that a student would earn a B or higher in a
course for courses with 40 or more students to determine an accuracy rate for each test.
For math placement, use of ACT scores resulted in a 24% greater success rate in College
Algebra and a 25% greater success rate in composition. ACT used this information to
indicate that the test had content reliability or measured the intended content area.
According to Lunenburg and Irby (2008), "Reliability is the degree to which an
instrument consistently measures whatever it is measuring" (p. 182). Reliability is
classified into five different types: test-retest reliability, equivalent forms reliability,
internal consistency reliability, alpha reliability, split-half reliability, and interrater
reliability. Test-retest reliability looks at whether or not scores are consistent on an
instrument. Equivalent forms reliability refers to the similarity between versions of an
instrument. Internal consistency reliability is measured by split half reliability, alpha
reliability, and interrater reliability. Lunenburg and Irby (2008) defined split-half
reliability as, "breaking a single instrument into two halves" (p. 183). Subjects take both
halves of a test then the odds and evens are divided so the score on each part can be
compared to the other part. For Kuder-Richardson and Cronbach's Alpha Reliabilities,
Lunenburg and Irby (2008) instructed us to consider, "How all items on an instrument
relate to all other instrument items and to the total instrument" (p. 183). Interrater

68
reliability is considered when an instrument has answers that different graders might rate
differently.
ACT (2009) included reliability information for the ASSET exam using internal
consistency, test-retest, and consistency of scores on equivalent forms in the ASSET
Technical Manual. The first measure of internal consistency was the Kuder-Richardson
Formula (KR-20). According to ACT (2009), this measure indicated how well "each
item on an exam relates to all other items on the test and to the test as a whole" (p. 18).
ACT (2009) indicated, "KR-20 reliabilities can range from 0.0 and +1.0, with higher
numbers indicating greater reliability" (p.18). According to ACT (2009), Forms B2 and
C2 have KR-20 internal consistency reliabilities from .65 to .87.
The second measure of reliability used for ASSET evaluation was the standard
error of measurement (SEM). According to ACT (2009), "The SEM provides
information about the difference that could be expected between a student's obtained
score and the average score that student would earn if he or she could be tested an infinite
number of times under identical circumstances" (p. 18). According to ACT (2009), SEM
scores for Forms B2 and C2 ranged from 2.24 to 3.84 in the companies reliability testing.
The third evaluation of reliability for ASSET was the test-retest reliability.
According to ACT (2009) one can "administer the same test to the same examinees at
two different points in time and compare the rank ordering of the examinees for the two
administrations" (p. 19). ACT asked 1,047 examinees to take the ASSET twice with
three weeks between the test and retest. The test-retest correlations ranged from .76 to
.90, which indicated reliability between the two test dates.

69
ACT also investigated the reliability of equivalent forms of the ASSET. For this
test, subjects take two forms of the same test and scores are compared. According to
ACT (2009), reliability for Forms B2 and C2 ranged from .73 to .88 for tests taken on the
same day and .66 to .86 for tests given two weeks apart. This result indicated the ASSET
provides reliable results.
Reliability is a challenge for a computer adaptive test such as the COMPASS.
Individuals taking the exam access different test items and numbers of questions.
According to ACT (2012), "In an adaptive test, the examinees are measured with a
slightly different reliability, which aligns with the items administered" (p. 4). Based on
information in the reference manual, "The marginal reliability coefficient usually
reported for adaptive tests takes this variation into account by averaging the reliabilities
across examinees" (ACT, 2012, p. 4). Simulations can also be used to determine a
marginal reliability coefficient. Data from the simulations can be compared to actual test
results to evaluate the results. According to ACT (2012), "The slight tradeoff between
test length and test reliability is that longer tests are more reliable than shorter tests" (p.
4). ACT (2012) reported the reliability of its Mathematics, Reading, and Writing tests in
the technical manual. For the standard length test in mathematics placement, reliability
varied from .86 to .88. For the extended length test, the reliability varies from .87 to .89.
For the maximum length, reliability varied from .88 to .90. For the test in Reading
placement, the reliability varied from .87 on the standard length test to .90 on the
maximum length test. For the test in writing placement, reliability varied from .88 on the
standard length exam to .90 on the maximum length exam.

70
According to ACT (2012), the conditional standard error of measurement
(CSEM) provides, "a more useful indicator of score precision" (p. 7). According to ACT
(2012), "The CSEM can be estimated for different values across the score scale, thereby
helping users interpret likely reliability throughout the score scale" (p. 7). ACT provided
CSEM information for each of the COMPASS placement tests. ACT (2014) listed the
reliability of the ACT English test as .92, the Mathematics test as .90, and the reading test
as .88 for exams given to high school seniors in 1995. For high school seniors who tested
in 2011 and 2012, the reliability of the ACT English test was listed as .92, the reliability
of the ACT mathematics test was listed as .91, and the reliability of the ACT Reading test
was listed as .88. For the 2011-2012 data, ACT used groups of 2,000 or more students at
six different test administrations. The average standard error of measurement for the
2011-2012 tests was between 1.72 and 1.74 for the English test, between 1.50 and 1.60
for the mathematics test, and between 2.09 and 2.21 for the reading test.
ACT expended considerable effort to prove the validity of the ACT, ASSET, and
COMPASS. For ASSET, ACT provided evidence of validity using correlation
coefficients and placement validity indices. For COMPASS, ACT provided evidence of
validity using placement validity indices and content validity. For the ACT, content
validity was used to show test validity. For the ASSET reliability studies, ACT used
internal consistency, standard error of measurement testing, test-retest reliability, and the
reliability of equivalent forms to demonstrate reliability. For COMPASS, ACT
demonstrated the reliability of the test through marginal reliability coefficients,
simulations, and standard error of measurement. The ACT demonstrated reliability for
the ACT assessment using standard error of measurement.

71
Data Collection Procedures
The Vice President for Academic Affairs at Allen Community College granted
the researcher permission to work with the Director of Information Technology to extract
the data for this study from the student information system on March 12, 2012 (see
Appendix A). Permission to complete this study was requested on October 14, 2015,
from the Baker University Institutional Review Board (see Appendix B). The
Institutional Review Board at Baker University approved this study on October 21, 2015
(see Appendix C).
The Director of Information Technology extracted all data from the Jenzabar
student information system at Allen Community College and downloaded the data into
Excel spreadsheets. The data harvested from the student information system included the
method of student placement, age, gender, course section, instructor, and final grade for
students in both College Algebra (MAT105) and English Composition I (COL101).
Data Analysis and Hypothesis Testing
Each hypothesis in the research study was tested using a 2 test of independence.
Data was analyzed using IBM® SPSS
® Statistics Faculty Pack 22 software for Windows.
RQ1. To what extent is there a relationship between how a student meets the
math placement requirement for College Algebra (MAT105) and student success?
H1. There is a relationship between how a student meets the math placement
requirement for College Algebra (MAT105) and student success.
A 2
test of independence was conducted to test H1. The observed frequencies
were compared to those expected by chance. The level of significance was set at .05.
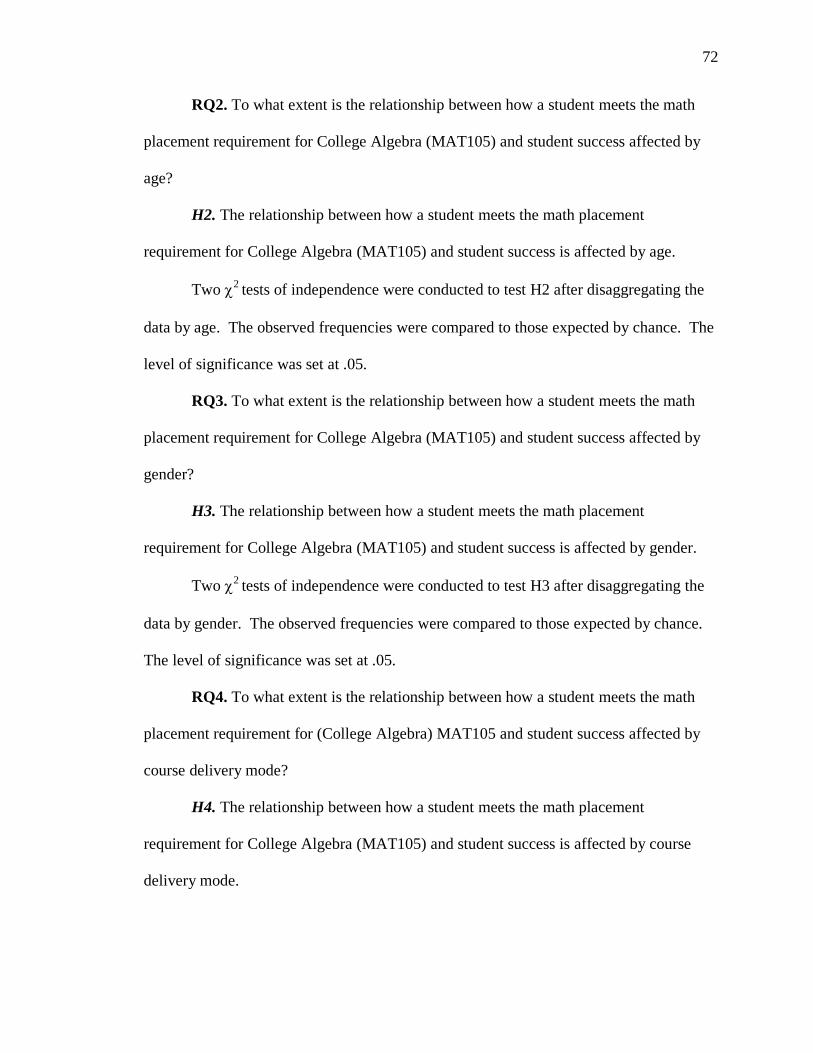
72
RQ2. To what extent is the relationship between how a student meets the math
placement requirement for College Algebra (MAT105) and student success affected by
age?
H2. The relationship between how a student meets the math placement
requirement for College Algebra (MAT105) and student success is affected by age.
Two 2
tests of independence were conducted to test H2 after disaggregating the
data by age. The observed frequencies were compared to those expected by chance. The
level of significance was set at .05.
RQ3. To what extent is the relationship between how a student meets the math
placement requirement for College Algebra (MAT105) and student success affected by
gender?
H3. The relationship between how a student meets the math placement
requirement for College Algebra (MAT105) and student success is affected by gender.
Two 2
tests of independence were conducted to test H3 after disaggregating the
data by gender. The observed frequencies were compared to those expected by chance.
The level of significance was set at .05.
RQ4. To what extent is the relationship between how a student meets the math
placement requirement for (College Algebra) MAT105 and student success affected by
course delivery mode?
H4. The relationship between how a student meets the math placement
requirement for College Algebra (MAT105) and student success is affected by course
delivery mode.

73
Four 2
tests of independence were conducted to test H4 after disaggregating the
data by course delivery mode (Burlingame/Outreach, Iola, online, concurrent). The
observed frequencies were compared to those expected by chance. The level of
significance was set at .05.
RQ5. To what extent is there a relationship between how a student meets the
writing placement requirement for English Composition I (COL101) and student success?
H5. There is a relationship between how a student meets the writing placement
requirement for English Composition I (COL101) and student success.
A 2 test of independence was conducted to test H5. The observed frequencies
were compared to those expected by chance. The level of significance was set at .05.
RQ6. To what extent is the relationship between how a student meets the writing
placement requirement for English Composition I (COL101) and student success affected
by age?
H6. The relationship between how a student meets the writing placement
requirement for English Composition I (COL101) and student success is affected by age.
Two 2
tests of independence were conducted to test H6 after disaggregating the
data by age. The observed frequencies were compared to those expected by chance. The
level of significance was set at .05.
RQ7. To what extent is the relationship between how a student meets the writing
placement requirement for English Composition I (COL101) and student success affected
by gender?

74
H7. The relationship between how a student meets the writing placement
requirement for English Composition I (COL101) and student success is affected by
gender.
Two 2
tests of independence were conducted to test H7 after disaggregating the
data by gender. The observed frequencies were compared to those expected by chance.
The level of significance was set at .05.
RQ8. To what extent is the relationship between how a student meets the writing
placement requirement for English Composition I (COL101) and student success affected
by delivery mode?
H8. The relationship between how a student meets the writing placement
requirement for English Composition I (COL101) and student success is affected by
course delivery mode.
Four 2 tests of independence were conducted to test H8 after disaggregating the
data by course delivery mode. The observed frequencies were compared to those
expected by chance. The level of significance was set at .05.
RQ9. To what extent is there a relationship between how a student meets the
reading placement requirement for English Composition I (COL101) and student
success?
H9. There is a relationship between how a student meets the reading placement
requirement for English Composition I (COL101) and student success.
A 2 test of independence was conducted to test H9. The observed frequencies
were compared to those expected by chance. The level of significance was set at .05.
RQ10. To what extent is the relationship between how a student meets the

75
reading placement requirement for English Composition I (COL101) and student success
affected by age?
H10. The relationship between how a student meets the reading placement
requirement for English Composition I (COL101) and student success is affected by age.
Two 2 tests of independence were conducted to test H10 after disaggregating the
data by age. The observed frequencies were compared to those expected by chance. The
level of significance was set at .05.
RQ11. To what extent is the relationship between how a student meets the
reading placement requirement for English Composition I (COL101) and student success
affected by gender?
H11. The relationship between how a student meets the reading placement
requirement for English Composition I (COL101) and student success is affected by
gender.
Two 2 tests of independence were conducted to test H11 after disaggregating the
data by gender. The observed frequencies were compared to those expected by chance.
The level of significance was set at .05.
RQ12. To what extent is the relationship between how a student meets the
reading placement requirement for English Composition I (COL101) and student success
affected by course delivery mode?
H12. The relationship between how a student meets the reading placement
requirement for English Composition I (COL101) and student success is affected by
course delivery mode.

76
Four 2
tests of independence were conducted to test H12 after disaggregating the
data by course delivery mode. The observed frequencies were compared to those
expected by chance. The level of significance was set at .05.
Limitations
According to Lunenburg and Irby (2008), the limitations of a study are factors
that are not controlled by the researcher. Limitations can affect the interpretation of
results or the generalizability of the results (Lunenburg & Irby, 2008). The limitations of
this study included
1. Data extracted from the student information system may include errors.
College employees processing student applications and entering placement
scores may make data entry errors or typographical errors that would impact
the data used in this study.
2. The Director of Information Technology could have extracted incorrect data
fields from the student information system, which could result in bad data.
3. Instructors may grade work and assign grades differently. For example, some
instructors may award partial credit and others may not. Instructors set their
grading scales. One instructor might consider a 69.5 a "C" and a successful
completion while others may consider it a "D" and unsuccessful completion.
According to Cronbach (1971), “If teachers use different bases for judgment
and some are more generous than others, throwing grades from several
algebra teachers into a single distribution merely piles one source of error
upon another” (p. 491). Armstrong (2001) found, “A relatively high degree of
variation in grading practices by instructors” (p. 13).

77
4. Other factors might affect student success in a course. Students may have
accessed tutoring services from the college or an outside entity. Students may
have spent varying amounts of time on coursework and had varying attitudes
toward the courses. Students may have outside demands on their time related
to family responsibilities, extra-curricular activities, work, or health. Students
can withdraw from a course through the 70th day of class in a sixteen-week
sessions. For shorter terms, students can withdraw through 90% of the class
meeting days. Students might also be withdrawn by their instructor for
violation of class policies such as attendance or academic honesty.
5. The level of high school preparation for students was unknown and was not
considered in placement.
6. This study did not include students who dropped a course before Census day.
When a student drops before Census day, enrollment is not noted on his or her
transcript. This study only looked at students who were enrolled on Census
day and thus had a grade on their transcript for the course.
Summary
Provided in chapter three was the research design for a study of placement testing
and student success in College Algebra (MAT105) and English Composition I (COL101)
at Allen Community College. The research design, population and sample, sampling
procedures, instrumentation, measurement, validity and reliability, data collection and
procedures, data analysis and hypothesis testing, and limitations were explored in chapter
three. Chapter four includes the results of the study.

78
Chapter Four
Results
The purpose of this study was to investigate whether a relationship existed
between the method of placement in College Algebra (MAT105) and student success at
Allen Community College. The second purpose of this study was to determine whether a
relationship existed between the method of placement in English Composition I
(COL101) and student success at Allen Community College. An additional purpose of
the study was to examine the effect age, gender, and method of delivery had on the
relationship between method of placement and success. Descriptive statistics for the
sample are included in this chapter. Each hypothesis in this study was tested using the 2
test of independence.
Descriptive Statistics
For the math data, there were 8,472 students in the sample. Students earning the
grades of A, B, C, and P were considered successful. Students earning the grades of D,
F, W, or I were considered unsuccessful. Of the 8,472 students in the math dataset,
80.7% were traditional students (under age 24) and 19.3% were non-traditional students
(age 24 or older). Included in Table 4 is the breakdown of the ages of students in the
math dataset.
Table 4
Math Dataset - Age
Age Category N %
Non-traditional 1,631 19.3
Traditional 6,841 80.7

79
Another demographic investigated in three hypotheses in this study was gender.
In the math data set, 59.3% of the students were female, and 40.7% were male. The
gender breakdown for the math data is found in Table 5.
Table 5
Math Dataset - Gender
Gender N %
Male 3,445 40.7
Female 5,027 59.3
Three hypotheses in the study investigated the effect of delivery method
(Burlingame/Outreach, Iola, online, concurrent) on success. Burlingame/Outreach
students made up 34% of the sample, concurrent students made up 33.2% of the sample,
Iola students made up 18.8% of the sample, and online students made up 14% of the
sample. Provided in Table 6 are the numbers of students in each category.
Table 6
Math Dataset - Delivery Method
Category N %
Burlingame/Outreach 2,884 34.0
Iola 1,589 18.8
Online 1,183 14.0
Concurrent 2,816 33.2
Student success was an important consideration in this study. Students who
successfully completed their College Algebra (MAT105) course made up 75.1% of the

80
sample and those who were unsuccessful made up 24.9% of the sample. The breakdown
of successful and unsuccessful students in the math dataset is found in Table 7.
Table 7
Math Dataset - Success
Category N %
Successful 6,359 75.1
Unsuccessful 2,113 24.9
Included in Table 8 is a breakdown of the method of placement by which the
students in the sample were placed. Two students were placed using COMPASS Algebra
test scores. These students were combined with those who were placed using COMPASS
College Algebra scores for the hypothesis testing analyses. Two students were placed
using SAT scores. These students were removed from the hypothesis testing analyses
because the sample size for the category was too small to analyze statistically.

81
Table 8
Math Dataset - Method of Placement
Placement Method N %
ACT 2,223 26.2
ASSET Intermediate Algebra 2,289 27.0
COMPASS Algebra 2 .0
COMPASS College Algebra 1,156 13.6
Prerequisite Course 2,663 31.4
SAT 2 .0
Waiver 137 l.6
For the composition dataset, there were 8,789 students in the sample. Three
hypotheses considered the effect of age (traditional/non-traditional status) on student
success. Of these 8,789 students, 81.3% were traditional students and 18.7% were non-
traditional students. Included in Table 9 is a breakdown of the age of students in the
composition dataset.
Table 9
Composition Dataset - Age
Category N %
Non-traditional 1,643 18.7
Traditional 7,146 81.3

82
Another demographic considered by three hypotheses in the study was gender. In
the composition data set, 58% of the students were female, and 41.9% were male.
Included in Table 10 is the gender breakdown of the composition data set.
Table 10
Composition Dataset - Gender
Category N %
Male 3,686 41.9
Female 5,102 58.0
Three hypotheses in the study investigated the effect of delivery method
(Burlingame/Outreach, Iola, online, concurrent) on success. Burlingame/Outreach
students made up 26.6% of the sample for composition, concurrent students made up
27.1% of the sample, Iola students made up 26.9% of the sample, and online students
made up 19.4% of the sample. Included in Table 11 is the breakdown of the numbers of
students in each category.
Table 11
Composition Dataset - Delivery Method
Category N %
Burlingame/Outreach 2,339 26.6
Iola 2,363 26.9
Online 1,704 19.4
Concurrent 2,383 27.1
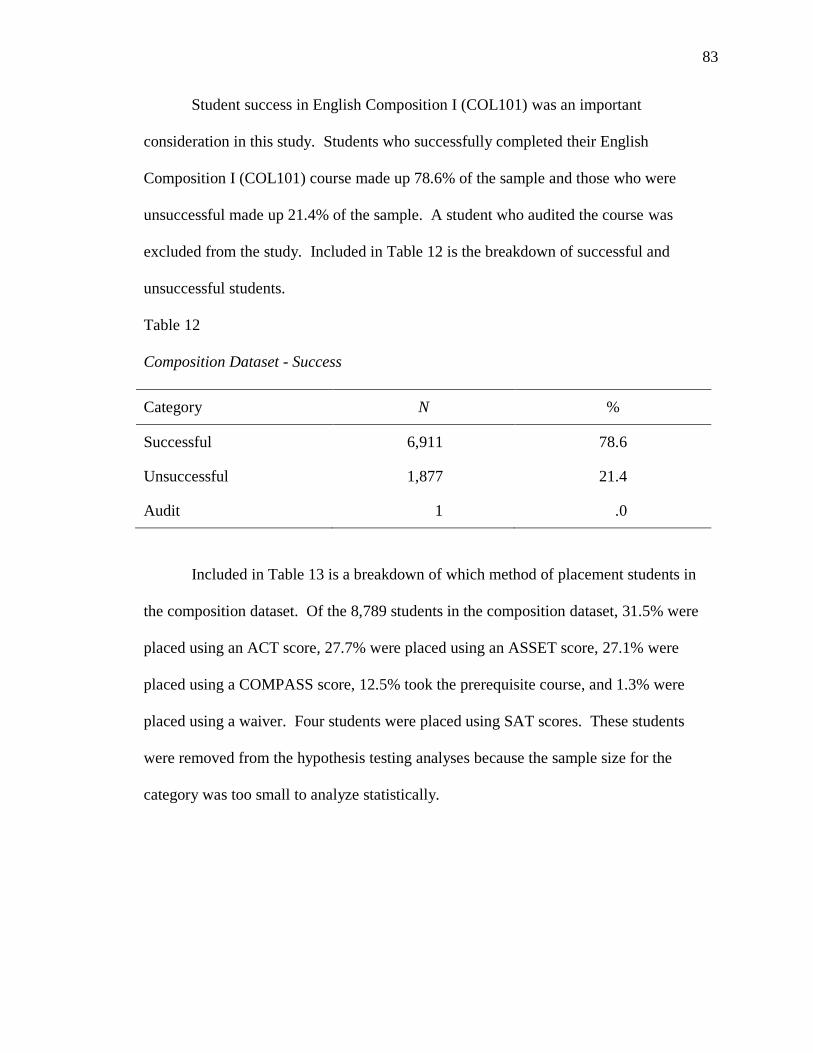
83
Student success in English Composition I (COL101) was an important
consideration in this study. Students who successfully completed their English
Composition I (COL101) course made up 78.6% of the sample and those who were
unsuccessful made up 21.4% of the sample. A student who audited the course was
excluded from the study. Included in Table 12 is the breakdown of successful and
unsuccessful students.
Table 12
Composition Dataset - Success
Category N %
Successful 6,911 78.6
Unsuccessful 1,877 21.4
Audit 1 .0
Included in Table 13 is a breakdown of which method of placement students in
the composition dataset. Of the 8,789 students in the composition dataset, 31.5% were
placed using an ACT score, 27.7% were placed using an ASSET score, 27.1% were
placed using a COMPASS score, 12.5% took the prerequisite course, and 1.3% were
placed using a waiver. Four students were placed using SAT scores. These students
were removed from the hypothesis testing analyses because the sample size for the
category was too small to analyze statistically.

84
Table 13
Composition Dataset - Method of Writing Placement
Placement Method N %
ACT 2,767 31.5
ASSET 2,436 27.7
COMPASS 2,378 27.1
Prerequisite Course 1,097 12.5
SAT 4 .0
Waiver 111 l.3
Included Table 14 is a breakdown of which method of placement by which
students were placed for reading. Of the 8,789 students in the composition dataset,
32.1% were placed using an ACT score, 31.1% were placed using an ASSET score,
27.6% were placed using a COMPASS score, 7.7% took a prerequisite course, and 1.5%
were placed using a waiver. The four students who were placed using SAT scores were
removed from the hypothesis testing analyses because the sample size for the category
was too small to analyze statistically.

85
Table 14
Composition Dataset - Method of Reading Placement
Placement Method N %
ACT 2,819 32.1
ASSET 2,729 31.1
COMPASS 2,429 27.6
Prerequisite Course 677 7.7
SAT 4 .0
Waiver 134 l.5
Hypothesis Testing
For hypotheses 1, 5, and 9 in the research study, the data was tested using a 2 test
of independence. For hypotheses 2, 3, 4, 6, 7, 8, 10, 11, and 12 the data was
disaggregated based on a demographic and multiple 2
tests of independence were
conducted. Data was analyzed using IBM® SPSS
® Statistics Faculty Pack 22 software for
Windows. The level of significance was set at .05 for all tests.
RQ1. To what extent is there a relationship between how a student meets the
math placement requirement for College Algebra (MAT105) and student success?
H1. There is a relationship between how a student meets the math placement
requirement for College Algebra (MAT105) and student success.
A 2 test of independence was conducted to address RQ1. The observed
frequencies were compared to those expected by chance. The level of significance was
set at .05. The results of the test indicated a statistically significant difference between
the observed and expected values, 2 = 269.673, df = 4, p = .000. See Table 15 for the

86
observed and expected frequencies. The observed frequency (n = 1794) was higher than
the expected frequency (n = 1668.7) for students who were placed using an ACT score
and were successful. The observed frequency (n = 1905) was higher than the expected
frequency (n = 1718.2) for students who were placed using an ASSET score and were
successful. The observed frequency (n = 326.0) was higher than the expected frequency
(n = 288.7) for students who were placed using a COMPASS score and were
unsuccessful. The observed frequency (n = 926.0) was higher than the expected
frequency (n = 664.0) for students who were placed using a prerequisite course and were
unsuccessful. The observed frequency (n = 47.0) was higher than the expected frequency
(n = 34.2) for students who were placed using a waiver and were unsuccessful in the
course. Students who were placed using the ACT and ASSET tended to be successful in
College Algebra (MAT105) at Allen Community College. Students who were placed
using the COMPASS, prerequisite course, and waiver tended to be unsuccessful.

87
Table 15
Observed and Expected Frequencies for H1
Course Results
Placement Method Successful Unsuccessful
ACT Observed 1,794.0 429.0
Expected 1,668.7 554.3
ASSET Observed 1,905.0 384.0
Expected 1,718.2 570.8
COMPASS Observed 832.0 326.0
Expected 869.3 288.7
Prerequisite Observed 1,737 926.0
Expected 1,999.0 664.0
Waiver Observed 90.0 47.0
Expected 102.8 34.2
RQ2. To what extent is the relationship between how a student meets the math
placement requirement for College Algebra (MAT105) and student success affected by
age?
H2. The relationship between how a student meets the math placement
requirement for College Algebra (MAT105) and student success is affected by age.
Before conducting the two 2 tests of independence used to address RQ2, the
sample was disaggregated by student age (traditional, non-traditional). For the first test,
using the traditional student data, the observed frequencies were compared to those
expected by chance. The level of significance was set at .05. The results of the test

88
indicated a statistically significant difference between the observed and expected values,
2
= 316.668, df = 4, p = .000. See Table 16 for the observed and expected frequencies.
The observed frequency (n = 1771.0) was higher than the expected frequency
(n = 1663.1) for traditional students who were placed using an ACT score and were
successful. The observed frequency (n = 1841.0) was higher than the expected frequency
(n = 1663.1) for traditional students who were placed using an ASSET score and were
successful. The observed frequency (n = 263.0) was higher than the expected frequency
(n = 213.0) for traditional students who were placed using a COMPASS score and were
unsuccessful. The observed frequency (n = 584.0) was higher than the expected
frequency (n =358.6) for traditional students who were placed using a prerequisite course
and were unsuccessful. The observed frequency (n = 57.0) was lower than the expected
frequency (n = 67.5) for traditional students who were placed using a waiver and were
successful. The observed frequency (n = 32.0) was higher than the expected frequency (n
= 21.5) for traditional students who were placed using a waiver and were unsuccessful.
Traditional students who were placed using the ACT and ASSET tended to be successful
in College Algebra (MAT105) at Allen Community College. Traditional students who
were placed using the COMPASS, prerequisite course, and waiver tended to be
unsuccessful in College Algebra (MAT105) at Allen Community College.

89
Table 16
Observed and Expected Frequencies for H2 - Traditional Students
Course Results
Placement Method Successful Unsuccessful
ACT Observed 1,771.0 423.0
Expected 1,663.1 530.9
ASSET Observed 1,841.0 354.0
Expected 1663.1 530.9
COMPASS Observed 617.0 263.0
Expected 667.0 213.0
Prerequisite Observed 898.0 584.0
Expected 1,123.4 358.6
Waiver Observed 57.0 32.0
Expected 67.5 21.5
For the second test, using the non-traditional student data, the observed
frequencies were compared to those expected by chance. The level of significance was
set at .05. The results of the test indicated no statistically significant difference between
the observed and expected values, 2 = 6.496, df = 4, p = .165. See Table 17 for the
observed and expected frequencies. For traditional students, the results of the test
indicated a statistically significant relationship between method of placement and student
success. For non-traditional students, no statistically significant relationship was found.
The data supported the hypothesis that the relationship between how a student meets the
math placement requirement for College Algebra (MAT105) and student success is

90
affected by age (traditional/non-traditional status) because the results varied between
traditional and non-traditional students.
Table 17
Observed and Expected Frequencies for H2 - Non-traditional Students
Course Results
Placement Method Successful Unsuccessful
ACT Observed 23.0 6.0
Expected 20.9 8.1
ASSET Observed 64.0 31.0
Expected 68.4 26.6
COMPASS Observed 215 63.0
Expected 200.1 77.9
Prerequisite Observed 839.0 342.0
Expected 850.1 330.9
Waiver Observed 33.0 15.0
Expected 34.6 13.4
RQ3. To what extent is the relationship between how a student meets the math
placement requirement for College Algebra (MAT105) and student success affected by
gender?
H3. The relationship between how a student meets the math placement
requirement for College Algebra (MAT105) and student success is affected by gender.
Before conducting the two 2 tests of independence used to address RQ3, the
sample was disaggregated by student gender (male, female). For the first test, using the

91
male student data, the observed frequencies were compared to those expected by chance.
The level of significance was set at .05. The results of the test indicated a statistically
significant difference between the observed and expected values, 2 = 133.918, df = 4, p
= .000. See Table 18 for the observed and expected frequencies. The observed
frequency (n = 765.0) was higher than the expected frequency (n = 726.0) for male
students who were placed using an ACT score and were successful. The observed
frequency (n = 779.0) was higher than the expected frequency (n = 675.7) for male
students who were placed using an ASSET score and were successful. The observed
frequency (n = 182.0) was higher than the expected frequency (n = 151.4) for male
students who were placed using a COMPASS score and were unsuccessful. The
observed frequency (n = 363.0) was higher than the expected frequency (n = 257.9) for
male students who were placed using a prerequisite course and were successful. The
observed frequency (n = 25.0) was higher than the expected frequency (n = 18.4) for
male students who were placed using a waiver and were unsuccessful. Male students
who were placed using the ACT and ASSET tended to be successful in College Algebra
(MAT105) at Allen Community College. Male students who were placed using the
COMPASS, prerequisite course, and waiver tended to be unsuccessful in College
Algebra at Allen Community College.

92
Table 18
Observed and Expected Frequencies for H3 - Male Students
Course Results
Placement Method Successful Unsuccessful
ACT Observed 765.0 260.0
Expected 726.0 299.0
ASSET Observed 779.0 175.0
Expected 675.7 278.3
COMPASS Observed 337.0 182.0
Expected 367.6 151.4
Prerequisite Observed 521.0 363.0
Expected 626.1 257.9
Waiver Observed 38.0 25.0
Expected 44.6 18.4
For the second test, using the female student data, the observed frequencies were
compared to those expected by chance. The level of significance was set at .05. The
results of the test indicated a statistically significant difference between the observed and
expected values, 2
= 173.804, df = 4, p = .000. See Table 19 for the observed and
expected frequencies. The observed frequency (n = 1029.0) was higher than the expected
frequency (n = 934.1) for female students who were placed using an ACT score and were
successful. The observed frequency (n = 1126) was higher than the expected frequency
(n = 1040.9) for female students who were placed using an ASSET score and were
successful. The observed frequency (n = 144.0) was higher than the expected frequency
93
(n = 140.8) for female students who were placed using a COMPASS score and were
unsuccessful. The observed frequency (n = 563.0) was higher than the expected
frequency (n = 391.9) for female students who were placed using a prerequisite course
and were unsuccessful. The observed frequency (n = 22.0) was higher than the expected
frequency (n = 16.3) for female students who were placed using a waiver and were
unsuccessful. Female students who were placed using the ACT and ASSET tended to be
successful in College Algebra (MAT105) at Allen Community College. Female students
who were placed using the COMPASS, prerequisite course, and waiver tended to be
unsuccessful in College Algebra (MAT105) at Allen Community College. The
hypothesis was not supported by the data. The same methods of placement tended to lead
to student success regardless of gender.

94
Table 19
Observed and Expected Frequencies for H3 - Female Students
Course Results
Placement Method Successful Unsuccessful
ACT Observed 1,029.0 169.0
Expected 934.1 263.9
ASSET Observed 1126 209.0
Expected 1,040.9 294.1
COMPASS Observed 495 144.0
Expected 498.2 140.8
Prerequisite Observed 1,216.0 563.0
Expected 1387.1 391.9
Waiver Observed 52.0 22.0
Expected 57.7 16.3
RQ4. To what extent is the relationship between how a student meets the math
placement requirement for (College Algebra) MAT105 and student success affected by
delivery mode?
H4. The relationship between how a student meets the math placement
requirement for College Algebra (MAT105) and student success is affected by course
delivery mode.
Before conducting the four 2 tests of independence used to address RQ4, the
sample was disaggregated by delivery mode (Burlingame/Outreach, Iola, online,
concurrent). For the first test, using the Burlingame/Outreach data, the observed

95
frequencies were compared to those expected by chance. The level of significance was
set at .05. The results of the first test indicated no statistically significant difference
between the observed and expected values, 2
= 5.592, df = 4, p = .232. See Table 20 for
the observed and expected frequencies.
Table 20
Observed and Expected Frequencies for H4 - Burlingame/Outreach Students
Course Results
Placement Method Successful Unsuccessful
ACT Observed 390.0 112.0
Expected 382.9 119.1
ASSET Observed 302.0 76.0
Expected 288.3 89.7
COMPASS Observed 292.0 95.0
Expected 295.2 91.8
Prerequisite Observed 1,162.0 388.0
Expected 1,182.4 367.6
Waiver Observed 54.0 13.0
Expected 51.1 15.9
For the second test, using the Iola student data, the observed frequencies were
compared to those expected by chance. The level of significance was set at .05. The
results of the test indicated a statistically significant difference between the observed and
expected values, 2
= 47.869, df = 4, p = .000. See Table 21 for the observed and
expected frequencies. The observed frequency (n = 335.0) was higher than the expected

96
frequency (n = 293.5) for Iola students who were placed using an ACT score and were
successful. The observed frequency (n = 126.0) was higher than the expected frequency
(n = 104.7) for Iola students who were placed using an ASSET score and were
successful. The observed frequency (n = 134) was higher than the expected frequency
(n = 125.2) for Iola students who were placed using a COMPASS score and were
unsuccessful. The observed frequency (n = 238.0) was higher than the expected
frequency (n = 233.3) for Iola students who were placed using a prerequisite course and
were unsuccessful. The observed frequency (n = 13.0) was higher than the expected
frequency (n = 18.7) for Iola students who were placed using a waiver and were
unsuccessful. Iola students who were placed using the ACT and ASSET tended to be
successful in College Algebra (MAT105) at Allen Community College. Iola students
who were placed using the COMPASS, the prerequisite, and a waiver tended to be
unsuccessful in College Algebra (MAT105) at Allen Community College.

97
Table 21
Observed and Expected Frequencies for H4 - Iola Students
Course Results
Placement Method Successful Unsuccessful
ACT Observed 335.0 150.0
Expected 293.5 191.5
ASSET Observed 126.0 47.0
Expected 104.7 68.3
COMPASS Observed 183.0 134.0
Expected 191.8 125.2
Prerequisite Observed 308.0 283.0
Expected 357.7 233.3
Waiver Observed 9.0 13.0
Expected 13.3 8.7
For the third test, using the online student data, the observed frequencies were
compared to those expected by chance. The level of significance was set at .05. The
results of the test indicated a statistically significant difference between the observed and
expected values, 2
= 41.811, df = 4, p = .000. See Table 22 for the observed and
expected frequencies. The observed frequency (n = 190.0) was higher than the expected
frequency (n = 158.7) for online students who were placed using an ACT score and were
successful. The observed frequency (n = 49.0) was higher than the expected frequency (n
= 44.5) for online students who were placed using an ASSET score and were
unsuccessful. The observed frequency (n = 171.0) was higher than the expected

98
frequency (n = 149.1) for online students who were placed using a COMPASS score and
were successful. The observed frequency (n = 253.0) was higher than the expected
frequency (n = 207.3) for online students who were placed using a prerequisite course
and were unsuccessful. The observed frequency (n = 19.0) was higher than the expected
frequency (n = 16.0) for online students who were placed using a waiver and were
successful. Online students who were placed using the ACT, ASSET, and COMPASS
tended to be successful in College Algebra (MAT105) at Allen Community College.
Online students who were placed using the prerequisite course and waiver tended to be
unsuccessful in College Algebra (MAT105) at Allen Community College.
Table 22
Observed and Expected Frequencies for H4 - Online Students
Course Results
Placement Method Successful Unsuccessful
ACT Observed 190.0 75.0
Expected 158.7 106.3
ASSET Observed 62.0 49.0
Expected 66.5 44.5
COMPASS Observed 171.0 78.0
Expected 149.1 99.9
Prerequisite Observed 264.0 253.0
Expected 309.7 207.3
Waiver Observed 21.0 19.0
Expected 24.0 16.0

99
For the fourth test, using the concurrent student data, the observed frequencies
were compared to those expected by chance. The level of significance was set at .05.
The results of the test indicated a statistically significant difference between the observed
and expected values, 2
= 13.929, df = 4, p = .008. See Table 23 for the observed and
expected frequencies. The observed frequency (n = 879.0) was higher than the expected
frequency (n = 858.2) for concurrent students who were placed using an ACT score and
were successful. The observed frequency (n = 212.0) was higher than the expected
frequency (n = 188.9) for concurrent students who were placed using an ASSET score
and were unsuccessful. The observed frequency (n = 186.0) was higher than the expected
frequency (n = 181.2) for concurrent students who were placed using a COMPASS score
and were successful. The observed frequency (n = 2.0) was higher than the expected
frequency (n = 0.6) for concurrent students who were placed using a prerequisite course
and were unsuccessful. The observed frequency (n = 2.0) was higher than the expected
frequency (n = 0.9) for concurrent students who were placed using a waiver and were
unsuccessful. Concurrent students who were placed using the ACT and COMPASS
tended to be successful in College Algebra (MAT105) at Allen Community College.
Concurrent students who were placed using the ASSET, prerequisite course, and waiver
tended to be unsuccessful in College Algebra (MAT105) at Allen Community College.

100
Table 23
Observed and Expected Frequencies for H4 - Concurrent Students
Course Results
Placement Method Successful Unsuccessful
ACT Observed 879.0 92.0
Expected 858.2 112.8
ASSET Observed 1,415.0 212.0
Expected 1,438.1 188.9
COMPASS Observed 186.0 19.0
Expected 181.2 23.8
Prerequisite Observed 3.0 2.0
Expected 4.4 .6
Waiver Observed 6.0 2.0
Expected 7.1 .9
The hypothesis that the relationship between how a student meets the math
placement requirement for College Algebra (MAT105) and student success is affected by
delivery mode (Burlingame/Outreach, Iola, online, concurrent) was supported. Different
methods of placement tended to lead to success for different methods of course delivery.
For Burlingame/Outreach students, no statistically significant relationship existed. Iola
students who were placed using the ACT and ASSET tended to be successful in College
Algebra (MAT105) at Allen Community College. Iola students who were placed using
the COMPASS, the prerequisite, and a waiver tended to be unsuccessful in College
Algebra (MAT105). Online students who were placed using the ACT, ASSET, and

101
COMPASS tended to be successful in College Algebra (MAT105) at Allen Community
College. Online students who were placed using the prerequisite course and waiver
tended to be unsuccessful in College Algebra (MAT105) at Allen Community College.
Concurrent students who were placed using the ACT and COMPASS tended to be
successful in College Algebra (MAT105) at Allen Community College. Concurrent
students who were placed using the ASSET, prerequisite course, and waiver tended to be
unsuccessful in College Algebra (MAT105) at Allen Community College.
RQ5. To what extent is there a relationship between how a student meets the
writing placement requirement for English Composition I (COL101) and student success?
H5. There is a relationship between how a student meets the writing placement
requirement for English Composition I (COL101) and student success.
A 2 test of independence was conducted to address RQ5. The observed
frequencies were compared to those expected by chance. The level of significance was
set at .05. The results of the test indicated a statistically significant difference between
the observed and expected values, 2 = 374.152, df = 4, p = .000. See Table 24 for the
observed and expected frequencies. The observed frequency (n = 2264.0) was higher
than the expected frequency (n = 2176.3) for students who were placed using an ACT
score and were successful. The observed frequency (n = 2151.0) was higher than the
expected frequency (n = 1914.3) for students who were placed using an ASSET score and
were successful. The observed frequency (n = 658.0) was higher than the expected
frequency (n = 507.7) for students who were placed using a COMPASS score for
students and were unsuccessful. The observed frequency (n = 408.0) was higher than the
expected frequency (n = 234.2) for students who were placed using a prerequisite course

102
and were unsuccessful. The observed frequency (n = 87.0) was too close to the expected
frequency (n = 87.3) for students who placed using a waiver who were successful in the
course to be meaningful. Students who were placed using the ACT and ASSET tended to
be successful in English Composition I (COL101) at Allen Community College.
Students who were placed using the COMPASS test and prerequisite course tended to be
unsuccessful in English Composition I (COL101) at Allen Community College. The data
was inconclusive for the waiver.
Table 24
Observed and Expected Frequencies for H5
Course Results
Placement Method Successful Unsuccessful
ACT Observed 2,264.0 503.0
Expected 2,176.3 590.7
ASSET Observed 2,151.0 283.0
Expected 1,914.3 519.7
COMPASS Observed 1,720.0 658.0
Expected 1,870.3 507.7
Prerequisite Observed 689.0 408.0
Expected 862.8 234.2
Waiver Observed 87.0 24.0
Expected 87.3 23.7

103
RQ6. To what extent is the relationship between how a student meets the writing
placement requirement for English Composition I (COL101) and student success affected
by age?
H6. The relationship between how a student meets the writing placement
requirement for English Composition I (COL101) and student success is affected by age.
Before conducting the two 2 tests of independence used to address RQ6, the
sample was disaggregated by student age (traditional, non-traditional). For the first test,
using the traditional student data, the observed frequencies were compared to those
expected by chance. The level of significance was set at .05. The results of the test
indicated a statistically significant difference between the observed and expected values,
2
= 467.779, df = 4, p = .000. See Table 25 for the observed and expected frequencies.
The observed frequency (n = 2231.0) was higher than the expected frequency
(n = 2148.1) for traditional students who were placed using an ACT score and were
successful. The observed frequency (n = 1874.0) was higher than the expected frequency
(n = 1638.3) for traditional students who were placed using an ASSET score and were
successful. The observed frequency (n = 474.0) was higher than the expected frequency
(n = 314.7) for traditional students who placed using a COMPASS score and were
unsuccessful. The observed frequency (n = 323.0) was higher than the expected
frequency (n = 165.9) for traditional students who were placed using a prerequisite course
and were unsuccessful. The observed frequency (n = 15.0) was higher than the expected
frequency (n = 12.8) for traditional students who were placed using a waiver and were
unsuccessful. Traditional students who were placed using the ACT and ASSET tended to
be successful in English Composition I (COL101) at Allen Community College.

104
Traditional students who were placed using the COMPASS, prerequisite course, and
waiver tended to be unsuccessful in English Composition I (COL101) at Allen
Community College.
Table 25
Observed and Expected Frequencies for H6 - Traditional Students
Course Results
Placement Method Successful Unsuccessful
ACT Observed 2,231.0 487.0
Expected 2,148.1 569.9
ASSET Observed 1,874.0 199.0
Expected 1,638.3 434.7
COMPASS Observed 1,027.0 474.0
Expected 1,186.3 314.7
Prerequisite Observed 468.0 323.0
Expected 625.1 165.9
Waiver Observed 46.0 15.0
Expected 48.2 12.8
For the second test, using the non-traditional student data, the observed
frequencies were compared to those expected by chance. The level of significance was
set at .05. The results of the test indicated no statistically significant difference between
the observed and expected values, 2 = 9.260, df = 4, p = .055. See Table 26 for the
observed and expected frequencies. For traditional students, a statistically significant
relationship existed but for non-traditional students norelationship existed. The

105
hypothesis that the relationship between how a student meets the writing placement
requirement for English Composition I (COL101) and student success is affected by age
was supported.
Table 26
Observed and Expected Frequencies for H6 - Non-traditional Students
Course Results
Placement Method Successful Unsuccessful
ACT Observed 33.0 16.0
Expected 37.7 11.3
ASSET Observed 277.0 84.0
Expected 277.9 83.1
COMPASS Observed 693.0 184.0
Expected 675.2 201.8
Prerequisite Observed 221.0 85.0
Expected 235.6 70.4
Waiver Observed 41.0 9.0
Expected 38.5 11.5
RQ7. To what extent is the relationship between how a student meets the writing
placement requirement for English Composition I (COL101) and student success affected
by gender?
H7. The relationship between how a student meets the writing placement
requirement for English Composition I (COL101) and student success is affected by
gender.

106
Before conducting the two 2 tests of independence used to address RQ7, the
sample was disaggregated by student gender (male, female). For the first test, using the
male student data, the observed frequencies were compared to those expected by chance.
The level of significance was set at .05. The results of the test indicated a statistically
significant difference between the observed and expected values, 2 = 180.630, df = 4,
p = .000. See Table 27 for the observed and expected frequencies. The observed
frequency (n = 979.0) was higher than the expected frequency (n = 934.7) for male
students who were placed using an ACT score and were successful. The observed
frequency (n = 815.0) was higher than the expected frequency (n = 700.8) for male
students who were placed using an ASSET score and were successful. The observed
frequency (n = 315.0) was higher than the expected frequency (n =238.7) for male
students who were placed using a COMPASS score and were unsuccessful. The
observed frequency (n = 204.0) was higher than the expected frequency (n = 126.2) for
male students who were placed using a prerequisite course and were unsuccessful. The
observed frequency (n = 18.0) was higher than the expected frequency (n = 13.7) for
male students who were placed using a waiver and were unsuccessful. Male students
who were placed using the ACT and ASSET for writing tended to be successful in
English Composition I (COL101) at Allen Community College. Male students who were
placed using the COMPASS, prerequisite course, and waiver for writing tended to be
unsuccessful in English Composition I (COL101) at Allen Community College.

107
Table 27
Observed and Expected Frequencies for H7 - Male Students
Course Results
Placement Method Successful Unsuccessful
ACT Observed 979.0 272.0
Expected 934.7 316.3
ASSET Observed 815.0 123.0
Expected 700.8 237.2
COMPASS Observed 629.0 315.0
Expected 705.3 238.7
Prerequisite Observed 295.0 204.0
Expected 372.8 126.2
Waiver Observed 36.0 18.0
Expected 40.3 13.7
For the second test, using the female student data, the observed frequencies were
compared to those expected by chance. The level of significance was set at .05. The
results of the test indicated a statistically significant difference between the observed and
expected values, 2
= 198.116, df = 4, p = .000. See Table 28 for the observed and
expected frequencies. The observed frequency (n = 1285.0) was higher than the expected
frequency (n = 1235.4) for female students who were placed using an ACT score and
were successful. The observed frequency (n = 1336.0) was higher than the expected
frequency (n = 1219.1) for female students who were placed using an ASSET score and
were successful. The observed frequency (n = 343.0) was higher than the expected

108
frequency (n = 265.4) for female students who were placed using a COMPASS score and
were unsuccessful. The observed frequency (n = 204.0) was higher than the expected
frequency (n = 110.7) for female students who were placed using a prerequisite course
and were unsuccessful. The observed frequency (n = 51.0) was higher than the expected
frequency (n = 46.5) for female students who were placed using a waiver and were
successful. Female students who were placed using the ACT, ASSET, and waiver for
writing tended to be successful in English Composition I (COL101) at Allen Community
College. Female students who were placed using the COMPASS and prerequisite course
for writing tended to be unsuccessful in English Composition I (COL101) at Allen
Community College.
The hypothesis that the relationship between how a student meets the writing
placement requirement for English Composition I (COL101) and student success is
affected by gender was supported. Male students who were placed using the ACT and
ASSET for writing tended to be successful in English Composition I (COL101) at Allen
Community College. Male students who were placed using the COMPASS, prerequisite
course, and waiver for writing tended to be unsuccessful in English Composition I
(COL101) at Allen Community College. Female students who were placed using the
ACT, ASSET, and waiver for writing tended to be successful in English Composition I
(COL101) at Allen Community College. Female students who were placed using the
COMPASS and prerequisite course for writing tended to be unsuccessful in English
Composition I (COL101) at Allen Community College.

109
Table 28
Observed and Expected Frequencies for H7 - Female Students
Course Results
Placement Method Successful Unsuccessful
ACT Observed 1,285.0 231.0
Expected 1,235.4 280.6
ASSET Observed 1,336.0 160.0
Expected 1,219.1 276.9
COMPASS Observed 1,091.0 343.0
Expected 1,168.6 265.4
Prerequisite Observed 394.0 204.0
Expected 487.3 110.7
Waiver Observed 51.0 6.0
Expected 46.5 10.5
RQ8. To what extent is the relationship between how a student meets the writing
placement requirement for English Composition I (COL101) and student success affected
by course delivery mode?
H8. The relationship between how a student meets the writing placement
requirement for English Composition I (COL101) and student success is affected by
course delivery mode.
Before conducting the four 2 tests of independence used to address RQ8, the
sample was disaggregated by delivery mode (Burlingame/Outreach, Iola, online,
concurrent). For the Burlingame/Outreach data, the observed frequencies were compared

110
to those expected by chance. The level of significance was set at .05. The results of the
test indicated a statistically significant difference between the observed and expected
values, 2 = 40.898, df = 4, p = .000. See Table 29 for the observed and expected
frequencies. The observed frequency (n = 509.0) was higher than the expected frequency
(n = 483.7) for Burlingame/Outreach students who were placed using an ACT score and
were successful. The observed frequency (n = 455.0) was higher than the expected
frequency (n = 422.5) for Burlingame/Outreach students who were placed using an
ASSET score and were successful. The observed frequency (n = 209.0) was higher than
the expected frequency (n = 190.0) for Burlingame/Outreach students who were placed
using a COMPASS score and were unsuccessful. The observed frequency
(n = 149.0) was higher than the expected frequency (n =106.8) for Burlingame/Outreach
students who were placed using a prerequisite course and were unsuccessful. The
observed frequency (n = 29.0) was higher than the expected frequency (n = 25.6) for
Burlingame/Outreach students who were placed using a waiver and were successful.
Burlingame students who were placed using the ACT, ASSET, and waiver for writing
placement tended to be successful in English Composition I (COL101) at Allen
Community College. Burlingame/Outreach students who were placed using the
COMPASS and prerequisite for writing placement tended to be unsuccessful in English
Composition I (COL101) at Allen Community College.

111
Table 29
Observed and Expected Frequencies for H8 - Burlingame/Outreach Students
Course Results
Placement Method Successful Unsuccessful
ACT Observed 509.0 171.0
Expected 483.7 196.3
ASSET Observed 455.0 139.0
Expected 422.5 171.5
COMPASS Observed 449.0 209.0
Expected 468.0 190.0
Prerequisite Observed 221.0 149.0
Expected 263.2 106.8
Waiver Observed 29.0 7.0
Expected 25.6 10.4
For the Iola students, the observed frequencies were compared to those expected
by chance. The level of significance was set at .05. The results of the test indicated a
statistically significant difference between the observed and expected values, 2
= 78.074,
df = 4, p = .000. See Table 30 for the observed and expected frequencies. The observed
frequency (n = 742.0) was higher than the expected frequency (n = 663.1) for Iola
students who were placed using an ACT score and were successful. The observed
frequency (n = 151) was higher than the expected frequency (n = 134.0) for Iola students
who were placed using an ASSET score and were successful. The observed frequency (n
= 260.0) was higher than the expected frequency (n = 195.1) for Iola students who were

112
placed using a COMPASS score and were unsuccessful. The observed frequency (n =
191.0) was higher than the expected frequency (n = 159.9) for Iola students who were
placed using a prerequisite course and were unsuccessful. The observed frequency (n =
26) was at the expected frequency (n = 26.0) for Iola students who were placed using a
waiver and were successful. Iola students who were placed using the ACT and ASSET
for writing placement tended to be successful in English Composition I (COL101) at
Allen Community College. Iola students who were placed using the COMPASS and
prerequisite for writing placement tended to be unsuccessful in English Composition I
(COL101) at Allen Community College. The waiver returned the same results as one
would expect by chance when used for writing placement in English Composition I
(COL101) at Allen Community College.

113
Table 30
Observed and Expected Frequencies for H8 - Iola Students
Course Results
Placement Method Successful Unsuccessful
ACT Observed 742.0 203.0
Expected 663.1 281.9
ASSET Observed 151.0 40.0
Expected 134.0 57.0
COMPASS Observed 394.0 260.0
Expected 458.9 195.1
Prerequisite Observed 345.0 191.0
Expected 376.1 159.9
Waiver Observed 26.0 11.0
Expected 26.0 11.0
For the online students, the observed frequencies were compared to those
expected by chance. The level of significance was set at .05. The results of the test
indicated a statistically significant difference between the observed and expected values,
2
= 14.731, df = 4, p = .005. See Table 31 for the observed and expected frequencies.
The observed frequency (n = 320.0) was higher than the expected frequency (n = 317.2)
for online students who were placed using an ACT score and were successful. The
observed frequency (n = 8.0) was higher than the expected frequency (n = 70.2) for
online students who were placed using an ASSET score and were unsuccessful. The
observed frequency (n = 598.0) was higher than the expected frequency (n = 577.3) for
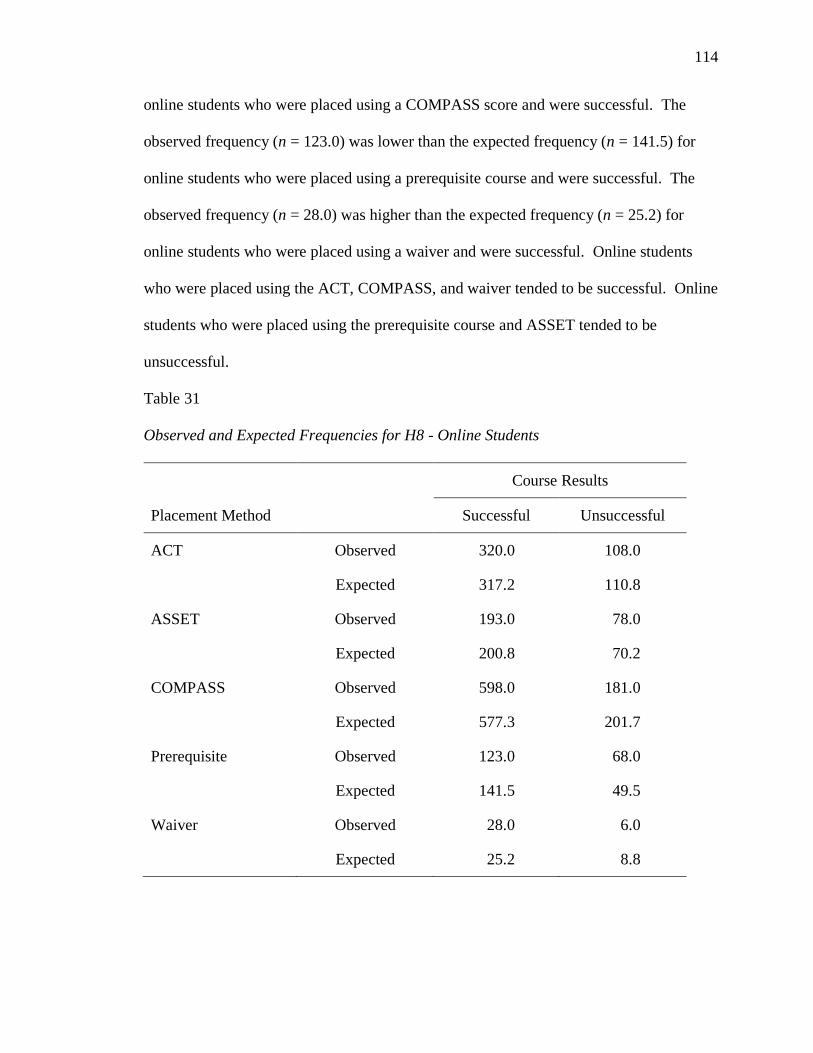
114
online students who were placed using a COMPASS score and were successful. The
observed frequency (n = 123.0) was lower than the expected frequency (n = 141.5) for
online students who were placed using a prerequisite course and were successful. The
observed frequency (n = 28.0) was higher than the expected frequency (n = 25.2) for
online students who were placed using a waiver and were successful. Online students
who were placed using the ACT, COMPASS, and waiver tended to be successful. Online
students who were placed using the prerequisite course and ASSET tended to be
unsuccessful.
Table 31
Observed and Expected Frequencies for H8 - Online Students
Course Results
Placement Method Successful Unsuccessful
ACT Observed 320.0 108.0
Expected 317.2 110.8
ASSET Observed 193.0 78.0
Expected 200.8 70.2
COMPASS Observed 598.0 181.0
Expected 577.3 201.7
Prerequisite Observed 123.0 68.0
Expected 141.5 49.5
Waiver Observed 28.0 6.0
Expected 25.2 8.8

115
For concurrent students, the observed frequencies were compared to those
expected by chance. The level of significance was set at .05. The results of the test
indicated no statistically significant difference between the observed and expected values,
2
= 2.741, df = 3, p = .433. See Table 32 for the observed and expected frequencies. No
statistically significant relationship existed for the concurrent student data.
Table 32
Observed and Expected Frequencies for H8 - Concurrent Students
Course Results
Placement Method Successful Unsuccessful
ACT Observed 693.0 21.0
Expected 697.5 16.5
ASSET Observed 1,352.0 26.0
Expected 1,346.2 31.8
COMPASS Observed 279.0 8.0
Expected 280.4 6.6
Prerequisite Observed 0 0
Expected 0 0
Waiver Observed 4.0 0
Expected 3.9 .1
The hypothesis was not supported that a relationship existed between the method
of course delivery and student success. Burlingame students who were placed using the
ACT, ASSET, and waiver for writing placement tended to be successful in English
Composition I (COL101) at Allen Community College. Burlingame/Outreach students

116
who were placed using the COMPASS and prerequisite for writing placement tended to
be unsuccessful in English Composition I (COL101) at Allen Community College. Iola
students who were placed using the ACT and ASSET for writing placement tended to be
successful in English Composition I (COL101) at Allen Community College. Iola
students who were placed using the COMPASS and prerequisite for writing placement
tended to be unsuccessful in English Composition I (COL101) at Allen Community
College. The waiver returned the same results as one would expect by chance when used
for writing placement in English Composition I (COL101) at Allen Community College.
Online students who were placed using the ACT, COMPASS, and waiver tended to be
successful. Online students who were placed using the prerequisite course and ASSET
tended to be unsuccessful. No statistically significant relationship existed for the
concurrent student data.
RQ9. To what extent is there a relationship between how a student meets the
reading placement requirement for English Composition I (COL101) and student
success?
H9. There is a relationship between how a student meets the reading placement
requirement for English Composition I (COL101) and student success.
A 2 test of independence was conducted to address RQ9. The observed
frequencies were compared to those expected by chance. The level of significance was
set at .05. The results of the test indicated a statistically significant difference between
the observed and expected values, 2 = 298.003, df = 4, p = .000. See Table 33 for the
observed and expected frequencies. The observed frequency (n = 2284.0) was higher
than the expected frequency (n = 2217.2) for students who were placed using an ACT

117
reading score and were successful. The observed frequency (n = 2366.0) was higher than
the expected frequency (n = 2145.6) for students who were placed using an ASSET
reading score and were successful. The observed frequency (n = 682.0) was higher than
the expected frequency (n = 518.6) for students who were placed using a COMPASS
reading score for students and were unsuccessful. The observed frequency (n = 257.0)
was higher than the expected frequency (n = 144.5) for students who were placed using a
prerequisite reading course and were unsuccessful. The observed frequency (n = 40.0)
was higher than the expected frequency (n = 28.6) for students who were placed using a
reading waiver and were unsuccessful in the course. Students who were placed using the
ACT and ASSET for reading placement tended to be successful in English Composition I
(COL101) at Allen Community College. Students who were placed using the
COMPASS test, prerequisite, and waiver for reading placement tended to be unsuccessful
in English Composition I (COL101) at Allen Community College.
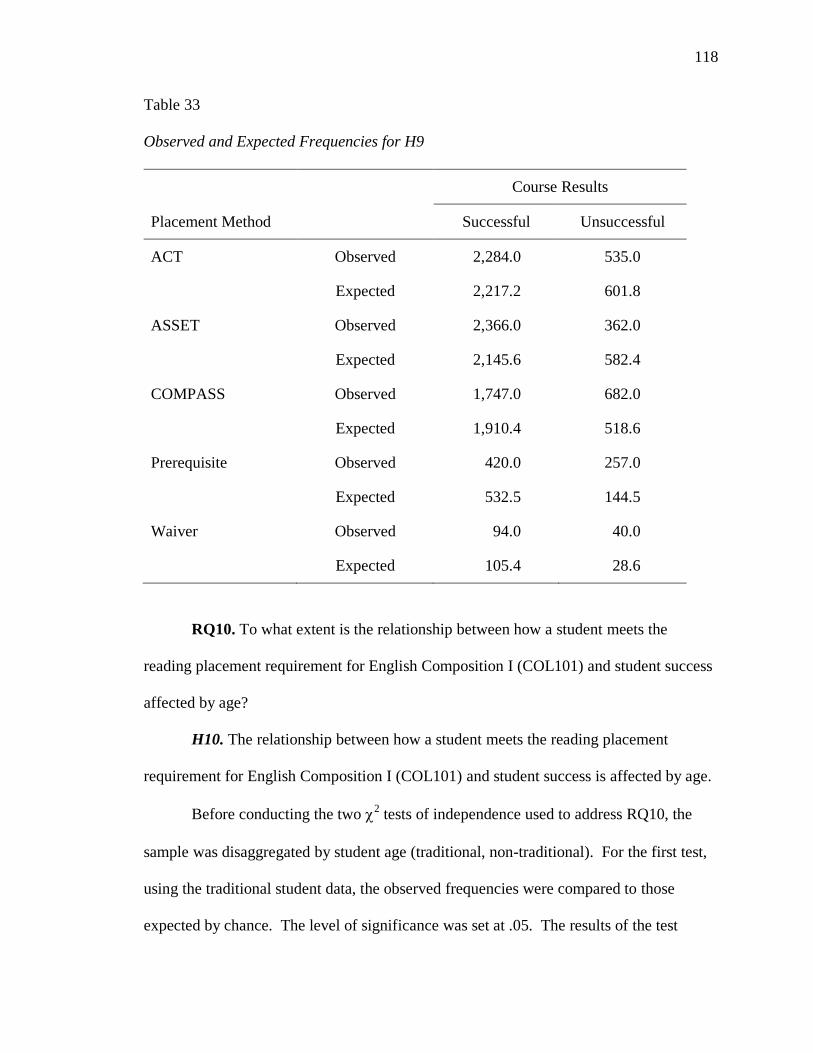
118
Table 33
Observed and Expected Frequencies for H9
Course Results
Placement Method Successful Unsuccessful
ACT Observed 2,284.0 535.0
Expected 2,217.2 601.8
ASSET Observed 2,366.0 362.0
Expected 2,145.6 582.4
COMPASS Observed 1,747.0 682.0
Expected 1,910.4 518.6
Prerequisite Observed 420.0 257.0
Expected 532.5 144.5
Waiver Observed 94.0 40.0
Expected 105.4 28.6
RQ10. To what extent is the relationship between how a student meets the
reading placement requirement for English Composition I (COL101) and student success
affected by age?
H10. The relationship between how a student meets the reading placement
requirement for English Composition I (COL101) and student success is affected by age.
Before conducting the two 2 tests of independence used to address RQ10, the
sample was disaggregated by student age (traditional, non-traditional). For the first test,
using the traditional student data, the observed frequencies were compared to those
expected by chance. The level of significance was set at .05. The results of the test

119
indicated a statistically significant difference between the observed and expected values,
2
= 398.936, df = 4, p = .000. See Table 34 for the observed and expected frequencies.
The observed frequency (n = 2246.0) was higher than the expected frequency
(n = 2183.6) for traditional students who were placed using an ACT reading score and
were successful. The observed frequency (n = 2046.0) was higher than the expected
frequency (n = 1822.5) for traditional students who were placed using an ASSET reading
score and were successful. The observed frequency (n = 480.0) was higher than the
expected frequency (n = 312.6) for traditional students who were placed using a
COMPASS reading score and were unsuccessful. The observed frequency (n = 210.0)
was higher than the expected frequency (n = 104.8) for traditional students who were
placed using a prerequisite reading course and were unsuccessful. The observed
frequency (n = 31.0) was higher than the expected frequency (n = 17.6) for traditional
students who were placed using a reading waiver and were unsuccessful. Traditional
students who were placed using the ACT and ASSET for reading placement tended to be
successful in English Composition I (COL101) at Allen Community College. Traditional
students who were placed using the COMPASS, prerequisite course, and waiver for
reading placement tended to be unsuccessful in English Composition I (COL101) at
Allen Community College.

120
Table 34
Observed and Expected Frequencies for H10 - Traditional Students
Course Results
Placement Method Successful Unsuccessful
ACT Observed 2,246.0 517.0
Expected 2,183.6 579.4
ASSET Observed 2,046.0 260.0
Expected 1,822.5 483.5
COMPASS Observed 1,011.0 480.0
Expected 1,178.4 312.6
Prerequisite Observed 290.0 210.0
Expected 395.2 104.8
Waiver Observed 53.0 31.0
Expected 66.4 17.6
For the second test, using the non-traditional student data, the observed
frequencies were compared to those expected by chance. The level of significance was
set at .05. The results of the test indicated no statistically significant difference between
the observed and expected values, 2 = 6.073, df = 4, p = .194. See Table 35 for the
observed and expected frequencies.
The hypothesis that the relationship between how a student meets the reading
placement requirement for English Composition I (COL101) and student success is
affected by age was supported. For traditional students, the results of the test indicated a

121
statistically significant relationship. For non-traditional students, no relationship was
indicated.
Table 35
Observed and Expected Frequencies for H10 - Non-traditional Students
Course Results
Placement Method Successful Unsuccessful
ACT Observed 38.0 18.0
Expected 43.1 12.9
ASSET Observed 320.0 102.0
Expected 324.9 97.1
COMPASS Observed 7.0 202.0
Expected 722.2 215.8
Prerequisite Observed 130.0 47.0
Expected 136.3 40.7
Waiver Observed 41.0 9.0
Expected 38.5 11.5
RQ11. To what extent is the relationship between how a student meets the
reading placement requirement for English Composition I (COL101) and student success
affected by gender?
H11. The relationship between how a student meets the reading placement
requirement for English Composition I (COL101) and student success is affected by
gender.

122
Before conducting the two 2 tests of independence used to address RQ11, the
sample was disaggregated by student gender (male/female). For the first test, using the
male student data, the observed frequencies were compared to those expected by chance.
The level of significance was set at .05. The results of the test indicated a statistically
significant difference between the observed and expected values, 2 = 158.966, df = 4, p
= .000. See Table 36 for the observed and expected frequencies. The observed
frequency (n = 1003.0) was higher than the expected frequency (n = 969.1) for male
students who were placed using an ACT reading score and were successful. The
observed frequency (n = 904.0) was higher than the expected frequency (n = 795.0) for
male students who were placed using an ASSET reading score and were successful. The
observed frequency (n = 323.0) was higher than the expected frequency (n = 243.7) for
male students who were placed using a COMPASS reading score and were unsuccessful.
The observed frequency (n = 130.0) was higher than the expected frequency (n = 74.6)
for male students who were placed using a prerequisite reading course and were
unsuccessful. The observed frequency (n = 25.0) was higher than the expected frequency
(n = 16.7) for male students who were placed using a reading waiver and were
unsuccessful. Male students who were placed using the ACT and ASSET for reading
placement tended to be successful in English Composition I (COL101) at Allen
Community College. Male students who were placed using the COMPASS, prerequisite
course, and waiver for reading placement tended to be unsuccessful in English
Composition I (COL101) at Allen Community College.

123
Table 36
Observed and Expected Frequencies for H11 - Male Students
Course Results
Placement Method Successful Unsuccessful
ACT Observed 1,003.0 294.0
Expected 969.1 327.9
ASSET Observed 904.0 160.0
Expected 795.0 269.0
COMPASS Observed 641.0 323.0
Expected 720.3 243.7
Prerequisite Observed 165.0 130.0
Expected 220.4 74.6
Waiver Observed 41.0 25.0
Expected 49.3 16.7
For the second test, using the female student data, the observed frequencies were
compared to those expected by chance. The level of significance was set at .05. The
results of the test indicated a statistically significant difference between the observed and
expected values, 2
= 142.487, df = 4, p = .000. See Table 37 for the observed and
expected frequencies. The observed frequency (n = 1281.0) was higher than the expected
frequency (n = 1240.3) for female students who were placed using an ACT reading score
and were successful. The observed frequency (n = 1462.0) was higher than the expected
frequency (n = 1356.1) for female students who were placed using an ASSET reading
score and were successful. The observed frequency (n = 359.0) was higher than the

124
expected frequency (n = 271.1) for female students who were placed using a COMPASS
reading score and were unsuccessful. The observed frequency (n = 127.0) was higher
than the expected frequency (n = 70.7) for female students who were placed using a
prerequisite reading course and were unsuccessful. The observed frequency (n = 15.0)
was higher than the expected frequency (n = 12.6) for female students who were placed
using a reading waiver and were unsuccessful. Female students who were placed using
the ACT and ASSET reading tests for reading placement tended to be successful in
English Composition I (COL101) at Allen Community College. Students who were
placed using the COMPASS, prerequisite course, and waiver for reading placement
tended to be unsuccessful in English Composition I (COL101) at Allen Community
College.
The hypothesis that the relationship between how a student meets the reading
placement requirement for English Composition I (COL101) and student success is
affected by gender (male/female) was not supported. Male students who were placed
using the ACT and ASSET for reading placement tended to be successful in English
Composition I (COL101) at Allen Community College. Male students who were placed
using the COMPASS, prerequisite course, and waiver for reading placement tended to be
unsuccessful in English Composition I (COL101) at Allen Community College. Female
students who were placed using the ACT and ASSET reading tests for reading placement
tended to be successful in English Composition I (COL101) at Allen Community
College. Students who were placed using the COMPASS, prerequisite course, and
waiver for reading placement tended to be unsuccessful in English Composition I
(COL101) at Allen Community College.

125
Table 37
Observed and Expected Frequencies for H11 - Female Students
Course Results
Placement Method Successful Unsuccessful
ACT Observed 1,281.0 241.0
Expected 1,240.3 281.7
ASSET Observed 1,462.0 202.0
Expected 1,356.1 307.9
COMPASS Observed 1,106.0 359.0
Expected 1,193.9 271.1
Prerequisite Observed 255.0 127.0
Expected 311.3 70.7
Waiver Observed 53.0 15.0
Expected 55.4 12.6
RQ12. To what extent is the relationship between how a student meets the
reading placement requirement for English Composition I (COL101) and student success
affected by course delivery mode?
H12. The relationship between how a student meets the reading placement
requirement for English Composition I (COL101) and student success is affected by
delivery mode.
Before conducting the four 2 tests of independence used to address RQ12, the
sample was disaggregated by delivery mode (Burlingame/Outreach, Iola, online,
concurrent). For the first test, using the Burlingame/Outreach data, the observed

126
frequencies were compared to those expected by chance. The level of significance was
set at .05. The results of the test indicated a statistically significant difference between
the observed and expected values, 2 = 37.315, df = 4, p = .000. See Table 38 for the
observed and expected frequencies. The observed frequency (n = 529.0) was higher than
the expected frequency (n = 509.3) for Burlingame/Outreach students who were placed
using an ACT reading score and were successful. The observed frequency (n = 523.0)
was higher than the expected frequency (n = 496.5) for Burlingame/Outreach students
who were placed using an ASSET reading score and were successful. The observed
frequency (n = 211.0) was higher than the expected frequency (n = 194.9) for
Burlingame/Outreach students who were placed using a COMPASS reading score and
were unsuccessful. The observed frequency (n = 93.0) was higher than the expected
frequency (n = 59.5) for Burlingame/Outreach students who were placed using a
prerequisite reading course and were unsuccessful. The observed frequency (n = 34.0)
was higher than the expected frequency (n = 30.6) for Burlingame/Outreach students who
were placed using a reading waiver and were successful. Burlingame/Outreach students
who were placed using the ACT, ASSET, and waiver for reading placement tended to be
successful in English Composition I (COL101) at Allen Community College.
Burlingame/Outreach students who were placed using the COMPASS and prerequisite
for reading placement tended to be unsuccessful in English Composition I (COL101) at
Allen Community College.
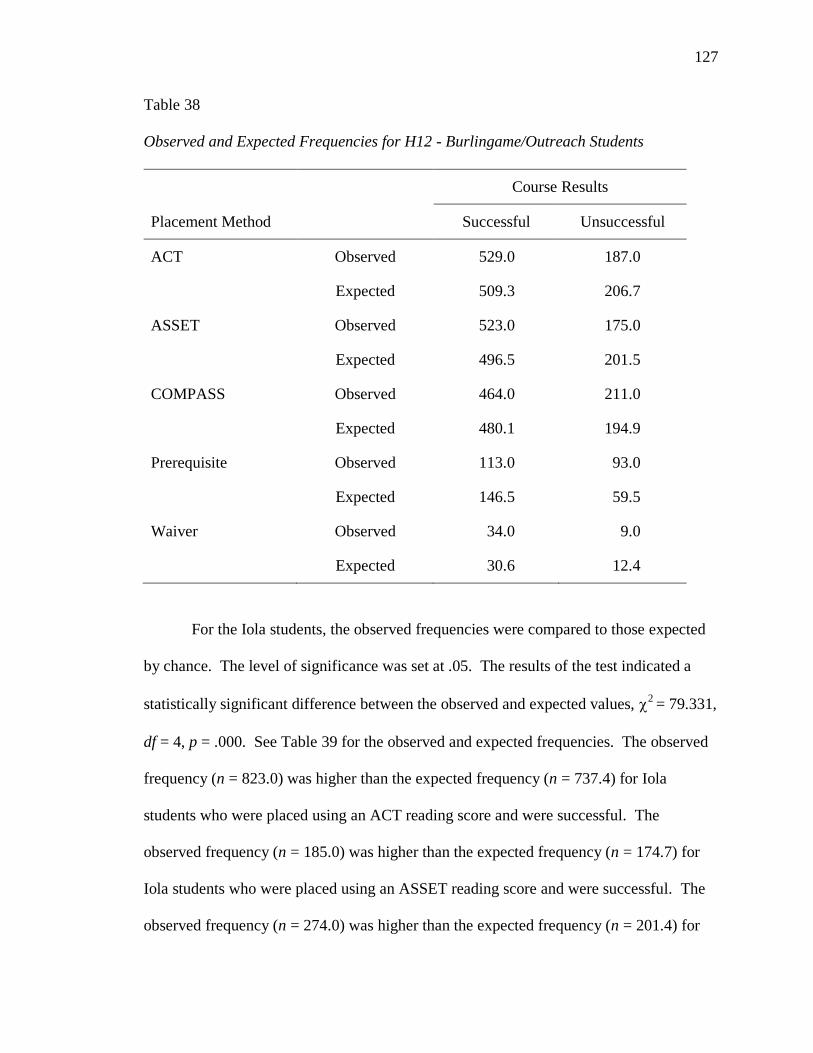
127
Table 38
Observed and Expected Frequencies for H12 - Burlingame/Outreach Students
Course Results
Placement Method Successful Unsuccessful
ACT Observed 529.0 187.0
Expected 509.3 206.7
ASSET Observed 523.0 175.0
Expected 496.5 201.5
COMPASS Observed 464.0 211.0
Expected 480.1 194.9
Prerequisite Observed 113.0 93.0
Expected 146.5 59.5
Waiver Observed 34.0 9.0
Expected 30.6 12.4
For the Iola students, the observed frequencies were compared to those expected
by chance. The level of significance was set at .05. The results of the test indicated a
statistically significant difference between the observed and expected values, 2
= 79.331,
df = 4, p = .000. See Table 39 for the observed and expected frequencies. The observed
frequency (n = 823.0) was higher than the expected frequency (n = 737.4) for Iola
students who were placed using an ACT reading score and were successful. The
observed frequency (n = 185.0) was higher than the expected frequency (n = 174.7) for
Iola students who were placed using an ASSET reading score and were successful. The
observed frequency (n = 274.0) was higher than the expected frequency (n = 201.4) for
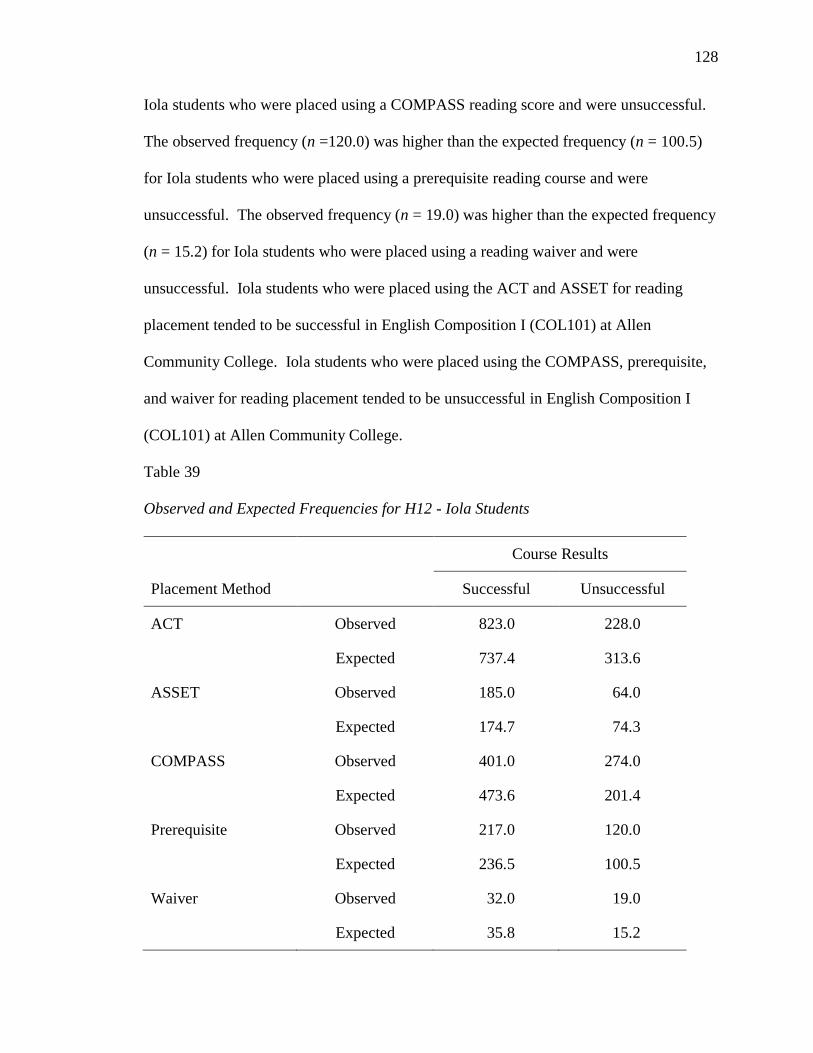
128
Iola students who were placed using a COMPASS reading score and were unsuccessful.
The observed frequency (n =120.0) was higher than the expected frequency (n = 100.5)
for Iola students who were placed using a prerequisite reading course and were
unsuccessful. The observed frequency (n = 19.0) was higher than the expected frequency
(n = 15.2) for Iola students who were placed using a reading waiver and were
unsuccessful. Iola students who were placed using the ACT and ASSET for reading
placement tended to be successful in English Composition I (COL101) at Allen
Community College. Iola students who were placed using the COMPASS, prerequisite,
and waiver for reading placement tended to be unsuccessful in English Composition I
(COL101) at Allen Community College.
Table 39
Observed and Expected Frequencies for H12 - Iola Students
Course Results
Placement Method Successful Unsuccessful
ACT Observed 823.0 228.0
Expected 737.4 313.6
ASSET Observed 185.0 64.0
Expected 174.7 74.3
COMPASS Observed 401.0 274.0
Expected 473.6 201.4
Prerequisite Observed 217.0 120.0
Expected 236.5 100.5
Waiver Observed 32.0 19.0
Expected 35.8 15.2
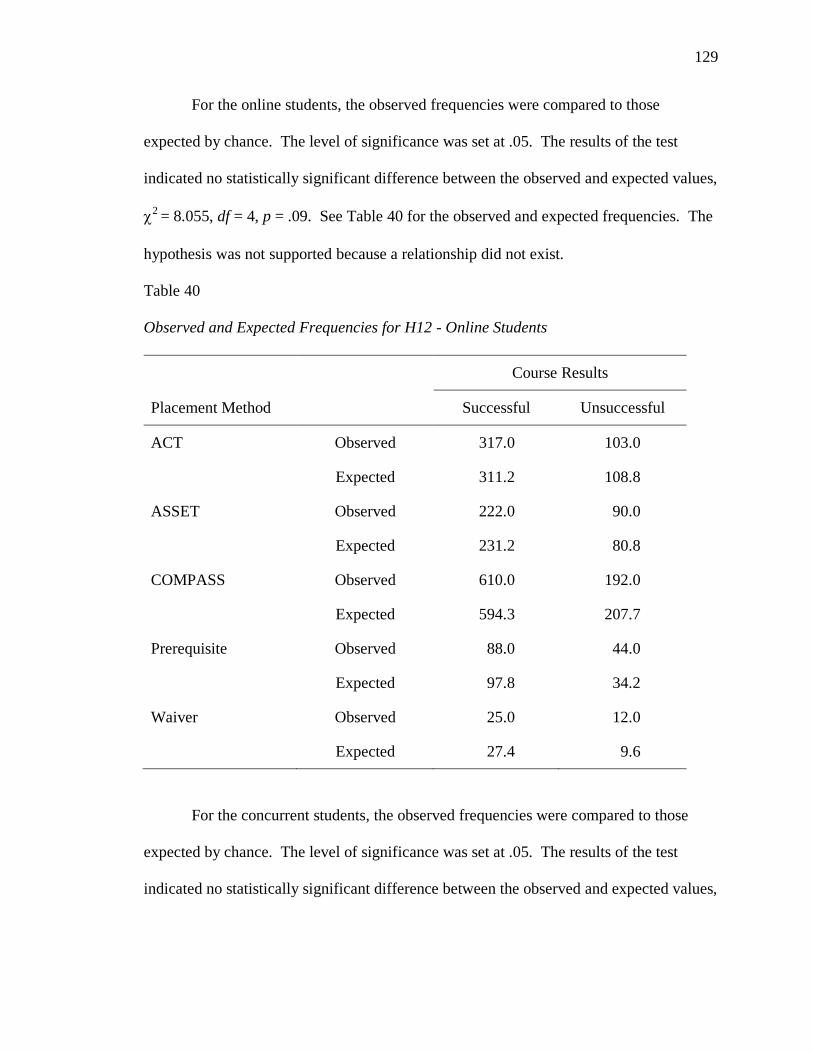
129
For the online students, the observed frequencies were compared to those
expected by chance. The level of significance was set at .05. The results of the test
indicated no statistically significant difference between the observed and expected values,
2
= 8.055, df = 4, p = .09. See Table 40 for the observed and expected frequencies. The
hypothesis was not supported because a relationship did not exist.
Table 40
Observed and Expected Frequencies for H12 - Online Students
Course Results
Placement Method Successful Unsuccessful
ACT Observed 317.0 103.0
Expected 311.2 108.8
ASSET Observed 222.0 90.0
Expected 231.2 80.8
COMPASS Observed 610.0 192.0
Expected 594.3 207.7
Prerequisite Observed 88.0 44.0
Expected 97.8 34.2
Waiver Observed 25.0 12.0
Expected 27.4 9.6
For the concurrent students, the observed frequencies were compared to those
expected by chance. The level of significance was set at .05. The results of the test
indicated no statistically significant difference between the observed and expected values,

130
2
= .862, df = 4, p = .93. See Table 41 for the observed and expected frequencies.
Relationships and success varied based on the method of delivery.
Table 41
Observed and Expected Frequencies for H12 - Concurrent Students
Course Results
Placement Method Successful Unsuccessful
ACT Observed 615.0 17.0
Expected 617.4 14.6
ASSET Observed 1,436.0 33.0
Expected 1,435.1 33.9
COMPASS Observed 272.0 5.0
Expected 270.6 6.4
Prerequisite Observed 2.0 0
Expected 2.0 0
Waiver Observed 3.0 0
Expected 2.9 .1
The hypothesis that method of delivery affected success was supported.
Burlingame/Outreach students who were placed using the ACT, ASSET, and waiver for
reading placement tended to be successful in English Composition I (COL101) at Allen
Community College. Burlingame/Outreach students who were placed using the
COMPASS and prerequisite for reading placement tended to be unsuccessful in English
Composition I (COL101) at Allen Community College. Iola students who were placed
using the ACT and ASSET for reading placement tended to be successful in English
131
Composition I (COL101) at Allen Community College. Iola students who were placed
using the COMPASS, prerequisite, and waiver for reading placement tended to be
unsuccessful in English Composition I (COL101) at Allen Community College. For
online and concurrent students, no statistically significant relationship existed.
Summary
Descriptive statistics were presented. The hypotheses presented in Chapter three
of this study were tested using multiple 2 tests of independence. The significance level
for each test was set at .05. Chapter five includes interpretation of the research findings
and recommendations for further study. The study summary includes a review of the
overview of the problem, purpose statement and research questions, review of
methodology, and major findings. Findings related to the literature are discussed. The
conclusion includes implications for action, recommendations for future research, and
concluding remarks.

132
Chapter Five
Interpretation and Recommendations
The community college is the open door to education in that these
institutions welcome a variety of students. Each year, as part of the admissions
process, millions of students take placement tests in two-year colleges across the
United States. Colleges use the results of the placement tests to determine student
preparedness for college-level coursework. Students who are placed into
developmental courses often struggle to complete a degree or certificate at the
community college (Strong American Schools, 2008). Completion has become a
subject of national interest, and the efficacy of placement testing is a popular topic
for discussion. In this chapter, a summary of the study, an overview of the
research problem, the purpose statement and research questions used in the study,
the methodology used in the study, and major findings are provided. This chapter
also includes a discussion of the findings related to literature, conclusions,
implications for action, recommendations for further research, and concluding
remarks.
Study Summary
Colleges often employ mandatory placement policies because accurately placing
students affects student ability to succeed in coursework. Colleges are under great
pressure to increase certificate and degree completion. A variety of methods is used to
place students. This study provides evidence that there is a relationship between student
success and method of placement.

133
Overview of the problem. Each year students take placement tests as part of the
admissions process at community colleges. The results of placement tests have caused
both the under and over placement of students. Students who are placed in courses that
are too difficult may fail the course or fail to persist. Students who are placed in
developmental courses often fail to complete their college goals. Delayed completion is
also costly for students. Allen Community College is considering placement policy
changes. Information about the ability of each test to predict student success is an
important consideration for the college and its students.
Purpose statement and research questions. The purpose of this study was to
determine whether a relationship exists between methods of placement and student
success in College Algebra (MAT105) and English Composition I (COL101) at Allen
Community College. The second purpose of the study was to investigate the relationship
between method of placement and success with regard to age, gender, and course
delivery mode. Twelve research questions were addressed in this study.
Review of the methodology. This quantitative research study involved a sample
of students who earned a grade in College Algebra (MAT105) or English Composition I
(COL101) for the first time at Allen Community College between Spring 2003 and
Summer 2013. Placement methods in the study included the ACT math, writing, and
reading tests; the ASSET intermediate algebra, writing, and reading tests; the COMPASS
algebra, writing, and reading tests; prerequisite courses in Intermediate Algebra, Pre-
Composition, and Intermediate Reading; and waivers for math, writing, and reading.
Using 2 tests of independence, each method of placement was analyzed for a
relationship with student success. Also, multiple 2 tests of independence were used to

134
determine if a statistically significant relationship existed between age, gender, and
method of delivery and student success for each method of placement.
Major findings. A statistically significant relationship existed between the
method used to place a student in College Algebra (MAT105) and success in the math
dataset. A statistically significant relationship also existed between the method used to
place a student in English Composition I (COL101) for both reading and writing and
student success in the composition dataset. Demographics such as age, gender and the
method of course delivery affected some of the relationships.
In the math dataset, students who were placed in College Algebra (MAT105)
using the ACT tended to be successful, and most students who were placed in College
Algebra (MAT105) using the ASSET tended to be successful. Students who were placed
in College Algebra (MAT105) using the COMPASS, prerequisite course, or waiver
tended to be unsuccessful. Some exceptions occurred when the data was disaggregated
by age and method of course delivery. No relationship existed between the method of
course placement and success for non-traditional students. The method of course
delivery affected the relationship. No relationship existed between the method of
placement and success for Burlingame/Outreach students. Online students who were
placed in College Algebra (MAT105) using the ASSET tended to be
unsuccessful. Concurrent students who were placed in College Algebra (MAT105) using
the ASSET tended to be unsuccessful. Online students who were placed in College
Algebra (MAT105) using the COMPASS tended to be successful. Concurrent students
who were placed in College Algebra (MAT105) using the COMPASS tended to be

135
successful. Gender did not affect the relationship. The same methods of placement
tended to lead to student success regardless of gender.
In the composition dataset, a statistically significant relationship existed between
the method of placement and student success. Students who were placed in English
Composition I (COL101) using the ACT for writing tended to be successful and most
students who were placed in English Composition I (COL101) using the ASSET writing
test tended to be successful. Students who were placed in English Composition I
(COL101) using the COMPASS writing test, prerequisite course, or waiver tended to be
unsuccessful. Some exceptions occurred when the data was disaggregated by age and
method of course delivery. No relationship existed between the method of course
placement and success for non-traditional students. The method of course delivery also
affected the relationship. No relationship existed between the method of placement and
success for concurrent students. Online students who were placed in English
Composition I (COL101) using the ASSET writing test tended to be
unsuccessful. Online students who were placed in English Composition I (COL101)
using the COMPASS writing test tended to be successful. Gender did not affect the
relationship except for female students who were placed in English Composition I
(COL101) using a waiver who tended to be successful. Burlingame/Outreach students
and online students who were placed in English Composition I (COL101) for writing
using a waiver also tended to be successful whereas most Iola students and all students
did not tend to be successful when placed in English Composition I (COL101) using a
writing waiver.

136
In the composition dataset, a statistically significant relationship existed between
the method of placement for reading and student success. Students who were placed in
English Composition I (COL101) using the ACT reading test tended to be successful, and
most students who were placed in English Composition I (COL101) using the ASSET
reading test tended to be successful. Students who were placed in English Composition I
(COL101) using the COMPASS reading test, prerequisite course, or waiver tended to be
unsuccessful. Some exceptions occurred when the data was disaggregated by age and
method of course delivery. No relationship existed between the method of course
placement and success for non-traditional students. The method of course delivery also
affected the relationship. No relationship existed between the method of placement and
success for online or concurrent students. No students who were placed in English
Composition I (COL101) using the COMPASS reading test tended to be successful. No
students who were placed in English Composition I (COL101) using the prerequisite
course tended to be successful. Of those students receiving waivers, only
Burlingame/Outreach students placed using a waiver for the reading test tended to be
successful. Gender did not affect the relationship. The same methods of placement
tended to lead to student success regardless of gender.
Findings Related to the Literature
Placement testing is controversial but can predict success. Ledermen, Ribaudo,
and Ryzewic (1985) reported that most schools used placement testing and few used
other measures. Armstrong (2001) found a significant relationship between course
grades in math and English and placement tests. The results of this study discovered a
significant relationship existed between success in math and English and method of

137
placement. Jenkins et al. (2009) found that while placement tests in reading and writing
did not predict success, math placement tests did predict success. The results of this
study partially support Jenkins et al. (2009) in that the method of placement for math did
predict success. The results of this study disagree with Jenkins et al. (2009) in that
method of placement in reading and writing predicted success at Allen Community
College. Jenkins et al. (2009) found that placement tests did not predict success in
reading and writing. Wattenbarger and McLeod (1989) found a low correlation between
math course grades and test scores. This study supports Wattenbarger and McLeod
(1989) in that a relationship existed between the method of placement and success;
however, this study did not look at specific course grades. Michael and Shaffer (1978)
determined placement did not predict grades. The results of this study indicated a
statistically significant relationship existed between success, which was based on course
grades, and method of placement in College Algebra (MAT105) and English
Composition I (COL101).
The ACT, which is used by many institutions for placement, has mixed results for
student success. Fowler and Ross (1982) found that the ACT was a predictor of success.
Sawyer (1996) found the ACT math test was a stronger predictor of student success than
a locally created test but results varied depending on the definition of success. Naumann
et al. (2003) found the ACT was a valid predictor of success. Hutson (1999) also found a
relationship, although weak, between ACT and course grades. The results of this study
supported Fowler and Ross (1982), Sawyer (1996), Naumann et al. (2003), and Hutson
(1999) in that students who were placed using the ACT math test tended to be successful
in College Algebra (MAT105) at Allen Community College. Long (2003) reported no

138
relationship between the ACT and success in math. The results of this study disagree
with Long (2003). Donovan and Wheland (2008) found a relationship between the ACT
and success in Intermediate Algebra. They also found that the ACT was a stronger
predictor for males than females. In this study, when analyzing success in College
Algebra, a relationship was found between the method of course placement using the
ACT math score and student success. At Allen Community College, no difference
existed when the data was disaggregated by gender for placement using the ACT.
The ASSET exam may or may not predict success. Unlike this study, Gabe
(1989) determined ASSET was not a predictor of success. Hughes and Nelson (1991)
determined that ASSET was a weak predictor of success in English Composition. In this
study, students placed using the ASSET tended to be successful in English Composition I
(COL101) which supports the results of Hughes and Nelson. Krol (1993) found that
ASSET was a predictor of success in English. The results of this study agree with Krol
(1993). Shaw (1997) determined that students placed by ASSET had higher success than
those self-placed and no difference in placement and success based on gender. The
results of this study support that students placed using the ASSET tended to be successful
but did not make a comparison to students who self-placed because self-placement is not
a part of Allen Community College’s placement policy. Hartl (1997) also found a
relationship between placement scores and mathematics grades. The results of this study
support the results of Hartl (1997) in that a relationship existed between the use of the
ASSET for placement and success in mathematics. Waycaster (2004) looked at the
ASSET and COMPASS and how they related to success in mathematics. Waycaster
found the ASSET was a predictor of success in mathematics, but COMPASS was not a
139
predictor of success in mathematics. The results of this study support Waycaster (2004)
in that students who were placed using the ASSET tended to be successful in College
Algebra (MAT105) at Allen Community College and students who were placed using
COMPASS, with the exception of online and concurrent students, tended to be
unsuccessful.
The COMPASS exam predicted success with mixed results. Colvin (2014) found
that the COMPASS did predict success in mathematics. Colvin found that students who
completed a prerequisite course were less likely to be successful in math than those
placed using an ACT or COMPASS score. Additionally, COMPASS was more accurate
in predicting success than the ACT, but both were good indicators. The results of this
study support Colvin (2014) in that the COMPASS tended to lead to student success in
math for online and concurrent students but completion of the pre-requisite did not tend
to lead to success in math. Belfield and Crosta (2012) determined that COMPASS was
not a predictor of success. The results of this study partially support the findings of
Colvin (2014), Belfield and Crosta (2012), and Barr et al. (2002) because the COMPASS
was not generally a predictor of success. Two exceptions for which the COMPASS was
a predictor of success were online students and concurrent students. Self (2010) found a
relationship between COMPASS and success for students in College Algebra. The
results of this study partially support the results found by Self (2010) in that the
COMPASS was a predictor of success for online and concurrent students in College
Algebra (MAT105). Owens (2005) found that COMPASS was an accurate predictor of
success in writing. The results of this study indicated that the COMPASS was a predictor
of success in writing but only for online students. Long (2003) found no relationship

140
between the COMPASS and math success. The results of this study disagree with Long
(2003) as online and concurrent students who were placed using COMPASS tended to be
successful at Allen Community College. Barr et al. (2002) determined that no
relationship existed between test scores and success in reading, writing, and math. This
study disagrees with Barr et al. (2002) as a relationship exists between test scores and
success for math, writing, and reading at Allen Community College.
Prerequisite courses are not always predictive of student success. Jenkins et al.
(2009) determined completion of a prerequisite had no impact on success. Colvin (2014)
also found that students completing a prerequisite course were less likely to succeed than
those who did not complete a prerequisite course. The results of this study support
Jenkins et al. (2009) and Colvin (2014) in that completion of a prerequisite course did not
predict success for any student.
Conclusions
Allen Community College has had a mandatory placement policy since 2002.
This study utilized 2 tests of independence to determine if a relationship existed between
student success and the method of course placement. Students placed using the ACT and
the ASSET appeared to be successful; however, these methods of placement did not lead
to success for non-traditional and concurrent students. No method of placement tended to
lead to success for non-traditional and concurrent students with the exception of
concurrent math students who were placed using the COMPASS or ACT. While a
statistically significant relationship existed between the method of course placement and
success for most students except non-traditional and concurrent students, the method of
course placement was generally not predictive of success in that students placed using the

141
COMPASS, pre-requisite course, and waiver tended to be unsuccessful with some
exceptions. These results indicated that the method of placement needs to be revised and
strengthened at Allen Community College.
Implications for action. The results showed a relationship between the method of
placement and student success and the effect of age, gender, and method of course
delivery on success. Allen Community College is in the process of revising its placement
policy. The results of this study indicated the ACT should continue to be used as a
method of placement for math, writing, and reading. Waivers for math and reading
placement should rarely be granted. Waivers for writing placement were more likely to
lead to student success but should also rarely be granted because students with waivers
tended to be unsuccessful. Since the prerequisite course is not as likely to lead to success
as chance, the curriculum should be reviewed and aligned so that students learn the skills
necessary to succeed in the college-level course in the prerequisite course. Another
possible solution might be to require a higher score in the prerequisite course before a
student is allowed to take the college-level course. For example, perhaps students should
earn a B or higher in Intermediate Algebra (MAT020) before being allowed to take
College Algebra (MAT105). Allen Community College would benefit from considering
additional methods of placement such as grade point average in high school or college,
state assessment test scores, or measures of non-cognitive factors. Non-cognitive factors
include motivation, family support, time available for study, self-efficacy, and time
management skills. Allen Community College could also change its placement policy to
include multiple measures rather than reliance on a single placement test for placement.
Morante (1989) advocated the use of multiple measures for placement.

142
Allen Community College might decide to discontinue the use of placement tests
for one or more groups of students. Since placements tests have no relationship with
success for non-traditional students, alternate methods might be used instead for this
group. Since placement tests are rarely predictive of success for concurrent students,
Allen Community College could reduce costs, the workload for staff, and the amount of
testing required for high school students by using a state assessment or other criteria for
placement.
Allen Community College could follow best practices concerning placement
testing. Student Services should provide information to students about placement tests
before students test including the repercussions placement can have for students. Allen
Community College should also provide a retest procedure as part of its placement
policy. Students should be encouraged to prepare for the placement exam and be
provided with preparation materials. Allen Community College could encourage
students to test over time rather than all on one day to decrease the possible impact of test
fatigue.
Recommendations for future research. The relationship between the success of
students and methods of placement in College Algebra (MAT105) and English
Composition I (COL101) at Allen Community College was analyzed in this study.
Additionally, whether age, gender, and method of delivery affected success in these two
courses at Allen Community College was determined. The results of this study indicated
a need for further research to determine methods of placement that will increase the
likelihood of student success in College Algebra (MAT105) and English Composition I
(COL101) at Allen Community College.

143
This study examined quantitative data. While a placement test provides a
snapshot of student ability in a subject, it does not provide insight into non-cognitive
aspects that can affect success (Saxon and Morante, 2014). A study could be conducted
using quantitative and qualitative data related to student success. Interviews with
students would provide insight into non-cognitive factors such as work requirements,
family requirements, and study habits.
Student attitudes toward and preparation for placement testing could be
researched by surveying students. Studies conducted by the Community College
Research Center at Columbia University found that placement tests are high stakes
events, and students do not understand the importance of these tests. Students often do
not prepare for these tests and do not exert maximum effort (Hodara et al., 2012).
Allen Community College could conduct a study that compared student success to
scores on the placement tests. By comparing grades to cut-scores, the college could
determine the ideal cut-score for placement in math and English at Allen Community
College. By changing the cut-scores necessary for enrollment, students who are most
likely to succeed could be enrolled in college-level coursework while students who
needed remediation could be enrolled in development coursework.
A more accurate method of placement for concurrent students could be
researched. Studies conducted by the University of Kansas indicate that state assessment
test scores can be used for placement. Other methods such as an institutionally
developed test could also be considered to place this group of students more effectively.
Some studies have also shown high school GPA to be a predictor of success. Data could

144
be harvested from the high schools and student information system to determine if these
methods of placement predict success.
A study could be conducted to determine which skills needed in College Algebra
(MAT105) are not being mastered in Intermediate Algebra (MAT020). The curriculum
of Intermediate Algebra (MAT020) could be reworked to focus more on the skills needed
for success in College Algebra (MAT020). Greater alignment between the skills taught
in the prerequisite course should benefit students taking the college-level course.
Multiple measures can be used for placement rather than a single measure. A
study could examine the effect of high school grade point average (GPA) or high school
preparation on student success when used in combination with placement test scores.
Studies have shown that multiple measures are more effective in placing students than a
placement test score alone (Lagunoff et al., 2012).
Concluding remarks. Community college students struggle to complete
programs. According to Snyder and Dillow, (2012), only 27.5% of first-time, full-time
degree or certificate-seeking students at community colleges complete their programs
within 150% of the time required in 2005. In 2009, President Obama challenged colleges
to increase degree and certificate completion to the highest level in the world by 2020
(The White House, 2009). The Kansas Board of Regents, in Foresight 2020, have asked
colleges to increase the number of Kansas with certificates, associate's degrees, or
bachelor's degrees to 60% by 2020 (KBOR, 2015). Earning a degree requires students to
complete required courses such as College Algebra (MAT105) and English Composition
I (COL101) successfully. Success in these courses is related to accurate placement.
Nationwide, 42% of first-time undergraduates in public two-year colleges took at least

145
one remedial course (U.S. Department of Education, 2011). Placement tests create
situations where students are under placed in courses that are too easy and over placed in
courses that too difficult. An accurate placement policy is necessary for student success.
The results of this study provide evidence that the placement policy at Allen Community
College includes elements that predict student success and elements that do not. It is
necessary for Allen Community College to revise and strengthen its placement policy so
that it more accurately predicts student success. Continued research on placement will
benefit the students and higher education.

146
References
Abraham, A. A., and Southern Regional Education Board (1991). They came to college?
A remedial/developmental profile of first-time freshmen in SREB states. Issues in
Higher Education, 25. Retrieved from ERIC database. (ED333783)
ACT. (2009). ASSET technical manual. Retrieved from
http://www.act.org/asset/tests/index.html
ACT. (2010). The condition of college and career readiness 2010. Retrieved from
http://www.act.org/research/policymakers/cccr10/
ACT. (2012). COMPASS reference manual. Retrieved from
http://www.act.org/compass/tests/index.html
ACT. (2014). ACT technical manual. Retrieved from
http://www.act.org/ACT/tests/index.html
ACT. (2015). ASSET. Retrieved from http://www.act.org/asset/
Adelman, C. (1996). The truth about remedial work: It's more complex than windy
rhetoric and simple solutions suggest. The Chronicle of Higher Education, 43(6),
56
Adelman, C. (2005). Moving into town-and moving on: The community college in the
lives of traditional–age students. U.S. Department of Education. Retrieved from
http://www2.ed.gov/rschstat/research/pubs/comcollege/index.html?exp=0
Akst, G., & Hirsch, L. (1991). Selected studies on math placement. Review of Research
in Developmental Education, 8(4). Retrieved from ERIC database (ED35494)
Aliaga, M., & Gunderson, B. (2002). Interactive statistics. (2nd ed.). New York, NY:
Prentice Hall.
147
Allen Community College (2012). 2012-2013 catalog. Retrieved from
http://www.allencc.edu/academics
Allen Community College. (2014). History of Allen. Retrieved from
http://www.allencc.edu/index.php/about-allen/history-of-allen
Allen Community College. (2015). Homepage. Retrieved from http://www.allencc.edu/
American Association of Community Colleges. (2012). Fast facts. Retrieved from
http://www.aacc.nche.edu/AboutCC/Pages/fastfacts.aspx.
Arkansas Department of Higher Education. (n.d.). 2003–04 Arkansas academic cost
accounting system: A strategic management tool for higher education planning
and campus decision-making. Little Rock, AR.: Author. Retrieved from
http://iifs.adhe.edu/if/UR/CostAccounting2003-04.pdf
Armstrong, W. (2000). The association among student success in courses, placement test
scores, student background data, and instructor grading practices. Community
College Journal of Research and Practice, 24(8), 681-695.
Armstrong, W. (2001). Explaining student course outcomes by analyzing placement test
scores, student background data, and instructor effects. (Report No. JC-010-495).
San Diego, CA.: University of California. Retrieved from ERIC database.
(ED454907)
Attewell, P., Lavin, D., Domina, T., & Levey, T. (2006). New evidence on college
remediation. Journal of Higher Education, 77(5), 886-924.

148
Aud, S., Hussar, W., Johnson, F., Kena, G., Roth, E., Manning, E., . . . Zhang, J.(2012).
The condition of education 2012, (NCES Report 2012-045). Washington, DC.
Retrieved from the National Center for Education Statistics website:
http://nces.ed.gov/pubsearch.
Barr, R., & Parker, A. (1989). Mathematics student outcomes study, year three. Final
report. Learning Assessment Retention Consortium of the California Community
Colleges. Retrieved from ERIC database. (ED321782)
Barr, J. E., Rasor, R. A., & Grill, C. (2002) The evaluation of present course placement
procedures using the COMPASS test. Retrieved from ERIC database.
(ED482495)
Beach, J. (2011). Gateway to opportunity? A history of the community college in the
United States. Sterling, VA.: Stylus Publications.
Belfield, C. R., & Crosta, P. M. (2012, February). Predicting success in college: The
importance of placement tests and high school transcripts. (Working Paper No.
42). New York, NY. Retrieved from the Community College Research Center
website: http://ccrc.tc.columbia.edu/media/k2/attachments/predicting-sccuess-
placement-tests-transcripts.pdf
Bennett, W. (1994). The devaluing of America. New York, NY: Touchstone.
Bettinger, E. P., & Long, B. T. (2005). Remediation at the community college: Student
participation and outcomes. New Directions for Community Colleges, 2005(129),
17-26. doi:10.1002/cc.182

149
Bettinger, E. P., & Long, B. T. (2009). Addressing the needs of underprepared students in
higher education: Does college remediation work? Journal of Human Resources,
44(3), 736-771.
Boggs, S., & Shore, M. (2004). Using e-learning platforms for mastery learning in
developmental mathematics courses. Mathematics and Computer Education, 38,
213-220.
Bogue, J. (1950). The community college. New York, NY: McGraw-Hill Book Company,
Inc.
Borst, P. W. (1984). The skills prerequisite system at Fullerton College (a six-year
investment in people). Fullerton, CA: North Orange County Community College
District. Retrieved from ERIC database. (ED255247)
Boylan, H. R. (2002). What works: Research-based best practices in developmental
education. Boone, NC: Continuous Quality Improvement Network with the
National Center for Developmental Education, Appalachian State University.
Brock, T. (2010). Young adults and higher education: Barriers and breakthroughs to
success. Future of Children, 20(1), 109-132.
Calcagno, J. C., & Long, B. T. (2008). The impact of postsecondary remediation using a
regression discontinuity approach: Addressing endogenous sorting and
noncompliance. New York, NY: National Center for Postsecondary Research.
Clark, B. (1960). The ‘cooling-out' function in higher education, The American Journal
of Sociology, 65(6), 569-576.
Cohen, A., & Brawer, F. (1987). The collegiate function of community colleges. San
Francisco, CA: Jossey-Bass.
150
Cohen, A., & Brawer, F. (2008). The American community college. (5th ed.). San
Francisco, CA: John Wiley & Sons, Inc.
Colvin, C. (2014). ACT, COMPASS, or prerequisite course: Which is the better predictor
of student success in a college-level credit mathematics course at Snead State
Community College (Doctoral dissertation, University of Alabama Tuscaloosa).
Retrieved from http://acumen.lib.ua.edu/content/u0015/0000001/0001687/
u0015_0000001_0001687.pdf
Complete College America (2011). Time is the enemy: The surprising truth about why
today's college students aren't graduating... and what needs to change. Retrieved
from http://www.completecollege.org/docs/Time_Is_the_Enemy.pdf
Conlin, S. (1989). Students bypassing remedial work and the effects on subsequent
grades and dropout rate. Retrieved from ERIC database. (ED317240)
Cox, M. A. (1985). California community colleges as providers of remediation. Learning
assessment retention consortium of the California community colleges. Retrieved
from ERIC database. (ED 291446)
Cronbach, L. J. (1971). Test validation. In R.L. Thorndike (Ed) Educational measurement
(2nd ed., pp. 443-507).Washington, DC: American Council on Education.
Day, C. (1997). A predictive validity study of computer adaptive placement tests for
Tennessee higher education institutions. Dissertation Abstracts International:
Section A. Humanities and Social Sciences, 59(7-A), 2464.
Deil-Amen, R., & Rosenbaum, J. E. (2002). The unintended consequences of stigma-free
remediation. Sociology of Education, 75(3), 249-68.
151
Dodson, R. K. (1987). Quality and accessibility: Are they mutually exclusive?
Community College Review, 14(4), 56-60.
Donovan, W. J., & Wheland, E. R. (2008, Winter). Placement tools for developmental
mathematics and intermediate algebra. Journal of Developmental Education,
32(2), 2-11.
Duranczyk, L. M., & Higbee, J. L. (2006). Developmental mathematics in 4-year
institutions: Denying access. Journal of Developmental Education, 30(1), 22-31.
Einspruch, E., & Downing, S. (1990). Entry-level testing results for all credit students
enrolled at Miami-Dade Community College during fall term 1989. Miami-Dade
Community College. Retrieved from ERIC database. (ED328321)
Fain, P. (2012, December 21). Colleges rely heavily on popular remedial placement tests |
InsideHigherEd. Retrieved from https://www.insidehighered.com/news/2012/
12/21/colleges-rely-heavily-popular-remedial-placement-tests
Fields, R., & Parsad, B. (2012). Tests and cut scores used for student placement in
postsecondary education: Fall 2011. Washington, DC.: National Assessment
Governing Board. Retrieved from ERIC database. (ED539918)
Fowler, B. F., & Ross, D. H. (1982). The comparative validities of differential placement
measures for college composition courses. Educational and Psychological
Measurement, 42, 1107-15.
Fulton, M. (2012, May). Using state policies to ensure effective assessment and
placement in remedial education. Denver, CO. Retrieved from the Education
Commission of the States website:
http://www.ecs.org/cleringhouse/0102/238/110228.pdf

152
Gabe, L. C. (1989). Relating college-level course performance to ASSET placement
scores. (Institutional Research Report Abstract RR89022). Retrieved from ERIC
database. (ED309823)
Gillespie, M. (1993). Placement testing in community colleges: A response to Hughes
and Nelson. Community College Review, 20(4), 59.
Grable, J. R. (1988) Remedial education in Texas two-year colleges. Journal of
Developmental Education 12(2), 2-5.
Haase, M. H., & Caffrey, P. (1984). The impact of a coordinated assessment/placement
process on student success and retention: Statistical response to a grant proposal.
Sacramento, CA.: Sacramento City College. Retrieved from ERIC database. (ED
243540)
Hartl, K. D. W. (1997). A study of initial and continued success of students in
mathematics courses at Northeast Iowa Community College as related to scores
on ASSET assessment. Dissertation Abstracts International: 58(8), 3052A.
Harwood, R. (1997). Flunking the grade and nobody notices. The Washington Post, A,
19. Retrieved from http://www.highbeam.com/doc/1P2-736506.html
Hodara, M., Jaggars, S., & Karp, M. (2012, November). Improving developmental
assessment and placement: Lessons from community colleges across the country.
(Working Paper No. 51). New York, NY. Retrieved from the Community College
Research Center website: http://ccrc.tc.columbia.edu/media/k2/
attachments/developmental-education-assessment-placement-scan.pdf

153
Horn, L. J., & Carroll, C. D. (1996). Nontraditional undergraduates: Trends in
enrollment from 1986 to 1992 and persistence and attainment among 1989-90
beginning postsecondary students. Postsecondary education descriptive analysis
reports. (Statistical Analysis Report). Washington, DC. Retrieved from the
National Center for Education Statistics website:
https://nces.ed.gov/pubs/97578.pdf
Hudson, L., Kienzl, G., & Diehl, J. (2007). Students entering and leaving postsecondary
occupational education: 1995-2001. (Statistical Analysis Report. NCES 2007-
041). Washington, DC. Retrieved from the National Center for Education
Statistics website: http://nces.ed.gov/pubs2007/2007041.pdf
Hughes, K. L., & Scott-Clayton, J. (2011). Assessing developmental assessment in
community colleges. (Working Paper No. 19). New York, NY. Retrieved from the
Community College Research Center website: http://ccrc.tc.columbia.edu/media/
k2/attachments/ assessing-developmental-assessment.pdf
Hughes, R. E., & Nelson, C. H. (1991). Placement test scores and placement practices:
An empirical analysis. Community College Review, 19(1), 42-46.
Hutson, T. (1999). An assessment of a mathematics program including the scheme for
placing students into developmental courses. (Doctoral dissertation, University of
Memphis). Retrieved from http://trace.tennessee.edu/cgi/
viewcontent.cgi?article=3861&context=utk_graddiss
Ignash, I. M. (1997). Who should provide postsecondary remedial/developmental
education? New Directions for Community Colleges, 1997(100), 5-20.

154
Isonio, S. (1992). Implementation and initial validation of the NDTP tests at Golden West
College. Huntington Beach, CA.: Golden West College. Retrieved from ERIC
database. (ED345782)
Jaschik, S. (1985). States questioning role of colleges in remedial study. The Chronicle of
Higher Education, 31(2), 1.
Jenkins, D., Jaggars, S., & Roksa, J. (2009, Nov). Promoting gatekeeper course success
among community college students needing remediation. Findings and
recommendations form a Virginia study. (Summary report). New York, NY.:
Community College Research Center. Retrieved from ERIC database.
(ED507824)
Joliet Junior College (2013). History. Retrieved from
http://www.jjc.edu/about/collegeinfo/Pages/history.aspx
Kansas Board of Regents. (2015, May). Foresight 2020 summary overview. Retrieved
from http://www.kansasregents.org/about/foresight_2020
Kansas Board of Regents. (2015, January). Foresight 2020 report. Retrieved from
http://www.kansasregents.org/about/foresight_2020
Karp, M. M., & Bork, R. H. (2012). “They never told me what to expect, so I didn’t know
what to do”: Defining and clarifying the role of the community college student
(CCRC Working Paper No. 47). New York, NY. Retrieved from the Community
College Research Center website: http://ccrc.tc.columbia.edu/publications/
defining-role-community-college-student.html

155
Krol, E. J. (1993). Determining the predictors for student success in achievement in
higher education: A focus on the ASSET (assessment for successful entry and
transfer) and hs gpa (high school grade point average) at Henry Ford Community
College. (Doctoral dissertation). Retrieved from ProQuest Dissertations and
theses database. (UMI No. 9418188)
Lagunoff, R., Michaels, H., Morris, P., & Yeagley, P. (2012, February 3). A framework
for evaluating the technical quality of multiple measures in California community
college placement. San Francisco, CA.: WestEd. Retrieved from
http://extranet.cccco.edu/Portals/1/SSSP/Matriculation/Assessment/CCCCOMulti
pleMeasuresFramework2012.pdf
Lederman, M. J., Ribaudo, M., & Ryzewic, S. R. (1985). Basic skills of entering college
freshmen: A national survey of policies and perceptions. Journal of
Developmental Education, 9(1), 10-13.
Lewis, L., & Farris, E. (1996). Remedial education at higher education institutions in fall
1995 (Statistical Analysis Report). Washington, DC. Retrieved from the National
Center for Education Statistics website: http://nces.ed.gov/pubs2004/2004010.pdf
Linn, R. L. (1990). Admission testing: Recommended uses, validity, differential
prediction and coaching. Applied Measurement in Education, 3(4), 297-318.
Long, W. (2003). Mathematics placement and mathematics achievement in the
community college. Dissertation Abstracts International, 64(05A), 1572.
156
Losak, J. (1982). Retention patterns for full-time first-time in college students based on
basic skills assessment performance. Miami, FL.: Miami-Dade Community
College, Office of Institutional Research. Retrieved from ERIC database.
(ED226784)
Lumina Foundation for Education. (2009). Lumina Foundation’s strategic plan: Goal
2025. Indianapolis, IN: Author. Retrieved from http://www.luminafoundation.org/
wp-content/uploads/2011/02/Lumina_Strategic_Plan.pdf
Lunenburg, F., & Irby, B. (2008). Writing a successful thesis or dissertation: Tips and
strategies for students in the social and behavioral sciences. Thousand Oaks, CA:
Corwin Press.
MacDonald, H. (1997). Substandard. The City Journal, 7(3). Retrieved from
http://www.city-journal.org
MacDonald, H. (1998). CUNY could be great again. The City Journal, 8(1). Retrieved
from http://www.city-journal.org
MacDonald, H. (1999). Room for excellence? The City Journal, 9(4). Retrieved from
http://www.city-journal.org
Marcus, J. (2000). Revamping remedial education, National CrossTalk, 8(1), 1.
Maxwell, M. (1979). Improving student learning skills. San Francisco, CA: Jossey-Bass.
Michael, W. B., & Shaffer, P. (1978). The comparative validity of the California State
University and college English placement test (CSUC-EPT) in the prediction of
fall semester grade point average and English course grades of first-semester
entering freshmen. Educational and Psychological Measurement, 38, 985-1001.

157
Mickler, M. L., & Chapel, A. C. (1989). Basic skills in college: Academic dilution or
solution? Journal of Developmental Education, 13(1), 2-4, 16.
Monroe, C. (1972). Profile of the community college. San Francisco: Jossey-Bass.
Morante, E. A. (1989). Selecting tests and placing students. Journal of Developmental
Education, 13(2), 2-6.
Naumann, W. C., Bandalos, D., & Gutkin, T. B. (2003). Identifying variables that predict
college success for first-generation college students. Journal of College
Admission, 181, 4-9.
Office of Program Policy Analysis and Government Accountability. (2006). Steps can be
taken to reduce remediation rates; 78% of community college students, 10% of
university students need remediation (Report No. 06-40). Retrieved from
http://www.oppaga.state.fl.us/MonitorDocs/Reports/pdf/0640rpt.pdf
Ohio Board of Regents. (2006). Costs and consequences of remedial course enrollment in
Ohio public higher education: Six-year outcomes for fall 1998 cohort. Retrieved
from http://regents.ohio.gov/perfrpt/
special_reports/Remediation_Consequences_2006.pdf
Oromaner, M. (1985). A retention study of entering students in basic skills courses and
students in non-basic skills courses. Hudson, NJ: Hudson County (NJ)
Community College. Retrieved from ERIC database. (ED257537)
Owens, K. (2005). The efficacy of writing course placement at an Iowa community
college. Dissertation Abstracts International, Section A: The Humanities And
Social Sciences, 66(2), 525.

158
Parsad, B., Lewis, L., & Greene, B. (2003). Remedial education at degree-granting
postsecondary institutions in fall 2000 (Report No. NCES 2004-010).
Washington. DC. Retrieved from the National Center for Education Statistics
website: http://nces.ed.gov/pubs2004/2004010.pdf
Perin, D. (2006). Can community colleges protect both access and standards? The
problem of remediation. Teachers College Record, 108(3), 339–373.
Plisko, V. W., & Stern, J. (1985). The condition of education: A statistical report.
Washington, DC: National Center for Education Statistics. Retrieved from ERIC
database. (ED258365)
Primary Research Group, Inc. (2008). Survey of assessment practices in higher
education. New York, NY: Author.
Richardson, R. C., Jr. (1983). Future of the open door: A presentation for ACCT.
Retrieved from ERIC database. (ED235848)
Rosenbaum, J. E. (2011). The complexities of college for all: beyond fairy-tale dreams.
Sociology of Education, 84(2), 113-117.
Roueche, J. E., & Baker, G. A. (1987). Access & excellence: The open door college.
Washington, DC: Community College Press.
Roueche, J. E., Baker, G. A., & Roueche, S. D. (1987). Open door or revolving door?
Open access and the community college. Community Junior and Technical
College Journal, 56(5), 22-26.
Roueche, J. E., & Roueche, S. D. (1999). High stakes, high performance: Making
remedial education work. Washington, D.C.: Community College Press.

159
Rounds, J. C., & Anderson, D. (1985). Placement in remedial college classes: Required
vs. recommended. Community College Review, 13(1), 20-27.
Sawyer, R. (1996). Decision theory models for validating course placement tests. Journal
of Educational Measurement, 33(3), 271–290.
Saxon, D. P., & Morante, E. A. (2014) Effective student assessment and placement:
challenges and recommendations. Journal of Developmental Education, 37(3),
24-31. Retrieved from
http://www.nade.net/site/documents/articles/SaxonMorante_ArticleV37.pdf
Scott-Clayton, J. (2012, February) Do high stakes placement exams predict college
success? (Working Paper No. 41). New York, NY. Retrieved from the
Community College Research Center website: http://ccrc.tc.columbia.edu/
publications/high-stakes-placement-exams-predict.html
Scott-Clayton, J., Crosta, P. M., & Belfield, C. R. (2012, October). Improving the
targeting of treatment: Evidence from college remediation. (Working Paper No.
18457). New York, NY. Retrieved from the National Bureau of Economic
Research website: http://www.nber.org/papers/w18457
Self, M. (2010). Influence of placement on the success of first-time freshmen taking
college algebra in a southeastern Louisiana community college. Dissertation
Abstracts International Section A, 72, 3088.
Shaw, P. (1997) An analysis and evaluation of policies and practices of student
placement into college algebra classes at Paradise Valley Community College.
(Unpublished doctoral dissertation) Nova Southeastern University, Fort
Lauderdale-Davie, FL.

160
Shaw, P. (1961). Development in and through reading: 60th yearbook of the national
society for the study of education, art 1. Chicago, IL: University of Chicago.
Snyder, T. D., & Dillow, S. A. (2012). Digest of education statistics 2011. Washington,
DC. Retrieved from the National Center for Education Statistics website:
http://nces.ed.gov/pubs2012/2012001.pdf
Sworder, S. (1990). An analysis of the relationship between student success and delayed
entry into the mathematics curriculum following completion of the matriculation
process at Saddleback College. Retrieved from ERIC database. (ED318514)
Traub, J. (1995). City on a hill: Testing the American dream at City College. New York,
NY: Perseus. Retrieved from http://www.broadeducation.org/asset/1128-
diploma%20to%20nowhere.pdf
Traub, J. (2008). Diploma to nowhere. Washington, DC: Strong American Schools.
Retrieved from the US Department of Education website:
http://www.ed.gov/college-completion/governing-win
Trombley, W. (1998). Remedial education under attack. National CrossTalk, (6)3, 1.
U.S. Department of Education. (2011). College completion tool kit. Washington, DC:
author. Retrieved from http://www.ed.gov/college-completion/governing-win
U.S. Department of Education. (1988). National education longitudinal study, 1988.
Chicago, IL. Retrieved from the National Center for Education Statistics website:
https://nces.ed.gov/Pressrelease/usefedstats.asp
Venezia, A., Bracco, K. R., & Nodine, T. (2010). One shot deal? Students’ perceptions of
assessment and course placement in California’s community colleges. San
Francisco, CA: WestEd.

161
Wattenbarger, J. L., & McLeod, N. (1989). Placement in the mathematics curriculum:
What are the keys? Community College Review 16(4), 17-21.
Waycaster, P. (2004). The best predictors of success in developmental mathematics
courses. Inquiry, 9(1), 1-8.
Weber, J. (1986). Assessment and placement: A review of the research. Community
College Review, 13(3), 21-32.
Wechsler, H. S. (1977). The qualified student: A history of selective college admissions in
America. New York, NY: John Wiley & Sons.
The White House, Office of the Press Secretary. (2009, February 24). Presidential
address to joint session of Congress. Retrieved from
http://www.whitehouse.gov/the_press_office/Remarks-of-President-Barack-
Obama-Address-to-Joint-Session-of-Congress/
Wirt, J., Choy, S., Gruner, A., Sable, J., Tobin, R., Bae, Y.... Pratt, R. (2000). The
condition of education, 2000. National Center for Education Statistics.
Washington, DC: National Center for Education Statistics. Retrieved from
http://nces.ed.gov/pubs2000/2000062.pdf
Woodham, F. (1998, December 11). Report says remedial classes are cost effective.
Chronicle of Higher Education, A53.
Young, K. M. (2002). Retaining underprepared students enrolled in remedial courses at
the community college. Information Analyses, 1-24. Retrieved from ERIC
database. (ED467850)

162
Zeidenberg, M., & Bailey, T., (2010). Human resource development and career and
technical education in American community colleges. New York, NY:
Community College Resource Center. Retrieved from
http://ccrc.tc.columbia.edu/media/k2/attachments/human-resource-development-
career-technical-education.pdf
Zieky, M. & Perie, M. (2004) A primer on setting cut scores on tests of educational
achievement. Princeton, NJ: Educational Testing Service. Retrieved from
https://www.ets.org/Media/Research/pdf/Cut_Scores_Primer.pdf

163
Appendices

164
Appendix A: Baker University IRB Request

165
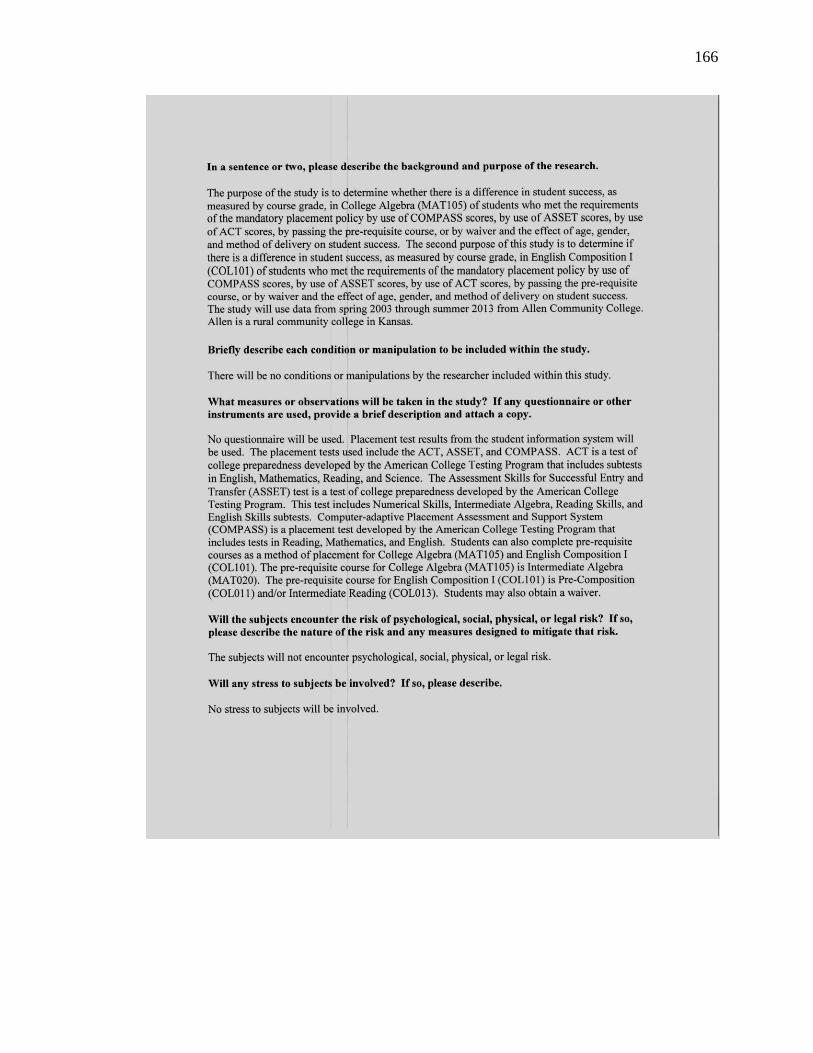
166

167

168

169
Appendix B: Baker University IRB Letter of Approval

170
171
Appendix C: Allen Community College Letter of Approval
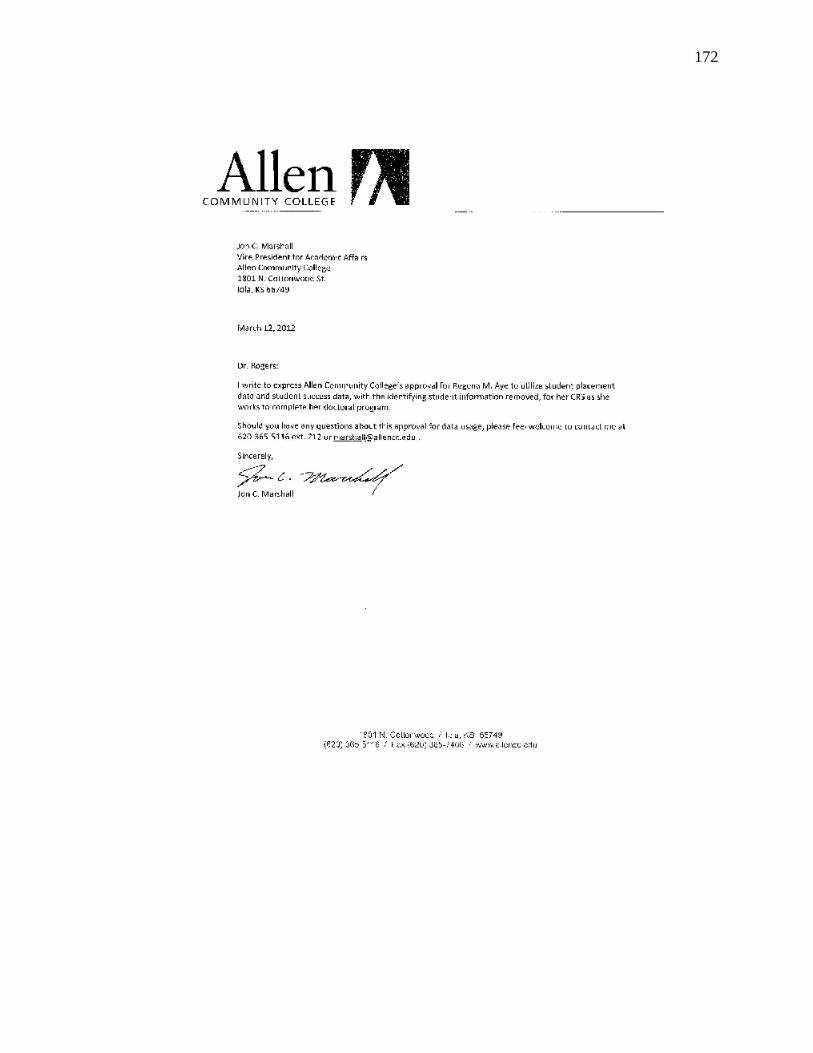
172