The relationship between government expenditure and GDP in ...
26
The relationship between … Hasan Radhi 46 | Journal of the Arab American University. Volume (4). Number (2) /2018 The relationship between government expenditure and GDP in non- oil Iraqi economy Hasan Radhi Baghdad - College niversity U Dijlah , Department Banking and Finance [email protected] Abstract In this paper, the relationship between government ependiture and Gross Domestic Product (GDP) in non-oil Iraqi economy has been examined. This study analyzed the evolution of the government expenditure (consumption and investment) in the Iraqi economy for the period of (1990-2014).It is assumed that non-oil GDP is the indicator that reflects the performance of macroeconomic activity and any decline in GDP is attributed to the increase in the consumer behavior in the government expenditure policy , the proportion of the consumer expenditure,which is financed by oil revenues, and the transformation of state institutions into social security institutions at the expense of investment expenditure. This, in turn, will be clearly reflected in the exacerbating problem of the structural imbalance with the trends of government expenditure, which is not conducive to the development of the production sector. Consequently, the economy will not be able to fulfill the total demand. This study analyzed the development of the government expenditure (consumption and investment) in the Iraqi economy for the period of (1990-2014). In addition, the failure or success of the government expenditure policy in the promotion of GDP was invistigated. The Autoregressive Distributed Lag (ARDL) model was used to measure the effect of the government consumption and investment expenditure on non-oil GDP. As a result, it was found out that there is a significant relationship between consumption expenditure and non-oil GDP in the long and short runs. However, there was no positive effect of investment expenditure on the output of Non-oil GDP in the short run. Additionally, the research has come up with a range of conclusions, including that investment had a weak impact on the growth and stimulation of non-oil production sectors in the period before 2003 and the subsequent period. The research recommended that government expenditure should lead to activities that increase the productivity of the economy. Keywords: government consumption expenditure, government investment expenditure, non-oil GDP, ARDL model, non-oil revenue.
Transcript of The relationship between government expenditure and GDP in ...

The relationship between … Hasan Radhi
46| Journal of the Arab American University. Volume (4). Number (2) /2018
The relationship between government expenditure and GDP in non-
oil Iraqi economy
Hasan Radhi
Baghdad-College niversityU Dijlah, Department Banking and Finance
Abstract
In this paper, the relationship between government ependiture and Gross Domestic Product (GDP) in non-oil
Iraqi economy has been examined. This study analyzed the evolution of the government expenditure (consumption
and investment) in the Iraqi economy for the period of (1990-2014).It is assumed that non-oil GDP is the indicator
that reflects the performance of macroeconomic activity and any decline in GDP is attributed to the increase in the
consumer behavior in the government expenditure policy , the proportion of the consumer expenditure,which is
financed by oil revenues, and the transformation of state institutions into social security institutions at the expense of
investment expenditure. This, in turn, will be clearly reflected in the exacerbating problem of the structural
imbalance with the trends of government expenditure, which is not conducive to the development of the production
sector. Consequently, the economy will not be able to fulfill the total demand. This study analyzed the development of
the government expenditure (consumption and investment) in the Iraqi economy for the period of (1990-2014). In
addition, the failure or success of the government expenditure policy in the promotion of GDP was invistigated. The
Autoregressive Distributed Lag (ARDL) model was used to measure the effect of the government consumption and
investment expenditure on non-oil GDP. As a result, it was found out that there is a significant relationship between
consumption expenditure and non-oil GDP in the long and short runs. However, there was no positive effect of
investment expenditure on the output of Non-oil GDP in the short run. Additionally, the research has come up with a
range of conclusions, including that investment had a weak impact on the growth and stimulation of non-oil
production sectors in the period before 2003 and the subsequent period. The research recommended that
government expenditure should lead to activities that increase the productivity of the economy.
Keywords: government consumption expenditure, government investment expenditure, non-oil GDP, ARDL model,
non-oil revenue.

The relationship between … Hasan Radhi
47| Journal of the Arab American University. Volume (4). Number (2) /2018
Introduction
The policy of expenditure is the set of government measures, which aim to create the desired
economic changes. Accordingly, the countries ' policies at different levels of progress play a
major role in reaching their goals and the efficiency of macroeconomic performance has been
dependent on those policies, too.
For the Iraqi economy, it has inherited the cumulative problems of two decades of wars and
embargoes, which ended with the destruction of its infrastructure, the depletion of foreign
reserves and the accumulation of foreign debts. Therefore, the monetary authority is responsible
for financing the government expenditure to contribute and maintain a certain level of
consumption by rationing and supplying the ration cards and the promotion of inflation trends.
The financial facilitation of the oil boom after 2003 has created a cushion for the relaxation of the
sectors of economy. This was achieved through budgets characterized by consumption with
limited prospects of development. This was basically reflected in the maximum allocations of the
current budget at the expense of investment budget allocations. That is, the fiscal policy has
tended to distribute oil revenue by using it to encourage government employment in poorly
serviced and service-dominated jobs. Consequently, this expenditure is reflected in the formation
of a consumption pattern,whose goods flow through foreign trade to meet the pattern and
requirements of consumer's life and the investment of production has headed towards the
extravagance of consumption, which dismantled the system of economic activity through the
acquisition of sources of foreign currency and depletion without allowing it to maximize the
benefit of the various sectors in the Iraqi economy.
The problem of this research lies in the low level of growth of non-oil GDP. The research
proceeds from two hypotheses:
a. The expansionary consumer expenditure and investment activity generated by the budget has
little impact on the growth and stimulation of non-oil production sectors in Iraq.
b. The expansionary consumer expenditure and investment activity generated by the budget has
strong impact on the growth and stimulation of non-oil production sectors in Iraq.
The relationship between … Hasan Radhi
48| Journal of the Arab American University. Volume (4). Number (2) /2018
The research objectives are:
a. To track the course of government expenditure both investment and current developments
during the period of the research to show the extent of failure or success of the fiscal policy in
Iraq to stimulate GDP,
b. To know the impact of the current investment expenditure on the growth of non-oil GDP.
The research is divided into three sections. The first section dealt with the theoretical
framework of government expenditure and its effect on the total output. The second section
discussed the analysis of the evolution of government expenditure in Iraq for the period of (1990-
2014), while the third section discussed the estimation of the relationship between government
expenditure and non-oil GDP. At the end of the research, a number of conclusions and
recommendations were proposed.
Previous Studies
The study conducted by Shahrani and Sadik (2014) explored the relationship between the
government expenditure and economic growth in Saudi Arabia expressed in the index of per
capita GDP of non-oil. They divided the public expenditure into several categories (housing,
education, defense, health care) in the period of (1969-2010). The proposed research found out
that the main determinant of economic growth in the short run was the private investment
expenditure and the joint integration of the private sector investment and capital expenditure with
health care expenses is the main driving forces for growth in the long run. The study
recommended that the investment expenditure should be directed towards infrastructure in order
to diversify sources of income by increasing the contribution of private sector activity to the
overall activity. The continuation of government expenditure in this direction contributes to the
continuation of financial sustainability in the medium and long run.
The study titled (Effect of government expenditure on economic growth in East Africa a
disaggregated model) proposed by (Gisore, 2014: 8) attempted to verify in practice the impact of
government expenditure on economic growth in Eastern Africa for the period of 1980-2010 by
using the Levin-Lin-Chu test. This study showed that the government expenditure on health and
defense expenditure positively correlates with the economic growth, but the expenditure on

The relationship between … Hasan Radhi
49| Journal of the Arab American University. Volume (4). Number (2) /2018
education and the agricultural sector inversely correlates with the economic growth. This
negative relationship between education and agricultural expenditure with economic growth lacks
good governance by the government.
The relationship between government expenditure and economic growth in Algeria for the
Period (1990-2012) was proposed by Gathbnat, 2015: 1-15. The aim of this study was to test the
causality between real total government expenditure and real GDP. The Wagner case hypothesis
shows the state of the Algerian economy using the annual data for the period of 1990-2012.The
VECM model and the causal test were used in this paper. The results of the joint integration test
indicated a long-term relationship between the total government expenditure and GDP in Algeria
at a significant level of 5%. The results of the Keynesian causality test also showed a causal
relationship of the total government expenditure on GDP. That is, the government expenditure
stimulates economic growth.
The focus of the proposed research is to highlight the effects of the consumer behavior on the
government expenditure on non-oil GDP in addition to the time and spatial differences.
Section one: The theoretical framework of government Expenditure
The Effect of Consumer Expenditure on Total Output
The consumption or current expenditure is defined as the expenditure necessary to ensure the
good conduct of the government administration (public utilities).
Classical philosophy regarded the increase of state intervention part in the national wealth as
negative on the growth. "Any expansion of activity would damage the automatic direction and
inability to achieve parity between total demand and total supply," (Jabouri, 2014: 235). In his
explanation, Wagner explained that the public sector expenditure activity is growing with income
growth. Fakner explained that the evolution of public expenditure is a natural consequence of the
changing economic and social structure. The growth of aggregate demand meets the public sector
part, which leads to the result of the growth of the government sector in the economy, (Dagher,
2010: 114) .

The relationship between … Hasan Radhi
50| Journal of the Arab American University. Volume (4). Number (2) /2018
The Effect of Investment Expenditure on Total Output
The expenditure policy plays an important role in the growth process and highlights its
importance through its influence on the size of investment as one of the determinants of
economic growth and the investment expenditure is defined as the amounts allocated by the
government to obtain the necessary equipment to increase national production of goods , services,
equipment and machines for production infrastructure (Al-Badrani, 2010: 65). The effects of
investment expenditure on GDP can be determined by focusing largely on the effects of capital
accumulation on expanding production capacity in the economy and thereby positively reflecting
income and economic growth (Dagher, 2010: 115).
Section two: The evolution of government expenditure and sources of funding
in Iraq for the period of (1990-2014).
1. Course analysis of some items for government expenditure in Iraq during the period of (1990-
2014)
2. Analysis of the development of the policy for the period of (1990-2002)
During the period of (1990-2002), government expenditure witnessed a continuous
increase in the current prices and the structural imbalances in the economy contributed to the low
capacity of government expenditure. This in turn, stimulated the economic growth and the
dependence of the Iraqi economy on the oil resource to cover the public expenditure.
Additionally, the international demand for oil was reflected on the decline of the oil resource,
which coincided with the lack of flexibility of the productive apparatus in front of the increased
demand. Consequently, the rate of inflation increased. However, instead of focusing efforts on
alleviating those imbalances, the budget showed a significant imbalance, which caused the
increase in the operating expenses compared to the investment expenditures. Table (1) explains
that the public expenditure decreased significantly in 1994 compared with 1990, with an annual
growth rate of 51.2% and the investment expenditure in the same year (1994) shows that
investment expenditure reached (179.2) million ID in 1994 with an annual growth rate of 75.2%.
, while the current expenditure reached 1110.8 million with an annual growth rate of 42.1% ).
This means that the current expenditure has not decreased by the same proportion of the decline

The relationship between … Hasan Radhi
51| Journal of the Arab American University. Volume (4). Number (2) /2018
in investment expenditure. The reason for this increase is that the state is trying to maintain the
social balance by increasing the transfer expenditure to achieve food security by following the
government policy through supporting goods and services to be compatible with the inflation
levels and the low real level of per capita income. In 1996, the public expenditure witnessed
negative growth rates with annual growth rates of (-7.1%) and (-1.2%) for both the public
expenditure and current expenditure respectively due to the adoption of the economic
management approach to contain inflationary by reducing the expansion of government
expenditure and reducing the budget deficit. Table (1) shows that the period of (1990-1996) was
the growth of the total composite expenditure (-0.87%), while the compound annual growth rate
of the current expenditure (-0.85%) compared to the compound annual growth rate for the
investment expenditure (1997-1992) ; the investment expenditure has achieved positive annual
growth rates over the period of (1997-2002). However, the percentage of expenditure investment
to the public expenditure did not exceed (20%) as an average during the same period. This period
is indicative of fluctuations in both public expenditure and current expenditure. In 1999, the
current expenditure decreased significantly to reach (846.1) million ID, from (976.4) in
1998,while the growth rate of the investment expenditure in 1999 was (99.5%). Though the total
public expenditure reached a monetary value of (1101.7) million dinars, it is considered to be the
lowest annual growth rate of (-0.3%).
The improvement in the allocation of investment expenditure can be indicated through growth
rates. That is, the cumulative growth rate of investment expenditure for the period 1997-2002 was
54.3%, while the current expenditure amounted to (80%) during the period of (1990-2002) and
the average investment expenditure was (20%). Therefore, the expenditure policy neglected the
development expenditure and gave relative importance to consumer expenditure despite the need
of the Iraqi economy to correct the structure of the economy characterized by imbalance.
Figure (1) shows the Evolution of Current and Investment Expenditure Public Expenditure
during the period of (1992- 2002).

The relationship between … Hasan Radhi
52| Journal of the Arab American University. Volume (4). Number (2) /2018
Figure 1. Evolution of Current and Investment Expenditure and Public Expenditure during the
Period (1990-2002)
Table 1. Evolution of government expenditure (current and investment) at constant prices for 1988
= 100 for the period (1990-2002) ( million ID)
Years
public
Expenditure
(1)
Annual
growth
rate %
Compound
growth
rate%
Current
expenditure
(2)
Annual
growth
rate %
Annual
growth
rate %
Investment
expenditure
(3)
Compound
growth
rate%
Compound
growth
rate%
Rate
%
1:2
Rate
%
1:3
1990 8795.9 (57.0)
(0.87)
7045.3 -
(0.85)
1750.6 -
(0.95)
80.1 19.9
1991 3788.0 2.3 3388.9 (51.9) 399.2 (338.5) 89.4 10.5
1992 3874.1 (31.8) 3048.5 (10.0) 825.5 106.8 78.7 21.3
1993 2640.8 (51.2) 1917.2 (37.1) 723.6 (12.3) 72.6 27.3
1994 1289.9 (23.3) 1110.8 (42.1) 179.2 (75.2) 86.1 13.9
1995 989.8 (7.1) 868.0 (21.9) 121.7 (32.1) 87.7 12.3
1996 919.2 (9.2) 857.6 (1.2 ) 61.6 (49.4) 93.2 6.8
1997 834.3 32.4 1.96 722.5 (15.8) 1.8 11.8 81.5 54.3 87.7 12.3

The relationship between … Hasan Radhi
53| Journal of the Arab American University. Volume (4). Number (2) /2018
1998 1104.6 (0.3) 976.4 35.1 128.1 14.6 89.5 10.5
1999 1101.7 38.1 846.1 (13.3) 255.6 99.5 80.4 19.5
2000 1521.7 19.2 1170.2 38.3 351.5 37.5 76.8 23.2
2001 1814.6 1.5 1306.5 11.6 508.1 44.6 72 27.9
2002 1841.5 (57.0) 1289.0 (1.3 ) 552.4 8.7 70 30
* The annual growth rate was calculated according to the following formula (y2-y1) / y1 * 100). The compound
growth rate was calculated according to the following formula:
( ) 1
1
0
1
n
p
pr
Evolution analysis of current expenditure structure in period (1990-2002)
The main components of the current expenditure of the current budget were transfers, wages
and salaries. As explained in Table (2), these expenditures mounted to (1940.4) million ID in the
year of 1990, with the ratio of (27.5%) and then in 1991 declined with a negative annual growth
rate of 53.7% compared to the previous year, which is a negative annual growth rate of (53.7%)
compared to the previous year. This problem is relative to the total current expenditure (26.5%).
In contrast, the inputs of goods and services were (215.8) million and by 3% of the total current
expenditure, as shown in column (3) of Table (2). This decreased at a negative annual growth
rate of (60.8%) in 1994 with a value of (21) million ID. This item (goods and services inputs)
continued to decline in 1996 with an annual growth rate of (33.1%) and contribution to the total
of the current expenditure (1%). As for the compensation of employees, there was an increase in
the years of 1995-1996 with 55.3% and 59% 95% due to the improvement in public revenues and
the increase in the cash issue and the entry of the memorandum of understanding into force.
During the period of (1997-2002), there were no compensations for employees and the
expenditure of goods inputs was negligible in their annual growth rates despite the reform
program which was based on several axes including reducing government expenditure to the

The relationship between … Hasan Radhi
54| Journal of the Arab American University. Volume (4). Number (2) /2018
lowest possible level and maximizing the financial resources of the government (Saleh, 2002:
434)
Table 2. Evolution of current government expenditure structure
year
Current
expendit
ure(1)
Annual
growth
rate%
Employ
ee
salaries
(2)
Annual
growth
rate%
Intermedia
te goods
ana
servies (3)
Annual
growth
rate%
Social
expenditur
e (4)
Annu
al
growt
h
rate%
Special
program
s
(5)
Annual
growth
rate%
Pension
s
salaries
(6)
Annu
al
growt
h
rate%
2:1% 3:1% 4:1% 5:1% 6:1%
1990 7045.3 - 1940.4 - 215.8 - 2431.1 - 1524.1 - 844.2 - 27.5 3 34.4 21.6 12
1991 3388.9 (51.9) 896.7 (53.7) 61.7 (71). 1498.3 (38.3) 573.9 (62.3) 342.9 (59.3) 26.5 1.8 44.2 16.9 10.1
1992 3048.5 (10.0) 619.6 (30.8) 59.8 (3). 1773.9 18.3 295.4 (48.5) 270.6 (21) 20.3 2 58.2 9.7 8.9
1993 1917.2 (37.1) 296.1 (52.2) 53.7 (10.1) 1163. (34.4) 264.8 (10.3) 130.4 (51.8) 15.4 2.8 60.7 13.8 6.8
1994 1110.8 (42.1) 58.2 (80.3) 21 (60.8) 753.7 (35.1) 195.1 (26.3) 80.7 (38.1) 5.2 1.9 67.8 17.6 7.3
1995 868.0 (21.9) 90.4 55.3 13.8 (34.1) 628.3 (16.6) 90.8 (53.4) 43.6 (45.9) 10.4 1.6 72.3 10.5 5
1996 857.6 (1.2 ) 144.5 59.9 9.2 (33.1) 551.3 (12.2) 90. (0.8) 61.6 41.2 19.9 1 64.3 10.5 7.1
1997 722.5 (15.8) 130.5 (9.7) 12.9 40.1 454.4 (17.5) 90.4 0.4 44. (28.5) 17.7 1.7 61.7 12.3 6
1998 976.4 35.1 144.6 10.8 24.6 90.1 604.1 32.9 175.3 93.9 39.8 (9.5) 14.6 2.5 61 17.7 4
1999 846.1 (13.3) 207.5 43.4 29.2 18.6 454.7 (24.7) 154.3 (12) 36.9 (7.2) 23.4 3.3 51.3 17.4 4.1
2000 1170.2 38.3 229.2 10.3 39.3 34.5 621.6 36.7 232.7 50.8 41.3 11.9 19.6 3.4 53.1 19.9 3.5
2001 1306.5 11.6 293.4 28 47.5 20.6 523.7 (15.7) 346.5 48.8 80.9 95.8 22.5 3.6 40.3 26.6 6.2
2002 1289.0 (1.3 ) 326.1 11.1 54.3 14.3 478. (8.7) 342.2 (1.2) 75.2 (7) 25.3 4.2 37 26.5 5.8
*Values between arcs indicate negative values.
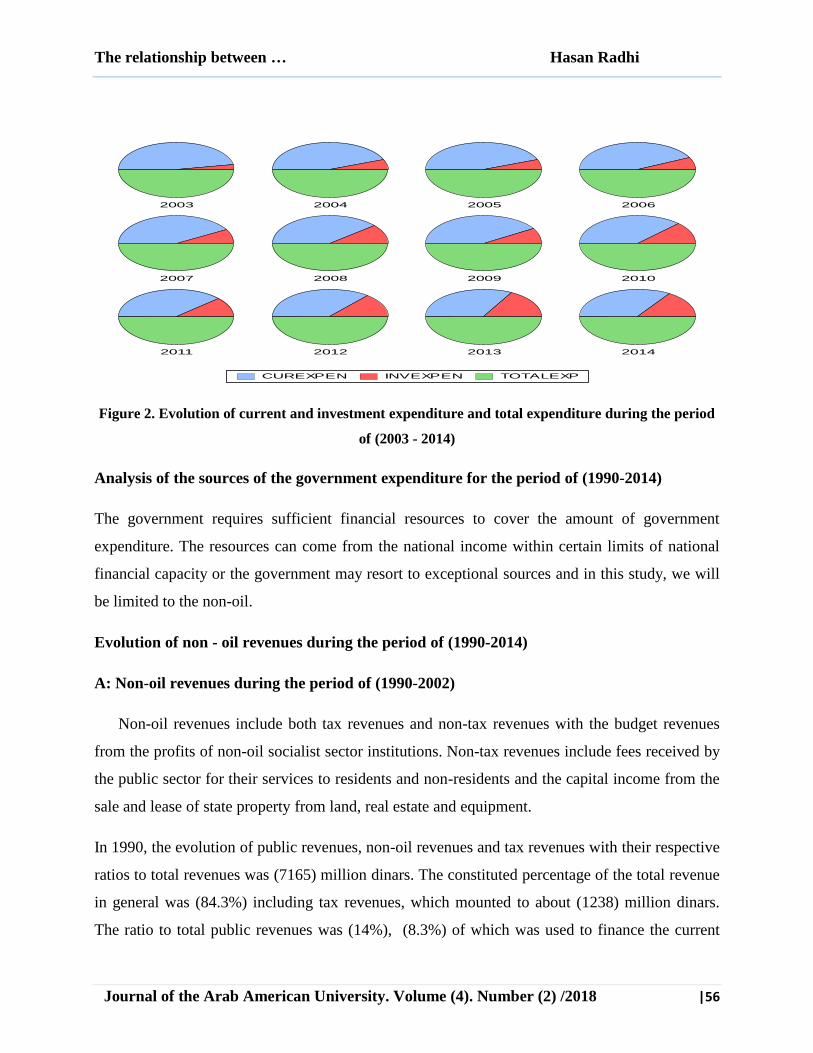
Analysis of policy directions for the period of (2003-2014)
The total expenditure mounted to (13694) million dinars in 2004 and the annual growth rate was
(406.4%), whereas in 2005, the total public expenditure decreased to (9779.6) million with a
negative growth rate of (28.5%). In 2007, the current expenditure reached (5176.9) with an
annual growth rate of (-12.7%) and 83.2%. In contrast, investment expenditure in the same year
reached (1042.4) million ID with 16.8%. It is possible to say that most of the allocations of the
current expenditure were directed towards strengthening the security aspect and increasing the
salaries of the state employees. Public Expenditure continued to increase during the subsequent
period until 2009 and the total expenditure had a negative growth rate of (-14.9%). The
investment expenditure also witnessed an improvement in its annual growth rate compared to the
current expenditure in 2010. The latter had a negative growth rate (3.3%), while the investment
expenditure increased by (57.3%). Nevertheless, it did not exceed 20% on average, while the
average current expenditure ratios were (80%) during the same period. Figure 2 shows the
graphical presentation of this period.

The relationship between … Hasan Radhi
55| Journal of the Arab American University. Volume (4). Number (2) /2018
Table 3. Evolution of public expenditure in both current and investment at constant prices for the
year 1988 = 100 during the period (2003-2014) (ID million).
year
Total
expenditure
(1)
Annual
growth
rate%
%Compound
growth rate
Current
expenditure
(2)
Annual
growth
rate%
%Compound
growth rate
Investment
expenditure
(3)
Annual
growth
rate%
%Compound
growth rate 1:2% 1:3%
2003 2703.7 -
5
2544.9 -
3.3
158.7 -
31
94.1 5.9
2004 13694. 406.4 11989.2 371.1 1704.8 974.2 87.5 12.5
2005 9779.6 (28.5) 8585.3 (28.3) 1194.2 (29.9) 87.7 12.3
2006 7761.6 (20.6) 6597.3 (23.1) 1164.2 (2.5) 85 15
2007 6219.3 (19.8) 5176.9 (21.5) 1042.4 (10.4) 83.2 16.8
2008 10368. 66.7 8060. 55.6 2307.9 121.4 77.7 22.3
2009 8813.7 (14.9) 7283.9 (9.6) 1529.8 (33.7) 82.6 17.4
2010 9444.9 7.1 7038.1 (3.3) 2406.8 57.3 74.6 25.4
2011 11673.7 23.5 8928.5 26.8 2745.1 14. 76.4 23.6
2012 14528.2 24.4 10472.4 17.2 4055.7 47.7 72 28
2013 16161.1 11.2 10683. 2. 5478.1 35. 66 34
2014 14886.4 (7.8) 10182.6 (4.6) 4703.8 (14.1) 68.4 31.6
* Values between parentheses mean negative values.
The relationship between … Hasan Radhi
56| Journal of the Arab American University. Volume (4). Number (2) /2018
2003 2004 2005 2006
2007 2008 2009 2010
2011 2012 2013 2014
CUREXPEN INVEXPEN TOTALEXP
Figure 2. Evolution of current and investment expenditure and total expenditure during the period
of (2003 - 2014)
Analysis of the sources of the government expenditure for the period of (1990-2014)
The government requires sufficient financial resources to cover the amount of government
expenditure. The resources can come from the national income within certain limits of national
financial capacity or the government may resort to exceptional sources and in this study, we will
be limited to the non-oil.
Evolution of non - oil revenues during the period of (1990-2014)
A: Non-oil revenues during the period of (1990-2002)
Non-oil revenues include both tax revenues and non-tax revenues with the budget revenues
from the profits of non-oil socialist sector institutions. Non-tax revenues include fees received by
the public sector for their services to residents and non-residents and the capital income from the
sale and lease of state property from land, real estate and equipment.
In 1990, the evolution of public revenues, non-oil revenues and tax revenues with their respective
ratios to total revenues was (7165) million dinars. The constituted percentage of the total revenue
in general was (84.3%) including tax revenues, which mounted to about (1238) million dinars.
The ratio to total public revenues was (14%), (8.3%) of which was used to finance the current

The relationship between … Hasan Radhi
57| Journal of the Arab American University. Volume (4). Number (2) /2018
expenditure. Consequently, it is necessary to target access to a situation with tax revenues
covering high rates of current expenditure, especially, in oil countries so as not to affect the
(consumption) of the oil resource at the expense of investment expenditure and the rights of
future generations. If we approach the idea, we note the inability of this funding source (tax
revenues) to finance the current expenditure. In order to mark the effectiveness of tax policy in
the Iraqi economy, three indicators were calculated: tax energy, tax burden and the tax effort.
The tax burden in the Iraqi economy mounted to (2.21%) in 1990 and then decreased during the
following years and the average rate for the period of (1990-1996) was (1.11%). This indicator
did not improve during (1997-2002), and remained low, especially, in the years of 1999-2000. It
reached (0.94%) and (0.88%) for the two years respectively and the ratio of the tax burden during
the period of (1997-2002) reached to (1.23%), not far from the average tax burden in the previous
period. This may be attributed to the circumstances of the economic siege.
Because of the positive relationship between the oil revenues and the volume of foreign trade in
Iraq, the tax system during this period was characterized by low performance efficiency. This is
clear from the low rates of tax effort and high rates of waste in the utilization of tax revenues.
During the period of (1990-1996) , the tax rate was (0.034) ,which was very low, while the
average tax rate during the same period was estimate at (31.41). Thus, the unused tax rate is
about 96.6% in the period of (1990-1996). It also indicates the inefficiency of the existing tax
institutions
In the period of (1997-2002), the exploitation of the government to the average value of this
index is less than the correct one.That is, there is significant waste in the utilization of the tax
energy (97%) of the average tax energy during the same period.This shows how the tax revenues
were affected by the conditions of the economic blockade.

The relationship between … Hasan Radhi
58| Journal of the Arab American University. Volume (4). Number (2) /2018
Table 4. Non-oil revenues, tax revenues, and their proportion for the period (1990-2002)
year
Public
Revenu
-1
Non-oil
Revenu
-2
Annual
growth
rate%
%
Com
poun
d
grow
th
rate
Tax
Revenue
-3
Annu
al
growt
h
rate%
%
Comp
ound
growt
h rate
Governme
nt
expenditur
e
-4
GDP
-5
Current
expenditur
e
-6
Non-oil
deficit
of
current
expendit
ure (7)
1:2%
4:2%
5:2%
1:3%
4:3%
5:3%
1990 8491 7165 -
24.8
1238 -
57.9
14179 55926.5 11357 10119 84.3 50.5 12.8 14.5 8.7 2.2
1991 4228 3529 -50.7 664 -46.4 17497 42451.5 15653 14989 83.4 20.1 8.3 15.7 3.8 1.6
1992 5047 4092 15.9 1049 58 32883 115108.4 25876 24827 81.7 12.4 3.5 20.7 3.2 0.91
1993 8997 6864 67.7 2657 153.2 68954 321646.9 50060 47403 76.2 9.9 2.1 29.5 3.8 0.82
1994 25659 21207 209 9331 251.1 199442 1658325.8 171742 162411 82.6 10.6 1.3 36.3 4.7 0.6
1995 106986 100327 373 52707 464.8 690784 6695482.9 605840 553133 93.7 14.5 1.5 49.2 7.6 0.78
1996 178013 156666 56.1 61797 17.2 542542 6500924.6 506102 444305 88 28.9 2.4 34.7 11.4 1
1997 410537 355368 126.8
3.4
160212 159.3
5.2
605802 15093144 534095 373883 86.6 58.6 2.3 39 26.4 1.06
1998 520430 435231 22.4 202318 26.2 920501 17125847.5 824705 622387 83.6 47.3 2.5 38.8 22 1.2
1999 719065 643666 47.9 326903 61.6 1033552 34464012.6 831592 504689 89.5 62.2 1.9 45.4 31.6 0.94
2000 1133034 990617 53.9 443239 35.5 1498700 50213699.9 1151663 708424 87.4 66 1.9 39.1 29.5 0.88
2001 1289246 1103339 11.3 532516 20 2079727 41314568.5 1490866 958350 85.5 53 2.7 41.2 25.6 1.3
2002 1971125 1596275 44.6 852931 60.1 2518285 41022927.4 1762683 909752 81 63.3 3.9 43.3 33.8 2
Table 5. Oil revenues to public revenues, government expenditure, GDP at current prices, deficit
and surplus for the period of 2003-2014
Year
Public
Revenu
-1
Annual
growth
rate%
Annual
growth
rate%
Oil
Revenue
-2
Annual
growth
rate%
Compound
growth
rate%
Government
expenditure
-3
Deficit,Surplus
GDP
-4
3: 1
%
2: 1
%
3: 2
%
4: 2
%
2003 16015654 - 6.2
15790516 5.8
4901960.8 11113693 29585788.6 326.7 98.5 322 53.3
2004 32988850 106 32625108 107 31521427.9 1467422 53235358.7 104.6 98.8 103.5 61.2
2005 40435740 23 39453950 21 30831141.7 9604598 73533598.6 131.1 97.5 128 53.6
2006 49055544 21 46908043 19 37494459 11561085 95587954.8 130.8 95.6 125 49
2007 54964849 12 53163644 13 39308348.5 15656501 111455813.4 139.8 96.6 135.2 47.6
2008 80616246 47 77589442 46 67277196.6 13339049 157026061.6 119.8 96.2 115.3 49.4
2009 55243526 -31 51752349 -33 55589721.1 -346195 130643200.4 99.3 93.6 93 39.6
2010 70178223 27 66923336 29 61034201.8 9144021 162064565.5 115 95.3 109.6 41.2
2011 103989088 33 102452810 53 79657666.3 24331422 217327107.4 130 98.5 128.6 47.1
2012 119817222 15 117271044 14 105139575.7 14677646 254225490.7 114 97.8 111.5 46.1
2013 113840075 -5 111210715 -5 119127556.3 -5287481 271091777.5 95.5 97.6 93.3 41
2014 105553850 -7 97071979 -13 112192125 -6638275 260610438.4 94 91.9 86.5 37.3

The relationship between … Hasan Radhi
59| Journal of the Arab American University. Volume (4). Number (2) /2018
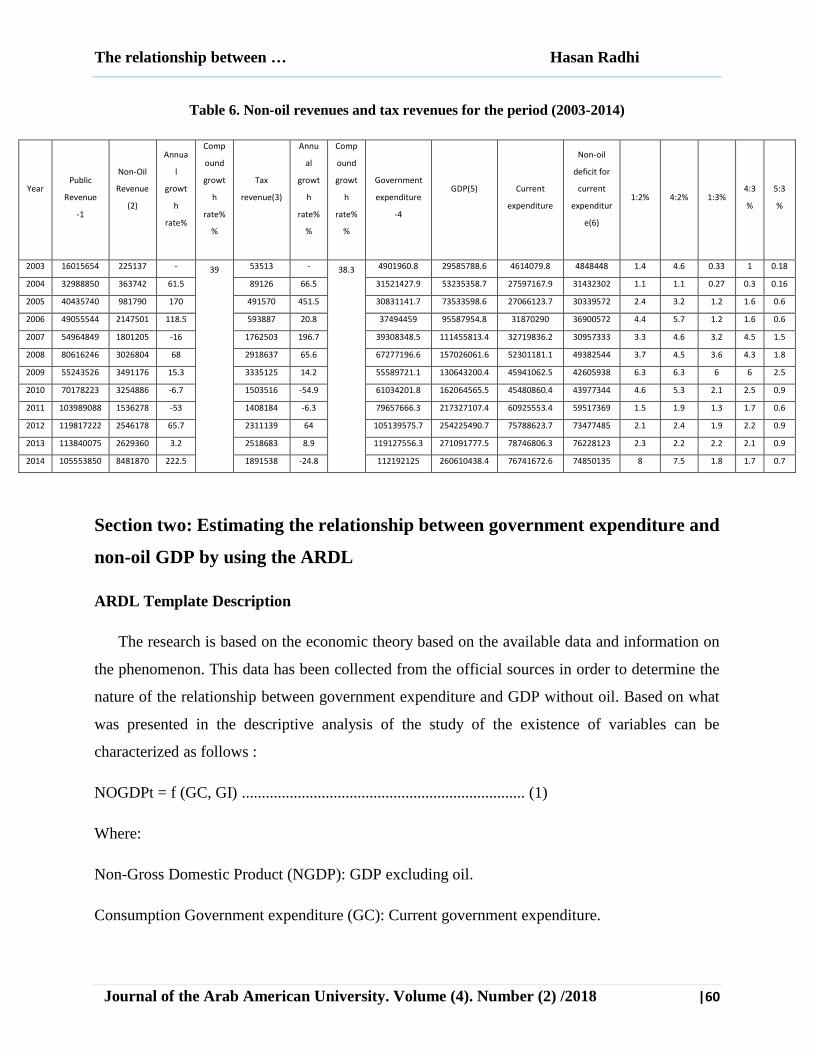
Non-oil revenues during the period of (2003-2014)
The period following the political change has been accompanied by the shifts in the legal
infrastructure of the policy. More specifically, the country enacted laws regarding domestic and
foreign standards in accordance with the new conditions of the Iraqi economy. For instance,
Article (37) of 2003 refers to the suspension of income tax on income sources; real estate
property and further reductions in the rates of taxes on the incomes were reduced by no more than
15% ( previously was 40%). The tax amendments also included subjecting the public sector
employees to tax burdens. In terms of customs taxes, they were suspended and replaced by Iraq's
5% reconstruction (Samurai, 2013: 47). The government also resorted to alternative non-
inflationary methods, debt financing and other credit instruments (Obaid, 2014: 311). However,
the adoption of the amendments to the tax policy referred to has resulted in the annexation of the
treasury bonds and treasury bills and the use of the Central Bank for sale. The course of
development can be seen from Non-oil revenues in 2003,which amounted to 225137 million ID
including tax revenues of 53513 million ID. The ratio of non-oil revenues to total revenues did
not exceed (2%), while this ratio was (0.33%) for tax revenues. In 2007, the annual growth rate of
non-oil revenues decreased by 16% (196.7%). However, there was a significant gap between tax
revenues and the current expenditure directed towards the provision of services to society in large
part. This case indicated the depth and breadth of the phenomenon throughout the duration of the
study expressed in the index of the amount of deficit of the current expenditure.
The low efficiency performance of tax system can be indicated by the average tax rate for the
period (2003-2014) ,which was 0.030. This rate indicated the size of the great loss in the
utilization of tax energy, which previously was 97%.
Therefore, the financing role of other sources of income (taxes) was secondary and the weakness
in the tax revenues is due to several reasons (Kamash, 2010: 167)
The relationship between … Hasan Radhi
60| Journal of the Arab American University. Volume (4). Number (2) /2018
Table 6. Non-oil revenues and tax revenues for the period (2003-2014)
Year
Public
Revenue
-1
Non-Oil
Revenue
(2)
Annua
l
growt
h
rate%
Comp
ound
growt
h
rate%
%
Tax
revenue(3)
Annu
al
growt
h
rate%
%
Comp
ound
growt
h
rate%
%
Government
expenditure
-4
GDP(5)
Current
expenditure
Non-oil
deficit for
current
expenditur
e(6)
1:2% 4:2% 1:3% 4:3
%
5:3
%
2003 16015654 225137 - 39
53513 - 38.3
4901960.8 29585788.6 4614079.8 4848448 1.4 4.6 0.33 1 0.18
2004 32988850 363742 61.5 89126 66.5 31521427.9 53235358.7 27597167.9 31432302 1.1 1.1 0.27 0.3 0.16
2005 40435740 981790 170 491570 451.5 30831141.7 73533598.6 27066123.7 30339572 2.4 3.2 1.2 1.6 0.6
2006 49055544 2147501 118.5 593887 20.8 37494459 95587954.8 31870290 36900572 4.4 5.7 1.2 1.6 0.6
2007 54964849 1801205 -16 1762503 196.7 39308348.5 111455813.4 32719836.2 30957333 3.3 4.6 3.2 4.5 1.5
2008 80616246 3026804 68 2918637 65.6 67277196.6 157026061.6 52301181.1 49382544 3.7 4.5 3.6 4.3 1.8
2009 55243526 3491176 15.3 3335125 14.2 55589721.1 130643200.4 45941062.5 42605938 6.3 6.3 6 6 2.5
2010 70178223 3254886 -6.7 1503516 -54.9 61034201.8 162064565.5 45480860.4 43977344 4.6 5.3 2.1 2.5 0.9
2011 103989088 1536278 -53 1408184 -6.3 79657666.3 217327107.4 60925553.4 59517369 1.5 1.9 1.3 1.7 0.6
2012 119817222 2546178 65.7 2311139 64 105139575.7 254225490.7 75788623.7 73477485 2.1 2.4 1.9 2.2 0.9
2013 113840075 2629360 3.2 2518683 8.9 119127556.3 271091777.5 78746806.3 76228123 2.3 2.2 2.2 2.1 0.9
2014 105553850 8481870 222.5 1891538 -24.8 112192125 260610438.4 76741672.6 74850135 8 7.5 1.8 1.7 0.7
Section two: Estimating the relationship between government expenditure and
non-oil GDP by using the ARDL
ARDL Template Description
The research is based on the economic theory based on the available data and information on
the phenomenon. This data has been collected from the official sources in order to determine the
nature of the relationship between government expenditure and GDP without oil. Based on what
was presented in the descriptive analysis of the study of the existence of variables can be
characterized as follows :
NOGDPt = f (GC, GI) ....................................................................... (1)
Where:
Non-Gross Domestic Product (NGDP): GDP excluding oil.
Consumption Government expenditure (GC): Current government expenditure.

The relationship between … Hasan Radhi
61| Journal of the Arab American University. Volume (4). Number (2) /2018
Investment Government expenditure (GI): Government investment expenditure.
Based on this equation, we could estimate the effect of government expenditure on the GDP
(non-oil) in the Iraqi economy during the period of 1990-2014. Thus, the ARDL model can be
used to measure the long-term and short-term effects of the government expenditure (current and
investment) in GDP. It is assumed that the signals of the parameters (short and long term) are
positive for this variable. That is ,there is a positive long-term relationship between this type of
expenditure and the local output since the investment and expenditure are directed to the
infrastructure supporting.
)2..(...................................................lnln.ln
lnlnlnln
131211
1
3
1
2
1
10
tttt
it
n
i
it
n
i
it
n
i
t
GIGCNOGDP
GIGCNOGDPLnNOGDP
Where:
Δ Represents the first difference of the variabl, α0 represents the constant limi, n represents the
upper limit of the time lag periods, 1 β and 2β and 3β represent the short-term elasticities, 1 λ, 2λ
and 3λ represent the long-term elasticities، t is the study from 1990 to 2014, tε represents the
random error limit of the model (Residual).
The relationship between current government investment expenditure and non-oil domestic
product.
Unit root test
Table (7) shows the extended Dicky-Voller test of the unit root. It’s clear from the results that
the non-oil GDP variable has achieved a static status at the level of the original data with a fixed
limit and a general trend. P = value (0.0125) which is less than 5% , which rejects the null
hypothesis 1 = p h0 with the existence of a unit root in the time series of the non-oil GDP
variable, but accepts the alternative hypothesis (p: H1). The current expenditure and investment
did not achieve the status of dormancy of the time series at their original level, as the value of P-
value) is greater than 5%. This indicates that these two variables will not remain silent , but it is
noted that all the three variables (non-oil GDP, current expenditure, investment expenditure) have
achieved the status of silence after taking the first difference. The non-oil GDP variable is a class

The relationship between … Hasan Radhi
62| Journal of the Arab American University. Volume (4). Number (2) /2018
I (0) variable, while the current government and investment expenditure variables are combined
with the first class I (1). Table (7) shows the Dicky-Fuller Test Results (ADF)
Table 7. Dicky-Fuller Test Results (ADF)
Variable
Level First differences
Fixed limit only
Fixed limit and
general
direction
Without a fixed
limit or a
general trend
Fixed limit only
Fixed limit and
general
direction
Without a fixed
limit or a
general trend
P- value P- value P- value P- value P- value P- value
LNOGDP 0.8393 0.0125 0.9244 0.0000 0.0001 0.0000
LGC 0.7644 0.1756 0.6898 0.0057 0.0247 0.0003
LGI 0.8913 0.1022 0.8657 0.0000 0.0001 0.0000
The Philips Peron test (P.P) test shown in Table (8) is non-oil GDP stable at a level with
a fixed limit and a general trend since the P-value of 0.0125 is less than 5%, which rejects the
null hypothesis and accepts the alternative hypothesis. This is clear from the test of Phillips Peron
that the variables of the government expenditure (current and investment) are not resident at the
level of the original data whether there is a fixed limit only or a fixed limit and general direction
or without a fixed limit and a general trend. Consequently, the hypothesis of nothingness (H0)
that the variables remain unchanged at their original level is accepted . The rejection of the
alternative hypothesis (1>: p (H1, Luck, that all variables have achieved a recipe sleep after
taking the first difference time series variables studie. Therefore, the current expenditure and
investment expenditure complementary Class I (1) , while the non-oil GDP integrated level (0) I
Table 8. Philips Peron test results (p.p) (unit root test)
Variable
Level First differences
Fixed limit only
Fixed limit and
general
direction
Without a fixed
limit or a
general trend
Fixed limit only
Fixed limit and
general
direction
Without a fixed
limit or a
general trend
P- value P- value P- value P- value P- value P- value
LNOGDP 0.9351 0.0125 0.9994 0.0000 0.0000 0.0000
LGC 0.7119 0.1756 0.6802 0.0059 0.0270 0.0003
LGI 0.7449 0.0964 0.8656 0.0000 0.0001 0.0000

The relationship between … Hasan Radhi
63| Journal of the Arab American University. Volume (4). Number (2) /2018
Estimating the regression of joint integration according to the (ARDL model) and testing its
statistical quality
The estimated ARDL model indicates that the non-oil GDP is the dependent variable. The
statistical program automatically determined the time lag of the variables according to the Akiake
Criteria (AIC) : two times for the non-oil GDP variable and one-time lag of the government
expenditure variable (R-squared = 0.95). The value of the F-Stat (66.1) was statistically
significant, and the statistical value of the sample was statistically significant. The value of
p.value () was (-1.59%), which is less than 5%. This means that the model is suitable for
interpreting the relationship between the independent variables and the dependent one. This
means that the model is free from the problem of the intrinsic correlation of the values. The
results of the diagnostic tests for the estimated model in Table (9). The model is free of
measurement problems, such as the problem of the instability in terms of P-value. The results
indicate that the model is sound from the problem of self-correlation. The value of P- value of
Chi square (0.1593) is insignificant because it is greater than 5%. This means that the current
values are not affected by the previous values. Finally, the distribution test is distributed as
normal. The value of P- value.Jarque-Bera is insignificant (5%) as it reached (0.907239), which
makes it possible to accept the null hypothesis that the residuals Zaa naturally rejected the
alternative hypothesis. Table (9) shows the estimation of the ARDL model for co-integration.
Table (10) shows the Residual Diagnostic Tests results.
Table 9. Estimation of the ARDL model for co-integration
Variables Estimated parameters
Coefficients t-statistic))
Probability value
P- value))
LNOGDP(-1) 0.824056 5.714769 0.0000
LNOGDP(-2) 0.186867- 1.319941- 0.2044
LGI 0.147611 2.883875 0.0103
LGI(-1) 0.077213- 1.743415- 0.0993
LGC 0.048777 0.871510 0.3956
Constant 2.787911 3.836565 0.0013
R-Squared = 0.95 F-Statistic= 66.10 P- value F- Stat= [0.0000]
Durbin- Watson =2.7515 Durbin's h-statistic =- 1.981

The relationship between … Hasan Radhi
64| Journal of the Arab American University. Volume (4). Number (2) /2018
Table 10. Residual Diagnostic Tests
Serial Correlation 0.1593 = P- value. Chi-Square
Natural distribution (Normality) 0.907239= P- value. Jarque – Bera
Inconsistency of contrast
homogeneity(Heteroscedasticity) 0.1298 = P- value. Chi-Square
Bound Test for Bound Integration
In order to verify the existence of a common integration relationship between the variables of
model (1) (non-oil GDP), the Bound Test has been used. The calculated F-statstic value (5.7) is
higher than the minimum and upper values of all levels of morale. Meaning that the rejecting null
hypothesis (H0) and accepting the alternative hypothesis (H1) with a common integration
between the studied variables. Table (11) show the ARDL Bounds Test for Co-integration.
Table 11. ARDL Bounds Test for Cointegration
Variables F – Statistics Cointegration
LNOGDP,LGI,LGC)) 5.7 Cointegration
Critical value Lower Bound Upper Bound
1% 4.13 5
5% 3.1 4.87
10% 2.63 3.35
Estimating the short-term relationship between the non-oil GDP model variables.
Table (12) shows the results of error estimation and correction model. The results show that
the variables corresponded to the expected signs. The indicators of government expenditure
(current and investment) are expected to be positive.
The increase in investment expenditure by 1% leads to an increase in non-oil GDP by (0.150).
The value of P-value current expenditure parameter of 0.5965 is greater than 5%. This indicates
that the effect of the current expenditure on non-oil GDP is not significant. In contrast, the effect
of investment expenditure was significant because P the value of the variable investment
expenditure is less than 5%. This is due to the deterioration of the business sector in the Iraqi

The relationship between … Hasan Radhi
65| Journal of the Arab American University. Volume (4). Number (2) /2018
economy because of wars and siege destruction of the infrastructure, which made government
expenditure a weak factor in the real production sector.
Government Expenditure is characterized by a significant imbalance because of the dominance of
current expenditure. In the period following the political change, the effects of government
expenditure on non-oil GDP did not differ from the period preceding it despite the availability of
growth opportunities in the real production sectors and the relatively favorable environment for
investment activity. The government has not had a developmental direction, and its expansionist
behavior has not led to tangible effects in the commodity production sector. However, the revival
of service activities, such as the foreign trade sector and the associated transport sector, was
financed by the oil sector, which became weakly linked to the local commodity production sector
and expenditure works for a non-resident economy.
Table 12. Estimated Long Run Coefficients
Variables Coeffcients t-statistic P- value
Δ (LNOGDP(-1)) 0.177883 1.461840 0.1620
(GI) Δ 0.150833 2.883875 0.0009
(GC) Δ 0.034879 0.871510 0.5965
ECT(-1) 0.362811- -5.062548 0.0001
Estimating the long-term relationship between non-oil GDP model variables
Table (13) shows the results of the long run ARDL model relationship between the
independent variables and the dependent variable
Table 13. Estmated Long Run Coefficients
Variables Coeffcients t-statistic P- value
GI 0.194035 1.656400 0.1160
GC 0.134442 0.872855 0.3949
C 7.684189 12.153492 0.0000
Error correction equation
Cointeq = NONGDP - (0.1940*GI + 0.1344*GCC + 7.6842 )
The relationship between … Hasan Radhi
66| Journal of the Arab American University. Volume (4). Number (2) /2018
The results show that both variables have a positive effect on the non-oil GDP because
their Coefficients are positive. These parameters were not significant, noting that the probability
value (Pvalue) is greater than 5% leading to the acceptance of the null hypothesis. The
assumption is that the government's current and investment expenditure has no long-term impact
on the growth of non-oil GDP. Additionally, the results indicate that the value of the error
correction parameter was negative (0.362) and (0.0006) less than (5%). The ECM (-1) indicates
that the system is fast moving (36%) toward long-term equilibrium. This is due to any shock that
occurs in independent variables. This means that the non-oil GDP takes about (2.8) years (1 /
0.0362) towards its equilibrium value after any shock to the explanatory variables. The
prioritization of consumer expenditure at the expense of investment expenditure has damaged the
revenue-generating infrastructure projects. Moreover, the implementation of these projects has
faced many problems and obstacles, which undermined the impact of investment expenditure in
the Iraqi economy. Additionally, it delayed ratification of the laws of the state budget and
affected the implementation of most of the investment budget projects
This is to start stages and the end of a large deviation between what is planned and implemented,
financial and administrative corruption and low specifications of imported construction materials
due to poor quality control (Planning, 2012: 98-99). The government's expenditure policy in its
present (consumer) behavior was created by the private sector as a budget spender. This will
reduce the desire of the private sector to engage in real productive activities.
The agricultural sector and the diversion industry as long as the oil revenues funded for public
expenditure provide unproductive employment opportunities. The economy absorbed that
expenditure and resulted in increased expenditure on massive consumer imports without
incentives. This is to shift the gap between domestic demand and supply to a real output engine
for domestic activities and a catalyst for growth.
3.7 Test structural stability of model variables
The results of the stability test and the CUSUM & CUSUMQ test show that the graph of
both tests falls within the critical limits at a significant level of 5%. Thus, the tests confirm that
the short and long-term model parameters are stable in time.

The relationship between … Hasan Radhi
67| Journal of the Arab American University. Volume (4). Number (2) /2018
-15
-10
-5
0
5
10
15
1996 1998 2000 2002 2004 2006 2008 2010 2012 2014
CUSUM 5% Significance
Figure 3. Test the cumulative sum
-0.4
0.0
0.4
0.8
1.2
1.6
1998 2000 2002 2004 2006 2008 2010 2012 2014
CUSUM of Squares 5% Significance
Figure 4. Cumulative number of recessive boxes
Conclusions
- The research hypothesis that consumer expenditure and expansionary investment generated by
the public budget was characterized by weak impact in stimulating the non-oil production sectors
in the period before 2003 or in the subsequent period was accepted.
- Government spending is a priority and financial corruption and poor planning have led to the
government's failure to rebuild damaged infrastructure to spur economic growth.
- The expenditure weakness tool of automatic stability (tax) in the financing of expenditure
resulted in a very large and diverse demand for the groups of society to the fragility of economic
diversification. This will lead to the trend of imports to non-residents to meet demand against the
depletion of central bank reserves and damage the production levels in non-oil production sectors

The relationship between … Hasan Radhi
68| Journal of the Arab American University. Volume (4). Number (2) /2018
with low competitiveness and the correlation of fiscal policy with the oil revenues in reaching its
goals and the continued abandonment of other sources of income.
- The private sector has not been able to occupy the large area left by the public sector.
- The public sector has been characterized by reluctance and lack of an integrated link between
their objectives to develop the economy towards real economic development.
- The tax system in Iraq is weak in efficiency and stability. Its one of the reasons for the
prevalence of consumer behavior in the economy, so the taxpayer became a function of oil
revenues.
Recommendations
- Reviewing the priorities of the expenditure policy by adjusting the structure of government
expenditure in favor of investment expenditure to address the inherent imbalance in the structure
of the Iraqi economy and create a productive and efficient production structure with the potential
to generate added value.
- The diversification of income requires the establishment of a private sector that is locally
initiated and integrated with government activity. This will require balancing the wages of public
and private sector employees with the adoption of the wage-linkage strategy.
- Reforming the tax system in Iraq and increase its efficiency with the provision of various
channels to budget revenues to reduce the dependence of the Iraqi economy on oil revenues
characterized by instability as an external variable. The establishment of a tax system gives the
competitive advantage of non-oil production and positive impact in the expansion of tax
containers and state budget.
- Reducing non-productive employment in government structures and improving the performance
of the government apparatus and public projects and linking the cost of productivity to reduce the
phenomenon of disguised unemployment, and reducing the dependence of public companies on
the budget resources .

The relationship between … Hasan Radhi
69| Journal of the Arab American University. Volume (4). Number (2) /2018
Footnotes
The choice of ARDL is specifically due to the advantages of the model over other standard
models. There are some assumptions about the data in ARDL. (Meo, 2016). Data must be free of
self-correlation. Data should be free of HSK. Data must be distributed naturally. None of the
variables studied are stable at the second difference. The data must be stable at the level, or
stable at the first difference or stable at the level and the first difference.
A). The ARDL model can be used regardless of the degree of integration between variables (0) or
(1) regardless of the dormancy (Meo, 2016)
B). The ARDL model takes a sufficient number of lag times to obtain the best set of data from
the general frame model (chai, 2003)
T). The ARDL model gives the best results for long-term parameters and is a highly reliable
diagnostic tests (Godfrey, 1998, p235) (Chai, 1998, p405)
References
1. Al-Badrani, Q. (2010). Public Finance and Financial Legislation. Dar Ibn Athir for
Printing and Publishing. Mosul University.
2. Ayeb,W.(2010). The Macroeconomic Impacts of Government Expenditure Policy.A
Standardized Application of Economic Development Models. Hussein Al-Asriya Library.
Beirut.
3. Dagher, M., and Ali, M.(2010). Public Expenditure on Infrastructure Projects and its
Impact on Economic Growth in Libya (Causality Approach). Arab Economic Research
Journal. No. 51.
4. Gerrard, W J., and Godfrey, L G. (1998). Diagnostic checks for single-equation error-
correction and autoregressive distributed lag models. The manchester school of economic
& Social studies. blackwell publishing. 66(2 ).
5. Jabouri, M, S.(2014). The Foundations of Modern Financial Economy and Financial
Policy. Dar al-Kitab wal-Tikkun, Baghdad.

The relationship between … Hasan Radhi
70| Journal of the Arab American University. Volume (4). Number (2) /2018
6. Kamesh, K, S.(2010). Future of the Tax System in Iraq in Transition to a Market
Economy. Dissertation, unpublished, Faculty of Management and Economics.
Mustansiriya University.
7. Lalalet, G .(2015). the impact of government spending on economic growth in Eastern
Africa. Jordanian Journal of Economic Sciences. 2 ( 1).
8. Laurenceson, J., and Chai, J.C.H. (1998). Financial Reform and Economic.
9. Laurenceson, J., and Chai, J.C.H. (2003). Financial Reform and Economic.
10. Meo, S, A, K.(2014).ARDL with Cointegrating Bonds using EVIEWS9 . superior group
of colleges Lahor Pakistan.
11. Ministry of Planning and Development Cooperation.(2015). National Development Plan
(2010-2014)
12. Naftaly ,G.,and S, K.( 2014) . Effect of Government expenditure on economic growth in
East Africa adisaggregated model. European Journal of Business and Social Sciences. 3.
(8 ).
13. Alshahrani ,S. A ., and Ali, J.A.( 2014). Economic Growth and Government Expenditure
in Sudia Arabia An Emprical investigation. IMF Working Paper.3(14) .
14. Saleh, M. (2002). the philosophy of The general budget between the priority of stability
and construction of economic development. research and discussions of the Third
Scientific Conference of the Department of Economic Studies. House of Wisdom.
Baghdad.
15. Samurai, Y. M., and Abbas, Khudair, Z.(2013). Analysis of the effect of changes in tax
prices on tax revenues in the Iraqi tax system for the period 1995-2010. Anbar University
Journal of Economic and Administrative Sciences. 5 ( 10).

The relationship between … Hasan Radhi
71| Journal of the Arab American University. Volume (4). Number (2) /2018
نفطيقتصاد العراقي غير الالعلاقة بين الإنفاق الحكومي والناتج المحلي الإجمالي في الا
حسن راضي
ادبغد –كلية الهندسة بجامعة دجلة والمصرفية،قسم العلوم المالية
ص خلالم
سيي ذلحااييهذهيي ذال را .تييفذف ييعذال بقيي ذنييق ذاحكويي وذال تييولهذلالايي تلذالي اييهذاح ييي لهذفييهذالقفطيي ذال اقييهذ قيي ذالاو ييهذالورقيي فييهذهيي ذ
ليوفي ذن ذالاي تلذالي ايهذاح يي لهذ قي ذالاو يهذذي 2014-1990ت ورذاحكو وذال تيولهذاالسيفكبوذلالسيفري ريذفيهذالقفطي ذال اقيهذفيبةذالوفي ذا
سق سيي ذلن ذاكخويي ذفييهذالايي تلذالي اييهذاح ييي لهذد ييد ذفلييلذالدييي ذفييهذسيياووذالي ييفكا ذفييهذذ هييوذالير يي ذاليي ذد تييلذن ا ذالاصيي ذالقفطيي ذال اييه
دهذللي ذت وييمذلرس ي ذال للي ذفليلذلرس ي ذاللايي ذال فييذالياو، لك ل ذك ب ذاحكو وذالسفكبكهذلال ذييففذتيويايمذلي ذد تي ا ذذال توله احكو وذ
فليلذذليي ذلذدولايهذال تيوله سقا تلذنوضوحذفهذتو قفذلصيتا ذدي اذالفيواا ذالكقتايهذلياذات هي ذاحكوي وذذن لر ذله ا .دالذح بذاحكو وذالسفري ر ذ
كبوذلقيي ذحااييهذهيي ذال راسيي ذت ييورذاحكويي وذال تييولهذاالسييفذ .فيي ذالقفطيي ذليي ذدتييو ذقيي راذداييلذتابقيي ذال ايي ذال اييهذلب لفيي له .احكفيي ت ييوي ذق يي ذ
فييهذت دييدذالايي تلذنلذفصياك ذحذسق سي ذاحكوي وذال تولقيي ذفليلذللي ذ ذتيييهذ راسي ذك يي ذب حضيي ف ) .2014-1990لالسيفري ريذفيهذالقفطيي ذال اقيهذلاوفيي ذا
ذ قي لهذالاي تلذالي ايهذاح ييذلالسيفري ر ذفيهذهيذلقق سذنث ذاحكوي وذال تيولهذالسيفكبك(ARDLكيول ذالك ارذال اتهذذاسفخ االتفذ .الي اهذاح ي له
ي ذتييثق ذالا تلذالي اهذاح ي لهذ ق ذالاو هذدايلذاليي اذال وييمذلالقطيق ذفيهذحيق ذلذيوذلذالسفكبكهذلل ذن ذها وذدبق ذكبق ذنق ذالكو وذذالاو ه.
ذ نحييإذفلييلذل يوديي ذليي ذالسييفاف ذلاكيي ذ ييمذالقطييق .ذلقيي ذتو ييمذالبلي اييهذاح ييي لهذ قيي ذالاو ييهذفييهذاأفد يي نهذلبكويي وذالسييفري ر ذفييهذالايي تلذا
ت كقيي ذلييي ذاا ذفلندقبفكيي ذلالييي ذالفييهذذ2003فييهذالييي ذالفييهذسييبقهذديي اذلت وقييد ذكيييوذق ديي ذاحكفيي ذ قيي ذالاو ييهذذفييهالسييفري رذات ييفذنفيي ثق ذاللايي ق ذ
ذحييإذبييي ذدتييو ذاحكويي وذال تييولهذلو كيي ذك ييوذاأكصيي ذالفييهذتدييي ذفكف قيي ذالقفطيي ذلتييوف ذنق يي ذلبتييي ذلاصيي لنل ييلذالبذالخ ر قيي .ت ضييمذلاطيي ل ذ
ذفكص ذهقتمذفكف ذف ةذق رذدالذاسفق بذال ا .الق ذالخ صذل ذفبةذ
ي ا ا ذحا ذذ(ARDL)اكيرل ذذالاو، ري ر ذال توله ذالا تلذالي اهذاح ي لهذل ذ ل ذكو وذالسفاحذال توله احكو وذالسفكبكهذ المفتاحية:الكلمات
ذ ق ذالاو ق ذ.