THE RELATIONSHIP BETWEEN FREE CASH FLOWS …chss.uonbi.ac.ke/sites/default/files/chss/KINYANJUI...
62
THE RELATIONSHIP BETWEEN FREE CASH FLOWS AND INVESTMENTS OF FIRMS QUOTED AT THE NAIROBI SECURITIES EXCHANGE BY KINYANJUI MICHAEL M. D63/60249/2013 A RESEARCH PROJECT SUBMITTED IN PARTIAL FULFILLMENT OF THE REQUIREMENTS FOR THE DEGREE OF MASTER OF SCIENCE IN FINANCE OF THE UNIVERSITY OF NAIROBI 2014
Transcript of THE RELATIONSHIP BETWEEN FREE CASH FLOWS …chss.uonbi.ac.ke/sites/default/files/chss/KINYANJUI...
THE RELATIONSHIP BETWEEN FREE CASH FLOWS AND
INVESTMENTS OF FIRMS QUOTED AT THE NAIROBI
SECURITIES EXCHANGE
BY
KINYANJUI MICHAEL M.
D63/60249/2013
A RESEARCH PROJECT SUBMITTED IN PARTIAL
FULFILLMENT OF THE REQUIREMENTS FOR THE DEGREE OF
MASTER OF SCIENCE IN FINANCE OF THE UNIVERSITY OF
NAIROBI
2014

ii
DECLARATION
This research project is my original work and has not been presented in any other
examination body. No part of this research project should be produced without my
consent or that of the University of Nairobi.
Signature………………………..………. Date:…………………………………
Name: Kinyanjui Michael M.
REG: D63/60249/2013
DECLARATION
This research project has been submitted with the approval of the University of Nairobi
SUPERVISOR
Signature………………………………… Date…………………………………….…
Name: Mr. James M. Karanja
Lecturer, Department of Finance and Accounting
School of Business, University of Nairobi

iii
ACKNOWLEDGMENT
I would like to first and foremost thank God for sustaining me in the course of my studies
and enabling me complete this research project.
I would like to thank my entire family for their encouragement and being there for me
during this period. To also my friends and classmates for supporting me throughout the
course especially where matters of group work and revision were concerned.
I give special thanks to my supervisor Mr. James M. Karanja who worked closely with
me in developing this research project. I also wish to thank my lecturers and the whole
staff of the University of Nairobi for enriching my academic life.
May the Almighty God bless you all greatly!

iv
DEDICATION
This paper is dedicated to my Mother Mrs Lucy Kinyanjui for her support and
encouragement, and to my whole entire family for their support throughout the course.
To my nephew Andrew and nieces Nichole and Kimberly I encourage them to work hard
in school.

v
TABLE OF CONTENTS DECLARATION........................................................................................................................... ii
ACKNOWLEDGMENT ............................................................................................................. iii
DEDICATION.............................................................................................................................. iv
LIST OF TABLES ...................................................................................................................... vii
LIST OF CHARTS .................................................................................................................... viii
LIST OF ABBREVIATIONS ..................................................................................................... ix
ABSTRACT ................................................................................................................................... x
CHAPTER ONE: INTRODUCTION ..........................................................................................1
1.1 Background Information ........................................................................................................... 1
1.1.1 Free cash flows .................................................................................................................2
1.1.2 Investment decisions .........................................................................................................3
1.1.3 Effect of free cash flows on investments ..........................................................................4
1.1.4 Nairobi Securities Exchange (NSE) ..................................................................................4
1.2 Problem Statement .................................................................................................................... 5
1.3 Research Objective ................................................................................................................... 6
1.4 Value of the Study .................................................................................................................... 6
CHAPTER TWO: LITERATURE REVIEW .............................................................................8
2.0 Introduction ............................................................................................................................... 8
2.1 Theoretical Review ................................................................................................................... 8
2.1.1 Dividend policy related theories .......................................................................................8
2.1.2 Pecking order theory .........................................................................................................9
2.1.3 Agency Costs Based Theory .............................................................................................9
2.2 Determinants of investments of listed firms ........................................................................... 10
2.2.1 Real interest rates ............................................................................................................11
2.2.2 Exchange rate ..................................................................................................................11
2.2.3 Capital Stock ...................................................................................................................11
2.2.4 Dividend policy and Retention policy ............................................................................12
2.3 Empirical Review .................................................................................................................... 14
2.4 Summary of the Literature Review ......................................................................................... 22

vi
CHAPTER THREE: RESEARCH METHODOLOGY ..........................................................24
3.1 Introduction ............................................................................................................................. 24
3.2 Research Design...................................................................................................................... 24
3.3 The Population ........................................................................................................................ 24
3.4 Sampling Method .................................................................................................................... 24
3.5 Data Collection ....................................................................................................................... 25
3.6 Data Analysis .......................................................................................................................... 25
3.6.1 Research Model ....................................................................................................................25
CHAPTER FOUR: DATA ANALYSIS, RESULTS AND DISCUSSION .............................29
4.1 Introduction ............................................................................................................................. 29
4.2 General Findings ..................................................................................................................... 29
4.2.1 Net Capital Expenditure ..................................................................................................29
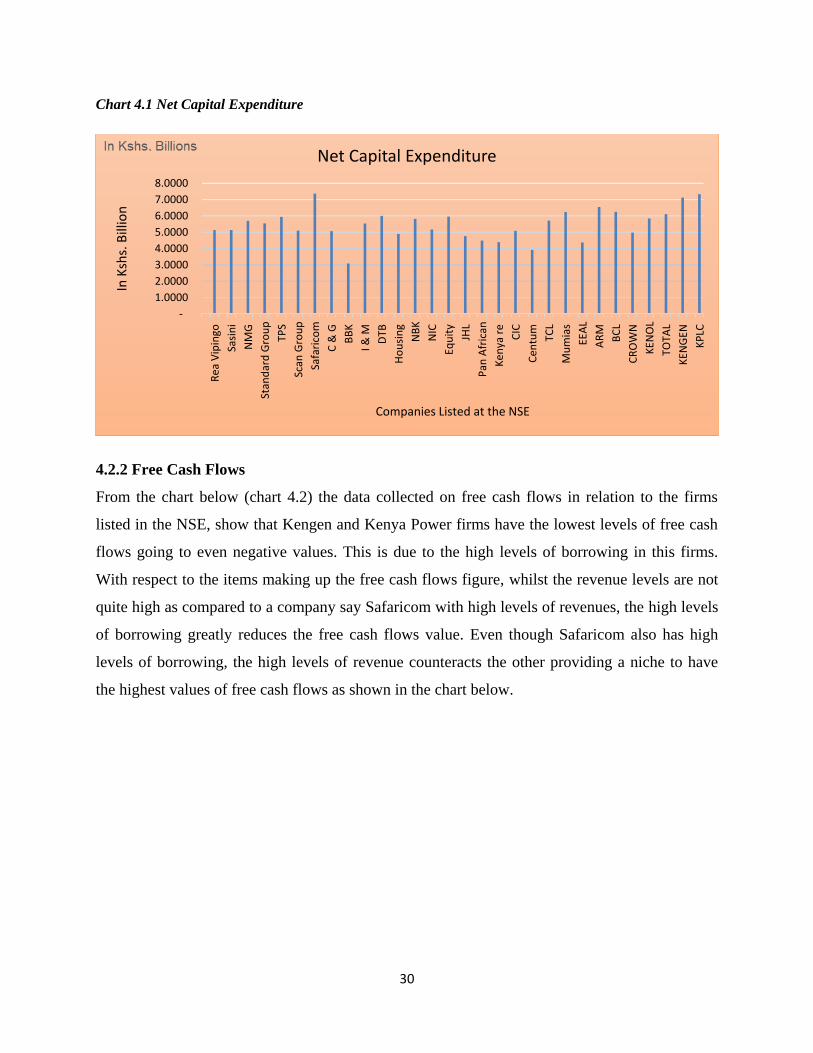
4.2.2 Free Cash Flows ..............................................................................................................30
4.2.3 Dividend Payout Ratio ....................................................................................................31
4.2.4 Depreciation ....................................................................................................................32
4.3 Correlation Analysis ............................................................................................................... 33
4.4 Regression Analysis and Hypothesis testing ......................................................................... 34
4.5 Summary ................................................................................................................................. 37
CHAPTER FIVE: SUMMARY, CONCLUSION AND RECOMMENDATIONS ...............39
5.1 Introduction ............................................................................................................................. 39
5.2 Summary ................................................................................................................................. 39
5.3 Conclusions ............................................................................................................................. 39
5.4 Recommendations ................................................................................................................... 40
5.5 Limitations of the Study.......................................................................................................... 41
5.6 Suggestions for Further Research ........................................................................................... 41
REFERENCES .............................................................................................................................42
APPENDIX 1 .................................................................................................................................45
APPENDIX II ................................................................................................................................46
APPENDIX III ...............................................................................................................................47

vii
LIST OF TABLES
Table 4.1: Correlation Matrix…………………………………………………….…..33
Table 4.2: Model Summary……………………………………………………….….34
Table 4.3: Analysis of Variance (ANOVA)…………………………………….……35
Table 4.4: Coefficients of Determination…………………………………………....35

viii
LIST OF CHARTS
Chart 4.1: Net Capital Expenditure …………………………………………………30
Chart 4.2: Free Cash Flows ………………………………………...………….……31
Chart 4.3: Dividend Payout Ratio …………………………………………..……....32
Chart 4.4: Depreciation……………………………………………………...……....32

ix
LIST OF ABBREVIATIONS
ANOVA - Analysis of Variance
CMA - Capital Markets Authority
DPR - Dividend Payout Ratio
FCF - Free Cash Flows
IMF - International Monetary Fund
MM - Modigliani and Miller
NCE - Net Capital Expenditure
NPV - Net Present Value
NSE - Nairobi Securities Exchange
RD - Research and Development
SPSS - Software Package for Statistical Analysis
x
ABSTRACT
The aim of this study was to establish the relationship between free cash flow and investments of
companies listed at the Nairobi Stock Exchange. Companies engage in various ways to finance
their investments, including equity financing (internally generated funds and externally raised
funds) and or debt. Free cash flow tempts managers to expand the scope of operations and the
size of the firm, these spending is seen as unprofitable especially to the shareholders, who see it
worthwhile for the firm to issue dividends instead of retaining the funds to invest. Capital
expenditure is strongly and positively associated to the level of free cash flow (the more free
cash flows a firm has, the more investments the firm can engage in. The study aimed at
determining the relationship between the level of free cash flow and the amount of extra cash
that can be committed on investment decisions by companies that are listed at the Nairobi Stock
Exchange. Data was obtained from annual statements of listed companies. The study covered a
five year period from 2009 to 2013. Multiple linear regression method was used to identify the
existence of the relationship. The regression model results point out that FCF have a positive
impact on Net Capital Expenditure. From the organizations considered, it was established that
there is a positive fairly significant relationship between free cash flows and investment that is as
the level of free cash flows increase, the level of investments increases. This study used only
three variables as the measures of the relationship between free cash flows and investments,
hence there is need to carry out the study with other different factors in order to be able to
establish whether there are other major factors that have a relationship with investments at the
NSE and in companies not listed at the NSE.
1
CHAPTER ONE:
INTRODUCTION
1.1 Background Information
The main objective of the firm is to maximize the shareholders wealth. In relation to financial
management this objective can be achieved by analyzing the two sides of the statement of
financial position. On the assets side, the focus is on adding value to the shareholders wealth by
taking advantage of investment opportunities that is projects that generate positive NPVs.
On the liability and capital side, the focus is maximizing value by reducing the cost of financing
the investments of the firm. Companies engage in various ways to finance their investments,
including equity financing (internally generated funds and externally raised funds) and or debt.
Internally generated funds refer to the retained earnings, which in relation to various factors
among them stage in the firm‟s life cycle (which depicts the dividend policy applied) determine
whether the retained earnings will be wholly distributed as dividends to shareholders, partly
distributed to the shareholders and partly utilized to investment or capital expenditure and or
wholly retained to be invested in projects that generate positive NPVs.
External equity financing or new equity unlike internally generated funds, attract a higher cost in
raising the funds (flotation costs), thus most firms first use the internal funds to finance firms
investments because its much cheaper, this is well explained by Myers, (1984) who states that
the pecking order theory maintains that businesses adhere to a hierarchy of fin
ancing sources and prefer internal financing when available, and debt is preferred over equity
if external financing is required (equity would mean issuing shares which meant 'bringing
external ownership' into the company). This clearly illustrates that the free internal funds can
first be used to finance the investment needs of the firm.
It should also be noted that, these internal funds can be prone to abuse by the managers who are
the custodians or agents of the shareholders, giving rise to the basic conflict of interest between
owners and managers that is the agency theory problem Jensen (1986) adds that free cash flow as
a cash in surplus of that necessary to fund all positive net present value projects. Free cash flow

2
tempts managers to expand the scope of operations and the size of the firm, thus increasing
managers' control and personal compensation, by investing free resources in projects that have
zero or negative net present values. These spending is seen as unprofitable especially to the
shareholders, who see it worthwhile for the firm to issue dividends instead of retaining the funds
to invest.
Modigliani and Miller (1958, 1961), hereafter referred to as MM, put forward the irrelevance
theorems, more commonly known as the MM theorems and these form the foundation of modern
corporate finance theory. The two main conclusions that are drawn from the MM theorems are
that firm value is dependent on its current and future free cash flow. Secondly, the level of
dividends (or dividend policy) does not affect firm value given that firms maximize their value
through investment. Whilst investment increases the value of future cash flows. The difference
between equity issued and payouts of the firm is equal to its free cash flow. Hence, dividend
policy is irrelevant when it comes to affecting firm value.
Free cash flow has always been a subject of great debate especially in the literature on the
determinants of investment.
1.1.1 Free cash flows
Richardson (2006) defines free cash flows as cash flows beyond what is necessary to maintain
assets in place and to finance expected new investments.
Subramanyam & John (2009) states that free cash flows also can be defined for the entire firm.
Specifically, free cash flows to the firm or simply free cash flows equal operating cash flows
(adjusted for interest expense and revenue) less investments in operating assets. They continue to
say that free cash flows to the firm reflects the added effects of investments and divestments in
operating assets. The appeal of the free cash flows to the firm concept is that it represents cash
that is free to be paid to both debt and equity holders.
Vogt (1997) expounds free cash flows as operating income before depreciation, less interest
expense on debt, less income taxes, less preferred and common dividends. FCF is a coverage
ratio representing the amount to which current period generated free cash flow is sufficient to
cover next period's capital expenditures.

3
Vogt (1997) continues to explain that free cash flow is the amount of cash that a company has
left over after it pays all of its expenses, including investments. Negative free cash flow is not
inevitably an indication of a bad company, however, since many young companies put a lot of
their cash into capital expenditure, which diminishes their free cash flow. Although if a company
is spending so much FCF, it should have a good grounds for doing so and it should be earning
high rate of return on its investments. While free cash flow doesn't receive as much attention as
earnings do, it is considered by some experts to be a better indicator of a company's financial
health.
Poulsen (1989) states that free cash flow is a cash flow in hand for giving out among all the
securities holders of an organization. They include: equity holders, debt holders, preferred stock
holders and convertible security holders.
Jensen (1986) tries to suggest that free cash flow is a cash flow in surplus of that necessary to
fund all projects that have positive net present value when discounted at the appropriate cost of
capital. When FCF is present and shareholder monitoring is imperfect, the typical manager-
shareholder agency problem arises. Managers have a tendency to overinvest (that is, invest in
negative-NPV projects) in order to capture the financial and non-financial benefits of increased
firm size.
1.1.2 Investment decisions
Investment decision refers to the process of determining which investment projects result in
maximization of shareholders value (Hermes et al., 2007). Several techniques have been
designed by researchers to aid in the calculation of expected return from promising investment
projects these are selected of potential investment. The commonly used technique is the Net
Present Value (NPV).
Investment decisions of a firm are generally known as the capital budgeting, or capital
expenditure decision. It is defined as the firm‟s decision to invest its current funds most in the
long-term assets in anticipation of an expected flow of benefits over a series of years it includes
expansion, acquisition, modernization and replacement of the long-term assets, sale of a division
or business (divestment), change in the methods of sales distribution, an advertisement

4
campaign, research and development programme and employee training, shares (tangible and
intangible assets that create value) (Pandey, 2005).
According to Modigliani (1958), investment in perfect capital markets decisions are independent
of financing decisions and, hence, investment policy only depends on the availability of
investment opportunities with a positive net present value. In the neoclassical model, companies
have unlimited access to sources of finance and investment, so firms with opportunities for
profitable investment that exceed their available cash flow would not be expected to invest any
less than firms with the same opportunities and higher cash flow, because external funds provide
a perfect substitute for internal resources.
1.1.3 Effect of free cash flows on investments
Capital expenditure is strongly and positively associated to the level of free cash flow (the more
free cash flows a firm has, the more investments the firm can engage in, also according to Vogt
(1997) the more a firm has free cash flows, the more the profitable capital expenditure projects
the firm can undertake), and free cash flow's influence on capital expenditure increases as firm
size decreases, (in that small firms gear towards rampant growth thereby using most or all their
free cash flows to invest in value adding projects) and as insider ownership increases.
Firms maximize their value through investment and this therefore is a motivation to the
managers who own shares of the company (as a measure to tame the agency problem) to invest
in projects that add value to the firm, which has a long-term or future perspective unlike issuing
dividends to shareholders which motivates for now but if invested in positive NPV projects can
increase the value of the firm and the shareholders wealth.
1.1.4 Nairobi Securities Exchange (NSE)
NSE is a market established in 1953 and licensed by the CMA with the main mandate of
regulating the security market and ensuring exchange of ownership of securities by bringing
borrowers and investors together at low cost. Regulation of the quoted firms is achieved by
ensuring that firms abide by the rules and regulations set by submitting their periodic
performance reports. Also, the NSE educates the general public on investment issues. The
products traded are securities which consist of shares/equities and bonds/debt investments.
5
The shares of sixty one companies listed at the NSE trade in the eleven sectors namely: -
agriculture, automobiles & accessories, banking, commercial, construction, energy & petroleum,
insurance, manufacturing & allied, telecommunication & technology industry, investment and
growth enterprise market segment (NSE, 2014).
1.2 Problem Statement
Some observers have pointed out that there exists a relationship between free cash flow and
investment. Hovakimian and Hovakimian (2005) observed that there is a positive relationship
between internal funds and investment decisions due to the liquidity constraints faced by firms as
a result of the gap between the cost of external financing and internal financing. In relation to
this, Alti (2003) showed that the relationship between cash flow and investments is stronger in
companies that are in growth stage, which is likely to experience financial difficulties because
the companies have to make adjustments between the investments made with generated cash
flow. Moreover it reflects the company's growth opportunities.
In contrast to the above, Bo Becker (2006) research explains that in frictionless financial
markets, investment does not depend on internal cash flows. In a large European data set, the
researcher finds that firms invest more on average when they have higher cash flow.
In relation to previous studies, investment and free cash flow are significantly related, though
both the strength of the relationship and its cause are the subject of much debate. There still
remains disagreement whether free cash flows and investment decisions are related, therefore,
this study intends to answer the research question, does the relationship exists between free cash
flows and investment made by the companies at the Nairobi Securities Exchange (NSE) in
Kenya?
According to Vogt (1997) the more a firm has free cash flows, the more the profitable capital
expenditure projects the firm can undertake. Consequently, capital expenditure is met with
positive shareholder reactions, particularly when spending is dependent on cash flow, mostly to
those who aspire for higher dividend in the future than those who want free cash flows
distributed as dividends now. He continues to explain that Negative free cash flow is not
inevitably an indication of a bad company, however, since many young companies put a lot of
their cash into capital spending, which diminishes their free cash flow. Although if a company is

6
spending so much FCF, it should have good grounds for doing so and it should be earning high
rate of return on its investments. While free cash flow doesn't receive as much attention as
earnings do, it is considered by some experts to be a better indicator of a company's financial
health.
Vogt (1994) explains FCF assumption that cash flow should influence capital spending. The
firms not paying dividends should demonstrate the strongest relationship between cash flow and
capital spending, while those paying high dividends should show the weakest relationship. With
this it‟s important to have a look at the relationship between free cash flows and investment of
the firms, whether positive or negative, and more so to do this study on publicly listed firms in
Kenya.
1.3 Research Objective
To establish the relationship between free cash flows and the investments made by the listed
companies at the Nairobi Securities Exchange (NSE).
1.4 Value of the Study
Firms will be able to know whether investment decisions wholly rely on the free cash flows of
the firm or not.
The research study will add to the field of knowledge and also the scholars will also benefit from
this study in their research process, to either fill the research gaps or contribute in their learning
process.
The paper will enable the investors to know the kind of information to be disclosed by firms on
the financial statements pertaining to free cash flows and investing decisions.
The conclusions will also bridge the knowledge gap that exists in the Finance field on free cash
flows and investing decisions.
It will also bridge the knowledge gap about the correlation between free cash flows and
investments made by the companies in the Nairobi Securities Exchange (NSE) in Kenya and add

7
to the literature on prior studies done on the concepts of free cash flows and investment decisions
made by the companies at the Nairobi Securities Exchange (NSE).

8
CHAPTER TWO:
LITERATURE REVIEW
2.0 Introduction
This chapter examines the literature relevant to the study. It follows the conceptual framework,
incorporate scholarly works that is the empirical evidence and theories. The rationale of the
study is to ascertain the relationship between free cash flows and investments. The literature
under review is obtained from journal articles, text books and websites.
2.1 Theoretical Review
2.1.1 Dividend policy related theories
The initial theory relating to Dividend policy was developed in 1958 by economists Franco
Modigliani and Merton Miller known as MM Theory. The Modigliani and Miller (1961) and
Miller (1977) result that firm value is independent of dividend policy has also been examined
extensively. Bhattacharya (1979) and others show that firm dividend policy can be a costly
device to signal a firm‟s state, and hence relevant, in a class of models, firstly, asymmetric
information about stochastic firm earnings, secondly, shareholder liquidity (a need to sell makes
firm valuation relevant), and thirdly deadweight costs (to pay dividends, refinance cash flow
shocks or cover under-investment). In a separating equilibrium, only firms with high anticipated
earning pay high dividends, thus signaling their prospects to the stock market. As in other costly
signaling models, why a firm would use financial decisions to reveal information, rather than
direct disclosure, must be addressed. As previously, taxes are another important friction which
affects dividend policy
Modigliani and Miller (1958, 1961), hereafter referred to as MM, put forward the irrelevance
theorems, more commonly known as the MM theorems and these form the foundation of modern
corporate finance theory. The two main conclusions that are drawn from the MM theorems are
that firm value is dependent on its current and future free cash flow. Secondly, the level of
dividends (or dividend policy) does not affect firm value given that firms maximize their value
through investment. Whilst investment increases the value of future cash flows. The difference
9
between equity issued and payouts of the firm is equal to its free cash flow. Hence, dividend
policy is irrelevant when it comes to affecting firm value.
Regarding the impact of dividend policy decision on investment, it is understood that firms
should take all projects with a positive Net Present Value (NPV). However, the issue is that if
management put more emphasis on dividend policy to such an extent that it eventually dominates
investment policy decisions, it could be argued that NPV projects or projects creating firm value
be cancelled or delayed for a later time. By cancelling or delaying positive NPV projects, this
will obviously have an adverse effect on the future expected profits of the company. Although
Fama (1974) carried out a research on the relationship between investment decisions and
dividend decisions. His findings revealed that investment decisions and dividend decisions are
not correlated; that these two types of decision making do not affect each other.
2.1.2 Pecking order theory
Pecking Order theory popularized by Myers (1984) tries to capture the costs of asymmetric
information. It states that companies prioritize their sources of financing (from internal
financing to equity) according to the law of least effort, or of least resistance, preferring to
raise equity as a financing means “of last resort”. Hence, internal financing is used first; when
that is depleted, then debt is issued; and when it is no longer sensible to issue any more debt,
equity is issued. This theory maintains that businesses adhere to a hierarchy of financing
sources and prefer internal financing when available, and debt is preferred over equity if
external financing is required (equity would mean issuing shares which meant 'bringing
external ownership' into the company). This clearly illustrates that the free internal funds can
first be used to finance the investment needs of the firm.
2.1.3 Agency Costs Based Theory
This is a kind of conflict that comes about when the owners of the business are separated from
the control of the business. Managers of firms may diverge from the goal of the owners which is
the maximization of the firm value. Instead, managers may choose to behave in way that will
satisfy their interest. This can be in the form of luxuriant office and cars, expensive travels,
extravagant benefits etc. (Jensen and Meckling, (1976))

10
The way to mitigate the chances of this kind of behavior from managers is by giving and or
increasing the ownership of managers in the firm they manage. Additionally, increasing the
debt level also helps to mitigate the loss of conflicts between owners/shareholders and
managers. Since debt forces managers to pay out cash, reducing the free cash. If the manager
has ownership in the firm, it puts her/him in a position of unwillingness to loosely spend the
firm‟s money. With this step (s)he will recognize and beware that the firm money (partly his
money) should be carefully managed. Free cash flow managers can waste on the perquisites.
(Jensen and Meckling, 1979; Niu, 2008) From other perspectives, this conflict arises because
managers may prefer short-term projects, which produce results early and enhance their
reputation quickly, rather than more profitable long-term projects. Managers may prefer less
risky investments and lower leverage to reduce the probability of bankruptcy.
Jensen (1986) adds that free cash flow as a cash in surplus of that necessary to fund all positive
net present value projects. Free cash flow tempts managers to expand the scope of operations and
the size of the firm, thus increasing managers' control and personal compensation, by investing
free resources in projects that have zero or negative net present values. These spending is seen as
unprofitable especially to the shareholders, therefore, an aspect of the basic conflict of interest
between owners and managers that is the agency theory problem. To mitigate this conflict the
manager should have ownership in the firm, it puts her/him in a position of unwillingness to
loosely spend the firm‟s money. With this step (s)he will recognize and beware that the firm
money (partly his money) should be carefully managed, therefore will invest this free cash
flows in projects with positive NPVs.
2.2 Determinants of investments of listed firms
The most important determinant of capital expenditure is cash flow. Capital expenditure is
strongly and positively associated to the level of free cash flow (the more free cash flows a firm
has, the more investments the firm can engage in, also according to Vogt 1997 the more a firm
has free cash flows, the more the profitable capital expenditure projects the firm can undertake),
and free cash flow's influence on capital expenditure increases as firm size decreases, in that
small firms gear towards rampant growth thereby using most or all their free cash flows to invest
in value adding projects.

11
In the IMF working paper Geng and N‟diaye (2012), the empirical analysis of the determinants
of investment indicates that financial variables such as interest rates and the exchange rate are
important determinants of corporate investment, others include: capital stock and dividend policy
or retention policy (not included in the paper).
2.2.1 Real interest rates
Rittenberg and Tregarthen (2014) state that real interest rates have a negative impact on
investment that is higher interest rates increase the cost of the borrowing used to finance most
types of investment expenditures this tends to reduce the quantity of investment, while lower
interest rates increase quantity of investment. According to Geng and N‟diaye (2012) at the
aggregate level, a 100 basis points increase in real interest rates reduces corporate investment in
China by about ½ percent of GDP. Based on these estimates, raising real interest rates to the
level of the marginal product of capital net of depreciation would probably lower investment by
about 3 percent of GDP. The estimated effect for China of real interest rates on investment is
much larger than the average of the other 52 economies in the panel. The estimated impact of
interest rates changes on corporate investment is about half as big when estimated based on the
firm-level data. This could possibly reflect the smaller reliance of this sample (which are large,
listed enterprises) on bank-intermediated financing.
2.2.2 Exchange rate
An exchange rate appreciation lowers investment and vice versa as the exchange rate depreciates
there is a corresponding increase in investments. As observed by Geng and N‟diaye (2012) a
10% percent appreciation would reduce total investment by around 1 percent of GDP. The large
concentration of manufacturing companies in the firm-level sample means that the estimated
impact of exchange rate appreciation from the firm-level data is much larger.
2.2.3 Capital Stock
According to Rittenberg and Tregarthen (2014) the quantity of capital already in use affects the
level of investment in two ways. First, because most investment replaces capital that has
depreciated, a greater capital stock is likely to lead to more investment; there will be more capital
to replace. But second, a greater capital stock can tend to reduce investment. That is because

12
investment occurs to adjust the stock of capital to its desired level. Given that desired level, the
amount of investment needed to reach it will be lower when the current capital stock is higher.
2.2.4 Dividend policy and Retention policy
Modigliani and Miller (1961), in which they challenged the common belief that payment of
dividend increases firm‟s value and argued that in perfect capital market a firm‟s dividend
decision does not affect its value. But on the other hand, Lintner (1962) and Gordon (1963)
supported “Bird-in-the-hand” theory and argued that in the world of uncertainty and imperfect
information, high dividend payment is associated with high firm value.
Miller and Modigliani (1961) presented the irrelevance proposition and proved that in a perfect
capital market firm‟s dividend decision is not a thing of value at all. During the last fifty years,
the enduring nature of debate on dividend policy has generated a rich body of literature in
which the majority of the researchers support that the payment of dividends has a positive
impact on firms‟ value but on the other hand many researchers have argued that payment of
dividends affect the firm‟s value negatively, still many others believe that dividend decisions is
not a thing of value and have no significant impact on firms‟ perceived financial position .
Firms with high cash flow volatility are also those with the greatest potential agency costs. When
cash flows are variable, it is difficult for investors to accurately attribute deviations in cash flows
to the actions of corporate managers or to factors beyond management‟s control. Thus, the higher
the expected variance in cash flows, the greater the potential agency costs, and the greater the
reliance on dividend distributions. The value of dividend payout as a guarantee against non-value
maximizing investments should be greatest for those firms with the greatest cash flow
uncertainty. Therefore, the agency cost theory predicts that firms with volatile cash flows would,
on average, pay out a greater proportion of their cash flows in the form of a dividend (Bradley et
al, 1998).
According to Jensen‟s (1986) Free Cash Flow Hypothesis, companies prefer to use their cash
resources to invest in profitable projects first and dividends are paid out of residual. Berle and
Means (1932), who first time introduced the concept of separation of ownership and
management, argued that the inefficient use of cash resources, in excess of profitable
13
investment opportunities by management, causes conflict of interest between ownership and
management. Dividend and interest payment reduces the free cash flow available to
management, hence reducing the chance of using it in less profitable projects or on managers‟
prerequisites. From companies‟ point of view, cash generated from operations plays an
important role in deciding the amount of payout, companies having greater cash flow generated
from operations are expected to be in a better position to pay cash dividends rather than
companies having negative operating cash flows.
In relation to the above, Mizuno (2007) agrees to the fact that a firm ought to pay dividends to
shareholders if it cannot identify suitable investments which would bring higher returns than
those expected by the shareholders.
From cash flow sensitivity point of view prior studies reported that financially constrained
firms accumulate higher cash holdings and retain greater portion of the cash earned during the
period, which means that liquidity is more important when firms cannot raise funds from
external market and liquid resources are required for investment in future profitable projects
(Khurana et. al., 2006). Almeida et. al. (2004) points out that firms facing financial constraints
will save more cash today to fund future investment opportunities. Intuitively, increasing
tendency of saving cash out of free cash flows will indicate the availability of profitable
projects and financial constraints and hence will reduce the payout ratio of the firm, provided
that firms‟ access to external finance is limited to a certain level.
The payment of cash dividends to shareholders now is the opportunity cost of retaining the
internal funds and investing the same in projects that have positive NPV that have greater
returns to the shareholders in the future. This is influenced by the shareholders view that is
largely explained by the „bird in hand‟ theory, where the shareholder perceives the uncertainty
of the future cash flows, which have a risk aspect in them. According to Amidu (2007) the bird
in hand theory proposes that a relationship exists between firm value and dividend payout. It
states that dividends are less risky than capital gains since they are more certain. Investors
would therefore prefer dividends to capital gains.
According to Farsio et al. (2004) firms that pay high dividends without considering investment
needs may therefore experience lower future earnings, also firms that consider investment
14
needs that have prospects of maximizing the shareholders wealth, either retain all internally
generated funds or issue low dividends. This shows that there is a negative relationship
between dividend payout and future earnings.
2.3 Empirical Review
This section discusses studies which have been conducted locally and internationally, which
examines the relationship between free cash flows and investments.
Financing capital expenditure by utilizing the internally generated cash flow is highly
recognized. According to Myers (1984) states that companies prioritize their sources of
financing (from internal financing to equity) according to the law of least effort, or of least
resistance, preferring to raise equity as the last financing means. Hence, internal financing is
used first; when that is depleted, then debt is issued; and when it is no longer sensible to issue
any more debt, equity is issued.
Modigliani and Miller‟s (1958) insignificance suggestion asserts firms to carry out all positive
net present value (NPV) investments regardless of the financing source. Jensen (1986) adds that
free cash flow as a cash in surplus of that necessary to fund all positive net present value
projects. Free cash flow tempts managers to expand the scope of operations and the size of the
firm, thus increasing managers' control and personal compensation, by investing free resources
in projects that have zero or negative net present values. These spending is seen as unprofitable
especially to the shareholders, therefore, an aspect of the basic conflict of interest between
owners and managers that is the agency theory problem.
Free cash flow is inconsistent with the goal of owner to maximize their wealth. Expansions
wasted by administration instead could have been distributed to the owners or stock holders as
cash dividends or to the policyholders of mutual or stock firms in the form of lower premiums,
higher policy dividends, or higher investment returns. The existence of free cash flow provides
managers with an opportunity to waste cash on unprofitable capital spending. These unprofitable
capital expenditure represents an incremental cost of the owner-manager conflict (Jensen, 1986).
15
With the previous paragraphs raising the issue of abuse of free cash flows, Jensen (1986) gives a
remedy stating that the majority of existing evidence on the free cash flow hypothesis focuses on
changes in financial structure. Leveraged buyout activities are one way of controlling free cash
flow because the debt incurred in such transactions forces managers to pour out excess cash. It
examines the cross-sectional relation between free cash flow and ownership structure and finds
some evidence that organizational forms specific to the oil industry (corporations, limited
partnerships, and royalty trusts) have different agency costs of free cash flow. Specifically, the
Capital spending of free cash flow is lower in royalty trusts and limited partnerships than in
corporations.
Vogt (1994) explains important implications for both investors and managers. While the study
shows that cash flow-financed capital expenditure is marginally unproductive for some firms, the
potential sources of this inefficiency have also been identified. Cash flow-financed growth by
large, low-dividend firms tends to be value-destroying, while cash flow-financed growth is
value-creating for small, low-dividend firms. The importance of dividends as a method of
mitigating agency costs of free cash flow, moreover, is confirmed. Managers of free cash flow-
rich companies may consider increasing dividend payouts as a method of increasing the
efficiency of their capital spending decisions. A continued high-dividend-payout policy may also
signal to shareholders that additional and costly monitoring of capital expenditure decisions is
unnecessary.
Jensen's (1986) theory predicts that capital spending of equity is partly driven by free cash flow.
Previous research indicates that the agency problems between owners and managers are greater
in mutual organizations than in stock organizations, which leads to the expectation that the free
cash flow problem will be greater in mutual insurers than in stock insurers. (Jensen, 1986)
Jensen‟s (1986) observations test for differences in free cash flow in capital spending automobile
insurance industry. The purpose is to examine whether organizational form affects managerial
behavior with respect to the holding of free cash flow rather distributing or investing.
Gentry (1990) analyzed capital spending with total cash outflow and found out that the
percentage of cash outflows going to capital investment ranged from an outflow of 60 per cent or
16
more. The giant companies invested a higher percentage of their total outflow in plant and
equipment than companies in the other size categories. The small companies invested the lowest
percentage of their total outflows in capital.
Research was applied to agricultural firms by Farrell E. Jensen (1993) which showed that results
are consistent with previous studies for non-agricultural firms which show that internal cash flow
variables are important in explaining investment. Result indicate that internal cash flow variables
are important and that the addition of internal cash flow variables can improve the explanatory
power of agricultural investment models. In terms of elasticity, investment was more responsive
to internal cash flow variables.
Vogt (1994) explains the relationship of cash flow and capital expenditure by analyzing the free
cash flow theory of Jensen‟s (1986) and find outs that, since monitoring is costly, and managers
can benefit from over investment, cash flow will significantly influence capital spending after
controlling for the cost of capital. Capital expenditure of firms not paying dividends will be more
influenced by cash flows than investment spending of firms that pay dividends. This follows
because no-dividend firms are able to retain all cash flow and still not reach the retention
constraint.
Vogt (1994) explains free cash flow assumption that cash flows should influence capital
spending. The firms not paying dividends should demonstrate the strongest relationship between
cash flow and capital expenditure, while those paying high dividends should show the weakest
relationship.
Vogt (1994) explains the case of capital expenditure, the observed results tend to support the free
cash flow description of the cash flow/capital expenditure relationship. Actions that supports the
free cash flow assumption, however, it is found in small firms paying low dividends. In the case
of Research and development expenditure, results are more reliable with the free cash flow
assumption. These results together suggest that the effect that cash flow-financed investment has
on firm value depends on asset size, dividend behavior, and the type of capital expenditure.
Vogt (1997) explains the strong influence that free cash flow has on capital expenditure is well
documented. On the free-cash-flow hypothesis of Jensen (1986) as explanations for the

17
importance of free cash flow on capital expenditure. Initial results expose relations similar to
those uncovered in previous studies. Capital expenditure is associated with positive and
statistically significant with free cash flow. Firms with favorable investment opportunities are
responsible for much of the positive, excess returns. Also, for firms announcing spending
increases, the level of announced capital expenditure is positively and strongly related to the
level of cash flow. The power of this relation increases for firms with profitable capital
expenditure opportunities, as firm size declines, and as the proportion of insider ownership
increases. Further analysis suggests that considerable diversity exists in the capital market's
response to cash-flow-financed capital expenditure.
Vogt (1997) research‟s result indicate a positive and significant excess returns found in the
sample announcing increases is concentrated in the smallest of the sample firms, in firms with
low cash flow relative to capital expenditure, and, to a lesser extent, in firms with high levels of
insider stock ownership. Tests elaborating the cross-sectional variation in returns disclose that
excess returns for medium and small firms in the sample are positively associated with
unexpected increases in planned spending. These tests also recommend that the market reacts
more favorably to announced capital expenditure by small firms when the planned spending is
more dependent on free cash flow. Conversely, excess returns for the largest firms in the sample
are negative, though not statistically significant. Cross-sectional regressions specify that large
firms have, excess returns and are negatively related to the extent that undistributed free cash
flow is available to finance planned capital spending, and positively related to their capital
spending opportunities.
These results are consistent with the hypothesis that small firms follow a free cash flow model
like the one described by (Myers, 1984; Myers and Majluf, 1984). Because small firms and large
firms are the most likely to face the liquidity constraints associated with asymmetric information,
they are also the most likely to forgo profitable investment expenditure in times of cash-flow
shortages. As free cash flow rises, the set of profitable capital expenditure projects the firm can
undertake also increases. Consequently, capital expenditure is met with positive shareholder
reactions, particularly when spending is dependent on cash flow.

18
Vogt (1997) finds some indication that is reliable with the free- cash-flow hypothesis. Excess
returns are negatively related to large firm‟s ability to cover capital spending with cash flow.
This is consistent with the FCF hypotheses. This apparent diversity in the market's response to
capital spending decisions suggests different capital-spending financing policies for firms that
seek to enhance shareholder value. Small firms with sizeable insider ownership and firms that
are generally cash-flow constrained appear to be enhanced, on average, by financing capital
spending with free cash flow. These firms might consider policies of conserving undistributed
cash flow through low payout and leverage policies, thus encouraging new capital spending from
internally generated funds. No evidence that free cash flow financed capital spending improves
these firms' market values, on average. Furthermore, limited indication exists that such a
financing strategy could reduce market value for large, low insider owned, and cash flow rich
firms.
Vogt (1994) suggests that cash flow-financed capital spending is marginally inefficient and
provides primary evidence in support of the FCF hypothesis. The negative relationship found in
the aggregate data is concentrated in firms paying low dividends over the sample period, in large
firms, and most strongly in large firms paying low dividends.
According to Worthington (1995) cash flows measures enter industry level investment equations
positively and significantly, even after investment opportunities are proxied by capacity
utilization variables. The effect of cash flow is greater in durable goods industries than in non-
durable goods industries.
Klaus et al. (2004) tested the following hypothesis first asymmetric information (AI) hypothesis
which predicted that firms underinvest and have returns on investment greater than their costs of
capital, and second the managerial discretion (MD) hypothesis which predicts overinvestment
and returns on investment less than the costs of capital, using the ratio of returns on investment
to costs of capital for each firm is a natural way to make this identification.
Moyen (2004) explained the fact that the cash flow sensitivity of firms described by the
constrained model is lower than the cash flow sensitivity of firms described by the unconstrained
model can be easily explained. In both models, cash flow is highly correlated with investment

19
opportunities. With more favorable opportunities, both constrained and unconstrained firms
invest more.
Aggarwal (2005) started a study on four controlling for the investment opportunity set, and he
concluded investment levels are significantly positively influenced by levels of internal cash
flows. The strength of this association generally increases with the level of financial constraints
faced by firms. Overall, these findings seem strong to the nature of the financial system and
indicate that most firms operate in financially incomplete and imperfect markets and find
external finance to be less attractive than internal finance.
Becker and Sivadasan (2006) concluded for their research paper that in frictionless financial
markets, investment does not depend on internal cash flows. In a large European data set, results
indicate that firms invest more on average when they have higher cash flow. Contribution to the
literature is being made by testing formally if the coefficient on internal resources (cash flow) is
related to a country‟s financial development. Comparing countries, it is further discovered the
cash flow effect is indeed stronger in countries with weaker financial development. This suggests
that financial constraints are strongest when financial development is low.
Vogt (1994) gives an explanation on free cash flow, however, is still a significant variable in the
capital expenditure behavior of small, low-payout firms. The constraint predicts, less than those
associated with the larger firms in the low-payout group, is still highly significant. Consequently,
the asymmetric information induced free cash flow assumption explanation cannot be dismissed.
The most reasonable argument is that both free cash flow and asymmetric information are
important factors contributing to the influence of cash flow on capital spending.
Vogt (1994) explains different incentives that Research and development and capital expenditure
may generate for managers over time. Research and development represents an expenditure on
intangible assets whose impact on the asset size and future cash flows of the firm is extremely
uncertain and secondly not likely to be realized in the near future. Fixed plant and equipment
expenditure is likely to produce more certain cash flows in the near future (in part because of
accelerated depreciation allowances) as well as increase the tangible asset base of the firm. The
effect of plant and equipment expenditure is to generate free cash flow that can be used in the

20
next period. Consequently, capital expenditure may be more susceptible to free cash flow
problems than research and development expenditure.
According to Mizen (2005) the relationship between cash low and investment are based on
sample-splitting between constrained and unconstrained firms taken from a single country. The
degree of sensitivity appears to be greater. It extends the literature by examining from a number
of perspectives the behavior of firms. The research article proposes a number of hypotheses that
are explored in turn. A first possible reason is that firms in market-oriented financial systems
show greater sensitivity to cash flow because borrowers and lenders operate at arms-length
compared to those in relationship-oriented systems. A second possible cause for differences in
response to cash flow across countries is that the samples of firms taken from each country might
differ in composition with respect to particular characteristics, for instance size. Equally, the
industrial type may be an important determinant of investment sensitivity to cash flow since
industries differ considerably in terms of the size of firms, capital-intensity, borrowing capacity,
openness and the durability of their output.
Whilst investment is measured by capital expenditure, the same is deflated by the capital stock.
Investment cash flow sensitivity is defined as the level of the company's financial constraints.
Cash flow sensitivity of investment reflects higher cost of external financing relative to internal
financing due to asymmetric information or agency problem. Other studies show a relationship
between cash flow sensitivity and financing constraints are sensitive to how the company is
classified into two groups who are financially constrained and non-financially constrained.
Fazzari et al (1998) stated that in addition to the opportunity to grow, investment by companies
as well affect the company's cash flow and more will further reduce the company's dividend
payment.
Hovakimian and Hovakimian (2005) concluded that there is a positive relationship between
internal funds and investment decisions due to the liquidity constraints faced by firms as a result
of the gap between the cost of external financing and internal financing. The results Alti (2003)
showed that the relationship between investment and cash flow is stronger in companies that are
in growth stage, which is likely to experience financial difficulties because the companies have

21
to make adjustments between the investments made with generated cash flow. Moreover it
reflects the company's growth opportunities.
Alti (2003) continues to expound that investment is sensitive to cash flow, even after controlling
for its link to profitability by conditioning market. Furthermore, the sensitivity is substantially
higher for young, small firms with high growth rates and low dividend payout ratios, as it is in
the data. The uncertainty these firms face about their growth prospects amplifies the investment-
cash flow sensitivity in that, the uncertainty is resolved in time as cash flow realizations provide
new information about investment opportunities. This makes capital expenditure highly sensitive
to free cash flow surprises.
Gentry (1990) tells about free cash flow analysis shows that the financial health of a company
depends upon its ability to generate net operating cash flows that are sufficient to cover a
hierarchy of cash outflows. The profiles generated from a large sample of companies show that
relative cash flow components vary across company size and across industry groups. The
researcher hopes that these profiles will serve as benchmarks for comparing cash flow
components and encourage financial analysts to use cash flow analysis.
Bo Becker (2006) research explains that in frictionless financial markets, investment does not
depend on internal cash flows. In a large European data set, the researcher finds that firms invest
more on average when they have higher cash flow. The researcher contributes to the literature by
testing formally if the coefficient on internal resources that is cash flow is related to a country‟s
financial development. Comparing with different countries, the researcher finds that the cash
flow effect is indeed stronger in countries with weaker financial development. This suggests that
financial constraints are strongest when financial development is low. The effect is weaker inside
conglomerates and is probably not driven by the East-West difference. This is consistent with the
idea that conglomerates ease internal financial constraints. Industries with few low liquid assets
may experience bigger benefits of financial development (i.e. the cash flow coefficient is
reduced more by financial development in low liquidity industries). However, the proof for this
is diverse. Our findings suggest that financial frictions operate in Europe. They suggest that
financial development is beneficial because it reduces financial constraints at the firm level and
therefore relaxes the correlation between internal resources and investment.
22
An important implication of adverse selection is that firms with positive NPV investment
opportunities will forgo profitable projects to avoid the excessive cost of external financing. This
implication has been explored in detail by Fazzari et al. (1998) for capital spending and
Himmelberg and Peterson (1994) for research and development spending. These authors show
formally that the excess cost of external finance causes some firms to be liquidity constrained, so
that cash flow becomes an important determinant of investment spending.
In an in depth study of 25 large firms, Gordon Donaldson (1961) concludes that management
strongly favored internal generation as a source of new funds even to the exclusion of external
funds except for occasional unavoidable „bulges‟ in the need for new funds. A more recent
survey of 176 corporate managers by Pinegar and Wilbricht (1989) also finds that managers
prefer cash flow over external sources to finance new investment; 84.3 percent of sample
respondents indicate a preference for financing investment with cash flow.
2.4 Summary of the Literature Review
The two main conclusions that are drawn from the MM theorems are that firm value is dependent
on its current and future free cash flow. Secondly, the level of dividends (or dividend policy)
does not affect firm value given that firms maximize their value through investment. Whilst
investment increases the value of future cash flows. With regards to the impact of dividend
policy decision on investment, it is understood that firms should take all projects with a positive
Net Present Value (NPV). However, the issue is that if management put more emphasis on
dividend policy to such an extent that it eventually dominates investment policy decisions, it
could be argued that NPV projects or projects creating firm value be cancelled or delayed for a
later time. By cancelling or delaying positive NPV projects, this will obviously have an adverse
effect on the future expected profits of the company.
In relation to the agency theory problem and its relevance to free cash flow-investment
relationship Jensen and Meckling (1976) suggests the way to mitigate the chances of this kind
of behavior from managers is by giving and or increasing the ownership of managers in the
firm they manage. If the manager has ownership in the firm, it puts her/him in a position of
unwillingness to loosely spend the firm‟s money. With this step (s)he will recognize and
beware that the firm money (partly his money) should be carefully managed. Therefore

23
managers will see to it that they utilize the free cash flows by investing in positive NPV
projects that maximize the firm‟s value.
The Pecking Order theory popularized by Myers (1984) tries to capture the costs of
asymmetric information. It states that companies prioritize their sources of financing (from
internal financing to equity) the theory maintains that businesses adhere to a hierarchy of
financing sources and prefer internal financing when available, and debt is preferred over
equity if external financing is required (equity would mean issuing shares which meant
'bringing external ownership' into the company). This clearly illustrates that the free internal
funds can first be used to finance the investment needs of the firm.
The kind of conflict that comes about when the owners of the business are separated from the
control of the business. Managers of firms may diverge from the goal of the owners which is the
maximization of the firm value. Instead, managers may choose to behave in a way that will
satisfy their interest. This can be in the form of luxuriant office and cars, expensive travels,
extravagant benefits etc. (Jensen and Meckling, 1976). The way to mitigate the chances of this
kind of behavior from managers is by giving and or increasing the ownership of managers in
the firm they manage. If the manager has ownership in the firm, it puts her/him in a position of
unwillingness to loosely spend the firm‟s money. With this step (s)he will recognize and
beware that the firm money (partly his money) should be carefully managed. Therefore the
managers will faithfully utilize the free cash flows by investing in projects that add value to the
portfolio of the shareholders.
In Kenya, few research studies relating to investment decisions have been done, but clear
research study on the relationship between free cash flows and investments has not been carried
out in Kenya, therefore this research seeks to fill this gap by doing this research study on firms
listed at the Nairobi Securities Exchange. The focus is on free cash flows although they have not
receive as much attention as earnings do, they are considered by some experts to be a better
indicator of a company's financial health.
24
CHAPTER THREE:
RESEARCH METHODOLOGY
3.1 Introduction
The main purpose of the study was to find out the relationship between free cash flows and
investment decisions of quoted companies at the NSE. This chapter discusses the research
design, population of the study, sampling design, data collection, research models and data
analysis.
3.2 Research Design
This research study adopted the descriptive research design. This design gives a description of
phenomenon, characteristics and association of the research variables. It is appropriate for the
study as it will enable high level analysis such as correlation and regression analysis that will
allow to establish the nature and the extent of the relationship between free cash flows and
investment decisions of quoted companies at the NSE. Quantifiable data was collected to
determine the current status of the relationship. The research design employed secondary
quantitative data. The data was obtained from the current financial reports of the companies
listed at the NSE.
3.3 The Population
The population of the study covered companies listed at the NSE (See Appendix I). NSE (2014)
provided that there are a total of sixty one companies listed, therefore our population size will be
these sixty one listed companies.
3.4 Sampling Method
A sample of thirty companies (See Appendix I) that have been quoted for the five years (2009 –
2013) will be considered from the population. The sample was selected by randomly picking a
company from each sector or industry of firms listed in the NSE.
Simple random sampling will be used to select the sample from the population, for the technique
minimizes bias and increases the chances of representativeness. Mugenda & Mugenda (2003)
suggested that for correlation research, 30 cases or more are required. Since this study involved
25
determining the relationship between free cash flows and investments, a sample of 30 firms
listed at the NSE was considered sufficient.
3.5 Data Collection
The secondary data was extracted from the audited annual reports and financial statements of
individual companies sourced from the NSE and the CMA. In order to determine the relationship
that exists between free cash flows and investment decisions of companies quoted at the NSE, a
period of five years (2009 – 2013) was considered. Data collected was classified as per sectors of
the individual sampled companies. Group consolidated annual reports and financial statements
were considered since they portrayed overall performance of a firm unlike the company‟s
financial statements which show part performance of a company in a given region. The annual
financial statements included the statements of comprehensive income, financial position, cash
flows, changes in equity and the notes to the financial statements.
3.6 Data Analysis
The data collected for this study was cleaned, edited and tested for completeness. This was done
to ensure that the data used was adequately reflective, accurate and reliable for conclusion and
realization of the research objective of this study. SPSS software was used to carry out the
analysis of the data obtained. The researcher used the multiple linear regression analysis
technique, a statistical tool that was used to analyze the association between a dependent variable
and several independent variables. According to Hair (2006) the objective of multiple linear
regression analysis is to use the independent variables whose values are known to forecast the
single dependent value selected by the researcher.
The data was presented in form of tables and charts where appropriate. The study used three
independent variables. The researcher constructed a regression model to analyze the reliance
investments (the dependent variables) on the independent variable outlined below.
3.6.1 Research Model
The model adopted by this study was the multiple linear regression model. This is a technique
that allows many factors to enter the analysis separately so that the effect of each can be
26
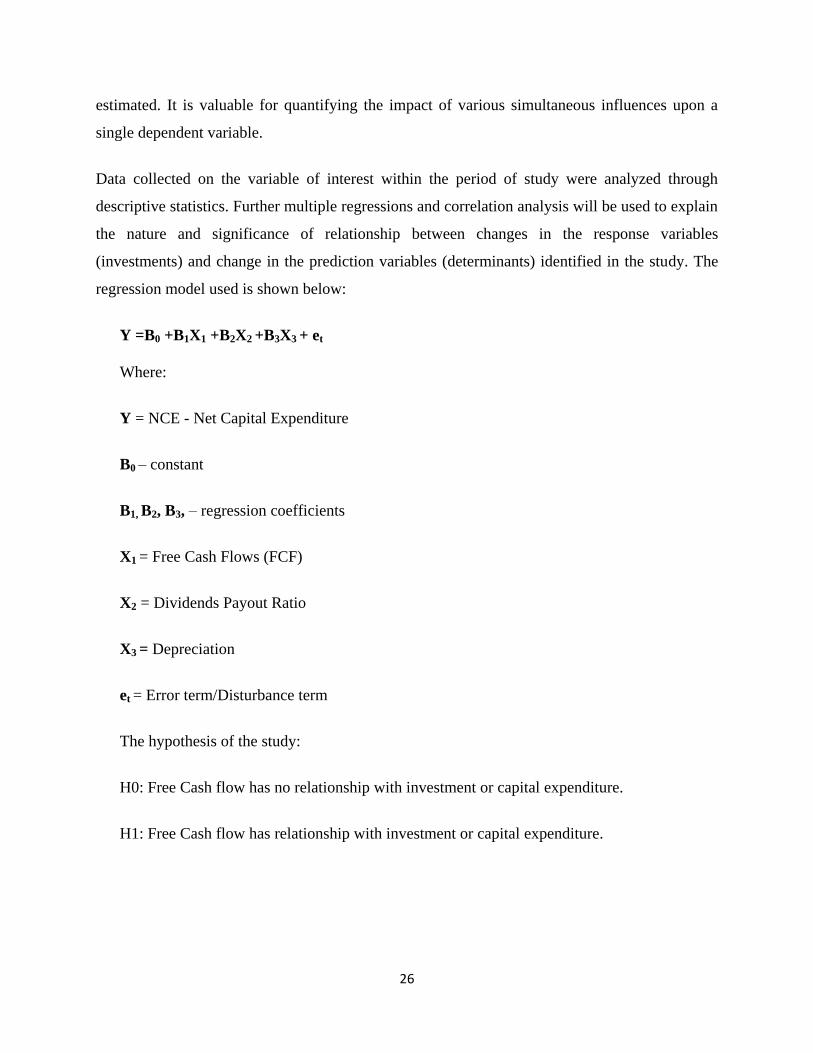
estimated. It is valuable for quantifying the impact of various simultaneous influences upon a
single dependent variable.
Data collected on the variable of interest within the period of study were analyzed through
descriptive statistics. Further multiple regressions and correlation analysis will be used to explain
the nature and significance of relationship between changes in the response variables
(investments) and change in the prediction variables (determinants) identified in the study. The
regression model used is shown below:
Y =B0 +B1X1 +B2X2 +B3X3 + et
Where:
Y = NCE - Net Capital Expenditure
B0 – constant
B1, B2, B3, – regression coefficients
X1 = Free Cash Flows (FCF)
X2 = Dividends Payout Ratio
X3 = Depreciation
et = Error term/Disturbance term
The hypothesis of the study:
H0: Free Cash flow has no relationship with investment or capital expenditure.
H1: Free Cash flow has relationship with investment or capital expenditure.
27
Measurement of variables
The equation:
Dependent Variable = Independent Variable, that is a change in Fixed Assets is equal to Free
Cash Flow. The control variables in this case include: dividends payout and capital stock or
depreciation. Where the:
i) Independent Variable = Free Cash Flow (FCF)
ii) Dependent Variable = Net investment or Net capital expenditure
Vogt, 1997 explains free cash flow, as operating income before depreciation, less interest
expense on debt, less income taxes, less preferred and common dividends. FCF is a coverage
ratio representing the amount to which current period generated free cash flow is sufficient to
cover next period's capital expenditures. Free cash flow was determined as follows:
FCF = Operating Income + Depreciation – Interest Expense – Income Taxes – Expected loan
(less repayment) – Dividends
Dividends payout = Dividend per Share / Earnings per Share
Depreciation = ((Initial asset cost-terminal value)/economic useful life)
Capital expenditure was considered as funds spent by a company to buy or upgrade fixed
assets, such as equipment, during the year and acquiring subsidiaries. It was also considered
as a payment by a business for basic assets such as property, fixtures, or machinery, that is an
increase in the value of company assets and is usually intended to improve productivity but
not for day-to-day operations such as payroll, inventory, maintenance and advertising.
Net Capital Expenditure = (Current Year – Previous Year)
The greatest advantage with regression analysis was that the parameters were estimated to
show causality between explanatory variables and regressors. Parameters estimated suggest
magnitude and direction the independent variables have on the explanatory variables. In
order to test the significance of the model in measuring the relationship between independent
and dependent variable, this study conducted an Analysis of Variance (ANOVA). On

28
extracting the ANOVA statistics, the researcher looked at the significance value. The study
was tested at 95% confidence level and 5% significant level. If the significance number was
found to be less than the critical value set, then the conclusion will be that the model is
significant in explaining the relationship.

29
CHAPTER FOUR:
DATA ANALYSIS, RESULTS AND DISCUSSION
4.1 Introduction
This chapter presents the findings derived from data collected and further analyzed. The
analyzed data is presented in tables and charts in terms of derived means, frequencies,
percentages and proportions where necessary. Explanations of the findings are discussed after
each table. The chapter constitute of the general findings of various variables on free cash flows
and investments, the relationship between free cash flows and investments of companies quoted
at the NSE and finally the overall summary of the findings.
4.2 General Findings
This section details the findings of various variables analyzed. Descriptive statistics was used to
analyze the data collected and presented in tabular form (See Appendices II). A sample of thirty
companies quoted at the Nairobi securities exchange (NSE) was used.
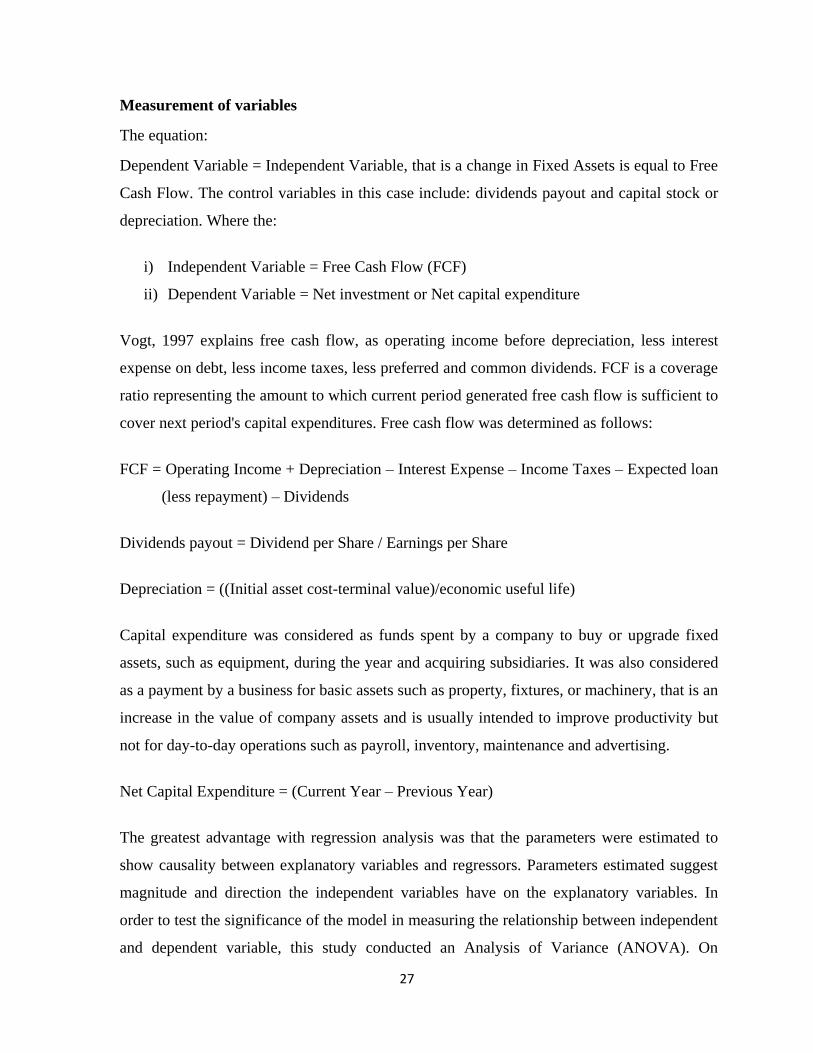
4.2.1 Net Capital Expenditure
The summary of the data collected on Net Capital Expenditure is represented in the chart below
(chart 4.1) in relation to the companies quoted in the NSE. From the sample of thirty companies,
it shows that safaricom has the highest values of net capital expenditure. This is due to the high
investment in property plant and equipment, and other telecommunication items, the same case
goes to Kengen and Kenya power companies. The chart shows that Barclays bank has the lowest
values of net capital expenditure, although the bank did acquire assets but not as much as the
other companies. It is clear that investments, which in this case are represented by net capital
expenditure differs from company to company depending on the nature of business and sector
under operations. It also depends on the stage in company cycle for example at start up and
growth stages companies tend to engage in vigorous investment activities unlike at maturity and
post maturity stages where companies do not necessarily engage in extensive investment
projects.
30
Chart 4.1 Net Capital Expenditure
4.2.2 Free Cash Flows
From the chart below (chart 4.2) the data collected on free cash flows in relation to the firms
listed in the NSE, show that Kengen and Kenya Power firms have the lowest levels of free cash
flows going to even negative values. This is due to the high levels of borrowing in this firms.
With respect to the items making up the free cash flows figure, whilst the revenue levels are not
quite high as compared to a company say Safaricom with high levels of revenues, the high levels
of borrowing greatly reduces the free cash flows value. Even though Safaricom also has high
levels of borrowing, the high levels of revenue counteracts the other providing a niche to have
the highest values of free cash flows as shown in the chart below.
-
1.0000
2.0000
3.0000
4.0000
5.0000
6.0000
7.0000
8.0000
Rea
Vip
ingo
Sasi
ni
NM
G
Stan
dar
d G
rou
p
TPS
Scan
Gro
up
Safa
rico
m
C &
G
BB
K
I & M
DTB
Ho
usi
ng
NB
K
NIC
Equ
ity
JHL
Pan
Afr
ican
Ken
ya r
e
CIC
Cen
tum
TCL
Mu
mia
s
EEA
L
AR
M
BC
L
CR
OW
N
KEN
OL
TOTA
L
KEN
GEN
KP
LC
In K
shs.
Bill
ion
Companies Listed at the NSE
Net Capital Expenditure
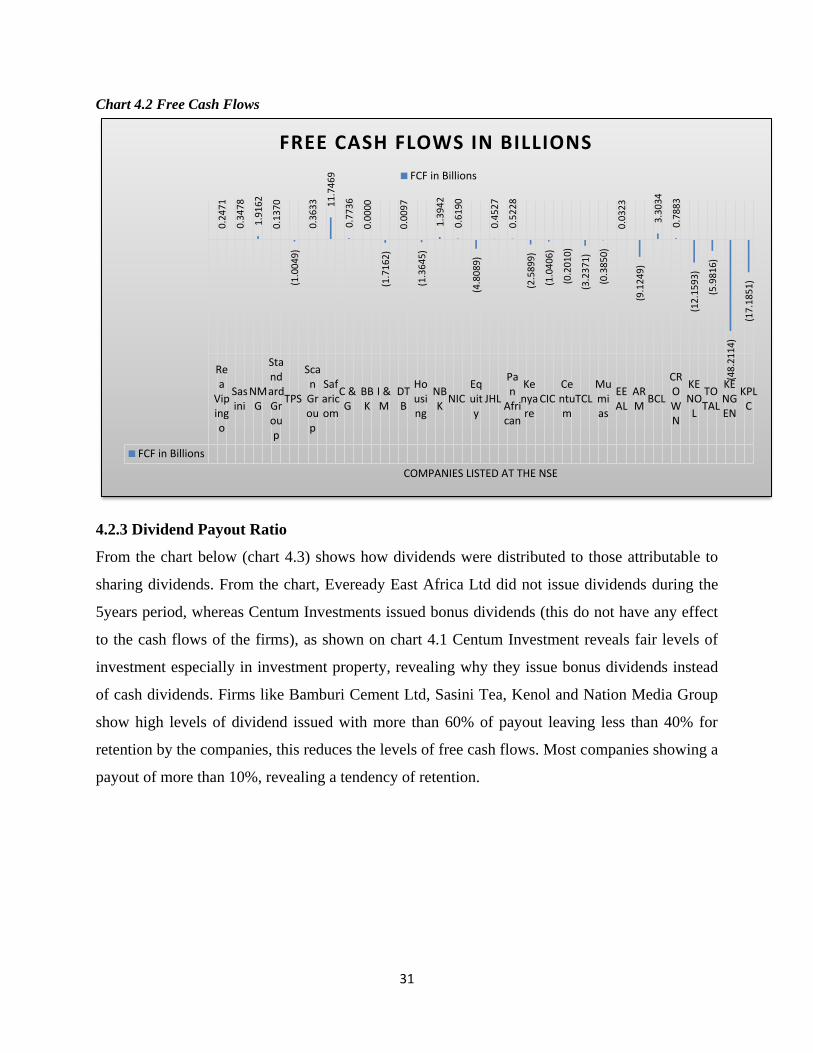
31
Chart 4.2 Free Cash Flows
4.2.3 Dividend Payout Ratio
From the chart below (chart 4.3) shows how dividends were distributed to those attributable to
sharing dividends. From the chart, Eveready East Africa Ltd did not issue dividends during the
5years period, whereas Centum Investments issued bonus dividends (this do not have any effect
to the cash flows of the firms), as shown on chart 4.1 Centum Investment reveals fair levels of
investment especially in investment property, revealing why they issue bonus dividends instead
of cash dividends. Firms like Bamburi Cement Ltd, Sasini Tea, Kenol and Nation Media Group
show high levels of dividend issued with more than 60% of payout leaving less than 40% for
retention by the companies, this reduces the levels of free cash flows. Most companies showing a
payout of more than 10%, revealing a tendency of retention.
Rea
Vipingo
Sasini
NMG
StandardGroup
TPS
Scan
Group
Safaricom
C &G
BBK
I &M
DTB
Housing
NBK
NICEquity
JHL
Pan
African
Kenyare
CICCentum
TCLMumias
EEAL
ARM
BCL
CROWN
KENOL
TOTAL
KENGEN
KPLC
FCF in Billions
0.2
47
1
0.3
47
8
1.9
16
2
0.1
37
0
(1
.00
49
)
0.3
63
3
11
.74
69
0.7
73
6
0.0
00
0
(1
.71
62
)
0.0
09
7
(1
.36
45
)
1.3
94
2
0.6
19
0
(4
.80
89
)
0.4
52
7
0.5
22
8
(2
.58
99
)
(1
.04
06
)
(0
.20
10
)
(3
.23
71
)
(0
.38
50
)
0.0
32
3
(9
.12
49
)
3.3
03
4
0.7
88
3
(1
2.1
59
3)
(5
.98
16
)
(4
8.2
11
4)
(1
7.1
85
1)
COMPANIES LISTED AT THE NSE
FREE CASH FLOWS IN BILLIONS
FCF in Billions
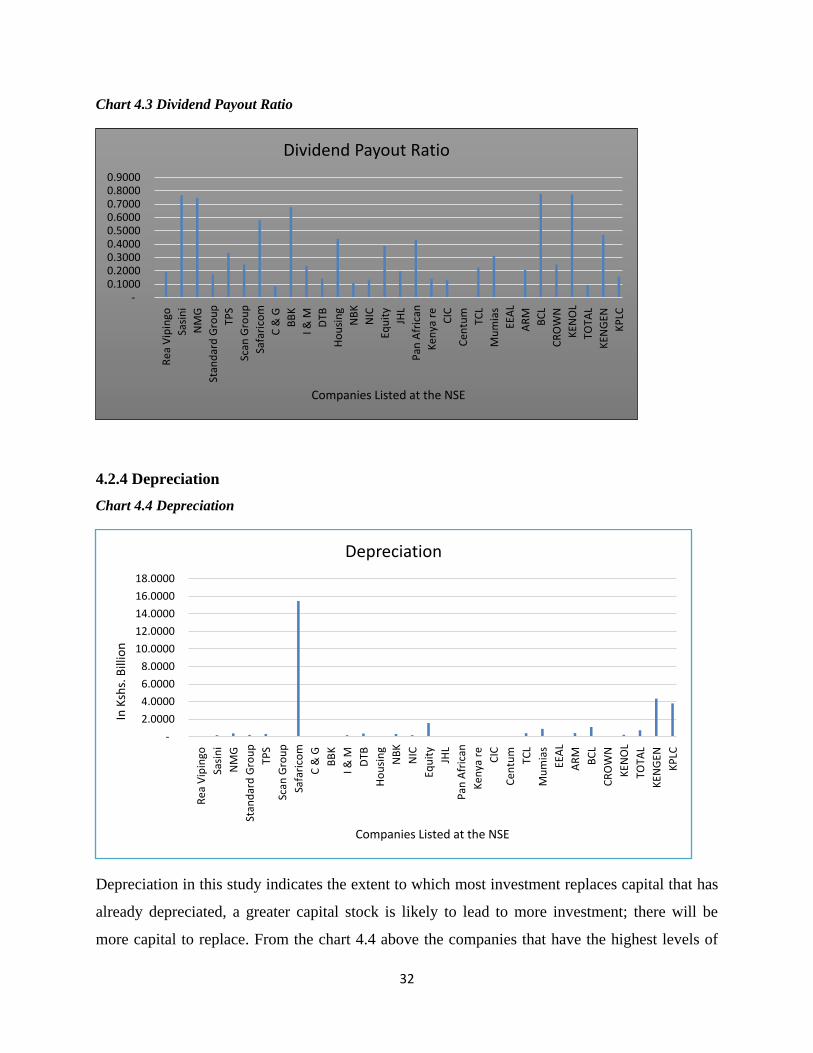
32
Chart 4.3 Dividend Payout Ratio
4.2.4 Depreciation
Chart 4.4 Depreciation
Depreciation in this study indicates the extent to which most investment replaces capital that has
already depreciated, a greater capital stock is likely to lead to more investment; there will be
more capital to replace. From the chart 4.4 above the companies that have the highest levels of
- 0.1000 0.2000 0.3000 0.4000 0.5000 0.6000 0.7000 0.8000 0.9000
Rea
Vip
ingo
Sasi
ni
NM
G
Stan
dar
d G
rou
p
TPS
Scan
Gro
up
Safa
rico
m
C &
G
BB
K
I & M
DTB
Ho
usi
ng
NB
K
NIC
Equ
ity
JHL
Pan
Afr
ican
Ken
ya r
e
CIC
Cen
tum
TCL
Mu
mia
s
EEA
L
AR
M
BC
L
CR
OW
N
KEN
OL
TOTA
L
KEN
GEN
KP
LC
Companies Listed at the NSE
Dividend Payout Ratio
-
2.0000
4.0000
6.0000
8.0000
10.0000
12.0000
14.0000
16.0000
18.0000
Rea
Vip
ingo
Sasi
ni
NM
G
Stan
dar
d G
rou
p
TPS
Scan
Gro
up
Safa
rico
m
C &
G
BB
K
I & M
DTB
Ho
usi
ng
NB
K
NIC
Equ
ity
JHL
Pan
Afr
ican
Ken
ya r
e
CIC
Cen
tum
TCL
Mu
mia
s
EEA
L
AR
M
BC
L
CR
OW
N
KEN
OL
TOTA
L
KEN
GEN
KP
LC
In K
shs.
Bill
ion
Companies Listed at the NSE
Depreciation

33
depreciation are Safaricom, Kengen and Kenya Power ltd, this corresponds to the analysis seen
earlier in chart 4.1 where investments represented by net capital expenditure amongst Safaricom,
Kengen and Kenya Power ltd, has high levels of net capital expenditure. This implies that as
depreciation increases, the need to replace items that have hit their economic useful life,
therefore the increase in capital expenditure.
4.3 Correlation Analysis
Correlation coefficient indicates strength and direction between variables. Specifically, partial
correlation coefficient shows correlation between two variables holding others constant. Table
4.1 shows Pearson correlation coefficients of variables of our interest.
Table 4.1: Correlations Matrix
Correlations
Net Capital
Expenditure
Free Cash
Flows
DPR Depreciati
on
Pearson
Correlation
Net Capital Expenditure 1.000
Free Cash Flows 0.707 1.000
DPR 0.032 0.338 1.000
Depreciation 0.644 0.971 0.248 1.000
Sig. (1-tailed)
Net Capital Expenditure .
Free Cash Flows 0.003 .
DPR 0.910 0.218 .
Depreciation 0.009 0.000 0.373 .
N
15 15 15 15
Note: Correlation is significant at the 0.05 level (2-tailed).
In table 4.1 above shows that there is positive correlation between net capital expenditure (NCE)
with variables of free cash flows of 0.707 with a probability of 0.003, dividend payout ratio of
0.032 with a probability value of 0.910, and depreciation value of 0.644 with a probability of
0.009 There is a correlation between the variables at 5% confidence level, they are significant.

34
4.4 Regression Analysis and Hypothesis testing
In addition to the above analysis, the researcher conducted a multiple regression analysis so as to
test the relationship among independent variables. The researcher applied the Statistical Package
for Social Sciences (SPSS Version 20) aid in computation of the measurements of the multiple
regressions for the study. The findings are as shown in the table 4.2 below:
Table 4.2: Model Summary
Model Summary
Model R R Square Adjusted R Square Std. Error of the
Estimate
1 0.789a 0.622 0.519 0.649
a. Predictors: (Constant), Free cash flows, DPR and Depreciation
The coefficient of determination explains the extent to which changes in the dependent variable
(Investments) can be explained by the change in the independent variables (free cash flows,
dividend payout ratio and depreciation).
The three independent variables that were studied, explain only 62.20% of the changes in the
investments of firms quoted at the NSE as represented by the adjusted R2. The R column
represents the multiple correlation coefficients which measures the quality of the prediction of
dependent variable. In this case the value of R is 0.789 which shows a strong level of prediction.
However, the R2 which is the coefficient of determination is 0.622 indicating that only 62.20% of
the investments of firms quoted at the NSE can be explained by free cash flows, dividend payout
ratio and depreciation, the other 37.8% can be explained by other variables which were not in the
model.

35
Table 4.3: Analysis of Variance (ANOVA)
ANOVA
Model Sum of
Squares
df Mean Square F Sig.
1
Regression 7.613 3 2.538 6.030 0.011b
Residual 4.629 11 0.421
Total 12.242 14
a. Dependent Variable: Net Capital Expenditure
b. Predictors: (Constant) Free cash flows, DPR and Depreciation
To test for the existence of a linear relationship between free cash flows and investment
variables, Analysis of Variance was employed. The results from the analysis of variance as per
table 4.3 shows that the regression relationship between free cash flows and the investment
variables are statistically significant at 5% level of significance (F value = 6.030, p-value = 0.011
< 0.05), meaning that there is a significant effect of the free cash flows, DPR and Depreciation
on Investments of Companies Quoted at the NSE. This can be shown by the significant level
which is 0.011 which is less than 0.05.
Table 4.4: Coefficients of Determination
Coefficients
Model Unstandardized
Coefficients
Standardized
Coefficients
t Sig.
B Std. Error Beta
Constant 5.150 0.297 17.320 0.000
FCF 0.635 0.271 2.011 2.345 0.039
DPR -1.210 0.740 -0.345 -1.634 0.131
Depreciation -0.290 0.198 -1.223 -1.468 0.170
a. Dependent Variable: Net Capital Expenditure

36
The researcher conducted a multiple regression analysis so as to determine the relationship
between free cash flows and investments of firms quoted at the NSE, and the three variables
investigated were; the estimated model was:
Y =B0 +B1X1 +B2X2 +B3X3 + et
Y = 5.150 + 0.635X1 – 1.210 X2 - 0.290X3 ………………Unstandardized Equation
Y = 2.011X1 – 0.345 X2 - 1.223X3 ................Standardized Equation
Std. Error [0.297] [0.271] [0.740] [0.198]
t- Statistics [17.320] [2.345] [-1.634] [-1.468]
R2 = 0.622
Adjusted R2 = 0.519
Multiple R = 0.789
Durbin Watson Statistic = 2.069
Total variation explained by the regression model as indicated by R square and adjusted R is
0.622 or 62.2 % and 0.519 or 51.9% show that the model fairly strong for the study. It is clear
that there are other variables that affect investments not explained by the model. So the variation
explained by the independent variable FCF is positive.
The mean net capital expenditure intercept of 5.150 indicates that for every increase on the
variables considered, there are 5.150 increases in Net Capital Expenditure. The Durbin Watson
Statistic of 2.069 falls between 1 and 3 and thus shows that the model is good.
That means if FCF will change by 1 billion, Log of Net Capital Expenditure will change by
0.635, which means Net Capital Expenditure will increase by 1.635 billion. The regression
coefficient represents the amount of change in the dependent variable for a one unit change in the
independent variable. (Hair, 2006)
The multiple R of 0.789 indicates that there is strong relationship between Net Capital
Expenditure and variables considered. The regression model result is pointing out that FCF has a
positive impact on Net Capital Expenditure. (Hair, 2006)
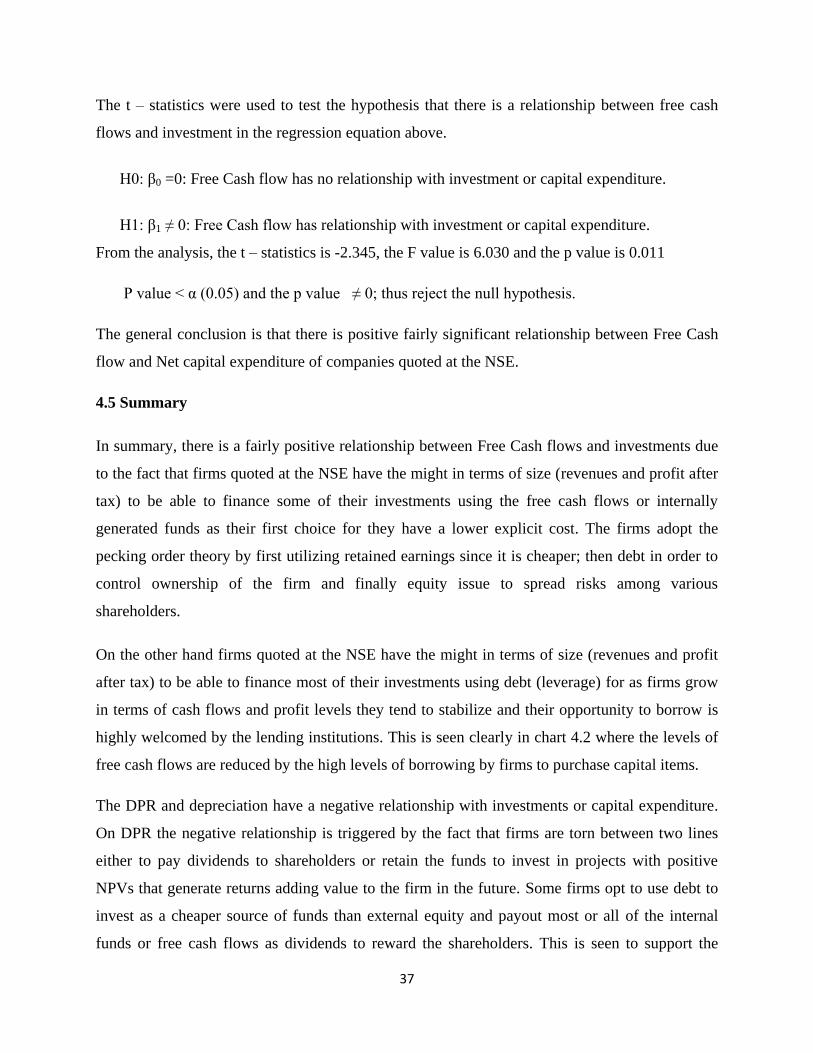
37
The t – statistics were used to test the hypothesis that there is a relationship between free cash
flows and investment in the regression equation above.
H0: β0 =0: Free Cash flow has no relationship with investment or capital expenditure.
H1: β1 ≠ 0: Free Cash flow has relationship with investment or capital expenditure.
From the analysis, the t – statistics is -2.345, the F value is 6.030 and the p value is 0.011
P value < α (0.05) and the p value ≠ 0; thus reject the null hypothesis.
The general conclusion is that there is positive fairly significant relationship between Free Cash
flow and Net capital expenditure of companies quoted at the NSE.
4.5 Summary
In summary, there is a fairly positive relationship between Free Cash flows and investments due
to the fact that firms quoted at the NSE have the might in terms of size (revenues and profit after
tax) to be able to finance some of their investments using the free cash flows or internally
generated funds as their first choice for they have a lower explicit cost. The firms adopt the
pecking order theory by first utilizing retained earnings since it is cheaper; then debt in order to
control ownership of the firm and finally equity issue to spread risks among various
shareholders.
On the other hand firms quoted at the NSE have the might in terms of size (revenues and profit
after tax) to be able to finance most of their investments using debt (leverage) for as firms grow
in terms of cash flows and profit levels they tend to stabilize and their opportunity to borrow is
highly welcomed by the lending institutions. This is seen clearly in chart 4.2 where the levels of
free cash flows are reduced by the high levels of borrowing by firms to purchase capital items.
The DPR and depreciation have a negative relationship with investments or capital expenditure.
On DPR the negative relationship is triggered by the fact that firms are torn between two lines
either to pay dividends to shareholders or retain the funds to invest in projects with positive
NPVs that generate returns adding value to the firm in the future. Some firms opt to use debt to
invest as a cheaper source of funds than external equity and payout most or all of the internal
funds or free cash flows as dividends to reward the shareholders. This is seen to support the

38
agency theory and trade – off concept that argue that large firms have high borrowing capacity
since they have diversified their operations into different sectors hence high total assets value. As
the firms grow in size, cash flows and profit levels tend to stabilize and the possibility of going
bankrupt is reduced.
On depreciation, as the value of deprecation increases the corresponding effect is to replace the
items that have hit their economic useful lives, this therefore has a positive effect on net capital
expenditure due to the additions to be made to replace the depreciated item but from the results it
is a negative relationship. In chapter three, we also discussed that a greater capital stock can tend
to reduce investment. That is because investment occurs to adjust the stock of capital to its
desired level. Given that desired level, the amount of investment needed to reach it will be lower
when the current capital stock is higher (Rittenberg and Tregarthen, 2014).

39
CHAPTER FIVE:
SUMMARY, CONCLUSION AND RECOMMENDATIONS
5.1 Introduction
The objective of the study was to determine the relationship between Free Cash flows and
investments of companies quoted at the NSE and also to determine the effect of Free Cash flows
on investments and how this affects the firm‟s operations. This chapter is a recap of the findings
detailed in the previous chapters and make recommendations for further research to researchers
and policy makers. The significant findings are summarized and conclusions drawn.
5.2 Summary
The study sought to determine the relationship between Free Cash flows and investments from
the year 2009 – 2013. The research revealed that there is fairly positive significant relationship
between Free Cash flows and investments. Firms adopt the pecking order theory by utilizing
retained earnings since no floatation cost is involved. When it is over, they use debt to control
ownership and finally external equity is employed to spread risks among various stakeholders.
DPR and depreciation are among the variables tested and found to affect investments. From the
analysis DPR and depreciation have a negative relationship with investments. It was further
revealed that DPR and depreciation have a fairly significant relationship with capital
expenditure, whereas Free Cash flows had a significant relationship with investments.
5.3 Conclusions
From the organizations considered, it was established that there is a positive fairly significant
relationship between free cash flows and investment that is as the level of free cash flows
increase, the level of investments increases. Firms prefer internally generated funds since they
are cheaper to finance their investment needs especially short term projects and long-term
projects that require immediate commitment (those that may not wait for strategic plans to be
made). This is before they seek other sources of financing investment projects, like debt and

40
external equity. For firms adopt the pecking order theory by utilizing retained earnings since no
floatation cost are involved. When it is over, they use debt to control ownership and finally
external equity is employed to spread risks among various stakeholders.
Therefore, this positive relationship seeks to explain the reason why free cash flows are first
choice to finance investment projects, even though for most companies in the NSE may prefer
debt to finance their investment agendas as we saw earlier in the previous chapter, where their
level of borrowings is high corresponding to the levels of capital expenditure. The more a firm
engages in extensive investment projects, the more funding it requires. If the internally generated
funds cannot wholly finance the projects (funds not enough or distributed as dividends) the firm
seeks other avenues to source funds and because debt (even though debt usage is expensive since
the cost of debt surpasses the tax shield advantage and increases chances of liquidation) is
preferred to equity, the firm will go for debt as the second choice and finally to external equity.
While the study shows that cash flow financed capital expenditure is marginally unproductive for
some firms, the potential sources of this inefficiency have also been identified. Cash flow
financed growth by large, low dividend firms tends to be value destroying, while cash flow
financed growth is value-creating for small, low dividend firms.
5.4 Recommendations
In this study, it was observed that the relationship between free cash flows and investments of
firms quoted at the NSE have a fairly significant relationship. Therefore various stakeholders in
this industry should strive to carry out researches in order to be able to identify which are other
major factors that affect the performance of their industry. This will enable them to know the
main factors that may influence investment decisions to ensure that firms make more factual
investment decisions increasing their return on assets, thereby increase in their financial
performance and maximize shareholders‟ wealth.
In this study, it can be observed that most firms give much attention to profits after tax or
earnings, which are not as refined as free cash flows are. Therefore, I would recommend that the
financial reports should disclose the value of free cash flows for it is considered by some experts
to be a better indicator of a company's financial health.
41
The importance of dividends as a method of mitigating agency costs of free cash flow, moreover,
is confirmed. Managers of firms‟ with large cash flows may consider increasing dividend
payouts as a method of increasing the efficiency of their capital expenditure decisions. A
continued high dividend-payout policy may also signal to shareholders that additional and costly
monitoring of capital expenditure decisions is unnecessary.
This study will help mangers to make a good dividend payout policy and it will be useful for
capital expenditure decisions also.
5.5 Limitations of the Study
There were various limitations which related to this study and which need to be mentioned to
ensure that a researcher puts them into consideration when planning for a research project. Some
of these limitations are outlined as below.
This study used only three variables as the measures of the relationship between free cash flows
and investments, hence there is need to carry out the study with other different factors in order to
be able to establish whether there are other major factors that have a relationship with
investments at the NSE.
There was also issue of time and cost constraint whereby the time required analysing the data
needs to be created to ensure that one is able to carry out an effective study.
5.6 Suggestions for Further Research
This study advocates that further studies can be done in this areas, they may include: the
relationship between leverage and investments to quite clearly know the strength of the
relationship and whether leverage can be indeed a factor that affects investment as mentioned in
our study. Further research to be done to know whether free cash flows relate to investment
among the private companies, medium firms and small firms in this nation or in other nations.
Also, to know the extent of the relationship in the different sectors or industry.
42
REFERENCES:
Almeida, H., M. Campello, and M. Weisbach. 2004. The Cash Flow Sensitivity of Cash. Journal
of Finance 59:1777–804.
Alti, A. (2003). How sensitive is investment to cash flow when financing is frictionless? The
journal of finance, vol. 58, no. 2, pp. 707-722.
Amidu, M. (2007). How does dividend policy affect performance of the firm on Ghana Stock Exchange
Investment Management and Financial Innovations, 4(2), 104 – 112
B. Becker and J. Sivadasan, (2006) “The effect of financial development on the investment-cash
flow relationship: cross-country evidence from Europe” ECB publications.
Berle, A. and G. Means. (1932). The Modern Corporation and Private Property, Macmillan Publishing,
New York.
Bhattacharya, S. (1979). Imperfect Information, Dividend Policy, and the „Bird in the Hand‟
Fallacy,” Bell Journal of Economics,10, 259-70.
Bo becker, J. S. (2006). The effect of financial development on the investment-cash flow
relationship cross-country evidence from Europe. Ecb lamfalussy fellowship
programme.
Fama, E. (1974). The Empirical Relationship between the Dividend and Investment Decisions of
Firms. American Economic Review, 64, pp.304-318.
Farrell E. Jensen, J. S. (1993). Agricultural investment and internal cash flow variables. Review
of agricultural economics, vol. 15, no. 2, pp. 295-306.
Farsio, F., Geary, A., & Moser, J. (2004). The relationship between dividends and earnings. Journal for
Economic Educators, 4(4), 1 – 5.
Fazzari, Steven M., Hubbart, Glenn R., and Petersen, Bruce C. (1988), Financing Constrains and
Corporate Investment, Brooking Papers on Economic Activity, 19: pp. 141-195.
Geng, N. and P. N‟Diaye, 2012, “Determinants of Corporate Investment in China: Evidence
from Cross-Country Firm Level Data,”IMF Working Paper 12/80 (Washington:
International Monetary Fund).
Hair, J. F. (2006). Multivariate data analysis.
Hall R. and D. Jorgenson (1967). “Tax Policy and Investment Behavior.” American Economic
Review, 57, 391-414.
Hermes, N., Smid, P. and Yao, L. (2007), „Capital budgeting practices: A comparative study of
the Netherlands and China‟, International Business Review, Vol. 16(1), pp. 630-654
43
Hovakimian, G., 2009, “Determinants of Investment Cashflow Sensitivity,” Journal of Financial
Management, 161-183
Himmelberg, C. and B. Peterson, 1994, “Research and Development and Internal Finance: A
Panel Study of Small Firms in High-Tech Industries,” Review of Economics and
Statistics.
James A. Gentry, P. N. (1990). Profiles of cash flow components. Financial Analysts Journal,
vol. 46, no. 4, pp. 41-48.
Jensen, m. C. (1986). Agency costs of free cash flow, corporate finance, and take overs.
American economic review, May 1986, vol. 76, no. 2, pp. 323-329
Khurana, I. K., X. Martin and R. Pereira. (2006). Financial Development and Cash Flow Sensitivity of
Cash, Journal of Financial and Quantitative Analysis, Vol 41, No. 4, December 2006, 787-807
Klaus G, Dennis C. Mueller and B. Burcin Yurtoglu, (2004) Corporate Governance and the
Returns on Investment, , The Journal of Law and Economics, volume 47 (2), 589-633.
Klaus Gugler, D. C. (2004). Marginal q, Tobin's q, cash flow, and investment. Southern
economic journal, vol. 70, no. 3, pp. 512-531.
Krejcie, R. V., & Morgan, D. W. (1970). Determining Sample Size for Research Activities
[Electronic Version].
Lintner, J. (1956). "Distribution of Incomes of Corporations among Dividends, Retained Earnings and
Taxes,"/Imencan Economic Review (May 1956), pp. 97-113.
Meyer, J. and E. Kuh (1957). The Investment Decision. Cambridge, MA: Harvard University
Press.
Miller, M. H. (1977). Debt and Taxes. Journal of Finance, 32, 261-75.
Miller, M. H. and Modigliani, F. (1961). Dividend Policy, Growth and the Valuation of Shares.
Journal of Business, 34, 411-33.
Mizuno, M. (2007). Payout policy of Japanese firms: analysis on the survey of four industries listed on
the Tokyo Stock Exchange. Pacific Economic Review, 12(5), 631 – 650.
Modgliniani, F. & Miller, M. (1958). The Cost of Capital, Corporation Finance and the Theory
of Investment. The American Economic Review, 48, 120 – 127.
Modigliani F. and M. Miller (1958). “The Cost of Capital, Corporation Finance and the Theory
of Investment.” American Economic Review, 48, 261-97.
Moyen, N. (2004). Investment-cash flow sensitivities: constrained versus unconstrained firms.
The journal of finance, vol. 59, no. 5, pp. 2061-2092.

44
Mugenda, & Mugenda. (2003). Quantitaive and qualitative Approaches, African Centre for
technology Studies, Nairobi Kenya.
Myers, S. (1984). Corporate Financing and Investment Decisions when firms have information
investor do not have. Journal of Financial Economics, 13, 187-221.
Pandey, I. (2005).Financial Management (9 Ed).India: Vikas Publishers.
Pinegar, J.M. and L. Wilbricht, 1989, “What Managers Think of Capital Structure Theory: A
Survey,” Financial Management (Winter), 82-91.
Poulsen, k. L. (1989). Free cash flow and stockholder gains in going private transactions. The
journal of finance, vol. 44, no. 3, papers and proceedings of the forty-eighth annual
meeting of the American finance association, New York, December 28-30 , 771-787.
Raj aggarwal, S. Z. (2005). The cash flow-investment relationship: international evidence of
limited access to external finance. Kent state university, v. 4.5.
Richardson, S. (2006) “Over-investment of free cash flow” Review of Accounting Studies 11:
159–189
Rittenberg L. and Tregarthen T., (2014) “Principles of Macroeconomics,” Flat World Education,
Inc. v. 1.0
Subramanyam, K. R.; and J. J. Wild, (2009) “Financial statement analysis.” 10th
edition
McGraw-Hill/Irwin
Vogt, S. (1994). The cash flow/investment relationship: evidence from U.S.A Manufacturing
firms. Financial management, vol. 23, no. 2, pp. 3-20.
Vogt. (1997). Cash flow and capital spending: evidence from capital expenditure
announcements. Financial management, vol. 26, no. 2, pp. 44-57.
Worthington, P. R. (1995). Investment, cash flow, and sunk costs. The journal of industrial
economics, vol. 43, no. 1, pp. 49-61.

45
APPENDICES
APPENDIX 1: COMPANIES LISTED IN THE NSE
INDUSTRY/SECTOR AND THE NAME OF THE COMPANY
AGRICULTURAL INSURANCE
1 Eaagads Ltd 33 Jubilee Holdings Ltd
2 Kapchorua Tea Co. Ltd 34 Pan Africa Insurance Holdings Ltd
3 Kakuzi 35 Kenya Re-Insurance Corporation Ltd
4 Limuru Tea Co. Ltd 36 Liberty Kenya Holdings Ltd
5 Rea Vipingo Plantations Ltd 37 British-American Investments Company ( Kenya) Ltd
6 Sasini Ltd 38 CIC Insurance Group Ltd
7 Williamson Tea Kenya Ltd INVESTMENT
COMMERCIAL AND SERVICES 39 Olympia Capital Holdings ltd
8 Express Ltd 40 Centum Investment Co Ltd
9 Kenya Airways Ltd 41 Trans-Century Ltd
10 Nation Media Group MANUFACTURING AND ALLIED
11 Standard Group Ltd 42 B.O.C Kenya Ltd
12 TPS Eastern Africa (Serena) Ltd 43 British American Tobacco Kenya Ltd
13 Scangroup Ltd 44 Carbacid Investments Ltd
14 Uchumi Supermarket Ltd 45 East African Breweries Ltd
15 Hutchings Biemer Ltd 46 Mumias Sugar Co. Ltd
16 Longhorn Kenya Ltd 47 Unga Group Ltd
TELECOMMUNICATION AND
TECHNOLOGY 48 Eveready East Africa Ltd
17 Safaricom Ltd 49 Kenya Orchards Ltd
AUTOMOBILES AND ACCESSORIES 50 A.Baumann CO Ltd
18 Car and General (K) Ltd CONSTRUCTION AND ALLIED
19 CMC Holdings Ltd 51 Athi River Mining
20 Sameer Africa Ltd 52 Bamburi Cement Ltd
21 Marshalls (E.A.) Ltd 53 Crown Berger Ltd
BANKING 54 E.A.Cables Ltd
22 Barclays Bank Ltd 55 E.A.Portland Cement Ltd
23 CFC Stanbic Holdings Ltd ENERGY AND PETROLEUM
24 I&M Holdings Ltd 56 KenolKobil Ltd
25 Diamond Trust Bank Kenya Ltd 57 Total Kenya Ltd
26 Housing Finance Co Ltd 58 KenGen Ltd
27 Kenya Commercial Bank Ltd 59 Kenya Power & Lighting Co Ltd
28 National Bank of Kenya Ltd 60 Umeme Ltd
29 NIC Bank Ltd GROWTH ENTERPRISE MARKET SEGMENT
30 Standard Chartered Bank Ltd 61 Home Afrika
31 Equity Bank Ltd
32 The Co-operative Bank of Kenya Ltd
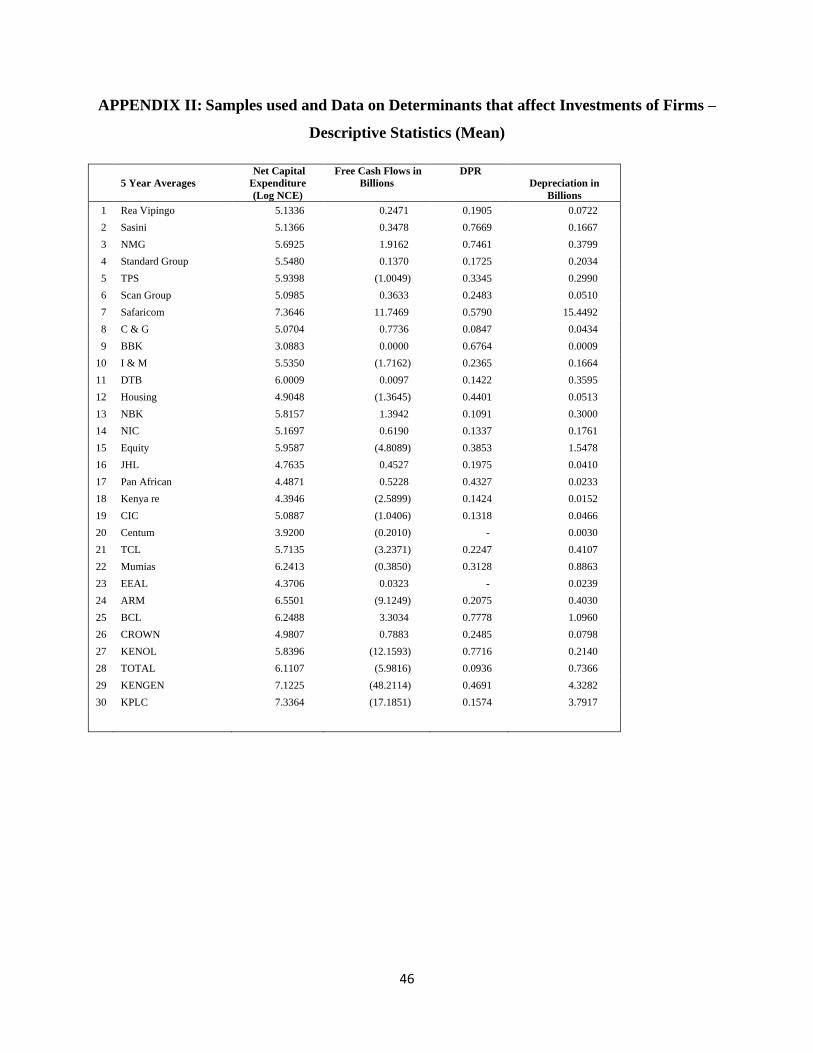
46
APPENDIX II: Samples used and Data on Determinants that affect Investments of Firms –
Descriptive Statistics (Mean)
5 Year Averages
Net Capital
Expenditure
(Log NCE)
Free Cash Flows in
Billions
DPR
Depreciation in
Billions
1 Rea Vipingo 5.1336 0.2471 0.1905 0.0722
2 Sasini 5.1366 0.3478 0.7669 0.1667
3 NMG 5.6925 1.9162 0.7461 0.3799
4 Standard Group 5.5480 0.1370 0.1725 0.2034
5 TPS 5.9398 (1.0049) 0.3345 0.2990
6 Scan Group 5.0985 0.3633 0.2483 0.0510
7 Safaricom 7.3646 11.7469 0.5790 15.4492
8 C & G 5.0704 0.7736 0.0847 0.0434
9 BBK 3.0883 0.0000 0.6764 0.0009
10 I & M 5.5350 (1.7162) 0.2365 0.1664
11 DTB 6.0009 0.0097 0.1422 0.3595
12 Housing 4.9048 (1.3645) 0.4401 0.0513
13 NBK 5.8157 1.3942 0.1091 0.3000
14 NIC 5.1697 0.6190 0.1337 0.1761
15 Equity 5.9587 (4.8089) 0.3853 1.5478
16 JHL 4.7635 0.4527 0.1975 0.0410
17 Pan African 4.4871 0.5228 0.4327 0.0233
18 Kenya re 4.3946 (2.5899) 0.1424 0.0152
19 CIC 5.0887 (1.0406) 0.1318 0.0466
20 Centum 3.9200 (0.2010) - 0.0030
21 TCL 5.7135 (3.2371) 0.2247 0.4107
22 Mumias 6.2413 (0.3850) 0.3128 0.8863
23 EEAL 4.3706 0.0323 - 0.0239
24 ARM 6.5501 (9.1249) 0.2075 0.4030
25 BCL 6.2488 3.3034 0.7778 1.0960
26 CROWN 4.9807 0.7883 0.2485 0.0798
27 KENOL 5.8396 (12.1593) 0.7716 0.2140
28 TOTAL 6.1107 (5.9816) 0.0936 0.7366
29 KENGEN 7.1225 (48.2114) 0.4691 4.3282
30 KPLC 7.3364 (17.1851) 0.1574 3.7917
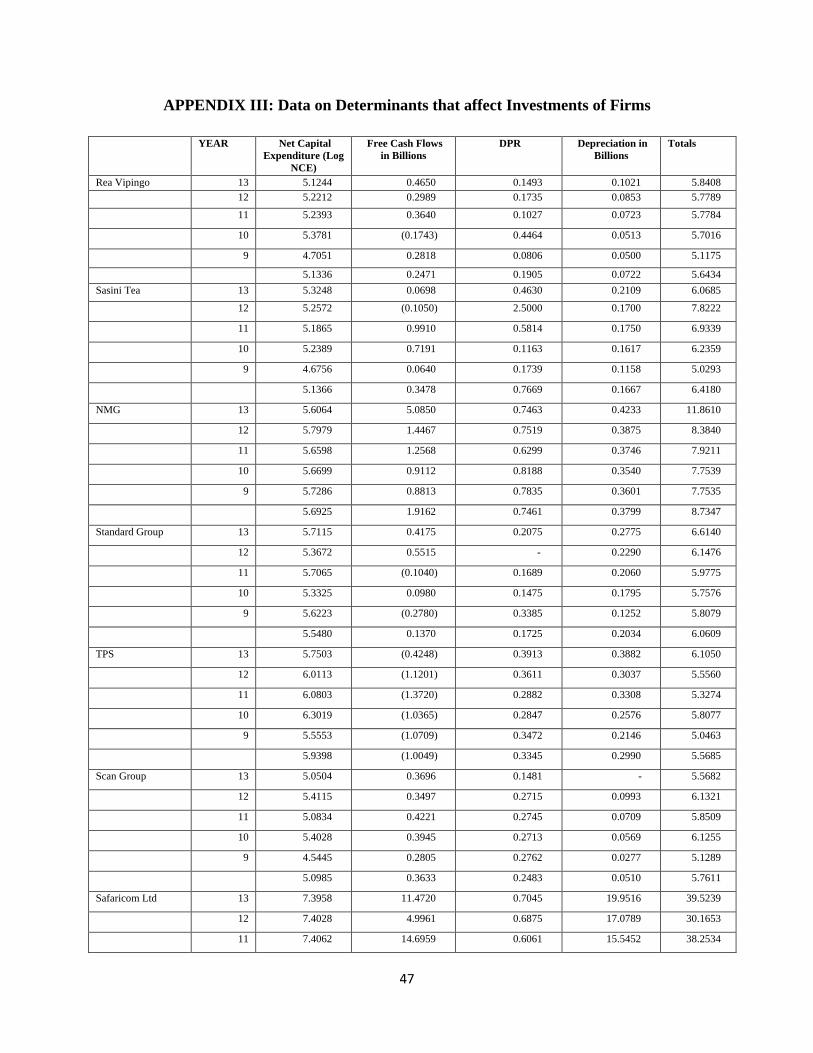
47
APPENDIX III: Data on Determinants that affect Investments of Firms
YEAR Net Capital
Expenditure (Log
NCE)
Free Cash Flows
in Billions
DPR Depreciation in
Billions
Totals
Rea Vipingo 13 5.1244 0.4650 0.1493 0.1021 5.8408
12 5.2212 0.2989 0.1735 0.0853 5.7789
11 5.2393 0.3640 0.1027 0.0723 5.7784
10 5.3781 (0.1743) 0.4464 0.0513 5.7016
9 4.7051 0.2818 0.0806 0.0500 5.1175
5.1336 0.2471 0.1905 0.0722 5.6434
Sasini Tea 13 5.3248 0.0698 0.4630 0.2109 6.0685
12 5.2572 (0.1050) 2.5000 0.1700 7.8222
11 5.1865 0.9910 0.5814 0.1750 6.9339
10 5.2389 0.7191 0.1163 0.1617 6.2359
9 4.6756 0.0640 0.1739 0.1158 5.0293
5.1366 0.3478 0.7669 0.1667 6.4180
NMG 13 5.6064 5.0850 0.7463 0.4233 11.8610
12 5.7979 1.4467 0.7519 0.3875 8.3840
11 5.6598 1.2568 0.6299 0.3746 7.9211
10 5.6699 0.9112 0.8188 0.3540 7.7539
9 5.7286 0.8813 0.7835 0.3601 7.7535
5.6925 1.9162 0.7461 0.3799 8.7347
Standard Group 13 5.7115 0.4175 0.2075 0.2775 6.6140
12 5.3672 0.5515 - 0.2290 6.1476
11 5.7065 (0.1040) 0.1689 0.2060 5.9775
10 5.3325 0.0980 0.1475 0.1795 5.7576
9 5.6223 (0.2780) 0.3385 0.1252 5.8079
5.5480 0.1370 0.1725 0.2034 6.0609
TPS 13 5.7503 (0.4248) 0.3913 0.3882 6.1050
12 6.0113 (1.1201) 0.3611 0.3037 5.5560
11 6.0803 (1.3720) 0.2882 0.3308 5.3274
10 6.3019 (1.0365) 0.2847 0.2576 5.8077
9 5.5553 (1.0709) 0.3472 0.2146 5.0463
5.9398 (1.0049) 0.3345 0.2990 5.5685
Scan Group 13 5.0504 0.3696 0.1481 - 5.5682
12 5.4115 0.3497 0.2715 0.0993 6.1321
11 5.0834 0.4221 0.2745 0.0709 5.8509
10 5.4028 0.3945 0.2713 0.0569 6.1255
9 4.5445 0.2805 0.2762 0.0277 5.1289
5.0985 0.3633 0.2483 0.0510 5.7611
Safaricom Ltd 13 7.3958 11.4720 0.7045 19.9516 39.5239
12 7.4028 4.9961 0.6875 17.0789 30.1653
11 7.4062 14.6959 0.6061 15.5452 38.2534

48
10 7.2414 18.3333 0.5263 13.3774 39.4784
9 7.3769 9.2370 0.3704 11.2927 28.2770
7.3646 11.7469 0.5790 15.4492 35.1396
C & G 13 4.8256 1.9198 0.0906 0.0492 6.8852
12 5.0397 1.9769 0.0735 0.0501 7.1403
11 5.7344 (0.4566) 0.0707 0.0479 5.3964
10 4.9668 0.5607 0.1124 0.0380 5.6779
9 4.7855 (0.1329) 0.0761 0.0317 4.7605
5.0704 0.7736 0.0847 0.0434 5.9721
BBK 13 2.8169 0.0022 0.5000 0.0011 3.3202
12 2.9380 (0.0033) 0.6211 0.0012 3.5571
11 2.9890 (0.0026) 1.0067 0.0008 3.9939
10 3.1427 0.0037 0.6974 0.0007 3.8446
9 3.5547 0.0000 0.5568 0.0007 4.1123
3.0883 0.0000 0.6764 0.0009 3.7656
I & M 13 5.3972 (7.2371) 0.2183 0.1796 (1.4420)
12 5.5264 (0.8509) 0.1940 0.2563 5.1258
11 5.4762 (0.3095) 0.2209 0.2001 5.5877
10 5.3133 0.1087 0.2088 0.1053 5.7361
9 5.9621 (0.2924) 0.3403 0.0905 6.1004
5.5350 (1.7162) 0.2365 0.1664 4.2216
DTB 13 6.4845 0.2751 0.0972 0.4768 7.3336
12 6.1000 0.5855 0.1089 0.4206 7.2150
11 5.8236 (0.7224) 0.1252 0.3659 5.5923
10 5.6420 0.4840 0.1370 0.3015 6.5644
9 5.9546 (0.5739) 0.2426 0.2325 5.8558
6.0009 0.0097 0.1422 0.3595 6.5122
Housing 13 5.8426 (3.1261) 0.4070 0.0687 3.1922
12 4.8763 (1.0441) 0.4348 0.0603 4.3273
11 4.9486 (0.0421) 0.4444 0.0495 5.4005
10 4.7843 (1.1178) 0.4242 0.0414 4.1322
9 4.0719 (1.4925) 0.4902 0.0365 3.1062
4.9048 (1.3645) 0.4401 0.0513 4.0317
NBK 13 6.0938 1.5383 0.1422 0.3269 8.1013
12 5.7947 0.5852 0.1342 0.3150 6.8291
11 5.8258 0.8910 0.1254 0.3742 7.2163
10 5.7740 2.3320 0.1435 0.2799 8.5295
9 5.5904 1.6244 - 0.2039 7.4186
5.8157 1.3942 0.1091 0.3000 7.6190
NIC 13 4.8881 (0.6052) 0.1634 0.2491 4.6954
12 5.1207 (0.4014) 0.1658 0.2043 5.0895
11 5.4872 1.9106 0.0744 0.1572 7.6293

49
10 5.0088 1.1643 0.0988 0.1485 6.4203
9 5.3435 1.0268 0.1661 0.1213 6.6578
5.1697 0.6190 0.1337 0.1761 6.0985
Equity 13 5.6146 (16.4740) 0.3834 2.2032 (8.2728)
12 6.2319 (4.5409) 0.4213 2.0282 4.1406
11 5.7946 (0.0864) 0.3788 1.3387 7.4257
10 5.7231 (0.6912) 0.3922 1.1329 6.5569
9 6.4294 (2.2518) 0.3509 1.0357 5.5643
5.9587 (4.8089) 0.3853 1.5478 3.0829
JHL 13 4.9975 0.8553 0.1842 0.0674 6.1044
12 4.9825 0.7387 0.2000 0.0548 5.9759
11 4.8286 0.3402 0.1667 0.0362 5.3716
10 4.6014 0.6090 0.1719 0.0264 5.4086
9 4.4077 (0.2797) 0.2647 0.0205 4.4132
4.7635 0.4527 0.1975 0.0410 5.4548
Pan African 13 4.6433 0.9915 0.2299 0.0290 5.8936
12 4.5965 0.4325 0.3200 0.0230 5.3720
11 4.5482 0.4545 0.4329 0.0206 5.4563
10 4.4053 0.5893 0.4886 0.0210 5.5041
9 4.2422 0.1461 0.6920 0.0227 5.1031
4.4871 0.5228 0.4327 0.0233 5.4658
Kenya Re 13 4.7434 (2.3761) 0.1399 0.0230 2.5301
12 4.0869 (2.0407) 0.1000 0.0189 2.1652
11 4.3099 (2.6316) 0.1097 0.0179 1.8059
10 4.8441 (2.9991) 0.1362 0.0108 1.9920
9 3.9887 (2.9020) 0.2262 0.0055 1.3185
4.3946 (2.5899) 0.1424 0.0152 1.9623
CIC 13 5.8988 (1.8322) 0.1538 0.0831 4.3035
12 4.8863 (1.3538) 0.1563 0.0498 3.7386
11 5.0973 (1.1134) 0.1112 0.0458 4.1410
10 4.6956 (0.3220) 0.0985 0.0319 4.5040
9 4.8654 (0.5813) 0.1394 0.0224 4.4459
5.0887 (1.0406) 0.1318 0.0466 4.2266
Centum 13 4.3540 (1.0363) - 0.0051 3.3227
12 3.6187 (0.0353) - 0.0040 3.5874
11 4.4346 (0.7483) - 0.0028 3.6891
10 4.0000 0.8846 - 0.0014 4.8860
9 3.1928 (0.0694) - 0.0018 3.1252
3.9200 (0.2010) - 0.0030 3.7221
TCL 13 5.8020 (3.6724) 0.3774 0.7094 3.2164
12 6.1656 (3.2968) 0.2410 0.6302 3.7401
11 5.1698 (2.9204) 0.2033 0.3227 2.7754
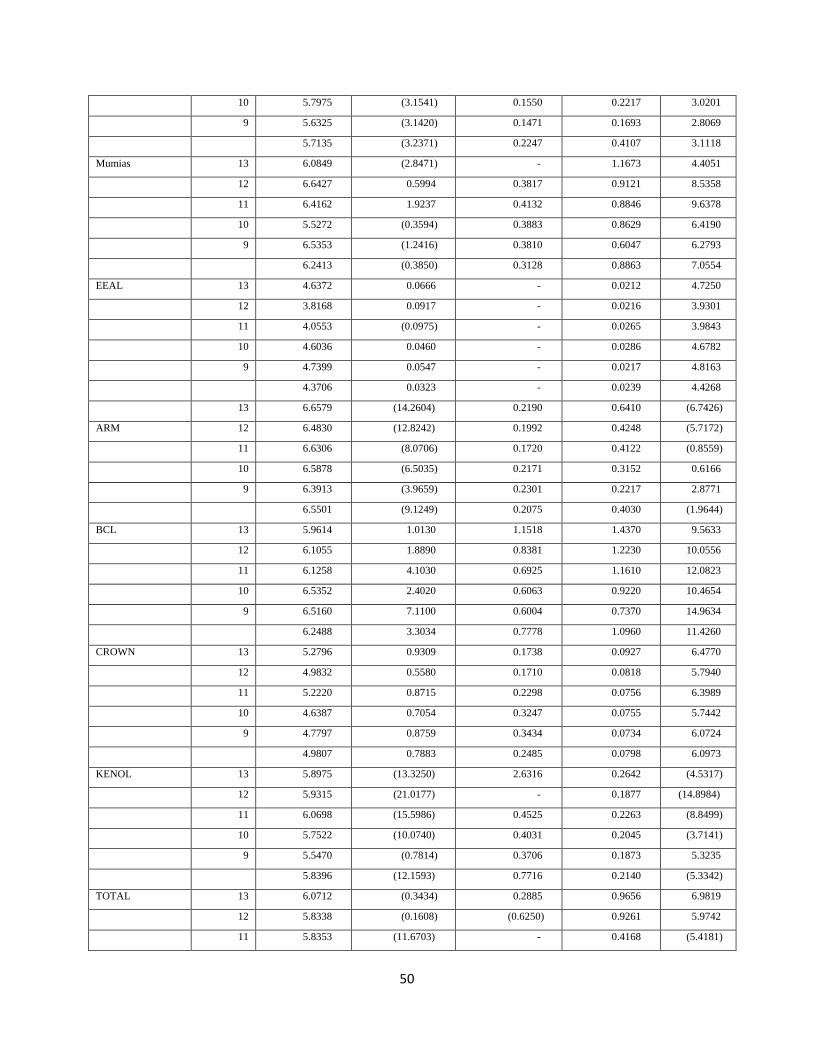
50
10 5.7975 (3.1541) 0.1550 0.2217 3.0201
9 5.6325 (3.1420) 0.1471 0.1693 2.8069
5.7135 (3.2371) 0.2247 0.4107 3.1118
Mumias 13 6.0849 (2.8471) - 1.1673 4.4051
12 6.6427 0.5994 0.3817 0.9121 8.5358
11 6.4162 1.9237 0.4132 0.8846 9.6378
10 5.5272 (0.3594) 0.3883 0.8629 6.4190
9 6.5353 (1.2416) 0.3810 0.6047 6.2793
6.2413 (0.3850) 0.3128 0.8863 7.0554
EEAL 13 4.6372 0.0666 - 0.0212 4.7250
12 3.8168 0.0917 - 0.0216 3.9301
11 4.0553 (0.0975) - 0.0265 3.9843
10 4.6036 0.0460 - 0.0286 4.6782
9 4.7399 0.0547 - 0.0217 4.8163
4.3706 0.0323 - 0.0239 4.4268
13 6.6579 (14.2604) 0.2190 0.6410 (6.7426)
ARM 12 6.4830 (12.8242) 0.1992 0.4248 (5.7172)
11 6.6306 (8.0706) 0.1720 0.4122 (0.8559)
10 6.5878 (6.5035) 0.2171 0.3152 0.6166
9 6.3913 (3.9659) 0.2301 0.2217 2.8771
6.5501 (9.1249) 0.2075 0.4030 (1.9644)
BCL 13 5.9614 1.0130 1.1518 1.4370 9.5633
12 6.1055 1.8890 0.8381 1.2230 10.0556
11 6.1258 4.1030 0.6925 1.1610 12.0823
10 6.5352 2.4020 0.6063 0.9220 10.4654
9 6.5160 7.1100 0.6004 0.7370 14.9634
6.2488 3.3034 0.7778 1.0960 11.4260
CROWN 13 5.2796 0.9309 0.1738 0.0927 6.4770
12 4.9832 0.5580 0.1710 0.0818 5.7940
11 5.2220 0.8715 0.2298 0.0756 6.3989
10 4.6387 0.7054 0.3247 0.0755 5.7442
9 4.7797 0.8759 0.3434 0.0734 6.0724
4.9807 0.7883 0.2485 0.0798 6.0973
KENOL 13 5.8975 (13.3250) 2.6316 0.2642 (4.5317)
12 5.9315 (21.0177) - 0.1877 (14.8984)
11 6.0698 (15.5986) 0.4525 0.2263 (8.8499)
10 5.7522 (10.0740) 0.4031 0.2045 (3.7141)
9 5.5470 (0.7814) 0.3706 0.1873 5.3235
5.8396 (12.1593) 0.7716 0.2140 (5.3342)
TOTAL 13 6.0712 (0.3434) 0.2885 0.9656 6.9819
12 5.8338 (0.1608) (0.6250) 0.9261 5.9742
11 5.8353 (11.6703) - 0.4168 (5.4181)
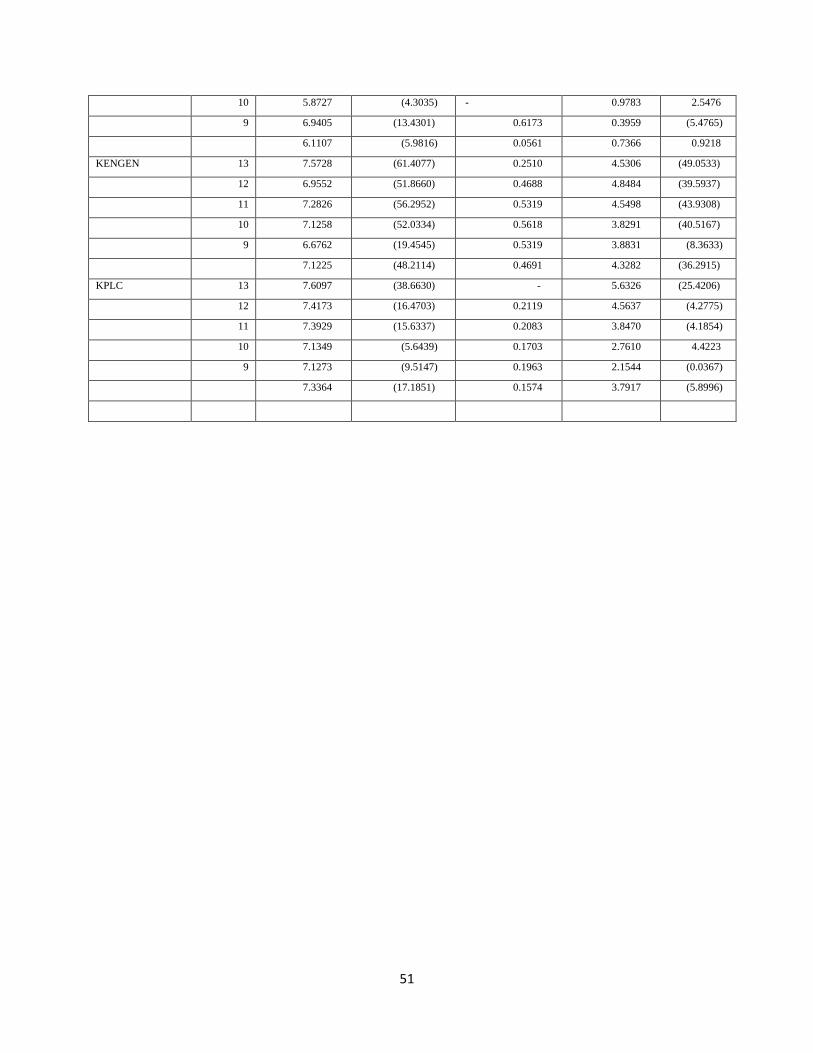
51
10 5.8727 (4.3035) - 0.9783 2.5476
9 6.9405 (13.4301) 0.6173 0.3959 (5.4765)
6.1107 (5.9816) 0.0561 0.7366 0.9218
KENGEN 13 7.5728 (61.4077) 0.2510 4.5306 (49.0533)
12 6.9552 (51.8660) 0.4688 4.8484 (39.5937)
11 7.2826 (56.2952) 0.5319 4.5498 (43.9308)
10 7.1258 (52.0334) 0.5618 3.8291 (40.5167)
9 6.6762 (19.4545) 0.5319 3.8831 (8.3633)
7.1225 (48.2114) 0.4691 4.3282 (36.2915)
KPLC 13 7.6097 (38.6630) - 5.6326 (25.4206)
12 7.4173 (16.4703) 0.2119 4.5637 (4.2775)
11 7.3929 (15.6337) 0.2083 3.8470 (4.1854)
10 7.1349 (5.6439) 0.1703 2.7610 4.4223
9 7.1273 (9.5147) 0.1963 2.1544 (0.0367)
7.3364 (17.1851) 0.1574 3.7917 (5.8996)

52
Appendix IV: The Regression Results for the Relationship between Liquidity and Leverage
Coefficients
Model Unstandardized
Coefficients
Standardized
Coefficients
t Sig. 95.0% Confidence
Interval for B
Correlations Collinearity Statistics
B Std.
Error
Beta Lower
Bound
Upper
Bound
Zero-
order
Partial Part Tolerance VIF
(Constant) 5.150 0.297
17.320 0.000 4.495 5.804
FCF 0.635 0.271 2.011 2.345 0.039 0.039 1.231 0.707 0.577 0.435 0.047 21.394
DPR -1.210 0.740 -0.345 -1.634 0.131 -2.839 0.420 0.032 -0.442 -0.303 0.772 1.295
Depreciation -0.290 0.198 -1.223 -1.468 0.170 -0.725 0.145 0.644 -0.405 -0.272 0.050 20.189
a. Dependent Variable: NCE