THE RELATIONSHIP BETWEEN EXCHANGE RATE ...chss.uonbi.ac.ke/sites/default/files/chss/BONFACE W...THE...
60
THE RELATIONSHIP BETWEEN EXCHANGE RATE VOLATILITY AND BALANCE OF PAYMENTS IN KENYA BONFACE W. BARASA D61/60463/2011 A RESEARCH PROJECT SUBMITTED IN PARTIAL FULFILMENT OF THE REQUIREMENT FOR THE AWARD OF MASTER OF BUSINESS ADMINISTRATION DEGREE, SCHOOL OF BUSINESS, THE UNIVERSITY OF NAIROBI November, 2013
-
Upload
truongxuyen -
Category
Documents
-
view
216 -
download
0
Transcript of THE RELATIONSHIP BETWEEN EXCHANGE RATE ...chss.uonbi.ac.ke/sites/default/files/chss/BONFACE W...THE...
THE RELATIONSHIP BETWEEN EXCHANGE RATE
VOLATILITY AND BALANCE OF PAYMENTS IN KENYA
BONFACE W. BARASA
D61/60463/2011
A RESEARCH PROJECT SUBMITTED IN PARTIAL FULFILMENT
OF THE REQUIREMENT FOR THE AWARD OF MASTER OF
BUSINESS ADMINISTRATION DEGREE, SCHOOL OF BUSINESS,
THE UNIVERSITY OF NAIROBI
November, 2013
ii
DECLARATION
This research project is my original work and has not been presented for award of a
degree or diploma in any other university, college and institution or for any other
purpose.
Signed: …………………………………. Date ………………………...
Bonface Barasa
D61/60463/2011
This research project has been submitted for examination with my approval as the
University supervisor.
Signed: ………………………………….. Date ………………………...
Dr. Josiah Aduda
Senior Lecturer, Department of Finance and Accounting
University of Nairobi

iii
ACKNOWLEDGEMENTS
I wish recognize a number of individuals who contributed to the successful completion of
this research project. My sincere gratitude to my project’s supervisor Dr. Josiah Aduda,
lecturer Department of Finance and Accounting for his tireless guidance, selfless
dedication and encouragement in making this project a reality.
I also wish to acknowledge the contribution of the rest of University of Nairobi fraternity
especially the library staff and MBA coordination office for the success of this project.
My sincere gratitude to Central Bank of Kenya and Kenya National Bureau of Statistics
for the provision of necessary data used in the completion of this study. I am most
grateful to all writers referenced on this document for providing me with important
information both published and unpublished to put together this research project.
I would like to thank my workmates together with the other support staff for their
kindness, friendship and support. Relentless encouragement from the Retail Director and
Head of Personal Banking Mr. Edgar Kalya and Linda Kameme respectively at NIC
Bank was immense. And to all my dear friends, thank you for your support,
understanding and encouragement expressed to me in many special ways.
Most important of all I extend my gratitude to the almighty God for providing me with
strength, good health, wisdom and knowledge that helped make this project a reality. To
all of you kindly accept my appreciation for your great support.

iv
DEDICATION This research project is dedicated to my parents and my lovely friend Catherine Kerubo.
You tirelessly took upon yourselves to encourage and support me spiritually, emotionally
and materially. All these have been put together with your greatest support and presence.

v
ABSTRACT
Exchange rate policy is considered as one of the powerful tools of economic regulation.
The BOP is a record of all the transactions between the residents of the economy and the
rest of the world over a period of time. The objective of this study was to determine the
relationship between exchange rate volatility and BOP in Kenya. The study adopted a
quantitative comparative design to determine the relationship between the two variables.
The study used data from financial market players and regulators, that is CBK, CMA,
NSE, banks, insurance companies, mutual and pension funds and importers/exporters.
From the analysis, the exchange rate affects the prices at which a country trades with the
rest of the world and is important for economic analysis and policy formulation. The
study concludes that apart from the exchange rates herein discussed, there are other
factors having greater influence on the levels of BOP. The study recommends that in
Kenya, BOP is an important component of development because the country is a net
importer. The country requires capital equipment which consumes a considerable amount
of foreign currency compared to her exports. This study recommends proper policies to
maintain stable exchange rates as they play an important role in determining the demand
for and supply of both imports and exports. It is through exports that the country earns
foreign exchange. The study further recommends that the government to promote the
export which earns the country foreign exchange which can then be used to pay off
imports which affects the BOP. The study also recommends that the government provides
relevant structures and environment for the smooth operation of import export market in
the country.
vi
ABBREVIATIONS
ARDL: Autoregressive Distributed Lag
BOP: Balance of Payments
CMA : Capital Markets Authority
EU: European Union
KIPPRA: Kenya Institute for Public Policy Research and Analysis
KNBS: Kenya National Bureau of Statistics
NSE: Nairobi Securities Exchange
PPP: Purchasing Power Parity
SDR: Special Drawing Rate
U.S: United States
USD: United Sates Dollars
VEC: Vector Error Correction
VECM: Vector Error Correction Model
CBK: Central Bank of Kenya
KES: Kenya Shilling
SPSS: Statistical Package for the Social Sciences.
vii
TABLES AND FIGURES Table 4.2: Model Summary ........................................................................................... 33
Table 4.3: ANOVA ....................................................................................................... 35
Table 4.4: Coefficients of Determination ....................................................................... 35
Figure 4.1 Exchange Rate Volatility Analysis ................................................................ 28
Figure 4.2: Balance of Payments Analysis ..................................................................... 30

viii
TABLE OF CONTENTS
Declaration .................................................................................................................... ii
Acknowledgement ......................................................................................................... iii
Dedication ..................................................................................................................... iv
Abstract ...........................................................................................................................v
Abbreviations ................................................................................................................ vi
Tables and Figures ........................................................................................................ vii
DEDICATION ......................................................................................................... iv
CHAPTER ONE: INTRODUCTION ......................................................................1
1.1 Background of the Study ........................................................................................1
1.1.1 Exchange Rate Volatility .................................................................................3
1.1.2 Relationship between Balance of Payments and Exchange Rates .....................3
1.1.3 Exchange Rate Regimes in Kenya ...................................................................4
1.1.4 Balance of Payments in Kenya ........................................................................6
1.2 Statement of the Problem .......................................................................................7
1.3 Objectives of the Study ..........................................................................................8
1.4 Significance of the Study .......................................................................................9
CHAPTER TWO: LITERATURE REVIEW ....................................................... 10
2.1 Introduction ......................................................................................................... 10
2.2 Theoretical Review .............................................................................................. 10
2.2.1 Purchasing Power Parity (PPP) ...................................................................... 11
2.2.2 Adam Smith’s Theory of Absolute Advantage............................................... 12
2.2.3 The Comparative Advantage Theory ............................................................. 13
2.3 Balance of Payments ............................................................................................ 14

ix
2.4 Exchange Rate Volatility ..................................................................................... 16
2.5 Review of Empirical Studies ................................................................................ 17
2.6 Conclusion ........................................................................................................... 22
CHAPTER THREE: RESEARCH METHODOLOGY ........................................ 24
3.1 Introduction ......................................................................................................... 24
3.2 Research Design .................................................................................................. 24
3.3 Population and Sampling Design....................................................................... 24
3.4 Data Collection Methods ...................................................................................... 25
3.5 Data Analysis Methods ........................................................................................ 25
3.5.1 Conceptual model ......................................................................................... 25
3.5.2 Empirical model ............................................................................................ 26
CHAPTER FOUR: DATA ANALYSIS, FINDINGS AND DISCUSSION ........... 27
4.1 Introduction ......................................................................................................... 27
4.2 Exchange Rate Volatility ..................................................................................... 27
4.3 Balance of Payments ............................................................................................ 30
4.4 Regression Analysis ............................................................................................. 33
4.5. Summary and Interpretation of Findings ............................................................. 36
CHAPTER FIVE: SUMMARY, CONCLUSIONS AND RECOMMENDATIONS
...................................................................................................................................... 41
5.1 Summary ............................................................................................................. 41
5.2. Conclusions ........................................................................................................ 42
5.3 Policy Recommendations ..................................................................................... 43
5.4. Limitations of the Study ...................................................................................... 45
5.5 Suggestions for Further Studies ............................................................................ 46
References ................................................................................................................. 48

x
APPENDICES ......................................................................................................... 50
Appendix I: Data on Exchange Rate of the Kenya Shilling Against the USD ............. 50
Appendix II: Data for Cumulative Balance of Payments in USD in Kenya ................. 50

1
CHAPTER ONE: INTRODUCTION
1.1 Background of the Study
Exchange rate policy is considered as one of the powerful tools of economic regulation
and the regulation of the external sector in an economy Ndung’u, (2000). Exchange rates
affect the prices at which a country trades with the rest of the world making it an integral
part of an open economy analysis and policy formulation. One of the aims of the
exchange rate policy is to affect the trade balance in a certain direction. Exchange rate
and monetary policies are key tools in economic management and in the stabilization and
adjustment process in developing countries, where low inflation and international
competitiveness have become major policy targets. External trade can be stimulated
through several channels including: preferences, subsidies, quotas, taxes and other
limitation which could be used to push the trade balance in the desired direction Cavallo
(2004). However, these tools have to be used cautiously to promote economic
development of an economy. For this reason, exchange rate policy stays almost only
possible tool for controlling the BOP
The balance of payments is a record of all the transactions between the residents of the
economy and the rest of the world over a period of time. It records all the money flows
between the economy and the rest of the world and it is made up of the current account,
the capital and financial account. The current account records flows of goods, services,
incomes and current transfers and it is the sum of four balances which include: the goods
balance, the services balance, the income balance and net current transfers Baharumshah,

2
(2001). The goods balance, also known as the balance on goods, the balance on trade in
goods, the balance of visible trade, the balance of merchandise trade or the visible
balance, is computed by subtracting imports of goods from exports of goods. The goods
balance is positive when exports of goods exceed imports of goods Arize (1994). The
services balance, also known as the balance on services or the balance on trade in
services, is computed by subtracting imports of services from exports of services. The
services balance is positive when exports of services exceed imports of services. The
income balance, also known as the balance on income, is computed by subtracting
outward income remittances from inward income remittances where income refers to
wages, rent, interest and profits. The income balance is positive when inward income
remittances exceed outward income remittances Arize (1994). Net current transfers, also
known as net unilateral transfers or net unilateral current transfers, are computed by
subtracting outward current transfers from inward current transfers. Currents transfers are
government contributions to and receipts from other economies and international
transfers of money by private individuals and firms. In the balance of payments, money
inflows are recorded as credits and are entered with a positive sign, and money outflows
are recorded as debits and are entered with a negative sign. The sum of the goods balance
and the services balance is commonly referred to as the balance on goods or services, the
balance of trade or simply the trade balance. The sum of the services balance, the income
balance and net current transfers is commonly referred to as the invisible balance
Baharumshah (2001).
3
1.1.1 Exchange Rate Volatility
The exchange rate is the price of a unit of foreign currency in terms of the domestic
currency Cavallo (2004). Exchange rate serves as the basic link between the local and the
overseas market for various goods, services and financial assets. Using the exchange rate,
one is able to compare prices of goods, services, and assets quoted in different currencies.
Exchange rate volatility can affect actual inflation as well as expectations about future
price volatility Baharumshah (2001). Changes in the exchange rate tend to directly affect
domestic prices of imported goods and services. Exchange rate volatility can affect the
country’s external sector through its impact on foreign trade. The exchange rate affects
the cost of servicing on the country’s foreign debt.
Under the system of freely floating exchange rates, the value of the foreign currency in
terms of the local currency, like any commodity or service being sold in the market, is
determined by the forces of supply and demand Huchet-Bourdon and Korinek (2011).
Under a fixed exchange rate system, a par value rate is set between the local currency and
the foreign currency by the central bank. The par value may be adjusted from time to
time Arize (1994).
1.1.2 Relationship between Balance of Payments and Exchange Rates
A balance of payments surplus occurs when money inflows exceed money outflows. In
other words, the total currency flow is positive. When this happens, the demand for
domestic currency will exceed the supply which will lead to an upward pressure on the
exchange rate, Arize (1994). Under the flexible exchange rate system, the resultant

4
appreciation of domestic currency will lead to a decrease in net exports which will correct
the balance of payments surplus. Since the total currency flow is equal to zero and these
is no change in the reserve assets held by the central bank, the sum of the current account
balance, the capital and financial account balance and net errors and omissions is equal to
zero.
Theoretically, a current account deficit should cause the value of the local currency to
fall. In this case, the value of imports into the importing country is higher than the value
of exports sold to foreigners Baharumshah (2001). Hence, the demand for foreign
currencies to buy these imports is higher than the demand for the local currency to by our
exports. Simple supply and demand analysis, therefore, suggests that the value of the
local currency should fall. For a current account surplus, the value of the local currency
to goes up. In this case, the value of imports into the importing country is lower than the
value of exports sold to foreigners. Hence, the demand for foreign currencies to buy these
imports is lower than the demand for the local currency to by exports Cavallo (2004). In
the case of a deficit, the subsequent lower value of the local currency makes export
relatively cheaper and imports relatively more expensive. The value of exports sold
should rise and the value of imports bought should fall. The deficit should be eliminated
automatically Cavallo (2004).
1.1.3 Exchange Rate Regimes in Kenya
Until 1974, the exchange rate for the Kenya shilling was pegged to the US dollar, but
after discrete devaluations the peg was changed to the special drawing rate (sDR).
Between 1974 and 1981 the volatility of the nominal exchange rate relative to the dollar

5
was erratic. In general the rate depreciated by about 14% and this depreciation
accelerated in 1981/82 with further devaluations. The exchange rate regime was changed
to a crawling peg in real terms at the end of 1982. This regime was in place until 1990; a
dual exchange rate system was then adopted that lasted until October 1993, when, after
further devaluations, the official exchange rate was abolished. That is, the official
exchange rate was merged with the market rate and the shilling was allowed to float
Ndung’u (2000).
Exchange controls were maintained until the 1990s, initially in response to the balance of
payments crisis in 1971 /72. In order to conserve foreign exchange and control pressures
on the balance of payments, the government chose controls instead of liberalization. The
controls were an easy response to contain balance of payments and inflationary pressures,
but they created major distortions in the economy that were not evident until the early
1980s. The major instruments of monetary policy in Kenya have been open market
operations, cash and liquidity ratios, credit ceilings, and reserve requirements. In the
1990s, the authorities relied more on the indirect instruments, the most active being open
market operations Ndung’u (2000).
The recurring policy objectives were to maintain an exchange rate that would ensure
international competitiveness while at the same time keeping the domestic rate of
inflation at low levels, conducting a strict monetary stance and maintaining positive real
interest rates. The floating exchange rate system adopted in the 1990s was expected to
have several advantages for Kenya. First, it would allow a more continuous adjustment of
the exchange rate to shifts in the demand for and supply of foreign exchange Ndung’u
(2000). Second, it would equilibrate the demand for and supply of foreign exchange by
6
changing the nominal exchange rate rather than the levels of reserves. Third, it would
give Kenya the freedom to pursue its monetary policy without having to be concerned
about balance of payments effects. Thus the country would have an independent
monetary policy, but one that was consistent with the exchange rate volatility. Under the
floating system external imbalances would be reflected in exchange rate volatility rather
than reserve volatility Ndung’u (2000).
1.1.4 Balance of Payments in Kenya
Balance of payments deficits have been a common phenomenon in the Kenyan economy
from the 1960s. The government has over the years enacted various policy measures
aimed at remedying the situation; however the balance of payments situation does not
seem to have improved despite these policy measures Mambo (2012). Kenya’s overall
balance of payments position improved by Ksh.26.8 billion, from a surplus of Ksh.11.2
billion in the first quarter of 2011, to a surplus of Ksh 37.0 million in first quarter of 2012
KNBS (2012). The volatility followed growth in the capital and financial account, from a
surplus of Ksh 57.8 billion in the first quarter of 2011, to a surplus of Ksh 65.7 billion in
the first quarter of 2012. The deficit in the current account widened from a deficit of Ksh
76.4 billion in the first quarter of 2011 to a deficit Ksh 81.1 billion in the first quarter of
2012. The deterioration in the current account was mainly as a result of a 20.8 per cent
widening of the merchandise account deficit.
Kenya’s overall balance of payments position declined by US$ 220.7 million from a
surplus of US$ 360 million in May 2011 to a surplus of US$ 139 million in May 2012
Stratlink, (2012). The deterioration was largely due to narrowing of the current account.
7
The current account deficit nearly doubled to 13.1 % of GDP. Imports grew by almost 20
%, while exports only increased by 10 %, thus representing a net export of -10%. Import
growth was mainly driven by oil imports, which accounted for 27.6% of the total import
bill in 2011, jumping from US$ 2.7 billion (8.9% of GDP) in 2010, to USD 4.1 billion
(11.6% of GDP) in 2011 Stratlink (2012).
Kenya’s competitiveness in some sectors declined as domestic prices, including food,
energy and transport, remain elevated and this put pressure on exporters’ margins as well
as on overall competitiveness. As a result, non-tradable sectors, especially services and
construction, were driving growth while the share of tradable sectors, especially
manufacturing, was declining Stratlink (2012). Kenya’s growth is mainly driven by
consumption. Domestic savings have been declining and the excess of investments over
savings is increasing the current account deficit.
1.2 Statement of the Problem
Yuen-Ling, Wai-Mun and Geoi-Mei (2008) examined real exchange rate and trade
balance relationship through an empirical study on Malaysia. This study showed that
exchange rate depreciation in Serbia improved trade balance in the long run, while giving
rise to a J-curve effect in the short run. Sekantsi (2009) used ARCH and GARCH models
to examine the effect of real exchange rate volatility on South African exports to the U.S.
for the period 1990:1- 2000:4.The findings are that Rand’s real exchange rate variability
exerts a significant and negative impact of exports both in the long and short-run.
Mungami (2012) examined the effects of exchange rate liberalization on the balance of
payments of a developing country using a case of Kenya. He noted that exchange rate is

8
one of the macroeconomic fundamentals that play a key role in ensuring that the
economy of a country remains competitive in the international market.
Several scholars and researcher have reviewed the subject of exchange rate volatility and
the levels of macroeconomics in Kenya. Ambunya (2012) studied the relationship
between exchange rate movement and stock market returns volatility at the Nairobi
Securities Exchange and concluded that that there is a strong relationship between
exchange rate movement and stock market returns volatility. Mwanza (2012) reviewed
the relationship between monetary policy and the performance of the NSE and
established that the monetary policies including exchange rates greatly affected the stock
returns at the NSE following the high level of foreign investors and the high fluctuations
in the change rates.
Mungami (2012) examined the effects of exchange rate liberalization on the balance of
payments of a developing country using a case of Kenya. Mungami (2012) recommends
development of forward, futures and options markets to enable the companies to certainly
forecast the expected exchange rates in the future hence facilitate planning. From the
above discussion, it is evident that limited research has been conducted on the
relationship between exchange rate movement and balance of payments in Kenya. This
study therefore aimed at filling this research gap by answering one question: What is the
relationship between exchange rate volatility and balance of payments in Kenya?
1.3 Objectives of the Study
The objective of this study was to determine the relationship between exchange rate
volatility and balance of payments in Kenya
9
1.4 Significance of the Study
The study would be important to various stakeholders, chief among them being: To
contribute to the existing body of knowledge on the relationship between exchange rate
volatility and balance of payments in Kenya and thus serve as a source of reference for
further research. The recommendations for future research would also help researchers to
carry out more studies to extend the understanding of how exchange rate volatility
influences the balance of payments in Kenya.
The study would help government policy makers in understanding the behavior of the
exchange rate volatility on balance of payments and the entire economic development of
the country. Through the findings of this study, the policy makers would be able to
device what strategies need to be done to ensure stable exchange rates and balance of
payments.
The study would help commercial banks to hedge foreign exchange risk. Foreign
exchange risk arises when a bank holds assets or liabilities in foreign currencies and
impacts the earnings and capital of bank due to the fluctuations in the exchange rates. In
free market economy, no one can predict what the exchange rate would be in the next
period; it can move in either upward or downward direction regardless of what the
estimates and predictions were. This uncertain volatility poses a threat to the earnings and
capital of bank. Foreign exchange risk of a commercial bank comes from its very trade
and non trade- services.

10
CHAPTER TWO: LITERATURE REVIEW
2.1 Introduction
This chapter reviews the literature on the economic and financial impact of the
relationship between exchange rate volatility and BOP. From this review, broad
categories will be derived which will help to identify the economic and financial impact
of the relation between the two variables in Kenya. As the economic interdependence of
countries around the world increases, it becomes increasingly important to understand the
nature and significance of their international exchanges and volatility. The balance of
payments accounts provide a detailed record of any economy’s international economic
transactions, and these accounts are central to understanding of the degree of economy’s
integration with the rest of the world. Specifically, the chapter addresses the theoretical
framework guiding the study, reviews empirical studies, concept of balance of payments,
exchange rate and finally gives a conclusion.
2.2 Theoretical Review
This section reviews theories that will guide the study. It consists of the theories
governing international trade and balance of payments. In particular, the section looks at
the Purchasing Power Parity (PPP) which involves a relationship between a country’s
foreign exchange rate and the level or volatility of its national price level relative to that
of a foreign country; Adam Smith’s theory of absolute advantage which holds that for
two nations to trade with each other voluntarily, both nations must gain; and the
11
Comparative Advantage Theory which show that the potential gains from trade are far
greater than Smith envisioned in the concept of absolute advantage.
2.2.1 Purchasing Power Parity (PPP)
Purchasing power parity (PPP) involves a relationship between a country’s foreign
exchange rate and the level or volatility of its national price level relative to that of a
foreign country. Absolute PPP states that the purchasing power of a unit of domestic
currency is exactly the same in the foreign economy, once it is converted into foreign
currency at the absolute PPP exchange rate Coakley, Flood, Fuertes, and Taylor, (2005).
Purchasing power parity (PPP) is a disarmingly simple theory that holds that the nominal
exchange rate between two currencies should be equal to the ratio of aggregate price
levels between the two countries, so that a unit of currency of one country will have the
same purchasing power in a foreign country Taylor and Taylor (2004). The general idea
behind purchasing power parity is that a unit of currency should be able to buy the same
basket of goods in one country as the equivalent amount of foreign currency, at the going
exchange rate, can buy in a foreign country, so that there is parity in the purchasing
power of the unit of currency across the two economies. One very simple way of gauging
whether there may be discrepancies from PPP is to compare the prices of similar or
identical goods from the basket in the two countries.
Relative PPP implies that changes in national price levels are set by commensurate
changes in the nominal exchange rates between the relevant currencies. The voluminous
research literature on PPP published in recent decades has been driven by econometric
problems relating to univariate and panel unit root tests of necessary conditions for long-
12
run absolute PPP to hold, in particular whether the real exchange rate has any tendency to
settle down to a long-run equilibrium level Coakley, Flood, Fuertes, and Taylor (2005).
These include issues such as low power, possible structural breaks, the mixture of
stationary and non-stationary error terms in the relevant regressions, and neglected cross-
sectional dependence when real exchange rate panel data are used Taylor and Taylor
(2004).
2.2.2 Adam Smith’s Theory of Absolute Advantage
Smith (1776) is recognized as the founder of modern economics and as one of the first
and most famous thinkers who argued in favour of free international trade. Smith (1776)
held that for two nations to trade with each other voluntarily, both nations must gain. If
one nation gained nothing or lost, it would refuse it. According to Smith, mutually
beneficial trade takes place based on absolute advantage. When one nation is more
efficient or has an absolute advantage than the other nation is producing a second
commodity, then both nations gain by each specializing in the production of the
commodity of its absolute advantage and exchanging part of its output with the other
nation for the commodity of its absolute disadvantage.
Through free trade, resources are mostly efficiently utilized and output of both
commodities will rise. Smith thus argued that all nations would gain from free trade and
strongly advocated a policy of laissez-faire. Under free trade, world resources would be
utilized mostly efficiently and world welfare would be maximized. This theory promoted
international trade which leads to exchanging goods and services which in turn leads the
usage of exchange rates to convert one currency into another. This theory is important to

13
this study because it deals with international trade, exchange rates and balance of
payments for the economies involved.
2.2.3 The Comparative Advantage Theory
The trade theory was the first to indicate the importance of specialization in production
and division of labor based on the idea of theory of absolute advantage. Smith (1776) in
his famous book: “The Wealth of Nations’’ published the ideas about absolute advantage
were crucial for the early development of classical thought for international trade. It is
generally agreed that David Ricardo is the creator of the classical theory of international
trade, even though many concrete ideas about trade existed before his principles.
Ricardo showed that the potential gains from trade are far greater than Smith envisioned
in the concept of absolute advantage. In this theory the crucial variable used to explain
international trade patterns is technology. The theory holds that a difference in
comparative costs of production is the necessary condition for the existence of
international trade. But this difference reflects a difference in techniques of production.
According to this theory, technological differences between countries determine
international division of labor and consumption and trade patterns. It holds that trade is
beneficial to all participating countries. This conclusion is against the viewpoint about
trade held by the doctrine of mercantilism where it is argued that the regulation and
planning of economic activity are efficient means of fostering the goals of nation. David
Ricardo theory demonstrates that countries can gain from trade even if one of them is less
productive then another to all goods that it produce
14
2.3 Balance of Payments
The balance of payments (BOP) is a bookkeeping system for recording all payments that
have a direct bearing on the movement of funds between a nation (private sector and
government) and foreign countries Danby (2009). All transactions involving payments
from foreigners to a country are entered in the “Receipts” column with a plus sign (+) to
reflect that they are credits; that is, they result in a flow of funds to a country. Receipts
include foreign purchases of local products known as exports, purchases from foreign
tourists (services), income earned from local country investment abroad which constitutes
investment income, foreign gifts and pensions paid to local citizens commonly called
unilateral transfers, and foreign payments for local assets (capital inflows).
All payments to foreigners are entered in the “Payments” column with a minus sign (-) to
reflect that they are debits because they result in flows of funds to other countries.
Payments include Kenyan purchases of foreign products such as French wine and
Japanese cars (imports), Kenyan travel abroad (services), income earned by foreigners
from investments in Kenya (investment income), foreign aid and gifts and pensions paid
to foreigners (unilateral transfers), and Kenyan payments for foreign assets (capital
outflows) Tsoukalas (2003).
Balance of payments (BOP) accounts are an accounting record of all monetary
transactions between a country and the rest of the world. These transactions include
payments for the country's exports and imports of goods, services, financial capital, and
financial transfers. The BOP accounts summarize international transactions for a specific
period, usually a year, and are prepared in a single currency, typically the domestic
15
currency for the country concerned. Sources of funds for a nation, such as exports or the
receipts of loans and investments, are recorded as positive or surplus items. Uses of
funds, such as for imports or to invest in foreign countries, are recorded as negative or
deficit items Tsoukalas (2003).
When all components of the BOP accounts are included they must sum to zero with no
overall surplus or deficit. For example, if a country is importing more than it exports, its
trade balance will be in deficit, but the shortfall will have to be counterbalanced in other
ways such as by funds earned from its foreign investments, by running down central bank
reserves or by receiving loans from other countries Aziza (2010).
While the overall BOP accounts will always balance when all types of payments are
included, imbalances are possible on individual elements of the BOP, such as the current
account, the capital account excluding the central bank's reserve account, or the sum of
the two. Imbalances in the latter sum can result in surplus countries accumulating wealth,
while deficit nations become increasingly indebted. The term "balance of payments"
often refers to this sum: a country's balance of payments is said to be in surplus
(equivalently, the balance of payments is positive) by a certain amount if sources of funds
(such as export goods sold and bonds sold) exceed uses of funds (such as paying for
imported goods and paying for foreign bonds purchased) by that amount. There is said to
be a balance of payments deficit (the balance of payments is said to be negative) if the
former are less than the latter Aziza (2010).

16
2.4 Exchange Rate Volatility
Exchange rates, like any other commodity, are based on supply and demand for particular
forms of currency. Domestic currency supply changes as a result of a country's fiscal and
monetary policies. Demand for currency can be influenced by a large number of factors,
including interest rates, inflation, and views on impending government regulation. The
continuing increases in the world trade and capital volatility have made the exchange
rates as one of the main determinants of business profitability and the country’s balance
of payments, Kim (2003).
Exchange rate changes directly influence the international competitiveness of firms,
given their impact on input and output price Joseph (2002). Basically, foreign exchange
rate volatility influences the value of the global competitiveness of a nation since the
future cash flows of the national change with the fluctuations in the foreign exchange
rates. When the Exchange rate appreciates, since exporters will lose their competitiveness
in international market, the sales and profits of exporters will shrink hence worsening the
balance of payments. On the other hand, importers will increase their competitiveness in
domestic markets Nieh and Nieh (2006) which leads to too many imports that worsen the
country’s balance of payments. The depreciation of exchange rate will make adverse
effects on exporters and importers. Exporters will have advantage against other countries’
exporters and increase their sales Yau and Nieh (2006). That is, currency appreciation has
both a negative and a positive effect on the country’s BOP Ma and Kao, (1990).

17
2.5 Review of Empirical Studies
Several empirical studies have been conducted on the subject of exchange rate volatility
and international trade. Huchet-Bourdon and Korinek (2011) studied the extent to which
exchange rates and their volatility affected trade flows in China, the Euro area and the
United States in two broadly defined sectors, agriculture on the one hand and
manufacturing and mining on the other. This study found out that exchange volatility
impacted trade flows only slightly. Exchange rate levels, on the other hand, affected trade
in both agriculture and manufacturing and mining sectors but did not explain in their
entirety the trade imbalances in the three countries examined.
Yuen-Ling, Wai-Mun and Geoi-Mei (2008) examined real exchange rate and trade
balance relationship through an empirical study on Malaysia. They attempted to identify
the relationship between the real exchange rate and trade balance in Malaysia from year
1955 to 2006. This study used Unit Root Tests, Cointegartion techniques, Engle-Granger
test, Vector Error Correction Model (VECM), and impulse response analyses. The main
findings of this paper were that long run relationship existed between trade balance and
exchange rate. Other important variables that determined trade balance such as domestic
income showed a long run positive relationship between trade balances, and foreign
income showed a long run negative relationship. Secondly, the real exchange rate was an
important variable to the trade balance, and devaluation improved trade balance in the
long run, thus consistent with Marshall-Lerner condition. Thirdly, the results indicated no
J-curve effect in Malaysia case.

18
Gligorić (2010) examined exchange rate and trade balance checking out for the j-curve
effect in Serbia. This study showed that exchange rate depreciation in Serbia improved
trade balance in the long run, while giving rise to a J-curve effect in the short run. These
results added to the already existent empirical evidence for a diverse set of other
economies. Both Johansen’s and autoregressive distributed lag approach were
respectively used giving similar long-run estimates showing that real depreciation
improved trade balance. Corresponding error correction models as well as impulse
response functions indicated that, following currency depreciation, trade balance first
deteriorates before it later improves, thereby exhibiting the J-curve pattern. These results
were relevant for policy making both in Serbia and in a number of other emerging Europe
countries as they faced major current account adjustments after BOP crises of 2009.
Nuroglu and Kunst (2012) examined the effects of exchange rate volatility on
international trade flows using the evidence from panel data analysis and fuzzy approach.
The study used the gravity model to analyze bilateral trade flows among EU-15 countries.
Firstly, statistical methods were used to identify the determinants of international trade
flows and to quantify their effects. The interest focused especially on the effects of
exchange rate volatility on bilateral trade flows. After finding the individual effect of
exchange rates on trade flows, Nuroglu and Kunst (2012) used the fuzzy approach to see
the effect of exchange rate volatility on trade flows between EU-15 countries.
Sekantsi (2009) used ARCH and GARCH models to examine the effect of real exchange
rate volatility on South African exports to the U.S. for the period 1990:1- 2000. The
findings are that Rand’s real exchange rate variability exerts a significant and negative
impact of exports both in the long and short-run. Another study by Todani and Munyama

19
(2005) employed ARDL bounds testing procedure on quarterly data for the period 1984-
2004 to examine the impact of exchange rate variability on aggregate South African
exports to the rest of the world as well as on goods, services and gold exports. Todani and
Munyama (2005) employed the moving average standard deviation and GARCH (1, 1) as
measures of variability. The results showed that depending on the measure of variability
employed either there existed no statistically significant relationship between South
African exports and exchange rate volatility or when such significant relationship exists it
is positive.
Mungami (2012) examined the effects of exchange rate liberalization on the BOP of a
developing country using a case of Kenya. He noted that exchange rate is one of the
macroeconomic fundamentals that play a key role in ensuring that the economy of a
country remains competitive in the international market. It plays an important role of
efficiently allocating and use of economic resources hence ensuring a country remains
competitive externally. The exchange rates are important in improvement of the balance
of payments. The results showed that the exchange rate liberalization had improved the
overall BOP but it had not improved the current account or reduced the balance of trade
deficit. The study found out that the exchange rate liberalization had a negative effect on
the companies export sales due to wide fluctuations that made planning hard and losses
that were incurred as a result of fluctuation. Most companies did not employ any hedging
mechanism hence bore the brunt of the upswing and downswing of the shilling. The firms
factored in their prices the adverse effect of the exchange rate fluctuation. The study
recommended that the Central Bank of Kenya use target zones to reduce wide fluctuation
of the shilling against other currencies.

20
Ambunya (2012) examined the relationship between exchange rate movement and stock
market returns volatility at the Nairobi Securities Exchange in Kenya. The study
concludes that there is a strong relationship between exchange rate movement and stock
market returns volatility. This was especially carried through the information content of
exchange rate movement on the security’s business. Further, the study concluded that
exchange rate volatility also affected the stock market performance greatly through its
spiral effects. Through macroeconomic variables, exchange rate volatility indicates the
state of the economy hence the likely future state of the economy. These variables would
include things like the interest rate and the money supply in the economy which has great
impact on the activity level of the security’s performance.
Mambo (2012) did an analysis of the relevance of the monetary approach to Kenya's
balance of payments for the period (1969-2002). This study examines the relevance of the
monetary approach to the balance of payments in Kenya using annual data covering the
period 1969 to 2002. The study used the monetary approach which is one of five
approaches to the balance of payments and holds that the balance of payments is
essentially a monetary phenomenon. The others are the Keynesian, elasticity, absorption
and the portfolio balance approaches. The data was tested for unit root tests and co
integration, among the variables established and thus a vector error correction (VEC)
model was estimated. The results of the VEC estimation indicated that BOP is
significantly affected by its own second and third lags, the first and second lags of
exchange rate and the first lag of prices. Granger causality tests showed no causality
between balance of payments and the other five variables. However, impulse response
analysis indicated five years as the period within which balance of payments responded

21
to innovations. Domestic credit and interest rate were the two important variables
affecting Kenya's balance of payments. Exchange rate and prices were also significant.
The study found the monetary approach relevant in managing Kenya's BOP
Kipngetich (2002) looked at the relationship between fiscal deficits and the current
account balance in Kenya between the years 1964-2000. This study examined the effect
of budget deficit on the current account balance in Kenya between, covering the period
from 1964 to 2000. This was motivated by the fact that the magnitude of government had
increased with amazing rapidity since the early 1980s. Simultaneously, the current
account balance recorded deficits, to the extent that there was a high correspondence
between these variables. A macro econometric model that captures the salient
interrelationships between government budgetary developments, credit creation and the
current account balance was constructed. Quantitative evidence suggested that budget
policy affected the current account balance in Kenya. In particular, simulation
experiments showed that budget deficit, engendered by increased expenditure, led to a
deterioration of the current account, whether it was financed through bank credit or
external borrowing. It was argued that budget discipline was necessary for the
achievement of external balance in Kenya.
Kariuki (2008) studied the determinants of current account balance in Kenya using the
inter-temporal approach. Kariuki noted that large and persistent current account deficits
constitute a cause for concern, particularly when sustainability issues are raised and thus
the economic prospects of a country are put at risk. This study considered the major
determinants of the current account in Kenya. It examined the long-run and short-run
impact of the exchange rate and private and public savings on the current account

22
balance. The bounds testing autoregressive distributed lag (ARDL) approach to co-
integration was used and the results indicated that there was strong support for co-
integration relationship between current account balance and the selected variables. The
exchange rate had the strongest impact on the current account, but the signs varied in the
long-run and in the short-run.
2.6 Conclusion
Several studies have been conducted on the relationship between balance of payments
and exchange rates in different countries. Huchet-Bourdon and Korinek (2011) studied
the extent to which exchange rates and their volatility affected trade flows in China, the
Euro area and the United States in two broadly defined sectors, agriculture on the one
hand and manufacturing and mining on the other. Nuroglu and Kunst (2012) examined
the effects of exchange rate volatility on international trade flows using the evidence
from panel data analysis and fuzzy approach. The study used the gravity model to
analyze bilateral trade flows among EU-15 countries. Munyama (2005) employed the
moving average standard deviation and GARCH (1, 1) as measures of variability.
Mungami (2012) examined the effects of exchange rate liberalization on the BOP of a
developing country using a case of Kenya. Ambunya (2012) examined the relationship
between exchange rate movement and stock market returns volatility at the NSE in
Kenya. Mambo (2012) did an analysis of the relevance of the monetary approach to
Kenya's balance of payments for the period (1969-2002). This study examined the
relevance of the monetary approach to the BOP in Kenya using annual data covering the
period 1969 to 2002. Kipngetich (2002) looked at the relationship between fiscal deficits

23
and the current account balance in Kenya between the years 1964-2000. This study
examined the effect of budget deficit on the current account balance in Kenya covering
the period from 1964 to 2000. Kariuki (2008) studied the determinants of current account
balance in Kenya using the inter-temporal approach. From the review of empirical studies
and wide reading, there has been no study dealing with the relationship between
exchange rate volatility and BOP in Kenya, and hence this study therefore seeks to fill
this research by establishing existing relationship if any.

24
CHAPTER THREE: RESEARCH METHODOLOGY
3.1 Introduction
This chapter sets out various stages and phases that were followed in completing this
study. The chapter is concerned with how the research was executed and how
respondents were approached, as well as when, where and how the research was
completed. The following subsections are included; research design, target population,
data collection instruments, data collection procedures and data analysis.
3.2 Research Design
The study adopted a quantitative comparative design which is all about quantifying
relationships between variables. The aim of quantitative research was to determine the
relationship between an independent and a dependent variables outcome in a population.
In particular, the study used descriptive research design because it sought to establish
how exchange rate volatilities related with BOP in Kenya.
3.3 Population and Sampling Design
According to Ngechu (2004), a study population is a well defined or specified set of
people, group of things, households, firms, services, elements or events being
investigated. Thus the population should fit a certain specification which the researcher is
studying and should be homogenous. The population of interest in this study comprised
of the entire financial market players including CBK, CMA, NSE, commercial banks,
insurance companies, mutual and pension funds, importers/exporters in Kenya. The study

25
has used secondary data readily available and certified by the CBK accumulated over the
period of this study.
3.4 Data Collection Methods
The study used secondary data collected from the CBK, KNBS, KIPPRA, Ministry of
Finance, public libraries, national budget and other government records. The use of
secondary data is justified on the basis that these sources have information that was very
vital to this study and had been vetted and accepted by the general public.
3.5 Data Analysis Methods
The researcher collected monthly data on the exchange rates and BOP for the period
between the years 2001 and 2012. The researcher then conducted a regression analysis
using the data collected to establish the extent of the relationship between exchange rate
volatility and BOP.
3.5.1 Conceptual model
The relationship among the variables was estimated using a function:
BOP = f (ER) ………………………………………………………….. (1)
BOP = Balance of Payments
ER= Exchange Rate Volatility
26
3.5.2 Empirical Model
The study used a regression model to predict the extent to which the identified
independent variables affected the dependent variable. In this case, SPSS version 18 was
used in regression analysis and computation of coefficients. The regression line is
represented by the following equation:
Y= β0+β1X1+Є
Where Y=Balance of Payments (in USD currency)
X1= Exchange Rate Volatility (in Ksh currency)
β0= Constant
β1= Rate of change in exchange rate volatility as a result of a unit change in the BOP.
27
CHAPTER FOUR: DATA ANALYSIS, FINDINGS AND
DISCUSSION
4.1 Introduction
This chapter presents analysis and findings of the study as set out in the research
objective and research methodology. The study findings present the relationship between
exchange rate volatility and balance of payments in Kenya. The data was gathered
exclusively from secondary source which is the Central Bank of Kenya and the Kenya
National Bureau of Statistics.
4.2 Exchange Rate Volatility
The study sought to establish the trend in the volatility of exchange rates in Kenya with
reference to the mostly used foreign currency which was United States Dollar. The
findings were as shown in the figure 4.1 below using appendix I data.

28
Figure 4.1Exchange Rate Volatility Analysis
From the findings presented above, during the year 2001, Kenya shilling exchanged at a
stable rate to the United States Dollar of averagely Ksh.78 with a few cents on top or
below. The highest for the year was Ksh.79.02 in July while the lowest was Ksh.77.50 in
April. On average, the exchange rates remained stable during the year 2001 indicating
little variability.
In the year 2003, the exchange rates against the USD started at Ksh.77.72 in January then
the local currency appreciated to Ksh.71.61 by May before depreciating to an annual low
of Ksh.77.90 in September. However, the Kenya shilling gained ground slightly to close
the year at Ksh.76.02. For the year 2004, the exchange rate against USD opened at Ksh.
76.29 then started depreciating to an annual low of Ksh. 81.20 for the months of October
and November before appreciating slighly to close the year at Ksh. 79.77. In general
there was minimal variability in exchange rate.

29
For the year 2005, the exchange rates started at Ksh.77.93 before the local currency
appreciated to a high of Ksh.74.80 in March after which it again started depreciating to
reach Ksh.76.23 in July the same year. It then appreciated slightly for the remainder of
the year to close at Ksh.73.11. For the year 2006, the exchange rate opened at Ksh.72.21
then fluctuated slightly throughout the year to close at an appreciated level of Ksh.69.6 in
December. During this year, it can be seen that there was variability more than the
previous two years.
For the year 2007, the exchange rate opened at Ksh.69.88 then remained stable for two
months with negligible changes before the local currency appreciated to exchange at an
annual high of Ksh.63.30 in December. This year saw great appreciations in the local
currency as it opened the year at Ksh.69.88 and then closed at Ksh.63.30.
The year 2008 started at Ksh.68.08 in January which then depreciated to exchange at
Ksh.70.62 in February before appreciating from March to an annual high of Ksh.61.90 in
May. However, for the remainder of the year, the local currency depreciated continuously
to close the year at Ksh.78.04. In year 2009, the exchange rate opened at Ksh.78.95 then
depreciated slightly for February and March to record Ksh.79.53 and Ksh.80.26
consecutively. Starting April till the end of the year, Kenya Shilling appriciated
marginally top close the year at Ksh.75.43.
In year 2010, the exchange rate opened at Ksh.75.79 then depreciated to a high of
Ksh.81.43 in July and closed the year at Ksh.80.57. The year 2011 started at Ksh.81.03,
with high depreciation recoreded over this year as Kenya shilling hit an all time low of
Ksh.101.27 in October before the government intervened to bring the rate back to

30
Ksh.86.66. The year 2012 opened at Ksh.86.34 in January, before the local currency
appreciated to Ksh.82.90 in March. It then depreciated in the month of May and June to
reach Ksh.84.38 and Ksh.84.79 respectively before strenthening in July and August to
reach Ksh.84.1 and Ksh.84.04 respectively. It then depreciated again to reach Ksh.85.99
in December 2012. These findings are well illustrated in the appendix I.
4.3 Balance of Payments
The study also sought to establish the distribution of the overall balance of paymenst for
the study period. The findings were as presented below in millions of US dollars in
Figure 4.2 and appendix II:
Figure 4.2: Balance of Payments Analysis
31
From the findings of the study shown in Figure 4.2 above and appendix II, the balance of
payments started at a positive USD.231 million dollars in the year 2001 after which it
grew steadily month after month to reach an annual high of USD.372 million by
December. In the year 2002, the BOP started on a low of USD.323 million then reduced
to USD.302 million after which it increased to USD.313 million in March before
dropping to USD.294 million. The fluactuations continued through out the year to close
at USD.59 million in December.
In the year 2003, BOP opened at USD.178 million then reduced to USD.174 million and
USD.149 million for the months of February and March respectively. For the months of
April and May, BOP increased to USD.200 million each. In June, BOP went down to
USD.146 million then started increasing continuously for the remainder of the year to
close at USD.365 million by December.
During the year 2004, BOP started at a high of USD.250 million then dropped
continuously for the first five months of the year to a low of USD 97 million. In June, the
BOP increased slightly to USD.135 million before dropping significantly by August,
September and October to USD.73 million, USD.3 million, and USD -10 million
respectively. It however increased for the last two months of the year to close at USD.107
million and USD.117 million for the months of November and December respectively.
In the year 2005, BOP started on a low of USD 18.million then increased to USD.46
million in February. Starting the month of March to the end of the year, BOP increased
continuously for the remainder of the year from USD.131 million in April to a high of

32
USD.441 million by October before reducing to USD.322 million and USD.306 million
for the months of November and December.
For the year 2006, BOP started at USD.557 million then dropped slightly in the month of
February to USD.539 million. Starting March, BOP started increasing at an increasing
rate to USD.834 million by July. It slight dropped to USD.777 million in August then
fluactuated slightly downwards to close the year at USD 675 million
For the year 2007, BOP started at USD.593 million which grew steadily for two months
consectively to USD.661 million by March then USD.617 million in April. Starting May,
it dropped to USD.419 million then continuously dropped to a low of USD.332 million in
August, after which it started to increase to reach an annual high by December at USD
854 milllion.
In the year 2008, BOP started at USD.973 million after which it reduced subsequently for
the first four .months to USD.614 million in April. It shot up in the month of May to
USD.716 million after which it again started reducing continuously for the remainder of
the year to close at USD -469 million. The negative trend was maintained in the year
2009 starting at USD -743 million in January then increased continuously throughout the
first eleven months to USD 868 million. It then decreased slightly to USD 781 million in
December.
In the year 2010, BOP started at USD.849 million then dropped to USD.787 million in
February. It increased to USD 840 millions in March then dropped for the next two
months to USD.633 million and USD.592 million for the months of May and June
consecutively. It went up in the month of July to USD.665 million before reducing

33
thereafter to reach a low of USD.83 million by November. However the BOP closed the
year at USD.163 million.
During the year 2011, BOP started at USD.199 million then fluactuated to USD.309
million, USD.307 million and USD.297 million in the next three months consecutively. It
increased in May to a high of USD.360 million after which it dropped for the remainder
of the year to a low of USD.220 million and closed the year at USD- 43 million.
In the year 2012, BOP started at a low of USD.137 million. It then increased
continuously for the next three months to USD.674 million in April after which it
dropped to USD.13 million. The upward trend then got out of hand as the BOP hit
positive USD.1,261 million by the end of the year.
4.4 Regression Analysis
In order to establish the relationship between exchange rate volatility and balance of
payments in Kenya, the study conducted a regression analysis. The findings were as
shown in the table 4.2 below:
Table 4.1: Model Summary
Model R R Square Adjusted R Square Std. Error of the Estimate
1 .003a .000 -.007 377.43361
a. Predictors: (Constant), Foreign Exchange Rate
Coefficient of determination explains the extent to which changes in the dependent
variable (balance of payments) can be explained by the change in the independent
variables (foreign exchange rates), or the percentage of variation in the dependent variable

34
that is explained by the independent variable. From the analysis, the independent variable
studied here had a weak negligible inverse relationship with balance of payments as
explained by a low negative adjusted R2 of -0.007. This shows that although foreign
exchange rates have a relationship with balance of payments, the relationship is weak. The
study further conducted an analysis of variance to check on the strength of the model. The
findings were as shown below:
35
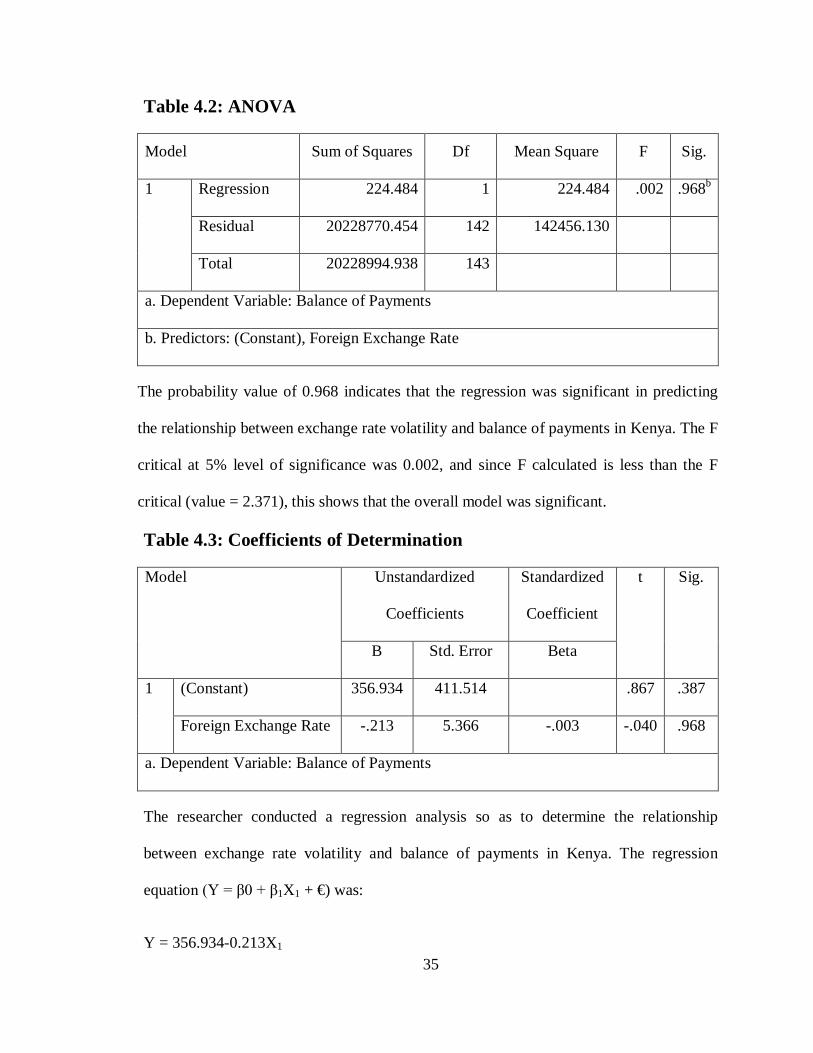
Table 4.2: ANOVA
Model Sum of Squares Df Mean Square F Sig.
1 Regression 224.484 1 224.484 .002 .968b
Residual 20228770.454 142 142456.130
Total 20228994.938 143
a. Dependent Variable: Balance of Payments
b. Predictors: (Constant), Foreign Exchange Rate
The probability value of 0.968 indicates that the regression was significant in predicting
the relationship between exchange rate volatility and balance of payments in Kenya. The F
critical at 5% level of significance was 0.002, and since F calculated is less than the F
critical (value = 2.371), this shows that the overall model was significant.
Table 4.3: Coefficients of Determination
Model Unstandardized
Coefficients
Standardized
Coefficient
t Sig.
B Std. Error Beta
1 (Constant) 356.934 411.514 .867 .387
Foreign Exchange Rate -.213 5.366 -.003 -.040 .968
a. Dependent Variable: Balance of Payments
The researcher conducted a regression analysis so as to determine the relationship
between exchange rate volatility and balance of payments in Kenya. The regression
equation (Y = β0 + β1X1 + €) was:
Y = 356.934-0.213X1
36
Whereby Y = Balance of payments (USD); X1= Foreign exchange rate (that is USD
against Kenya shilling).
As per the regression equation established, there is an inverse relationship between
balance of payments and foreign exchange rates in Kenya. However, the constant was
356.934 which indicated that in normal circumstances, balance of payments in Kenya
would be USD.356.934 million at stable foreign exchange rates. However, a unit
increases in foreign exchange rates influence the balance of payments by USD -0.213
million.
4.5. Summary and Interpretation of Findings
As the economic interdependence of countries around the world increases, it becomes
important to understand the nature and significance of their international exchanges. The
BOP accounts provide a detailed record of an economy’s international economic
transactions, and these accounts are central to the understanding of the degree of an
economy’s integration with the rest of the world. BOP accounts record monetary
settlements between residents of an economy and foreigners, and are often referred to as
the external accounts. However, in addition to monetary settlements, they also record
transactions where goods only may be transferred, as is the case with some forms of
foreign aid. From the findings of the study, the BOP grew steadily since the year of
inception for this study to reach high positive figures towards the end of the study period.
Exchange rates play an important role in international trade and investment as they affect
the price of internationally traded goods and services. An exchange rate is a price; the
price of one currency in terms of another International Monetary Fund (1993). Exchange
37
rate volatility reflect the economy-wide effects of changes in trade flows, world
commodity prices, and capital flows between economies that are highly integrated, both
with each other and with global goods, services, and financial markets. Exchange rate
fluctuations therefore affect consumers and producers of internationally traded goods and
services and firms with assets and liabilities denominated in foreign currencies. Since
exchange rates are shared macroeconomic variables, such fluctuations for any
internationally integrated economy have counterpart effects in its trading partners.
An economy’s supply of foreign exchange arises from export and asset sales to
foreigners, as well as income received from abroad, whereas its demand for foreign
currency stems from import and foreign asset demand and income payable abroad. The
exchange rate equilibrates the supply and demand of foreign currency and for this reason
is considered the single most important relative price in highly internationalized
economies. If an economy adopts a pegged or a heavily managed exchange rate system,
its central bank assumes responsibility for controlling its exchange rate.
Exchange rates deal with the value of one currency in terms of another. Devaluation in
the currency lowers one currency's value in terms of the other. For this study, it was
established that the prevailing exchange rates fluctuated significantly during the study
period. In the inception year 2000, the amount of Kenya shillings exchanged for one
United States Dollar was Ksh.70.68 as at January. In the year 2001, Kenya shilling
exchanged at a stable rate to the USD averaging Ksh.78 with a few cents on top or below.
The highest for the year was Ksh.79.02 in July while the lowest was Ksh.77.50 in April.
On average, the exchange rates remained stable during the year 2001. In the year 2003,
the exchange rates against the dollar started at Ksh.77.72 in January then the local

38
currency appreciated to Ksh.71.61 by May before depreciating to an annual low of
Ksh.77.90 in September. However, the Kenya shilling gained ground.
For the year 2005, the exchange rates started at Ksh.77.93 before the local currency
appreciated to a high of Ksh.74.80 in March after which it again started depreciating to
reach Ksh.76.23 in July the same year. For the year 2007, the exchange rate opened at
Ksh.69.88 then remained stable for two months with negligible changes before the local
currency appreciated to exchange at an annual high of Ksh.63.30 in December.
For the year 2009, the exchange rate opened at Ksh.78.95 then depreciated slightly for
February and March to record Ksh.79.53 and Ksh.80.26 consecutively. In 2010, the
exchange rate against the USD opened at Ksh.75.79 but depreciated continuously to a
high of Ksh.81.43 in July and then closed the year at Ksh.80.57. The year 2011 started at
Ksh.81.03. However, high fluctuations were recorded over this year as Kenya shilling
depreciated to an all time high of Ksh.101.27 in October before the government
intervened to bring the rate back to Ksh.86.66.
The balance of payments is a systematic array of all the factors that determine the foreign
exchange rate. That array follows long established conventions and is all-inclusive and
mutually exclusive among the individual factors. The balance of payments started at a
positive USD.231 million in the year 2001 after which it grew steadily month after month
to reach an annual high of USD.372 Million by December. In the year 2003, BOP opened
at USD.178 million then reduced to USD.174 million and USD.149 million for the
months of February and March respectively. For the year 2005, BOP started on a low of
USD.18 million then increased to USD.46 million in February. For the year 2007, BOP
39
started at USD.593 million which grew steadily for two months consecutively to
USD.661 million by March then USD.617 million in April. Starting May, it dropped to
USD.419 million then continuously dropped to a low of USD.332 million in August after
which it started to increase to reach an annual high by December at USD.854 million.
During the year 2008, BOP started at USD.973 million after which it reduced
subsequently for the first four months to USD.614 million in April. It shot up in the
month of May to USD.716 million after which it again started reducing continuously for
the remainder of the year to close at USD-469 million. In the year 2010, BOP started at
USD.849 million then dropped to USD.787 million in February. It increased to USD.840
millions in March then dropped for the next two months to USD.633 million and
USD.592 million or the months of May and June consecutively. It went up in the month
of July to USD.665 million before reducing thereafter to reach a low of USD.83 million
by November. The BOP however closed the year at USD 163 million. In the year 2011,
BOP started at USD.199 million then fluctuated to USD.309 million, USD.307 million
and USD.297 million in the next three months consecutively. It increased in May to a
high of USD 360 million after which it dropped for the remainder of the year to a low of
USD 220 million and closed the year at USD -43 million. In the year 2012, BOP started
at a low of USD -137 million. It then increased continuously for the next three months to
USD 674 million in April after which it dropped to USD.139 million. The upward trend
then got out of hand as the BOP hit positive USD.1,261 million.
The findings from this study reveal that exchange rate volatility is one of the fundamental
factors affecting the BOP in Kenya. This compares positively with the findings
established by Mungami (2012) who examined the effects of exchange rate liberalization

40
on the BOP of a developing country using a case of Kenya. The study revealed that
exchange rate is one of the macroeconomic fundamentals that play a key role in ensuring
that the economy of a country remains competitive in the international market. The
results showed that the exchange rate liberalization had improved the overall BOP but it
had not improved the current account or reduced the balance of trade deficit.
From the findings of this research, the exchange rate volatility is one of the other
macroeconomic factors influencing BOP in Kenya. This finding is consistent with the
empirical study conducted Huchet-Bourdon and Korinek (2011) who studied the extent to
which exchange rates and their volatility affected trade flows in China, the Euro area and
the United States in two broadly defined sectors, agriculture on the one hand and
manufacturing and mining on the other. This study found out that exchange volatility
impacted trade flows only slightly.
41
CHAPTER FIVE: SUMMARY, CONCLUSIONS AND
RECOMMENDATIONS
5.1 Summary
The main objective of the study was to determine the relationship between exchange rate
volatility and BOP in Kenya. To carry out this study, a linear regression model was used
consisting of the BOP function as the dependent variable, while the exchange rate
volatility as an impendent variable. The study examined secondary data collected from
CBK for ten years on BOP and exchange rates volatility and established that, exchange
rate volatility has weak inverse relationship with BOP as explained by a low negative
adjusted R2 of -0.007. This shows that although foreign exchange rates have a
relationship with BOP, the relationship is weak. These findings are consistent with those
established by Mungami (2012) who examined the effects of exchange rate liberalization
on the BOP of developing countries using a case of Kenya. The results showed that the
exchange rate liberalization had improved the overall BOP but it had not improved the
current account or reduced the balance of trade deficit.
The study used a quantitative comparative design method and the data used was
secondary from CBK which was analyzed using Statistical Package for the Social
Sciences (SPSS), a computer program used for statistical analysis. From the findings of
the study, the BOP grew steadily since the year 2000 to reach high positive figures
towards the end of the study period and in effect worsening BOP. These findings are
consistent with those of Kandil and Ida (2002), who established that exchange rate

42
fluctuations and aggregate economic activities affect an economy’s level of trade with
others.
Exchange rates deal with the value of one currency in terms of another. Devaluation in
one currency lowers that currency's value in terms of the other thereby lowering imports
and consequently encouraging exports to improve BOP. From this study, it was
established that the prevailing exchange rates fluctuated significantly during the study
period thereby affecting BOP either negatively or positively. The study conducted by
Huchet-Bourdon and Korinek (2011) on the extent to which exchange rates volatility
affected trade flows in China, the Euro area and the United States of America revealed
that exchange rate volatility impacted trade flows only slightly. Exchange rate levels, on
the other hand, affected trade in both agriculture and manufacturing and mining sectors
but did not explain in their entirety the trade imbalances in the three countries examined.
5.2. Conclusions
From the analysis in chapter four and the summary above, the study concludes that just as
the basic determinants behind the supply of and demand for any commodity are critical in
fully understanding the behavior of the prices of that commodity, so it is important to
understand the relationship between the supply of and demand for foreign exchange to
determine the price of a foreign currency. The exchange rate affects the prices at which a
country trades with the rest of the world and is integral economic analysis and policy
formulation. From the findings discussed in chapter four, the study concludes that there is
a direct relationship between foreign exchange rates volatility and balance of payments.
As the Kenyan currency depreciates, the balance of payments for Kenya worsens. The
43
policies makers in Kenya need to encourage export diversification especially on
processed products since agricultural exports are not highly competitive in the foreign
economies to positively impact on BOP
The study established that apart from the exchange rates discussed above, there are other
factors having greater influence on the levels of balance of payments recorded in Kenya.
Exchange rates deal with the value of one currency in terms of another. Devaluation in
the currency lowers one currency's value in terms of the other. From the regression model
summary, the study establishes that exchange rates contribute only to 7% of the changes
in the balance of payments. This therefore means that there are other factors influencing
the levels of balance of payments in Kenya. These include other macroeconomic factors
like the rate of inflation which is fueled by other factors like fuel prices which have a
great impact on the prevailing price levels in the country.
The study also concludes that balance of payments status in Kenya grew steadily during
the study period despite the increases and decreases registered in the country during the
study period. Balance of payments grew from a low of positive USD.231 million by
January 2001 to a high of USD.1,397 million by November 2012 and a low of negative
743 million in the month of January 2009. In addition, increases in the balance of
payments indicate that the country was importing more than it was exporting.
5.3 Policy Recommendations
The balance of payments accounts provide a detailed record of any economy’s
international economic transactions, and these accounts are central to understanding the
degree of an economy’s integration with the rest of the world. The balance of payments

44
recorded in Kenya defines the level of integration with other economies in Business.
Balance of payments accounts record monetary settlements between residents of an
economy and foreigners, and are often referred to as the external accounts. However, in
addition to monetary settlements, they also record transactions where goods only may be
transferred, as is the case with some forms of foreign aid. In Kenya, balance of payments
is an important component of development because the country is a net importer. The
country requires capital equipment which consumes a considerable amount of foreign
currency compared to her exports. This in most cases leaves the country with a huge
positive balance of payments which means that the country has to acquire more foreign
currency using other means in order to fully pay for the imports. This makes foreign
exchange rates important because it determines how much the country has to spend to
acquire the imports and at the same time determine how much the country has to earn
from its exports.
From the above analysis, this study recommends that the policy makers take keen interest
in ensuring stable equilibrium for the exchange rates as they play an important role in
determining the demand for and supply of both imports and exports. It is through exports
that the country earns foreign exchange. If the local currency depreciates, it means that
imports become expensive because the country has to spend more local currency to
acquire a given commodity. However, appreciation of local currency ensures that the
country is able to get more import more cheaply. There is need to establish a balance
between the exports and imports. To achieve this, the policy makers need to evaluate the
best exchange rate policy for optimal economic development.

45
The study further recommends that the government through its relevant offices promote
the export industries like tourism which earn the country foreign exchange which can
then be used to pay off imports to balance payments. The government needs to increase
marketing of its exports and encourage local industries producing imports substitutes so
as to encourage consumption of locally produced commodities which not only improve
the country’s balance of payments but also contributes to economic development through
provision of employment. The study further recommends that the government should
provide relevant structures and environment for the smooth operation of import export
market in the country. This may be achieved through proper legislation which regulate
the level of import and export trade in the country.
The government should formulate policies that encourage local based private companies
to take advantage of emerging foreign investments that includes foreign direct private
investments. For this to happen, the government should control and stabilise inflation and
exchange rates at its lowest level through various macroeconomic policies viable for BOP
improvement that encourages local foreign private investments.
5.4. Limitations of the Study
A limitation for the purpose of this research is regarded as a factor that is present and
contributed to the researcher getting either inadequate information or if otherwise the
response given would have been totally different from what the researcher expected. The
main limitations of this study were:
The data used was secondary data generated for other purposes. The measures used may
keep on varying from one year to another subject to the prevailing condition. For
46
example the balance of payments was deeply affected by the post election violence which
slowed down trade with other nations as either the goods to trade in were lacking or the
demand for imported goods was low.
The inflation rates have been consistently high in the country forcing the Central Bank of
Kenya to raise its CBR rate which is passed on to other sectors in the economy thereby
influencing the overall economic development of the country thereby impacting
differently on the different sectors of the economy.
The data used is also affected by political stability of the nation which plays an important
role in the international trade. For example, during the 2007/2008 post election violence,
the level of exports in from Kenya was reduced following the violence which created
insecurity hence reduced levels of production. As such, political stability plays an
important role in determining exchange rates and balance of payments.
5.5 Suggestions for Further Studies
The study suggests that further research be conducted on the relationship between
balance of payments and economic development because through international trade, a
country’s development is affected in so many ways including provision of employment
and foreign currency.
The study further recommends that another study be conducted in Kenya on the
relationship between foreign exchange rates and economic development to check whether
changes in the foreign exchange affect the income per capita of the citizens. The study
also suggests that further studies be carried out on the influence of macroeconomic

47
policies on balance of payments in Kenya. The existing balance of payments in a country
is a function of many macro economic variables. By establishing the influence of each
macroeconomic variable on foreign exchange rates will enable policy makers know what
tool to use when controlling the foreign exchange rate levels.

48
REFERENCES
Arize, A. C. (1994), Co-integration test of a long-run relation between the real exchange rate and the trade balance, International Economic Journal, 8, 1-8.
Baharumshah, A. Z. (2001), The effect of exchange rate on bilateral trade balance: New evidence from Malaysia and Thailand, Asian Economic Journal, 15, 291-312.
Bahmani-Oskooee, M. (1991). Is there a long-run relation between the trade balance and real effective exchange rate of LDCs? Economic Letters, 36, 403-407.
Boyd, D., Caporale, G. & R. Smith (2001), Real exchange rate effects on the balance of trade: cointegration and the Marshall-Lerner condition, International Journal of Finance and Economics, 6, 187-200.
Buchanan, J. M., & Yong J. Y. (2002). Globalization as framed by the two logics of trade. The Independent Review, 6 (3): 399-405.
Cavallo, M. (2004), Exchange rate volatility and the U.S. international balance sheet, FRBSF Economic Letter, 2004-25.
Ngechu. M. (2004), Understanding the research process and methods. An introduction. Starbright Services, Nairobi.
Darity, W. A. Jr., and Lewis S. D. (2005). Growth, trade, and uneven development. Cambridge Journal of Economics, 29 (1): 141-170.
Gligorić, M. (2010). Exchange Rate and Trade Balance: J-curve Effect, Panoeconomicus, 2010, 1, pp. 23-41
Gourinchas, P. and Rey H. (2007), International financial adjustment, Journal of Political Economy, 115, 665-703.
Huchet-Bourdon, M. and Korinek, J. (2011), To What Extent Do Exchange Rates and their Volatility Affect Trade?, OECD Trade Policy Papers, No. 119, OECD Publishing.
Ingham, B. (2004). International economics: A European focus. London: Prentice Hall- Financial Times.
Kariuki, G M, (2008) Determinants of current account balance in Kenya: The inter-temporal approach– KIPPRA. DP No. 93

49
Kipngetich K. G. (2002) The Relationship between Fiscal Deficits and the Current Account Balance in Kenya (1964-2000). Unpublished MBA Thesis, Kenyatta University
Krugman, P. R. (2002). Development, geography, and economic theory. Cambridge (MA): MIT Press.
Krugman, P. R. & Obstfeld, M. (2009). International economics: theory and policy. Boston: Pearson Addison-Wesley.
Kurtz, H. D. (1992). Adam Smith on foreign trade: a note on the ‘vent-for-surplus’ argument. Economical, 59 (236): 475-481.
Magnusson, L. (2004). The tradition of free trade. London: Routledge.
McKinnon, R. I. (1990), the exchange rate and the trade balance: Insular versus open economies, Open Economies Review, 1, 17-37.
McKinnon, R. I. and Ohno, K. (1997) Dollar and yen: Resolving economic conflict between the United States and Japan. MIT Press, Cambridge, MA.
Mungami, S.E. (2012). The effects of exchange rate liberalization on the balance of payment of a developing country: a case of Kenya, Unpublished MBA Thesis, Kenyatta University
Ndung’u, S. N. (2000), Monetary and Exchange Rate Policy in Kenya, African Economic Research Consortium
Smith, A. (1976). An inquiry into the nature and causes of the wealth of nations [WN]. In The Glasgow edition of the works and correspondence of Adam Smith, Vol. 2, eds. R. H. Campbell, and A. S. Skinner. Oxford: Oxford University Press.
Sekantsi, L. (2009). The impact of real exchange rate volatility on South African exports to the United States (U.S.): a bounds test approach. Journal of Emerging Trends in Economics and Management Sciences (JETEMS) 2 (3): 146-155
Smith, A. (1978b). Lectures on jurisprudence. In The Glasgow edition of the works and correspondence of Adam Smith, Vol. 5, eds. Ronald L. Meek, D. D.
Tribe, K. (1999). Adam Smith: critical theorist? Journal of Economic Literature, 37 (2): 609-632.
Zhang, W. (2008). International trade theory: capital, knowledge, economic structure, money, and prices over time. Berlin: Springer.
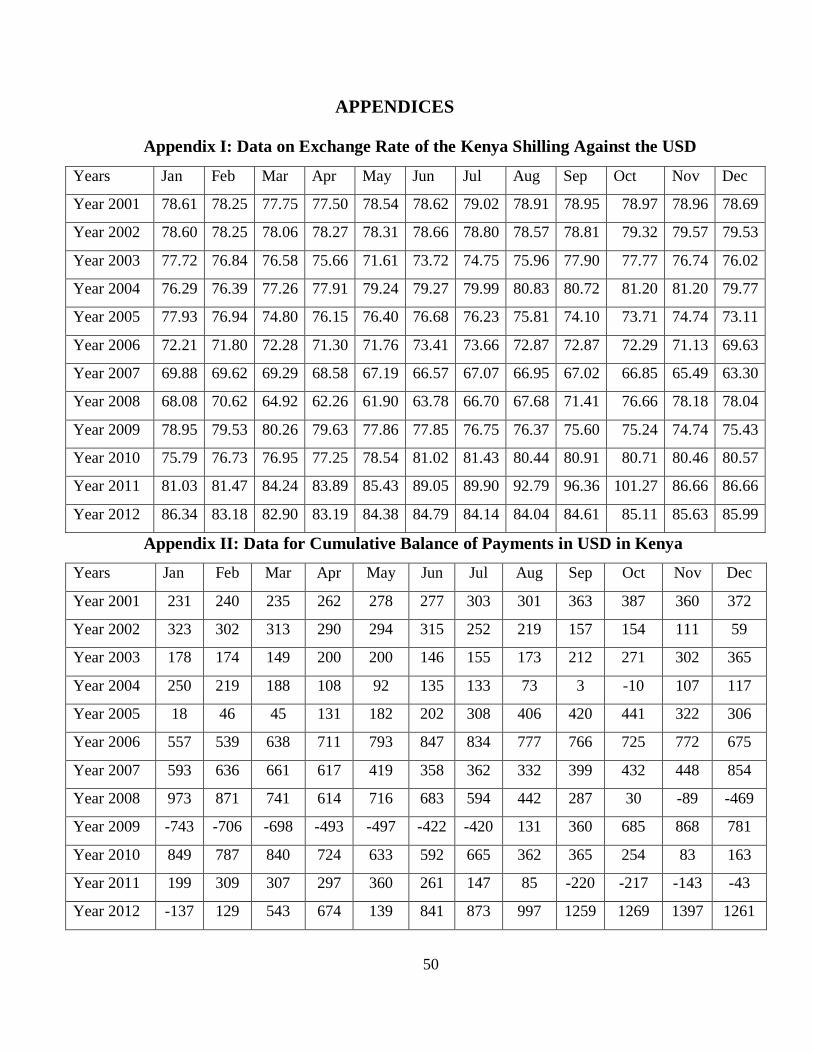
50
APPENDICES
Appendix I: Data on Exchange Rate of the Kenya Shilling Against the USD
Years Jan Feb Mar Apr May Jun Jul Aug Sep Oct Nov Dec
Year 2001 78.61 78.25 77.75 77.50 78.54 78.62 79.02 78.91 78.95 78.97 78.96 78.69
Year 2002 78.60 78.25 78.06 78.27 78.31 78.66 78.80 78.57 78.81 79.32 79.57 79.53
Year 2003 77.72 76.84 76.58 75.66 71.61 73.72 74.75 75.96 77.90 77.77 76.74 76.02
Year 2004 76.29 76.39 77.26 77.91 79.24 79.27 79.99 80.83 80.72 81.20 81.20 79.77
Year 2005 77.93 76.94 74.80 76.15 76.40 76.68 76.23 75.81 74.10 73.71 74.74 73.11
Year 2006 72.21 71.80 72.28 71.30 71.76 73.41 73.66 72.87 72.87 72.29 71.13 69.63
Year 2007 69.88 69.62 69.29 68.58 67.19 66.57 67.07 66.95 67.02 66.85 65.49 63.30
Year 2008 68.08 70.62 64.92 62.26 61.90 63.78 66.70 67.68 71.41 76.66 78.18 78.04
Year 2009 78.95 79.53 80.26 79.63 77.86 77.85 76.75 76.37 75.60 75.24 74.74 75.43
Year 2010 75.79 76.73 76.95 77.25 78.54 81.02 81.43 80.44 80.91 80.71 80.46 80.57
Year 2011 81.03 81.47 84.24 83.89 85.43 89.05 89.90 92.79 96.36 101.27 86.66 86.66
Year 2012 86.34 83.18 82.90 83.19 84.38 84.79 84.14 84.04 84.61 85.11 85.63 85.99
Appendix II: Data for Cumulative Balance of Payments in USD in Kenya
Years Jan Feb Mar Apr May Jun Jul Aug Sep Oct Nov Dec
Year 2001 231 240 235 262 278 277 303 301 363 387 360 372
Year 2002 323 302 313 290 294 315 252 219 157 154 111 59
Year 2003 178 174 149 200 200 146 155 173 212 271 302 365
Year 2004 250 219 188 108 92 135 133 73 3 -10 107 117
Year 2005 18 46 45 131 182 202 308 406 420 441 322 306
Year 2006 557 539 638 711 793 847 834 777 766 725 772 675
Year 2007 593 636 661 617 419 358 362 332 399 432 448 854
Year 2008 973 871 741 614 716 683 594 442 287 30 -89 -469
Year 2009 -743 -706 -698 -493 -497 -422 -420 131 360 685 868 781
Year 2010 849 787 840 724 633 592 665 362 365 254 83 163
Year 2011 199 309 307 297 360 261 147 85 -220 -217 -143 -43
Year 2012 -137 129 543 674 139 841 873 997 1259 1269 1397 1261