The Relationship between Audit Team Composition, Audit ...
52
The Relationship between Audit Team Composition, Audit Fees and Quality Sarowar Hossain* School of Accounting Australian School of Business University of New South Wales Australia NSW 2052, Australia Kenichi Yazawa School of Business Aoyama Gakuin University Tokyo 150-8366, Japan Gary S Monroe School of Accounting Australian School of Business University of New South Wales Australia NSW 2052, Australia Acknowledgement: We thank Elizabeth Carson, Radzi Jidin, Jian Zhou, the participants of the Japan Auditing Association Annual Meeting 2013, and the participants of the APC in Bali, Indonesia for their valuable feedback on an earlier version of the paper. * Contact co-author: Sarowar Hossain, School of Accounting, Australian School of Business, University of New South Wales Australia, NSW 2052, Australia, Phone: (+612) 93856352, E-mail: [email protected]
Transcript of The Relationship between Audit Team Composition, Audit ...
The Relationship between Audit Team Composition, Audit Fees and Quality
Sarowar Hossain* School of Accounting
Australian School of Business University of New South Wales Australia
NSW 2052, Australia
Kenichi Yazawa School of Business
Aoyama Gakuin University Tokyo 150-8366, Japan
Gary S Monroe School of Accounting
Australian School of Business University of New South Wales Australia
NSW 2052, Australia
Acknowledgement: We thank Elizabeth Carson, Radzi Jidin, Jian Zhou, the participants of the Japan Auditing
Association Annual Meeting 2013, and the participants of the APC in Bali, Indonesia for their valuable feedback on
an earlier version of the paper.
* Contact co-author: Sarowar Hossain, School of Accounting, Australian School of Business, University of New South Wales Australia, NSW 2052, Australia, Phone: (+612) 93856352, E-mail: [email protected]

1
The Relationship between Audit Team Composition, Audit Fees and Quality
SUMMARY
Using Japanese data comprising the professional qualifications of audit team members, we
investigate whether there is a positive association between both the number of accounting and
non-accounting professionals on an audit team and audit fees and a variety of commonly used
measures of audit quality (likelihood of issuing a going concern opinion and a first time going
concern opinion for a sample of financially distressed companies, and the absolute value of
discretionary and working capital accruals). We find that the number of professional accounting
staff on an audit team is positively associated with audit fees and our measures of audit quality.
However, although the number of non-accounting professionals is positively associated with
audit fees, the number of non-accounting professionals is not associated with any of our audit
quality measures. Our findings indicate that: audit fees (and therefore audit effort) are based on
the size of an audit team; the number of accounting professionals on the audit team has a positive
association with our measures of audit quality, but not the number of non-accounting
professionals. Our findings could assist regulators and audit firms assess whether an appropriate
combination of individuals make up an audit team and possible effects on audit quality.
Key words: audit team composition, accounting/non-accounting professionals, audit fees,
going concern opinion, discretionary accruals.
JEL code: M41, M42
Data availability: All data are publicly available from the sources indicated in the paper.
2
Determining the Relationship between Audit Team Composition, Audit Fees and Quality
INTRODUCTION
Using a unique data set comprising the professional qualifications of audit team members,
we examine whether the composition of an audit team is associated with audit fees and audit
quality by investigating two research questions. (1) Are the number of professional accounting
staff and professional non-accounting staff on an audit team associated with audit fees? (2) Are
the number of professional accounting staff and professional non-accounting staff on an audit
team associated with audit quality? First, we examine whether the number of professional
accounting staff and professional non-accounting staff on an audit team are associated with audit
fees.1 Prior research has generally found that auditor effort measures are highly correlated with
audit fees2 and disaggregation of the labor mix (i.e., labor rank and time expended) on an audit
engagement allows researchers to disentangle their effects on audit fees and financial reporting
quality (e.g., Bell, Doogar, and Solomon 2008; Causholli, Martinis, Hay, and Knechel 2010).
However, due to disclosure limitations concerning audit effort (e.g., audit hours or number of
members in an audit team and type of professional mix on an audit team), there is no empirical
research evidence on the association between audit team composition in terms of professional
qualifications and audit fees. Therefore, the first objective of this study is to examine the effect
of labor mix with respect to professional qualifications of audit team members on audit fees after
controlling for both client and auditor attributes.
1 Professional accounting staff include qualified Certified Public Accountants (CPA) and junior CPA (JCPA) whereas professional non-accounting staff include experts who have expertise in a field other than accounting or auditing, such as actuaries, real estate appraisers, tax experts, etc. and other junior staff who perform simple audit tasks. 2 Following the seminal work by Simunic (1980), auditing research has examined the association between audit fees and audit fee determinants using a number of client and auditor attributes. Using a production view of the audit process, Simunic (1980) hypothesized that certain drivers would be associated with audit fees because those drivers cause an auditor to perform more (or less) work during the auditing process (Hay, Knechel, and Wong 2006).
3
Prior studies support the notion that the level of input (i.e., audit effort) by personnel
auditing a client affects the level of audit quality. Regulators indicate that a wide range of inter-
related factors, including the skills and professional qualities of auditors and their staff, affect
audit quality (e.g., UK Financial Reporting Council 2008; Australian Treasury 2010; Public
Company Accounting Oversight Board 2013). Audit firms have to decide the appropriate labor
mix on an audit engagement such as the how many and what type of professional accounting and
professional non-accounting staff (e.g., auditor’s experts). The firm has to balance considerations
such as audit quality, cost of the audit and staff availability when making these decisions.
However, the type of labor utilized on an audit engagement has received little attention in the
literature because audit effort data (type of labor) is usually not publicly disclosed. In addition,
this data is considered highly proprietary and is usually restricted to a single research team
(O’Keefe, Simunic, and Stein 1994; Hay, Knechel, and Wong 2006; Causholli et al. 2010). We
overcome this data limitation by using Japanese audit data because companies in Japan are
required to disclose the composition of the audit team in the annual report.3
Audit-production studies have provided valuable insight into the audit process (Causholli
et al. 2010).4 However, the question as to whether the number of accounting and non-accounting
professionals in an audit team contribute in the same way to determining audit quality has not
been examined. Therefore, the second objective of this study is to investigate whether the
composition of the audit team (i.e., labor mix between accounting and non-accounting
professional staff on the audit team) is associated with audit quality. Although such staffing
3 As far as we know, Japan is the only jurisdiction where companies must disclose the composition of the audit team in the annual report. According to the Cabinet Office Ordinance on Disclosure of Company Information (Form No. 1), audit staff are disclosed by classifying as CPA, Junior CPA, and other (e.g., actuary, real estate appraiser, tax experts, etc.) in ‘the Status of Corporate Governance’ in the annual report. 4 Similar to the audit fee literature, the audit-production literature has examined the effect of various client, auditor and engagement characteristics on the total amount of audit labor expended by an engagement team and their effects on audit quality (Caramanis and Lennox 2008; Causholli et al. 2010; Schelleman and Knechel 2010).
4
decisions have to be made for many, if not all, audit engagements, there is no research on the
role of non-accounting professionals on an audit team, despite the fact that staffing decisions
about the composition of the audit team are likely to have an impact on audit fees and audit
quality. We argue that the inclusion of the professional qualifications of audit team members as
determinants of audit fees and audit quality will enhance our understanding of the association
between audit effort and audit quality.
We find that audit fees are positively associated with the number of both accounting and
non-accounting professionals on an audit team after controlling for both client and auditor
characteristics. Our findings provide evidence that audit fees are not only associated with client
size, complexity and risk, but also with the composition of the professional qualifications of the
audit team members assigned to the audit engagement.
Research on audit quality uses a large number of proxies to measure audit quality, however,
there is no consensus on which measures are best (DeFond and Zhang 2014). DeFond and Zhang
(2014) conclude that no single category paints a complete picture of audit quality; therefore,
researchers should use multiple proxies from different categories to take advantage of their
strengths and weakness. Consistent with prior studies, audit quality in our study is measured by
the propensity to issue going concern opinions (Carey and Simnett 2006; DeFond, Raghunandan,
and Subramanyam 2002; Fargher and Jiang 2008; Lim and Tan 2008; Robinson 2008) and first-
time going concern opinions (Li 2009) for financially distressed companies. In addition,
discretionary and working capital accruals are used as measures of audit quality (e.g., Beck,
Frecka, and Solomon 1998; Ferguson, Richardson, and Wines 2000; DeFond and Park 2001;
Ashbaugh, LaFond, and Mayhew 2003; Carey and Simnett 2006; Asthana and Boone 2012). We
find that the number of accounting professionals in an audit team has a positive association with
5
the propensity to issue both going concern and first-time going concern opinions for our sample
of financially distressed companies. In contrast, the number of non-accounting professionals on
an audit team is not significantly associated with the propensity to issue a going concern opinion
(both ongoing and first-time going concern opinions). Our findings suggest that only the
accounting professional members on an audit team are associated with the propensity to issue a
going concern opinion. This may be because it is the lead engagement partner and other senior
audit staff who play a central role in planning and implementing the audit and ultimately in
determining the appropriate type of audit report to be issued to the client (Ferguson, Francis, and
Stokes 2003; Zerni 2012). In addition, we find that the number of accounting professionals on an
audit team is negatively associated with the absolute value of both discretionary and working
capital accruals. In contrast, the number of non-accounting professionals on an audit team is not
significantly associated with either discretionary or working capital accruals. Our findings
provide evidence that the inclusion of more professionally qualified accountants on an audit team
is associated with higher audit quality.
Overall, our findings provide evidence that audit fees have a positive association with the
size of an audit team regardless of their professional qualifications. We also find that audit
quality has a significant positive association with the number of accounting professionals on the
audit team. However, the number of non-accounting professionals on the audit team is not
associated with commonly used measures of audit quality. Our results are robust after controlling
for endogeneity and performing various sensitivity tests.
The findings of our study will be useful to several different groups. For researchers, our
study is the first to provide evidence that audit fees are associated with the professional
qualifications of audit team members. Regulators such as the International Auditing and
6
Assurance Standards Board (IAASB) and the Public Company Accounting Oversight Board
(PCAOB) could use these findings to aid in the assessment of audit quality be considering
whether an appropriate labor mix has been used in an audit team. Audits with an inappropriate
labor mix may signal higher or lower audit quality. Audit firms could review our findings for
guidance in determining the combination of individuals that should make up an audit team (i.e.,
an appropriate mix of accounting and non-accounting professionals). Finally, our findings
suggest that the professional qualifications of audit team members should be considered in
addition to the traditional determinants of audit fee and audit quality. Our findings are useful to
regulators in other jurisdictions that may be considering mandatory disclosure of information
about auditors assigned to the audit engagement.
The remainder of the paper is organized as follows. Section two discusses the role of non-
accounting professionals on an audit team, which is followed by a literature review leading to the
development of the hypotheses in section three. Section four discusses the research methods used
in our study and this is followed by a discussion of the sample in the fifth section and the results
are presented in section six of the paper. The paper is concluded in section seven.
ROLE OF NON-ACCOUNTING PROFESSIONALS ON AN AUDIT TEAM
Although auditing standards provide guidance on the use of an auditor’s expert, there is no
extant literature on the role of non-accounting professionals such as experts on an audit team.
Therefore, we conducted semi-structured interviews with two audit partners of SinNihon LLC,
which is Japan’s largest accounting firm and a member of Ernst & Young Global Limited, to
identify the role of non-accounting professionals on an audit team.
7
The interviewees informed us that non-accounting professionals on the audit team
comprise experts who have expertise in a field other than accounting or auditing (e.g., actuaries,
real estate appraisers, tax experts, etc.) and other junior staff who performs simple audit tasks. In
the absence of specific guidelines on the determination of the number of other audit team
members, if expertise in a field other than accounting or auditing is necessary to obtain sufficient
appropriate audit evidence, the auditor determines the number of other experts required on the
audit team (Auditing Standards Committee Statements [ASCSs] 620, Para. 7).5 Expertise in a
field other than accounting or auditing may include expertise in relation to matters such as: (1)
the valuation of complex financial instruments, land and buildings, plant and machinery,
jewellery, works of art, antiques, intangible assets, assets acquired and liabilities assumed in
business combinations and assets that may have been impaired; (2) the actuarial calculation of
liabilities associated with insurance, contracts or employee benefit plans; (3) the estimation of oil
and gas reserves; (4) the valuation of environmental liabilities, and site clean-up costs; (5) the
interpretation of contracts, laws and regulations, (6) the analysis of complex or unusual tax
compliance issues; and (7) complex information systems using IT (Para. A1, ASCSs 620).
The interviewees indicated that audit firms assign other staff based on internal criteria
because there are no clear guidelines on how to determine the minimum number of hours
required from other experts. In general, the allocation of other staff depends on the size,
complexity, and risk of the client.
LITERATURE REVIEW AND HYPOTHESES DEVELOPMENT
Audit Team Composition and Audit Fees
5 “Using the Work of an Auditor’s Expert” issued by the Japanese Institute of Certified Public Accountant (JICPA), which is equivalent to International Standard on Auditing 620 “Using the Work of an Auditor’s Expert” issued by the IAASB).
8
Studies on audit fee determinants typically regress audit fees against a variety of measures
for both client and auditor attributes (for details, see Hay et al. 2006). Most studies use both
supply and demand attributes to predict audit fees. Hay et al. (2006) report that client attributes
(size, complexity, and inherent risks) have the most substantial impact on audit fees. Recent
studies use other important client attributes such as the quality of internal control and corporate
governance (board and audit committee attributes) as audit fees determinants (e.g., Hay, Knechel,
and Ling 2008), but the results are too inconsistent to draw clear conclusions about these
attributes (Causholli et al. 2010). Hay et al. (2006) argue that the current production-based
specifications of the audit fee models provide mixed results, potentially excluding important
explanatory variables including other demand or supply factors. We argue that the professional
qualifications of audit team members may be an important variable for explaining variation in
audit fees because the skills and professional qualifications of auditors and their staff on the audit
team determine the level audit fees based on the audit effort expended by an audit team. For
example, more senior audit staff and/or professionally qualified staff typically command a higher
charge-out rate than more junior staff and/or staff without professional qualifications.
Prior studies have included auditor attributes as audit fee determinants, such as Big N (e.g.,
Benh, Carcello, Hermanson, and Hermanson 1999; Basioudis and Francis 2007) and auditor
specialization (e.g., Craswell, Francis, and Taylor 1995; Casterella, Francis, Lewis, and Walker
2004; Cahan, Godfrey, Hamilton, Jeter 2008; Cairney and Young 2006; Carson and Fargher
2007; Carson 2009). Audit engagement attributes, such as audit opinion (e.g., Davis, Ricchiute,
and Trompeter 1993; Firth 2002; Schelleman and Knechel 2010) and non-audit service fees (e.g.,
Whisenant, Sankaraguruswamy, and Raghunandan 2003; Antle, Gordon, Narayanamoorthy, and
Zhou 2006), are also associated with audit fees. Studies also find that audit firm/partner tenure
9
and office location (e.g., O’Keefe et al. 1994; Stein, Simunic, and O’Keefe 1994; Davidson and
Gist 1996; Schelleman and Knechel 2010) are associated with audit fees.
The audit-production literature also examines the effect of various client, auditor, and
engagement characteristics on the amount of effort expended during an audit engagement.
Auditor effort is usually measured as total hours, and it is further disaggregated across labor
ranks (i.e., partners, managers, in-charge/seniors, and staff) and key audit activity hours (Bell,
Knechel, and Willingham 1994; Deis and Giroux 1996; Caramanis and Lennox 2008; Causholli
et al. 2010). This disaggregation allows researchers to examine the association between audit
fees, audit quality and labor mix employed on an audit engagement (i.e., the proportion of hours
allocated to each labor rank or activity) (Hackenbrack and Knechel 1997; Dopuch, Gupta,
Simunic, and Stein 2003; Bell et al. 2008; Schelleman and Knechel 2010; Causholli et al. 2010).
Researchers have found that auditor effort is significantly associated with audit fees (e.g.,
Blokdijk, Drieenhuizen, Simunic, and Stein 2006; Causholli et al. 2010). We use the professional
qualifications (labor mix) of audit team members and expect a positive association between both
the number of accounting and non-accounting professionals on an audit team and audit fees. We
present the following hypotheses:
H1a: There is a positive association between audit fees and the number of accounting
professionals on an audit team.
H1b: There is a positive association between audit fees and the number of non-
accounting professionals on an audit team.
Audit Team Composition and Audit Quality
10
During the production process that transforms input (audit effort) into output (assurance on the
financial report), the level of input (an auditor’s effort, i.e., type of labor and time expended)
determines the level of audit quality (reduction in the residual risk of material misstatements in
the financial report) (Caramanis and Lennox 2008; Schelleman and Knechel 2010). More effort
expended by professional accounting staff should not only result in higher audit fees but should
also result in higher audit quality because of the positive relation between auditor effort and audit
quality. Therefore, we expect a positive relation between the number of professional accounting
staff on an audit team and audit quality. From our interviews, we know that non-accounting
professionals contribute expertise in a field other than accounting or auditing, which is necessary
to obtain appropriate audit evidence. Other staff on the audit team also contribute to reducing
residual risks related with material misstatement in complex business items such as complex
financial instruments, number of subsidiaries etc. of the clients. Presumably, non-accounting
professionals contribute to audit quality because of their subject matter expertise rather than their
audit expertise. If this is the case, then we would expect to find that the different types of labor
(accounting and non-accounting professionals) both impact on audit quality. We expect that
higher audit quality will result if there are more professional staff on the audit team because of
more expended effort on the audit and that there are separate effects for accounting and non-
accounting professionals because of the different types of expertise they are contributing to the
audit. Based on this argument, we expect that the number of both accounting and non-accounting
professional staff on an audit team have a positive association with audit quality. Therefore, we
present the following hypotheses:
11
H2a: There is a positive association between audit quality and the number of accounting
professionals on an audit team.
H2b: There is a positive association between audit quality and the number of non-
accounting professionals on an audit team.
RESEARCH DESIGN
Audit Fees
Consistent with prior studies modelling audit fees as a function of client-specific factors
and auditor attributes (e.g., Francis and Stokes 1986; Craswell, Francis and Taylor 1995; DeFond
et al. 2002; Frankel, Johnson, and Nelson 2002; Whisenant et al. 2003; Chaney, Jeter, and
Shivakumar 2004), we estimate the following model to determine the associations between
professional qualifications of audit team members and audit fees:
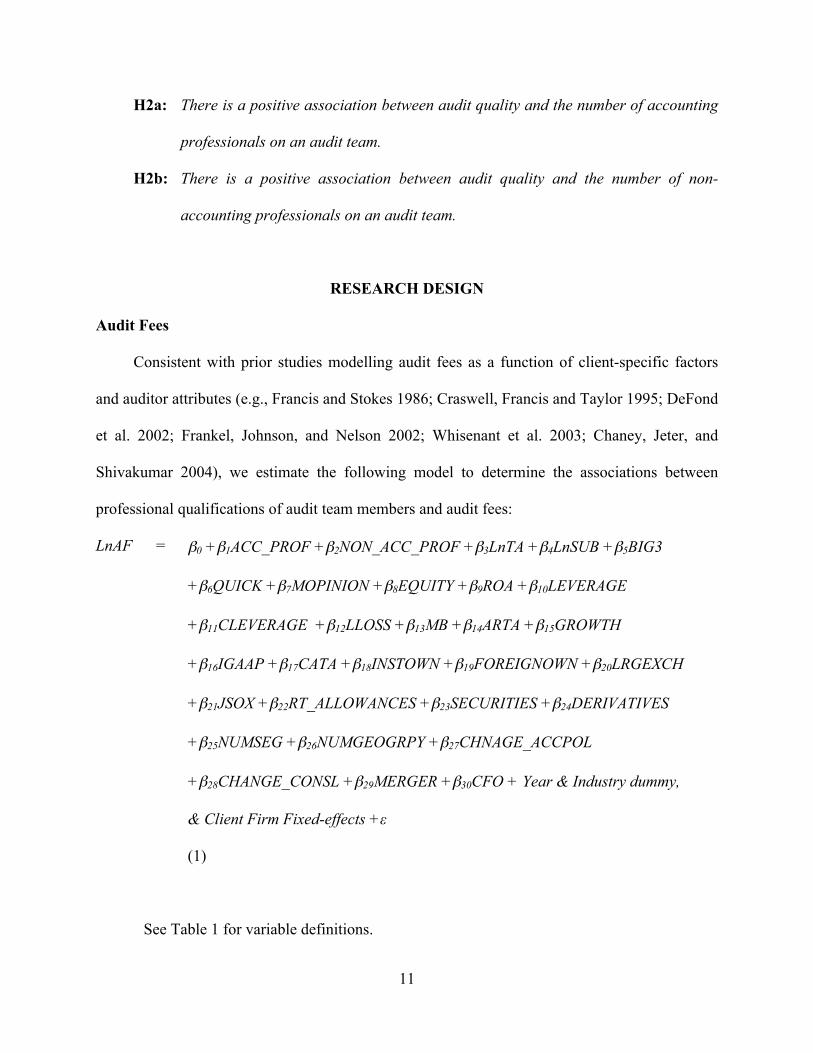
LnAF = β0 +β1ACC_PROF +β2NON_ACC_PROF +β3LnTA +β4LnSUB +β5BIG3
+β6QUICK +β7MOPINION +β8EQUITY +β9ROA +β10LEVERAGE
+β11CLEVERAGE +β12LLOSS +β13MB +β14ARTA +β15GROWTH
+β16IGAAP +β17CATA +β18INSTOWN +β19FOREIGNOWN +β20LRGEXCH
+β21JSOX +β22RT_ALLOWANCES +β23SECURITIES +β24DERIVATIVES
+β25NUMSEG +β26NUMGEOGRPY +β27CHNAGE_ACCPOL
+β28CHANGE_CONSL +β29MERGER +β30CFO + Year & Industry dummy,
& Client Firm Fixed-effects +ε
(1)
See Table 1 for variable definitions.
12
The model is based on a traditional audit fee model with the inclusion of our test variables
and some other minor modifications to control for factors specific to the Japanese audit market.
Fukukawa (2011) reports that the many of the traditional audit fee determinants such as client
size, complexity and risk have a significant association with audit fees for Japanese companies.
Our first dependent variable is the natural logarithm of audit fees (LnAF). We include two
test variables to test our hypotheses, the natural log of the number of professionally qualified
accountants (ACC_PROF), and the natural log of the number of non-accounting professionals in
an audit team (NON_ACC_PROF). The numbers of accounting and non-accounting
professionals are highly skewed; therefore, we use the natural log of these numbers to normalize
the data. As indicated in H1a and H1b, we expect our test variables to have a positive association
with LnAF.
<INSERT TABLE 1 HERE>
Client size is the most dominant audit fee determinant (Hay et al. 2006), and LnTA is
included as a proxy for client size and a positive association with audit fees is expected. Audit
fees are likely to be higher for clients with more complex business operations. LnSUBS and
ARTA are included as proxies for client complexity, and the variables representing client
complexity are expected to be positively associated with audit fees. We include QUICK, LLOSS,
CATA, LEVERAGE, CLEVERAGE, ROA, and CFO to proxy for client risk characteristics. Since
auditors charge higher fees for riskier clients (Simunic and Stein 1996), the coefficients on
QUICK, CATA, LLOSS, LEVERAGE, and CFO are predicted to be positive and those on ROA to
be negative. We do not predict any direction of association between LnAF and CLEVERAGE
13
because the association depends on the increase or decrease of leverage of the client. Prior
research documents a fee premium for Big N audit firms (Hay et al. 2006). In recent studies,
BigN is typically an indicator variable used to represent the Big 4 accounting firms. However,
after 2006 only three of the Big 4 firms operate in Japan.6 Our data commences in 2007;
therefore, to capture the effect of audit fee differences between big N and non-big N, BIG3 is
included, and a positive association with audit fees is expected. To capture the effect of a client’s
growth potential regarding audit fees, EQUITY, GROWTH, and MB are included. The demand
for auditing is greater for high-growth firms than low-growth firms (Choi and Wong 2006).
Therefore, we expect positive associations between EQUITY, GROWTH, and MB and audit fees.
When an auditor issues other than a clean audit opinion, more audit effort is expended (Davis et
al. 1993), therefore, MOPINION is included, and a positive association with audit fees is
expected. Companies adopting International Generally Accepted Accounting Principles (IGAAP)
require more effort from auditors, and as a consequence, audit fees would be higher. A positive
association between IGAAP and audit fees is expected.
The percentages of institutional (INSTOWN) and foreign (FOREIGNOWN) ownership are
included in the model because such owners may demand higher quality audits, and audit fees
would be higher. In 2006 (effective from April 2008), Japan introduced securities legislation that
6 Until 2006, the Japanese audit market was similar to audit markets in the US and many other countries in that the Big 4 firms dominated the Japanese audit market. Each of the Japanese Big 4 firms had an alliance with an international Big 4 firm (i.e., Azsa with KPMG, ChuoAoyama with PricewaterhouseCoopers (PwC), ShinNihon with Ernst &Young (EY) and Tohmatsu with Deloitte Touche Tohmatsu (DTT)). A major accounting scandal in Japan surfaced in April 2005 and one of the Japanese Big 4 firms, ChuoAoyama (PwC) was associated with the scandal. In May 2006, the Japanese regulatory agency issued a suspension order on ChuoAoyama (PwC) that prohibited it from providing audit services in Japan for two months and, as a result, its clients had to either appoint another audit firm as a temporary auditor or switch to another audit firm. ChuoAoyama never recovered from the suspension order. After the penalty period it changed its name to Misuzu but never recovered its market share. In February 2007, the firm was dissolved and some of the former partners of ChuoAoyama together with PwC formed a new audit firm (Arata) in June 2006. However, the new audit firm Arata is only one-third the size of the smallest Japanese Big 3 firms in terms of total fees earned for 2007 and the number of CPAs (Fukukawa 2011). Therefore, consistent with Fukukawa (2011) we include the Big 3 accounting firms in our indicator variable rather than the Big 4 firms traditionally included in such a measure.
14
is similar to the Sarbanes-Oxley Act (SOX).7 Companies needing to comply with the Japanese
equivalent of the US Sarbanes-Oxley Act (JSOX) may require more audit effort, and audit fees
would be higher; therefore, we include JSOX in the model. Japan has five stock exchanges for
larger companies (Tokyo, Osaka, Nagoya, Fukuoka, Sapporo), six stock exchanges for emerging
companies (Mothers, Tokyo Pro, Jasdaq, Centrex, Q-Board, Ambitious). We include LRGEXCH
for companies listed on the large exchanges in the audit fee model because companies listed on
the large stock exchanges may be subject to more monitoring and therefore, audit fees would be
higher. From our interviews, we know that clients have certain characteristics that require more
non-accounting professionals on an audit team. We include retirement benefits
(RT_ALLOWANCES), securities (SECURITIES), derivatives (DERIVATIVES), number of
segments (NUMSEG), number of geographic segments of the clients (NUMGEOGRPH), change
in accounting policy (CHANGE_ACCPOL), change in consolidation methods
(CHANGE_CONSL), and merger and acquisition activities (MERGER) in the model and we
expect positive associations between these variables and LnAF. We include robust standard
errors corrected for heteroscedasticity and client firm-level clustering (Petersen 2009) and year
and industry fixed effects in the model.
Going Concern Opinion
Consistent with prior research (e.g., Reynolds and Francis 2001; DeFond et al. 2002;
Geiger and Rama 2003; Carey and Simnett 2006; Li 2009; Chen, Sun, and Wu 2010; Blay and
Geiger 2012; Chi, Douthett, and Lei 2012), we estimate the following logit model to investigate
7 The Financial Instruments and Exchange Act, promulgated in June 2006 and effective from April 2008, is the main statute codifying securities law in Japan. The legislation is similar to the Sarbanes-Oxley Act (SOX) in the US. Although there are some differences in the legislation, the requirements are similar in substance to the Sarbanes-Oxley Act Sections 302 and 404 regarding management certification and management evaluation report on internal controls.
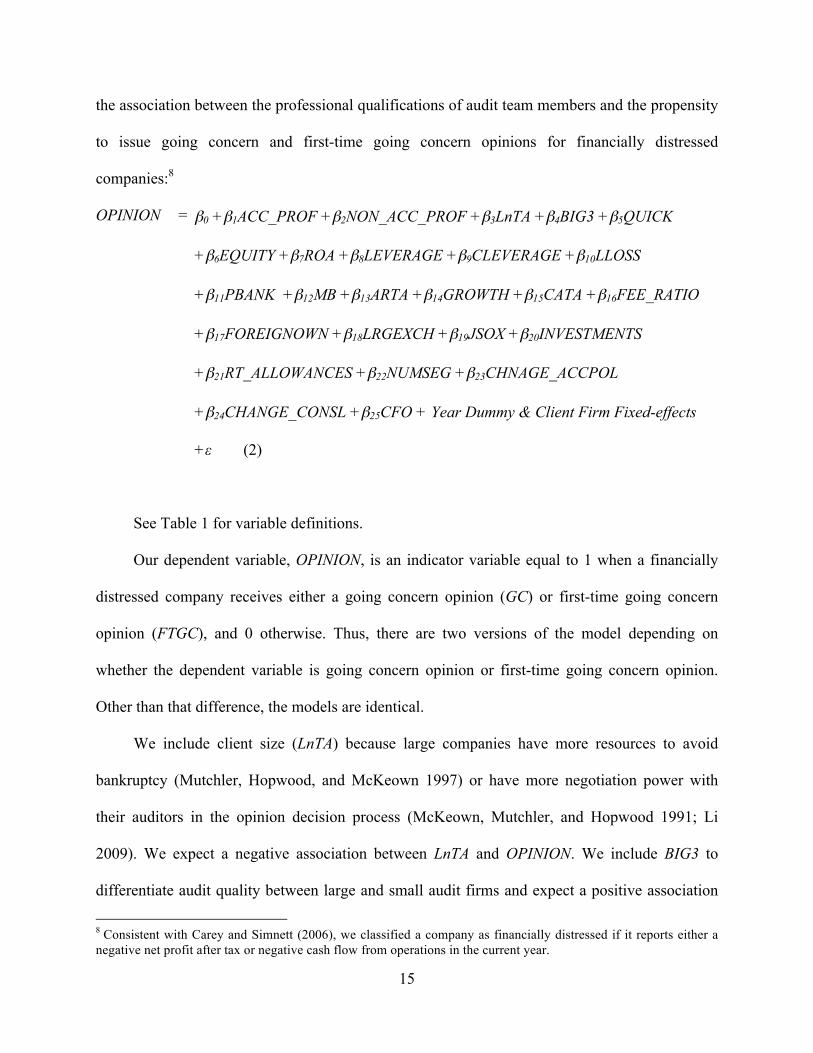
15
the association between the professional qualifications of audit team members and the propensity
to issue going concern and first-time going concern opinions for financially distressed
companies:8
OPINION = β0 +β1ACC_PROF +β2NON_ACC_PROF +β3LnTA +β4BIG3 +β5QUICK
+β6EQUITY +β7ROA +β8LEVERAGE +β9CLEVERAGE +β10LLOSS
+β11PBANK +β12MB +β13ARTA +β14GROWTH +β15CATA +β16FEE_RATIO
+β17FOREIGNOWN +β18LRGEXCH +β19JSOX +β20INVESTMENTS
+β21RT_ALLOWANCES +β22NUMSEG +β23CHNAGE_ACCPOL
+β24CHANGE_CONSL +β25CFO + Year Dummy & Client Firm Fixed-effects
+ε (2)
See Table 1 for variable definitions.
Our dependent variable, OPINION, is an indicator variable equal to 1 when a financially
distressed company receives either a going concern opinion (GC) or first-time going concern
opinion (FTGC), and 0 otherwise. Thus, there are two versions of the model depending on
whether the dependent variable is going concern opinion or first-time going concern opinion.
Other than that difference, the models are identical.
We include client size (LnTA) because large companies have more resources to avoid
bankruptcy (Mutchler, Hopwood, and McKeown 1997) or have more negotiation power with
their auditors in the opinion decision process (McKeown, Mutchler, and Hopwood 1991; Li
2009). We expect a negative association between LnTA and OPINION. We include BIG3 to
differentiate audit quality between large and small audit firms and expect a positive association
8 Consistent with Carey and Simnett (2006), we classified a company as financially distressed if it reports either a negative net profit after tax or negative cash flow from operations in the current year.
16
with OPINION because large audit firms have more quasi rents at stake if there is a questionable
audit (DeAngelo 1981; Li 2009). We include a number of financial distress indicators such as
CATA, QUICK, ROA, LLOSS, LEVERAGE, CLEVERAGE, CFO, and PBANK. Consistent with
prior studies (e.g., Mutchler et al. 1997; Reynolds and Francis 2001; Carey and Simnett 2006; Li
2009), we expect positive associations between CATA, QUICK, LLOSS, LEVERAGE, CFO,
PBANK, and OPINION and a negative association between ROA and OPINION. Similar to
Carey and Simnett (2006) and Li (2009), we do not have directional predictions for
CLEVERAGE and OPINION.
Prior research (e.g., Frankel, Johnson, and Nelson 2002; Carey and Simnett 2006) suggests
that the ratio of auditor provided non-audit services fees to total fees (FEE_RATIO) is associated
with reduced audit quality and we expect a negative association with OPINION. A company’s
growth prospects, complexity, and raising funds from issuing shares are associated with the
propensity to issue a going concern audit opinion. Negative associations are expected between
MB, GROWTH, EQUITY and OPINION, and a positive association between ARTA and
OPINION. We also include LRGEXCH and JSOX because the regulatory requirements and a
company’s listed exchange may affect the auditor’s decision to issue a going concern opinion
because additional monitoring activity will occur in those circumstances. INVESTMENTS, which
is the ratio of short- and long-term investment securities (including cash and cash equivalents) to
total assets captures the ability of a company to raise cash quickly because a company with more
investments will find it easier to avoid bankruptcy in the event of financial difficulties (DeFond
et al. 2002; Carey and Simnett 2006). We expect a negative association between INVESTMENTS
and OPINION. We also include RT_ALLOWANCES, NUMSEG, CHANGE_ACCPOL, and
CHANGE_CONSL as measures of a client’s complexity and we expect these variables to have a
17
positive association with OPINION. We include robust standard errors corrected for
heteroscedasticity and client firm-level clustering (Petersen 2009) and year fixed effects in the
model.
Discretionary Accruals
Following prior research (e.g., Myers, Myers, and Omer 2003; Johnson, Khurana, and
Reynolds 2002; Frankel et al. 2002; Carey and Simnett 2006; Asthana and Boone 2012), we use
two types of discretionary accruals as measures of audit quality, i.e., discretionary and working
capital accruals. In this study, we use three different models to estimate discretionary accruals:
(1) discretionary accruals using the modified Jones model adopted by Kothari, Leone, and
Wasley (2005); (2) discretionary accruals using the model of Ball and Shivakumar (2006), which
controls for the systematic timeliness of accruals in recognizing economic gain and loss; and (3)
discretionary accruals using the modified Jones model adopted by Dechow, Sloan, and Sweeney
(1995). We use multiple models to estimate discretionary accruals because the method of
estimating discretionary accruals may affect the results. For example, Dechow et al. (1995) find
that the modified Jones model outperforms the Jones model in detecting earnings management.
Thus, we estimate discretionary accruals using the following three models:9
TACCit /TAit-1 = α0 +β1(1/TAit-1) +β2[(ΔREVit −ΔRECit)/TAit-1] +β3(PPEit/TAit-1) +β4LagROAit
+ε (3)
TACC/TAit-1 = α0 +β1[1/TAit-1] +β2[ΔREVit −ΔRECit/TAit-1] +β3[PPEit/TAit-1] +β4[CFOit/TAit-1]
+β5[DCFOit/TAit-1] +β6[(CFOit/TAit-1)*DCFOit] +εit (4)
TACC/TAit-1 = α0 +β1[1/TAit-1] +β2[ΔREVit−ΔRECit/TAit-1] +β3[PPEit/TAit-1] +εit (5) 9 We winsorize each of the variable used to estimate discretionary and working capital accruals in order to minimize the effect of extreme values by setting the values in the bottom and top one percent of observations to the values of the 1st and 99th percentiles.
18
See Table 1 for variable definitions.
Abnormal working capital accruals are estimated using a variation of the modified Jones
model advocated by McNichols (2002) as follows:
ΔWCit = α +β1CFOit-1 +β2CFOit +β3CFOit+1 +β4ΔREVit +β5PPEit +ε (6)
See Table 1 for variable definitions.
We estimate the following model in determining the associations between the professional
qualifications of audit team members and discretionary and working capital accruals based on
prior studies (e.g., Myers et al. 2003; Johnson et al. 2002; Frankel et al. 2002; Carey and Simnett
2006; Asthana and Boone 2012):
DACC = β0 +β1ACC_PROF +β2NON_ACC_PROF +β3LnMVE +β4BIG3 +β5PQUAL
+β6EQUITY +β7ROA +β8LEVERAGE +β9CLEVERAGE +β10LLOSS +β11MB
+β12ARTA +β13GROWTH +β14IGAAP +β15CATA +β16FEE_RATIO
+β17FOREIGNOWN +β18LARGEXCH +β19JSOX +β20RT_ALLOWANCES
+β21SECURITIES +β22NUMSEG +β23NUMGEOGRPY +β24CHNAGE_ACCPOL
+β25CHANGE_CONSL +β26MERGER +β27CFO + Year Dummy & Client Firm
Fixed-effects +ε (7)
See Table 1 for variable definitions.
The dependent variable, DACC, is based on the alternative measures of the absolute value
of discretionary accruals (three discretionary accruals and working capital accruals).
19
The control variables are based on prior research (e.g., Myers et al. 2003; Johnson et al.
2002; Frankel et al. 2002; Carey and Simnett 2006; Asthana and Boone 2012) and our interview
findings. Similar to Carey and Simnett (2006), a number of control variables (LnMVE, BIG3,
PQUAL, EQUITY, ROA, LEVERAGE, CLEVERAGE, LLOSS, MB, ARTA, GROWTH, CATA,
FEE_RATIO, and CFO) included in the going concern opinion model are also expected to be
associated with discretionary accruals. We expect positive associations between PQUAL,
EQUITY, ROA, LEVERAGE, LLOSS, MB, CATA, FEE_RATIO and discretionary accruals. We
expect negative associations between LnMVE, BIG3, ARTA, GROWTH, CFO and discretionary
accruals. We do not predict any direction for the association between CLEVERAGE and
discretionary accruals because the sign of CLEVERAGE indicates the riskiness of the client.
Companies that have foreign ownership (FOREIGNOWN) and that must comply with Japanese
SOX (JSOX) and IGAAP are less likely to manage earnings because the regulatory requirements
and listed exchanges conditions may influence management’s decision to manage earnings. We
also include LRGEXCH because companies listed on a large stock exchange may have more
monitoring and therefore be less likely to manage earnings. We include a number of control
variables in our model such as RT_ALLOWANCES, SECURITIES, NUMSEG, NUMGEOGRPY,
CHANGE_ACCPOL, CHANGE_CONSL, and MERGER based on our interviews with the audit
partners. These are measures of client complexity and we expect them to have a positive
association with discretionary accruals. We include robust standard errors corrected for
heteroscedasticity and client firm-level clustering (Petersen 2009) and year fixed effects in the
model consistent with prior research (e.g., Minutti-Meza 2013).
SAMPLE
20
The data source used for the financial variables in this study is the NIKKEI NEEDS-
Financial Quest by Nikkei Media Marketing. Data on the audit fees, the audit engagement
partner, and the number of audit team members were obtained from the Report on Auditor and
Audit Fees of Publicly Listed Companies (Study Group on Auditor and Audit Fee Issues, 2008,
2009, 2010, 2011, 2012). Companies disclosed three categories of audit team personnel (CPA,
JCPA and Other), from which we classified ‘CPA and JCPA’ as accounting professionals and
‘other’ as non-accounting professionals.
We started with an initial sample of 11,300 firm-year observations, which represents all
companies listed on the Japanese stock exchanges during 2007-2011.10 Consistent with prior
research (e.g., Carey and Simnett 2006; e.g., Asthana and Boone, 2012; Eshleman and Guo,
2014), we exclude financial companies (417 firm-year observations). We exclude 247 firm-year
observations that did not disclose audit staff numbers11, companies with joint auditors (377 firm-
year observations), companies with missing financial statement data required to estimate the
various models (209 firm-year observations), and companies that did not disclose classification
of audit team members (6,0567 firm-year observations).12 This resulted in 3,994 firm-year
observations for our audit fee and discretionary accruals models. In addition, we excluded 2,834
firm year observations for our going concern opinion model because the companies were not
financially distressed. Consistent with Carey and Simnett (2006), a company was considered to
10 The data period begins in 2007 due to of the availability of a large number of online audit reports in the database. 11 This is because the Cabinet Office Ordinance on the Disclosure of Corporate Information by Cabinet Office of the Government of Japan (hereafter, Cabinet Office Ordinance) says that a ‘company must describe easy-to-understand information relating to audit staff’ (COGJ 2012, p. 36-37). Therefore, disclosing audit staff numbers is not required. 12 We exclude 6,056 firm-year observations due to ambiguous classification of accounting and other professionals. We exclude them because the junior CPA (JCPA) qualification was discontinued in 2006 due to the Certified Public Accountants Act requirements. According to the new Act, people who have passed the second grade test in the new system were going to be called 'test passer' instead of ‘junior CPA’. Since there was no response from the regulators for this change, the disclosure of audit staff has become more complex. Specifically, some companies included ‘junior CPA’ as ‘exam passer’, or as ‘other staff’ and some companies included everyone (all non-CPA staff including junior CPA) as ‘other staff’. So, for companies that we cannot clearly identify the three categories of staff (CPA, JCPA and Other), we excluded those ambiguous observations from our sample.
21
be financially distressed if the company reported either a net loss or negative cash flow from
operations in the current year. This resulted in a sample of 1,140 financially distressed firm-year
observations for our going concern model. The sample of financially distressed firm-year
observations was reduced to 1,080 for the first-time going concern model after eliminating
observations where a company received a going concern opinion in the prior year. The
descriptions of our final sample are provided in Table 2. Table 3 provides the industry
classifications of the sample.
<INSERT TABLES 2 AND 3 HERE>
Three industries (Services, Electric Appliances, and Distribution/Trading) have more than
10 percent of the sample companies from each industry. We report the results of industry effects
in the sensitivity analysis.
RESULTS
Descriptive Statistics
Table 4 provides descriptive statistics for our sample companies (n = 3,994). The average
size and average audit fees of the sample companies are ¥354,988.000 million (approximately
2,963 million USD) and ¥65.688 million (approximately 0.548 million USD), respectively
(Table 4, Panel A). The average size of an audit team is 15 persons (14.631) and the maximum
number of members on an audit team is 281. The average number of accounting professionals on
an audit team is 11 (10.886) and the maximum is 207. The average number of non-accounting
professionals is 4 (3.749), with a maximum of 93. These descriptive statistics provide evidence
22
that the audit teams for our sample companies are comprised of a mix of accounting and non-
accounting professionals. Table 4, Panel B reports that Big 3 firms audit about 70.6 percent of
the companies in our sample.
<INSERT TABLE 4 HERE>
For our sample of financially distressed companies, 9.4 percent of the firm-year
observations in our sample received a going concern opinion and 4.1 percent received a first-
time going concern opinion (Table 4, Panel C). The mean values of the absolute value of
discretionary accruals for the different discretionary accruals models are very consistent. They
are 0.060, 0.055 and 0.059 for the Kothari et al., Ball and Shivakumar, and Dechow et al. models
respectively. The mean of the absolute value of working capital accruals is 0.050, which is lower
than the other models. Table 4 also reports descriptive statistics for the GC and FTGC samples.
For most of the control variables, variance inflation factor (VIF) values (not tabulated) are less
than 2 (maximum is 5.85), indicating that multicollinearity is not a significant concern in our
study.
Audit Team Composition and Audit Fees
Table 5 reports the ordinary least squares (OLS) regression results for our audit fee model
after controlling for robust standard errors corrected for heteroscedasticity and client firm-level
clustering (Petersen 2009) and year and industry fixed-effects. The models are well specified,
with an adjusted R2 of 0.837. We use the natural log of the number of accounting (ACC_PROF)
and non-accounting (NON_ACC_PROF) professionals as our variables of interest. Audit fees are
23
significantly and positively associated with both ACC_PROF (p < 0.01) and NON_ACC_PROF
(p < 0.01), supporting both H1a and H1b. The findings provide evidence that audit fees are a
function of the professional qualifications of the audit team members in addition to client size,
complexity and risk.
<INSERT TABLE 5 HERE>
With respect to our control variables, client size (LnTA) is positively associated with LnAF.
The positive association between LnSUB and LnAF supports the notion that audit fees are based
on client complexity. Big 3 auditors charge higher fees, as supported by the positive association
between BIG3 and LnAF. The positive association between MOPINION and LnAF indicates that
auditors charge higher fees when a modified opinion is issued. Firms issuing new equity
(EQUITY) require more audit services, which is supported by the positive association between
EQUITY and LnAF. The positive associations between QUICK, LEVERAGE, LLOSS and LnAF
indicates that auditors charge higher fees for riskier clients. CLEVERAGE is negatively
associated with audit fees. Auditors charge higher fees when clients comply with foreign GAAP
(IGAAP), and auditors charge lower fees for more profitable clients, as indicated by the negative
association between ROA and LnAF. Market-to-book ratio (MB) has a positive association with
LnAF. Contrary of our expectation, we find that GROWTH is negatively associated with LnAF.
During the JSOX regulatory regime, companies are charged higher audit fees as indicated by a
positive association between JSOX and LnAF. Companies listed on the large stock exchanges
pay more audit fees as indicated by the positive association between LRGEXCH and LnAF.
RT_ALLOWANCES, and MERGER are positively associated with audit fees, and SECURITIES is
24
negatively associated with LnAF. None of our other control variables are significantly associated
with LnAF.
Audit Team Composition and Going Concern Opinions
Table 6 reports the results of our going concern opinion (GC) and first-time going concern
opinion (FTGC) logistic regressions for our sample of financially distressed companies. The
models are well specified, with Pseudo R2s of 0.478 (GC model) and 0.531 (FTGC model).
ACC_PROF is significantly and positively associated with both GC (p < 0.05) and FTGC (p <
0.05), which supports H2a regarding the expected positive relation between audit quality and the
number of accounting professionals on the audit team. However, NON_ACC_PROF is not
significantly associated with either GC (p = 0.777) or FTGC (p = 0.874), thus H2b regarding the
expected positive relation between audit quality and the number of non-accounting professionals
on the audit team is not supported.
As part of our robustness tests, consistent with Reynolds and Francis (2001), DeFond et al.
(2002), and Li (2009), we redefined financially distressed companies as those companies that
report both a negative net profit and negative operating cash flows from operations during the
current financial year. The untabulated results are qualitatively similar to those results presented
in Table 6
Our results provide evidence that the number of accounting professionals is associated with
the propensity to issue a going concern opinion as well as a first-time going concern opinion for
financially distressed companies. However, the number of non-accounting professionals in an
audit team does not appear to be associated with the propensity to issue a going concern audit
opinion.
25
<INSERT TABLE 6 HERE>
With respect to our control variables, LnTA, and CFO are negatively associated with both
GC and FTGC. The results indicate that large companies, and companies with higher cash flow
from operations are less likely to receive a going concern or first-time going concern opinion.
LLOSS, is positively associated with both GC and FTGC indicating that companies reporting a
loss in the prior year are more likely to receive a going concern and first-time going concern
opinion. PBANK is positively associated with GC indicating that an auditor is more likely to
issue a going concern opinion if the client is a financially distressed company. ROA and
INVESTMENTS are negatively associated with GC indicating that profitable companies and
companies with more investments as a percentage of assets are less likely to receive going
concern opinions. LEVERAGE and CLEVERAGE are positively associated with FTGC indicating
that financially risky clients are more likely to receive a first-time going concern opinion.
GROWTH is negatively associated with FTGC indicating that companies having higher growth
are less likely to receive a first-time going concern opinions. FEE_RATIO is positively
associated with FTGC indicating that companies purchasing more non-audit services are more
likely to receive a first-time going concern opinion. None of our other control variables are
significantly associated with either GC or FTGC.
Audit Team Composition and Discretionary Accruals
Table 7 reports the regression results for our discretionary and working capital accrual
models. We find a negative association between ACC_PROF and our three discretionary
26
accruals measures (p < 0.01) and working capital (p < 0.01) accruals. This provides support for
H2a regarding the expected positive relation between audit quality and the number of accounting
professionals on the audit team. However, NON_ACC_PROF is not significantly associated with
either discretionary or working capital accruals, thus providing no support for H2b regarding the
expected positive relation between audit quality and the number of non-accounting professionals
on the audit team. Thus, it appears that the number of non-accounting professional members does
not affect audit quality, rather it is the number of accounting professional on an audit team that
affects audit quality.
<INSERT TABLE 7 HERE>
Our control variables, 13 LnMVE, ARTA, GROWTH, JSOX, RT_ALLOWANCES,
SECURITIES, and CFO are significantly and negatively associated with discretionary accruals.
The results indicate that large companies, companies with a higher ratio of accounts receivable to
total assets, and more growth have lower values for the absolute value of discretionary accruals.
Companies complying with JSOX also have lower discretionary accruals, which may be due to
the implementation of regulatory requirements. Companies with higher retirement allowances
and more investments in financial instruments have lower discretionary accruals. PQUAL,
EQUITY, MB, and LRGEXCH are positively associated with discretionary accruals. Companies
with modified opinion in the previous year, that issued new equity in the current year, with a
higher market-to-book ratio, and companies listed on a large stock exchange have higher
discretionary accruals. In the working capital accrual model, ROA, ARTA, and
13 We discuss the results of our control variables for the Kothari et al. (2005) and working capital accruals models because the results for the control variables in our other discretionary accruals measures are similar (but not identical).
27
RT_ALLOWANCES are negatively and PQUAL, LLOSS, GROWTH, CATA, SECURITIES and
NUMSEG are positively associated with the absolute value of working capital discretionary
accruals. None of our other control variables are significantly associated with either discretionary
or working capital accruals.
Robustness checks
We conducted a number of sensitivity analyses to check the robustness of our results with
regard to whether the number of non-accounting professionals is associated with our audit
quality proxies. From our interviews, we identified a number of criteria (discussed in section two
and we don’t replicate the discussion here for brevity) that are used by audit firms in assigning
non-accounting professionals to an audit team and our robustness tests are based on these factors.
Big 3 vs non-Big 3
Skinner and Srinivasan (2012) argue that auditor quality and reputation are important in
delivering high quality audits. Our interviewees also indicated that in general, large audit firms
can assign more other staff to per client compared to small and medium-sized audit firm because
they have larger audit resources. The results (untabulated) of the association between
ACC_PROF, NON_ACC_PROF and LnAF are significant and positive for both the Big 3 and
non-Big 3 sub-samples, which is consistent with the main results reported in Table 5. The
association between ACC_PROF and GC and FTGC is significant and positive for the Big3
sample; however, ACC_PROF is not significantly associated with GC for the non-Big 3 sample.
Interestingly, NON_ACC_PROF is marginally negatively (p = 0.065) associated with FTGC for
the non-Big 3 sample. ACC_PROF is significantly and negatively associated with discretionary
28
and working capital accrual for both the Big 3 and non-Big 3 samples, which is consistent with
the results reported in Table 7. NON_ACC_PROF is not significantly associated with our
accruals measures for both the Big 3 and non-Big 3 samples. The untabulated results for the
Big-3 and non-Big 3 samples suggest that our lack of support for H2b is not driven by audit firm
size.
Complex financial instruments
In our main analysis (Tables 6 and 7), we did not find significant association between the
number of non-accounting professionals in an audit team and our audit quality measures.
However, if an auditee holds complex financial instruments (e.g., securities, and derivatives), a
financial expert is likely needed and added to an audit team to help the auditor to better
understand them. To examine whether audit quality of those auditees who have complex
financial instruments is associated with the number of non-accounting professionals in an audit
team, we separate our sample into the number of companies with and without financial
instruments. We re-ran our models and find that the results (untabulated) of the associations
between ACC_PROF and audit quality measures remain significant in the same directions that
presented in Tables 6 and 7. However, NON_ACC_PROF is not significantly associated with
audit quality. Our results on audit quality are not influenced by the client complexity.
Employee benefits
A large auditee with unfunded pension liabilities, such as retirement allowances, may
require actuaries on its audit team to help the auditor ascertain whether such liabilities are fairly
presented in the financial statements. Thus, non-accounting professional team members may
29
have an effect on audit quality for companies with such liabilities. We separated our sample into
companies with and without employee benefits and re-ran our models. The results (untabulated)
indicate that the association between ACC_PROF and our audit quality measures remain
significant and in the same direction as the results presented in Tables 6 and 7, thus providing
additional support for H1a. NON_ACC_PROF is not significantly associated with our audit
quality measures in either sample, thus providing no support for H1b.
Client complexity
When an audit environment is complicated, such as for clients with larger Property, Plant
and Equipment (PP&E), clients with more subsidiaries, clients with more business segments, and
clients with more geographic locations, the audit team may require a systems expert to
understand them. It is likely that complex audit engagements require expertise beyond what can
be provided by accounting professionals and audit quality of those clients may be associated with
the number of non-accounting professionals in an audit team. We classify a complex audit
engagement based on PP&E, number of subsidiaries, number of business segments, and number
of geographic segments and classify a complex client above the median value of each of the
cases separately. The results (untabulated) show that the associations between ACC_PROF and
audit quality measures remain significant and in the same directions as the results presented in
Tables 6 and 7, thus providing additional support for H1a. However, NON_ACC_PROF is not
significantly associated with any of our audit quality measures, thus providing no support for
H1b.
Risky clients
30
An auditor may assign more non-accounting professionals to an audit team for a risky
client to reduce the risk of material misstatements. We separate our sample based on the median
value of leverage to identify the riskiness of the clients. We use above the median value of
leverage as risky clients and below the median value as less risky clients. The results
(untabulated) show that the associations between ACC_PROF and audit quality remains
significant in the same directions that presented in Tables 6 and 7 for the risky clients. We also
classify risky clients based on financial distressed (incurred loss in the current or previous year)
and re-ran our models. The results are qualitatively similar that presented in Tables 6 and 7.
NON_ACC_PROF is not significantly associated with any of our audit quality measures.
Industry effects
There are number of industries such as Machinery, Distribution/Trading, and Services,
which separately comprise more than ten percent of our sample. We excluded each of the
industry separately and re-ran our models. The results (untabulated) are qualitatively consistent
that presented in Tables 6 and 7. The results provide certainty that our main results are not
influenced by industry.
Controlling for endogeneity
Audit firms should determine the number of accounting and non-accounting professionals
simultaneously, which raises the question that endogeneity that may be an issue in our main
analyses. Prior studies (e.g., Judge, Griffiths, Hill, Lutkepohl, and Lee 1985; DeFond et al. 2002)
argue that joint estimation of a simultaneous system of equations with one or more dichotomous
dependent variables is problematic. To address the endogeneity concerns, consistent with

31
DeFond et al. (2002), we implement a two-stage procedure recommended by Nelson and Olsen
(1978). In the first stage, we use the number of accounting professionals as a dependent variable
and include all the variables in Equation 1 including the number of non-accounting professionals.
We repeat the same for the number of non-accounting professionals as our dependent variable
and also include the number of accounting professionals in the stage 1 model. Consistent with
DeFond et al. (2002), we also include GC, FTGC, or DACC as endogenous independent
variables in stage 1. We separately model the number of accounting and non-accounting
professionals on an audit team because this allows us to simultaneously test both of our test
variables in Equations 1, 2 and 7. In the second stage, we use the predicted value of the number
of accounting and non-accounting professionals in our analyses separately due to the collinearity.
The results (untabulated) are consistent the results presented in Tables 5 through 7. Thus, after
controlling for potential simultaneity bias induced by endogeneity, we fin a positive association
between audit quality and the number of accounting professionals on an audit team, which
supports H2a. Consistent with our results reported earlier, we do not find a significant
association between audit quality and the number of non-accounting professionals on an audit
team.. Thus, H2b is not supported after controlling for endogeneity.
CONCLUSION
The skills and professional qualities of auditors and their staff are important determinants
of audit fees and audit quality because auditors transform auditing efforts into assurance by
reducing the residual risk of material misstatements (Bell et al. 2008; Caramanis and Lennox
2008; Schelleman and Knechel 2010; Causholli et al. 2010). However, the type of labor needed
for an audit engagement has received much less attention in the literature because audit effort
32
data is internal to accounting firms, and is considered highly proprietary (O’Keefe et al. 1994;
Hay et al. 2006; Causholli et al. 2010). We argue that the disaggregation of the labor mix, such
as - professional qualifications of audit team members in an audit engagement will allow
researchers to disentangle their effect on audit fees and financial reporting quality. Therefore, we
examine whether the professional qualifications of audit team members—specifically the number
of accounting and non-accounting professionals in an audit team—are important factors in
determining (1) audit fees, and (2) audit quality in addition to traditional measures (such as client
size, complexity, and risk) used in the literature.
We document that audit fees are significantly and positively associated with both the
number of accounting and non-accounting professionals on an audit team. However, only the
number of accounting professionals on an audit team is significantly associated with audit
quality measured by the propensity to issue a going concern opinion, and first-time going
concern opinion for financially distressed companies, and discretionary and working capital
accruals. Therefore, the number of non-accounting professionals in an audit team does not
appear to be associated with the commonly used measures of audit quality.
To summarize, researchers should consider the inclusion of audit team composition when
examining the determinants of audit fees and audit quality. Our findings show that audit fees are
a function not only of demand-side characteristics, but also of supply-side effort related to the
number of accounting and non-accounting professionals that comprise an audit team.
This study has a number of limitations. We do not find a significant association between
our audit quality measures and the number of non-accounting professionals on an audit team.
However, we cannot unambiguously claim that non-accounting professionals do not contribute to
audit quality. It is likely that complex audit engagements require expertise beyond what can be
33
provided by accounting professionals. For example, a large client with unfunded pension
liabilities may require actuaries on its audit team and audit quality will be higher when the audit
team includes an actuary. Likewise, if a client holds complex financial instruments, a financial
expert is likely to be needed on the audit team to help the accounting professionals better
understand the financial instruments. However, the commonly used measures of audit quality
proxies (e.g., audit opinion, and discretionary accruals) may not capture the association between
audit quality and the contribution of non-accounting professionals to an audit team. Our study
uses data from a non-western country, which may be a limiting factor if the traditional models
employed for our audit fee and quality measures are not appropriate for this context. However,
auditor attributes are important factors in the quality of audits and financial reporting regardless
of environment and our findings should be relevant to future studies.
For further research, future studies could consider the impact of professional qualifications
of audit team members on market reactions to audit reports and investigate whether the
assignment of different mixes of senior vs junior level accounting and non-accounting
professionals to an audit team signals differential audit and financial reporting quality. Future
research could also identify audit quality measures that more directly coincide with the role of
non-accounting professionals on an audit team and examine their association with audit team
composition.
34
REFERENCES
Antle, R., E. Gordon, G. Narayanamoorthy, and L. Zhou. 2006. The joint determination of audit
fees, non-audit fees and abnormal accruals. Review of Quantitative Finance and
Accounting 27 (3): 235–266.
Ashbaugh, H., R. LaFond, and B. Mayhew. 2003. Do nonaudit services compromise auditor
independence? Further evidence. The Accounting Review 78 (3): 611–639.
Asthana, S. C., and J. P. Boone. 2012. Abnormal audit fee and audit quality. Auditing: A Journal
of Practice and Theory 31 (3): 1–22.
Australian Treasury. 2010. Audit Quality in Australia: A Strategic Review. March,
Commonwealth of Australia, Canberra.
Ball, R., and L. Shivakumar. 2006. The role of accruals in asymmetrically timely gain and loss
recognition. Journal of Accounting Research 44 (2): 207-242.
Basioudis, I. G., and J. Francis. 2007. Big 4 audit fee premiums for national and office-level
industry leadership in the United Kingdom. Auditing: A Journal of Practice and Theory 26
(2): 143–146.
Beck, P. J., T. J. Frecka, and I. Solomon. 1988. A model of the market for MAS and audit
services: Knowledge spillovers and auditor-auditee bonding. Journal of Accounting
Literature 7: 50–64.
Behn, B. K., J. V. Carcello, D. R. Hermanson, and R. H. Hermanson. 1999. Client satisfaction
and Big 6 audit fees. Contemporary Accounting Research 16 (4): 587–609.
Bell, T. B., R. Doogar, and I. Solomon. 2008. Audit labor usage and fees under business risk
auditing. Journal of Accounting Research 46 (4): 729–760.
Bell, T. B., W. R. Knechel, and J. J. Willingham. 1994. An exploratory analysis of the
determinants of audit engagement resource allocations. In Audit Symposium XII:
Proceedings of the 1994 Deloitte & Touche/Kansas Symposium on Auditing Problems.
Edited by R. P. Srivastava: 49-67. Lawrence, Kansas: University of Kansas Press.
Blay, A. D. and M. A. Geiger. 2013. Auditor fees and auditor independence: Evidence from
going concern reporting decisions. Contemporary Accounting Research 30 (2): 579–606.
Blokdijk, H., F. Drieenhuizen, D. A. Simunic, and M. T. Stein. 2006. An analysis of cross-
sectional in Big and Non-Big public accounting firms’ programs. Auditing: A Journal of
Practice and Theory 25 (1): 27–48.
35
Cabinet Office of the Government of Japan. 2012. Cabinet Office Ordinance on the Disclosure
of Corporate Information (in Japanese). Tokyo, Japan.
Cahan. S. F., J. M. Godfrey, J. Hamilton, and D. C. Jeter. 2008. Auditor specialization, auditor
dominance, and audit fees: The role of investment opportunities. The Accounting Review
83 (6): 1393–1423.
Cairney, T. D., and G. R. Young. 2006. Homogenous industries and auditor specialization: An
indication of production economies. Auditing: A Journal of Practice and Theory 25 (1):
49–68.
Caramanis, C., and C. Lennox. 2008. Audit effort and earnings management. Journal of
Accounting and Economics 45 (1): 116–138.
Carey, P., and R. Simnett. 2006. Audit partner tenure and audit quality. The Accounting Review
81 (3): 653–676.
Carson, E. 2009. Industry specialization by global audit firm networks. The Accounting Review
84 (2): 355–382.
Carson, E., and N. Fargher. 2007. Note on audit fee premiums to client size and industry
specialization. Accounting and Finance 47 (3): 423–446.
Casterella, J., J. Francis, B. Lewis, and P. Walker. 2004. Auditor industry specialization, client
bargaining power and audit pricing. Auditing: A Journal of Practice and Theory 23 (1):
49–66.
Causholli, M., M. D. Martinis, D. Hay, and W. R. Knechel. 2010. Audit markets, fees and
production: Towards an integrated view of empirical audit research. Journal of Accounting
Literature 29: 167–215.
Chaney, P. K., D. C. Jeter, and L. Shivakumar. 2004. Self-selection of auditors and audit pricing
in private firms. The Accounting Review 79 (1): 51–72.
Chen, S., S. Sun, and D. Wu. 2010. Client importance, institutional improvements, and audit
quality in China: An office and individual auditor level analysis. The Accounting Review
85(1): 127–158.
Chi, W., E. Douthett, and L. Lei. 2012. Client importance and auditor independence. Journal of
Accounting and Public Policy 31: 320–336.
Choi, J., and T. J. Wong. 2006. Auditor’s governance functions and legal environments: An
international investigation. Contemporary Accounting Research 24 (1): 13–46.
36
Coulton, J., G. Livne, A. Pettinicchio, and S. Taylor. 2012. Audit fees and accounting quality:
Inferences from single-period versus multi-period perspectives. Working paper. University
of New South Wales.
Craswell A., J. Francis, and S. Taylor. 1995. Auditor brand name reputation and industry
specialization. Journal of Accounting and Economics 20 (3): 297–322.
Davidson, R. A., and W. E. Gist. 1996. Empirical evidence on the functional relation between
audit planning and total audit effort. Journal of Accounting Research 34 (1): 111–124.
Davis, L. R., D. N. Ricchiute, and G. Trompeter. 1993. Audit effort, audit fees, and the provision
of nonaudit services to audit clients. The Accounting Review 68 (1): 135–150.
DeAngelo, L. 1981. Auditor independence, “low balling,” and disclosure regulation. Journal of
Accounting and Economics 3 (2): 113–27.
Dechow, P., R. Sloan, and A. Sweeney. 1995. Detecting earnings management. The Accounting
Review 70 (2): 193–225.
DeFond, M. and Zhang, J. 2014. A review of archival auditing research. Journal of Accounting
and Economics 58 (2/3): 275-326.
DeFond, M., and C. W. Park. 2001. The reversal of abnormal accruals and the market valuations
of earnings surprise. The Accounting Review 76 (3): 375–404.
DeFond, M., K. Raghunandan, and K. R. Subramanyam. 2002. Do non-audit service fees impair
auditor independence? Evidence from going concern opinion decisions. Journal of
Accounting Research 40 (2): 1247–1274.
Deis, D. R., and G. Giroux. 1996. The effect of auditor changes on audit fees, audit hours, and
audit quality. Journal of Accounting and Public Policy 15 (1): 55–76.
Dopuch, N., M. Gupta, D. A. Simunic, and M. T. Stein. 2003. Production efficiency and the
pricing of audit services. Contemporary Accounting Research 20 (1): 47–77.
Eshleman, J. D., and P. Guo. 2014. Abnormal audit fees and audit quality: The importance of
considering managerial incentives in test of earnings management. Auditing: A Journal of
Practice and Theory Vol. 33 (1): 117-138.
Fargher, N. L., and L. Jiang. 2008. Changes in the audit environment and auditors’ propensity to
issue going concern opinions. Auditing: A Journal of Practice and Theory 27 (2): 55–77.
Ferguson, A., J. R. Francis, and D. J. Stokes. 2003. The effects of firm-wide and office-level
industry expertise on audit pricing. The Accounting Review 78 (2): 429-448.
37
Ferguson, C. B., G. D. Richardson, and G. Wines. 2000. Audit education and training: The effect
of formal studies and work experience. Accounting Horizons 14 (2): 137–167.
Financial Services Agency. 2003. The certified public accountants act (in Japanese). Tokyo,
Japan.
Firth, M. 2002. Auditor-provided consultancy services and their associations with audit prices
and audit opinions. Journal of Business, Finance and Accounting 29 (5): 661–693.
Francis, J. R., and D. J. Stokes. 1986. Audit prices, product differentiation, and scale economies:
Further evidence from the Australian market. Journal of Accounting Research 24 (2): 383–
393.
Frankel, R. M., M. F. Johnson, and K. K. Nelson. 2002. The relation between auditors’ fees for
nonaudit services and earnings management. The Accounting Review 77 (Supplement): 71–
105.
Fukukawa, H. 2011. Audit pricing and cost strategies of Japanese Big 3 firms. International
Journal of Auditing 15(2): 109-126.
Geiger, M. A., and D. V. Rama. 2003. Audit fees, non-audit fees, and auditor reporting on
stressed companies. Auditing: A Journal of Practice and Theory 22 (2): 53-69.
Hackenbrack, K. E., and W. R. Knechel. 1997. Resource allocation decisions in audit
engagements. Contemporary Accounting Research 14 (3): 481–499.
Hay, D. and D. Jeter. 2011. The pricing of industry specialisation by auditors in New Zealand.
Accounting and Business Research 41 (2): 171-195.
Hay, D., W. R. Knechel, and J. Ling. 2008. Evidence on the impact of internal control and
corporate governance on audit fees. International Journal of Auditing 12 (1): 9–24.
Hay, D., W. R. Knechel, and N. Wong. 2006. Audit fees: A meta-analysis of the effect of supply
and demand attributes. Contemporary Accounting Research 23 (1): 141–192.
Japanese Institute of Certified Public Accountant. 2002. The standard audit fee provisions of the
certified public accountants (in Japanese). Tokyo, Japan.
Japanese Institute of Certified Public Accountant. 2003. The guidelines for calculating audit fees
(in Japanese). Tokyo, Japan.
Johnson, V., I. Khurana, and J. Reynolds. 2002. Audit firm tenure and the quality of accounting
earnings. Contemporary Accounting Research 19 (4): 637–660.
38
Jones, J. 1991. Earnings management during import relief investigations. Journal of Accounting
Research 29 (2): 193–228.
Judge, G. G.; W. E. Griffiths; R. C. Hill; H. Lutkephol; and T. Lee. 1985. The Theory and
Practice of Econometrics, 2nd Edition. New York: John Wiley and Sons.
Kothari, K., A. Leone, and C. Wasley. 2005. Performance matched discretionary accruals.
Journal of Accounting and Economics 39 (1): 163–197.
Li, C. 2009. Does client importance affect auditor independence at the office level? Empirical
evidence from going–concern opinions. Contemporary Accounting Research 26 (1): 201–
230.
Lim, C., and H. Tan. 2008. Non–audit service fees and audit quality: The impact of auditor
specialization. Journal of Accounting Research 46 (1): 199–246.
McKeown, J. C., J. F. Mutchler, and W. Hopwood. 1991. Towards an explanation of auditor
failure to modify the audit opinion of bankrupt companies. Auditing: A Journal of Practice
and Theory 10 (Supplement): 1–13.
McNichols, M. F. 2002. Discussion of the quality of accruals and earnings: The role of accrual
estimation errors. The Accounting Review 77 (Supplement): 61–69.
Minutti-Meza, M. 2013. Does auditor industry specialization improve audit quality? Journal of
Accounting Research 51 (4): 779-817.
Mutchler, J. F., W. Hopwood, and J. C. McKeown. 1997. The influence of contrary information
and mitigating factors on audit opinion decisions on bankrupt firms. Journal of Accounting
Research 35 (Autumn): 295–310.
Myers, J. N., L. A. Myers, and T. C. Omer. 2003. Exploring the term of the auditor-client
relationship and the quality of earnings: A case for mandatory auditor rotation? The
Accounting Review 78 (3): 779–799.
Nelson, F., and L. Olsen. 1978. Specification and estimation of simultaneous equations model
with limited dependent variables. International Economic Review 19 (1978): 695–710.
O’Keefe, T. B., D. A. Simunic, and M. T. Stein. 1994. The production of audit services:
Evidence from a major public accounting firm. Journal of Accounting Research 32 (2):
241–261.
Petersen, M. A. 2009. Estimating standard errors in finance panel data sets: Comparing
approaches. The Review of Financial Studies 22 (1): 435-480.
39
Public Company Accounting Oversight Board, PCAOB. 2013. Standing advisory group meeting
discussion–Audit quality indicators. Washington, D.C.
Reynolds, J., and J. Francis. 2001. Does size matter? The influence of large clients on office-
level auditor reporting decisions. Journal of Accounting and Economics 30 (3): 375–400.
Robinson, D. 2008. Auditor independence and auditor–provided tax service: Evidence from
going–concern audit opinions prior to bankruptcy filings. Auditing: A Journal of Practice
and Theory 27 (2): 31–54.
Schelleman, C., and W. R. Knechel. 2010. Short-term accruals and the pricing and production of
audit services. Auditing: A Journal of Practice and Theory 29 (1): 221–250.
Simunic, D. A. 1980. The pricing of audit services: Theory and evidence. Journal of Accounting
Research 22 (3): 161–190.
Simunic, D.A., and M.T. Stein. 1996. The impact of litigation risk on audit pricing: a review of
the economics and the evidence. Auditing a Journal of Practice and Theory 15(Suppl.): 119-
134.
Skinner, D. J., and S. Srinivasan. 2012. Audit quality and auditor reputation: Evidence from
Japan. The Accounting Review 87 (5): 1737–1765.
Stein, M. T., D. A. Simunic, and T. B. O’Keefe. 1994. Industry differences in the production of
audit services. Auditing: A Journal of Practice and Theory 13 (1): 128–142.
Study Group on Auditor and Audit Fee Issues. 2008, 2009, 2010, 2011, 2012. Report on Auditor
and Audit Fees of Publicly Listed Companies 2008, 2009, 2010, 2011, 2012. Seibunsha (in
Japanese).
U.K. Financial Reporting Council. 2008. The Audit Quality Framework. London.
Whisenant, S., S. Sankaraguruswamy, and K. Raghunandan. 2003. Evidence on the joint
determination of audit and non-audit fees. Journal of Accounting Research 41 (4): 721–744.
Zerni, M. 2012. Audit partner specialization and audit fees: Some evidence from Sweden.
Contemporary Accounting Research 29 (1): 312-340.
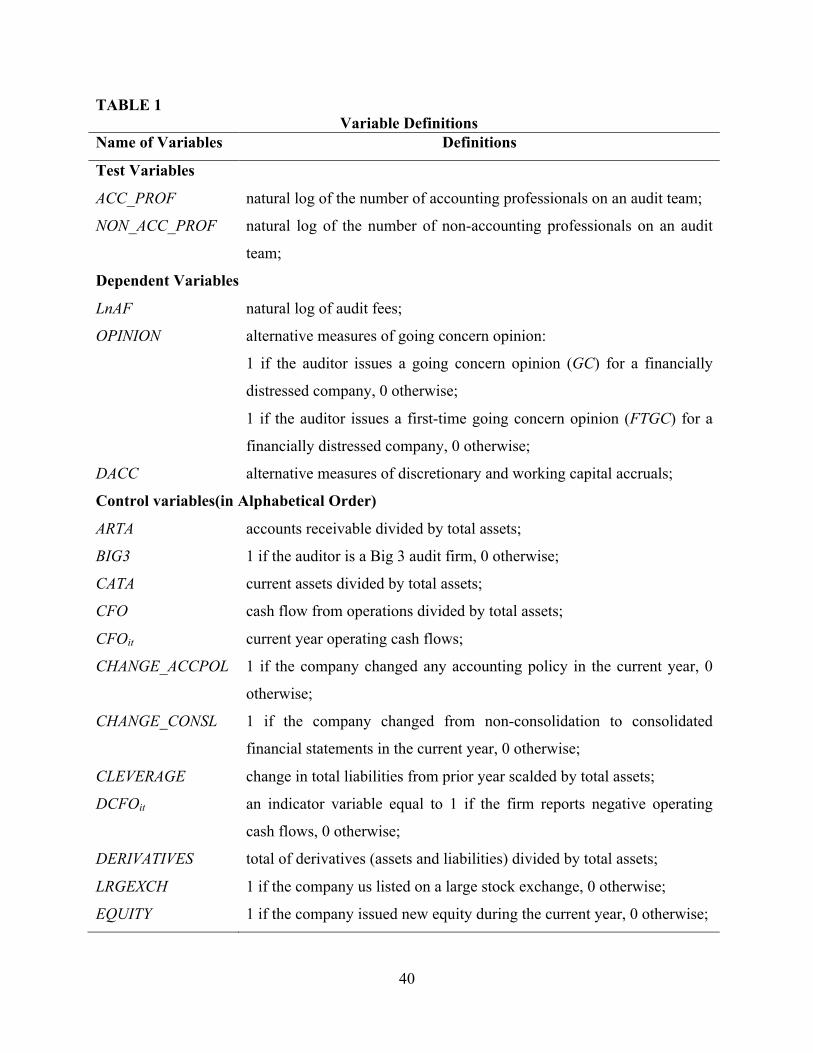
40
TABLE 1 Variable Definitions
Name of Variables Definitions
Test Variables
ACC_PROF natural log of the number of accounting professionals on an audit team;
NON_ACC_PROF natural log of the number of non-accounting professionals on an audit
team;
Dependent Variables
LnAF natural log of audit fees;
OPINION alternative measures of going concern opinion:
1 if the auditor issues a going concern opinion (GC) for a financially
distressed company, 0 otherwise;
1 if the auditor issues a first-time going concern opinion (FTGC) for a
financially distressed company, 0 otherwise;
DACC alternative measures of discretionary and working capital accruals;
Control variables(in Alphabetical Order)
ARTA accounts receivable divided by total assets;
BIG3 1 if the auditor is a Big 3 audit firm, 0 otherwise;
CATA current assets divided by total assets;
CFO cash flow from operations divided by total assets;
CFOit current year operating cash flows;
CHANGE_ACCPOL 1 if the company changed any accounting policy in the current year, 0
otherwise;
CHANGE_CONSL 1 if the company changed from non-consolidation to consolidated
financial statements in the current year, 0 otherwise;
CLEVERAGE change in total liabilities from prior year scalded by total assets;
DCFOit an indicator variable equal to 1 if the firm reports negative operating
cash flows, 0 otherwise;
DERIVATIVES total of derivatives (assets and liabilities) divided by total assets;
LRGEXCH 1 if the company us listed on a large stock exchange, 0 otherwise;
EQUITY 1 if the company issued new equity during the current year, 0 otherwise;
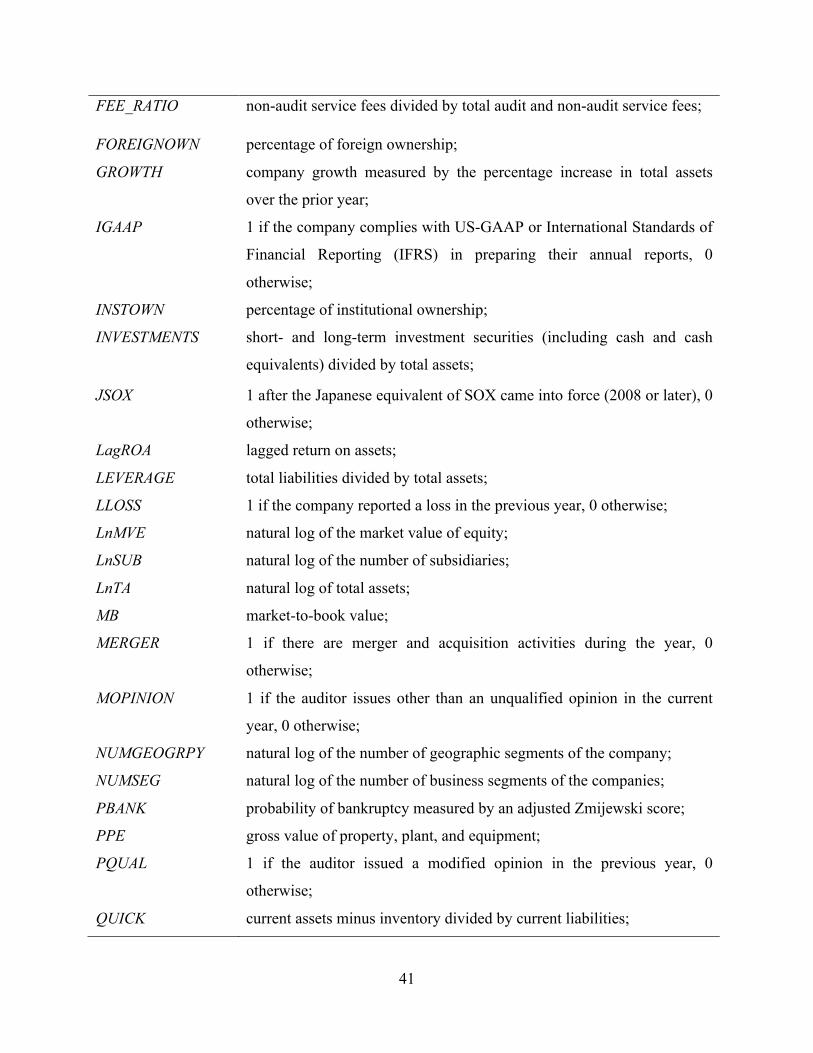
41
FEE_RATIO non-audit service fees divided by total audit and non-audit service fees;
FOREIGNOWN percentage of foreign ownership;
GROWTH company growth measured by the percentage increase in total assets
over the prior year;
IGAAP 1 if the company complies with US-GAAP or International Standards of
Financial Reporting (IFRS) in preparing their annual reports, 0
otherwise;
INSTOWN percentage of institutional ownership;
INVESTMENTS short- and long-term investment securities (including cash and cash
equivalents) divided by total assets;
JSOX 1 after the Japanese equivalent of SOX came into force (2008 or later), 0
otherwise;
LagROA lagged return on assets;
LEVERAGE total liabilities divided by total assets;
LLOSS 1 if the company reported a loss in the previous year, 0 otherwise;
LnMVE natural log of the market value of equity;
LnSUB natural log of the number of subsidiaries;
LnTA natural log of total assets;
MB market-to-book value;
MERGER 1 if there are merger and acquisition activities during the year, 0
otherwise;
MOPINION 1 if the auditor issues other than an unqualified opinion in the current
year, 0 otherwise;
NUMGEOGRPY natural log of the number of geographic segments of the company;
NUMSEG natural log of the number of business segments of the companies;
PBANK probability of bankruptcy measured by an adjusted Zmijewski score;
PPE gross value of property, plant, and equipment;
PQUAL 1 if the auditor issued a modified opinion in the previous year, 0
otherwise;
QUICK current assets minus inventory divided by current liabilities;
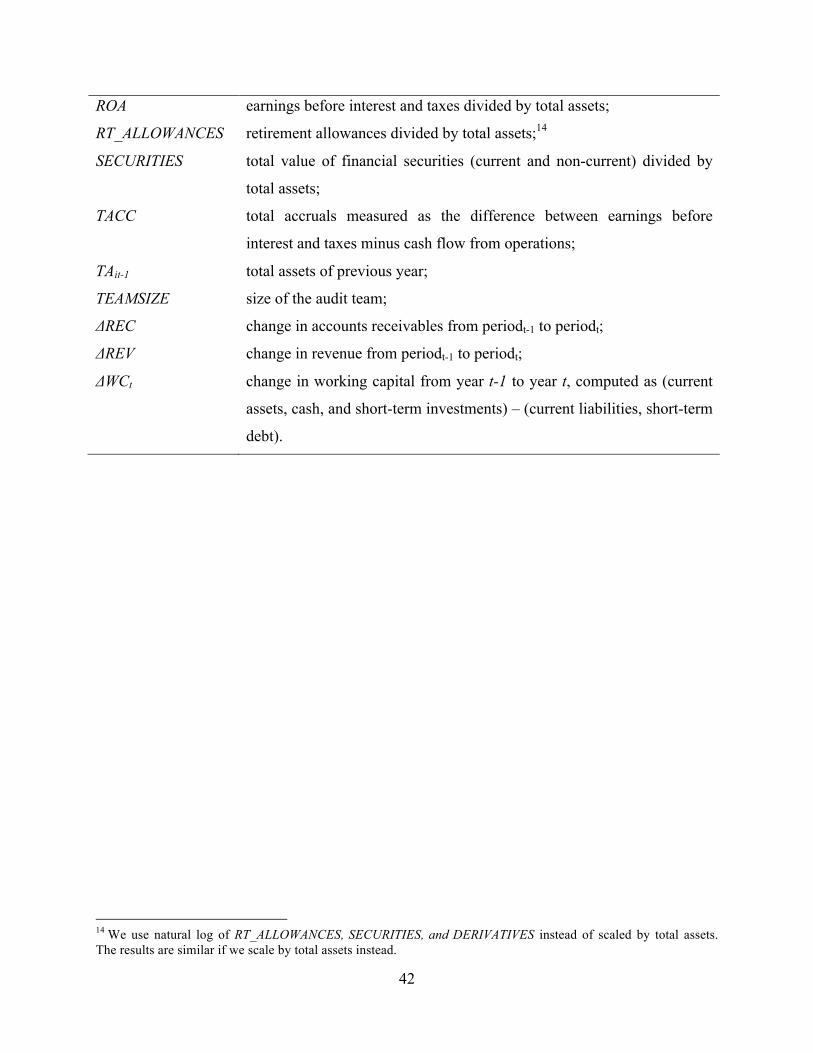
42
ROA earnings before interest and taxes divided by total assets;
RT_ALLOWANCES retirement allowances divided by total assets;14
SECURITIES total value of financial securities (current and non-current) divided by
total assets;
TACC total accruals measured as the difference between earnings before
interest and taxes minus cash flow from operations;
TAit-1 total assets of previous year;
TEAMSIZE size of the audit team;
ΔREC change in accounts receivables from periodt-1 to periodt;
ΔREV change in revenue from periodt-1 to periodt;
ΔWCt change in working capital from year t-1 to year t, computed as (current
assets, cash, and short-term investments) – (current liabilities, short-term
debt).
14 We use natural log of RT_ALLOWANCES, SECURITIES, and DERIVATIVES instead of scaled by total assets. The results are similar if we scale by total assets instead.
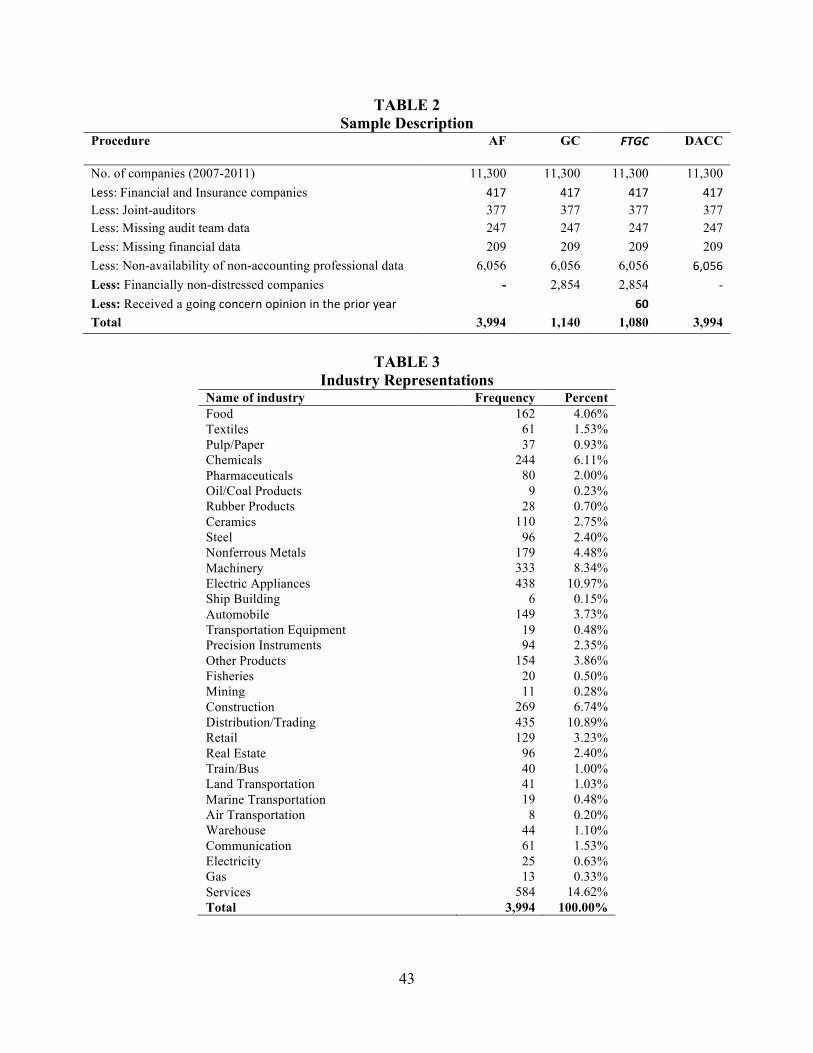
43
TABLE 2 Sample Description
Procedure AF GC FTGC DACC
No. of companies (2007-2011) 11,300 11,300 11,300 11,300 Less: Financial and Insurance companies 417 417 417 417 Less: Joint-auditors 377 377 377 377 Less: Missing audit team data 247 247 247 247 Less: Missing financial data 209 209 209 209 Less: Non-availability of non-accounting professional data 6,056 6,056 6,056 6,056 Less: Financially non-distressed companies - 2,854 2,854 -‐ Less: Received a going concern opinion in the prior year 60 Total 3,994 1,140 1,080 3,994
TABLE 3
Industry Representations Name of industry Frequency Percent Food 162 4.06% Textiles 61 1.53% Pulp/Paper 37 0.93% Chemicals 244 6.11% Pharmaceuticals 80 2.00% Oil/Coal Products 9 0.23% Rubber Products 28 0.70% Ceramics 110 2.75% Steel 96 2.40% Nonferrous Metals 179 4.48% Machinery 333 8.34% Electric Appliances 438 10.97% Ship Building 6 0.15% Automobile 149 3.73% Transportation Equipment 19 0.48% Precision Instruments 94 2.35% Other Products 154 3.86% Fisheries 20 0.50% Mining 11 0.28% Construction 269 6.74% Distribution/Trading 435 10.89% Retail 129 3.23% Real Estate 96 2.40% Train/Bus 40 1.00% Land Transportation 41 1.03% Marine Transportation 19 0.48% Air Transportation 8 0.20% Warehouse 44 1.10% Communication 61 1.53% Electricity 25 0.63% Gas 13 0.33% Services 584 14.62% Total 3,994 100.00%
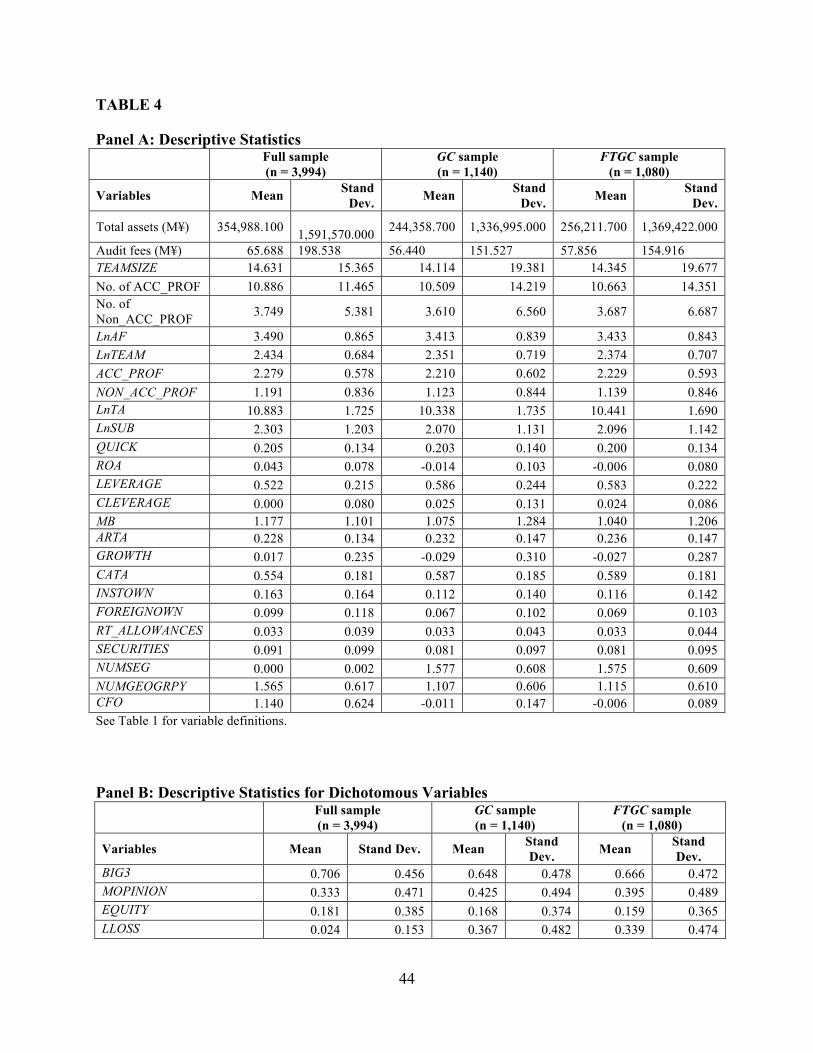
44
TABLE 4
Panel A: Descriptive Statistics Full sample
(n = 3,994) GC sample (n = 1,140)
FTGC sample (n = 1,080)
Variables Mean Stand Dev. Mean Stand
Dev. Mean Stand Dev.
Total assets (M¥) 354,988.100 1,591,570.000 244,358.700 1,336,995.000 256,211.700 1,369,422.000
Audit fees (M¥) 65.688 198.538 56.440 151.527 57.856 154.916 TEAMSIZE 14.631 15.365 14.114 19.381 14.345 19.677 No. of ACC_PROF 10.886 11.465 10.509 14.219 10.663 14.351 No. of Non_ACC_PROF 3.749 5.381 3.610 6.560 3.687 6.687
LnAF 3.490 0.865 3.413 0.839 3.433 0.843 LnTEAM 2.434 0.684 2.351 0.719 2.374 0.707 ACC_PROF 2.279 0.578 2.210 0.602 2.229 0.593 NON_ACC_PROF 1.191 0.836 1.123 0.844 1.139 0.846 LnTA 10.883 1.725 10.338 1.735 10.441 1.690 LnSUB 2.303 1.203 2.070 1.131 2.096 1.142 QUICK 0.205 0.134 0.203 0.140 0.200 0.134 ROA 0.043 0.078 -0.014 0.103 -0.006 0.080 LEVERAGE 0.522 0.215 0.586 0.244 0.583 0.222 CLEVERAGE 0.000 0.080 0.025 0.131 0.024 0.086 MB 1.177 1.101 1.075 1.284 1.040 1.206 ARTA 0.228 0.134 0.232 0.147 0.236 0.147 GROWTH 0.017 0.235 -0.029 0.310 -0.027 0.287 CATA 0.554 0.181 0.587 0.185 0.589 0.181 INSTOWN 0.163 0.164 0.112 0.140 0.116 0.142 FOREIGNOWN 0.099 0.118 0.067 0.102 0.069 0.103 RT_ALLOWANCES 0.033 0.039 0.033 0.043 0.033 0.044 SECURITIES 0.091 0.099 0.081 0.097 0.081 0.095 NUMSEG 0.000 0.002 1.577 0.608 1.575 0.609 NUMGEOGRPY 1.565 0.617 1.107 0.606 1.115 0.610 CFO 1.140 0.624 -0.011 0.147 -0.006 0.089 See Table 1 for variable definitions. Panel B: Descriptive Statistics for Dichotomous Variables Full sample
(n = 3,994) GC sample (n = 1,140)
FTGC sample (n = 1,080)
Variables Mean Stand Dev. Mean Stand Dev. Mean Stand
Dev. BIG3 0.706 0.456 0.648 0.478 0.666 0.472 MOPINION 0.333 0.471 0.425 0.494 0.395 0.489 EQUITY 0.181 0.385 0.168 0.374 0.159 0.365 LLOSS 0.024 0.153 0.367 0.482 0.339 0.474
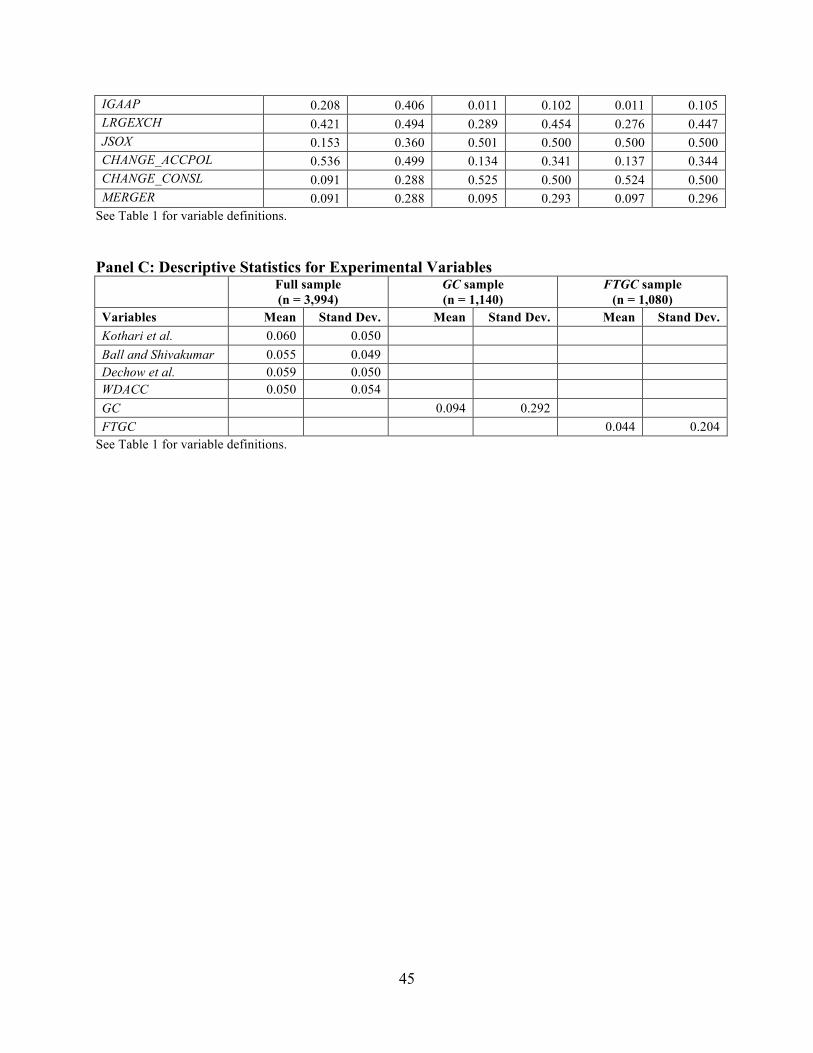
45
IGAAP 0.208 0.406 0.011 0.102 0.011 0.105 LRGEXCH 0.421 0.494 0.289 0.454 0.276 0.447 JSOX 0.153 0.360 0.501 0.500 0.500 0.500 CHANGE_ACCPOL 0.536 0.499 0.134 0.341 0.137 0.344 CHANGE_CONSL 0.091 0.288 0.525 0.500 0.524 0.500 MERGER 0.091 0.288 0.095 0.293 0.097 0.296
See Table 1 for variable definitions.
Panel C: Descriptive Statistics for Experimental Variables Full sample
(n = 3,994) GC sample (n = 1,140)
FTGC sample (n = 1,080)
Variables Mean Stand Dev. Mean Stand Dev. Mean Stand Dev. Kothari et al. 0.060 0.050 Ball and Shivakumar 0.055 0.049 Dechow et al. 0.059 0.050 WDACC 0.050 0.054 GC 0.094 0.292 FTGC 0.044 0.204
See Table 1 for variable definitions.
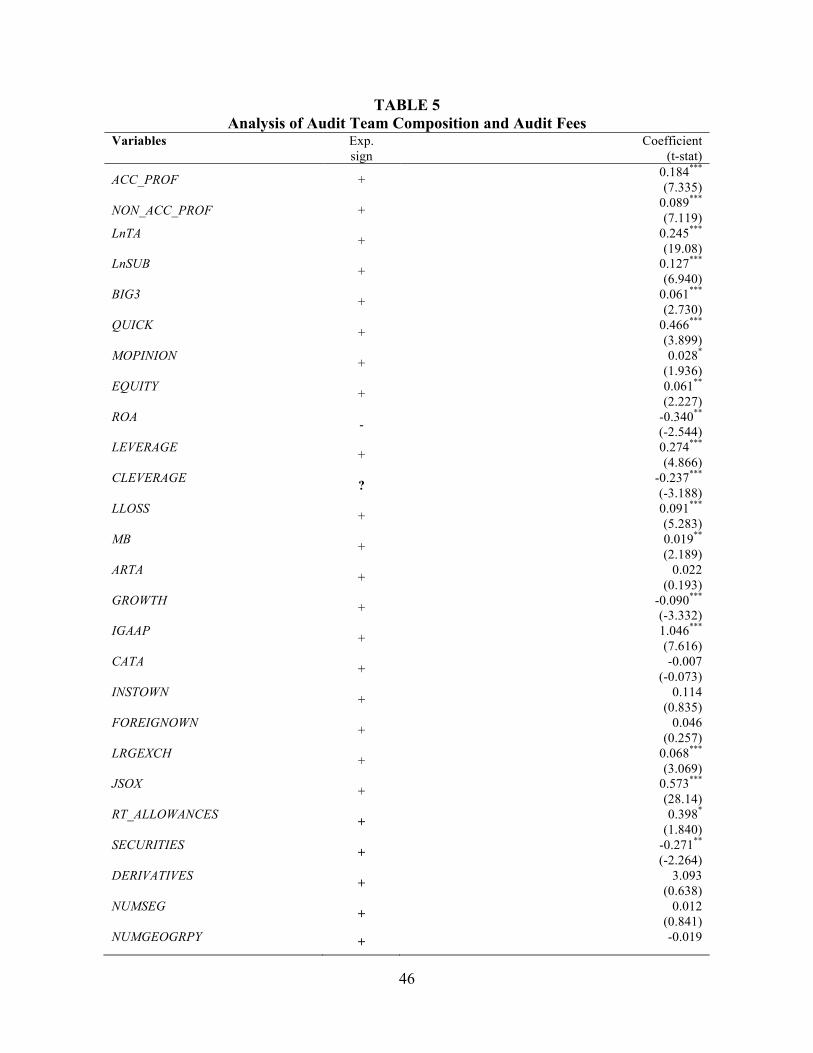
46
TABLE 5 Analysis of Audit Team Composition and Audit Fees
Variables Exp. sign
Coefficient (t-stat)
ACC_PROF + 0.184*** (7.335)
NON_ACC_PROF + 0.089*** (7.119)
LnTA + 0.245*** (19.08)
LnSUB + 0.127*** (6.940)
BIG3 + 0.061*** (2.730)
QUICK + 0.466*** (3.899)
MOPINION + 0.028* (1.936)
EQUITY + 0.061** (2.227)
ROA - -0.340** (-2.544)
LEVERAGE + 0.274*** (4.866)
CLEVERAGE ? -0.237*** (-3.188)
LLOSS + 0.091*** (5.283)
MB + 0.019** (2.189)
ARTA + 0.022 (0.193)
GROWTH + -0.090*** (-3.332)
IGAAP + 1.046*** (7.616)
CATA + -0.007 (-0.073)
INSTOWN + 0.114 (0.835)
FOREIGNOWN + 0.046 (0.257)
LRGEXCH + 0.068*** (3.069)
JSOX + 0.573*** (28.14)
RT_ALLOWANCES + 0.398* (1.840)
SECURITIES + -0.271** (-2.264)
DERIVATIVES + 3.093 (0.638)
NUMSEG + 0.012 (0.841)
NUMGEOGRPY + -0.019
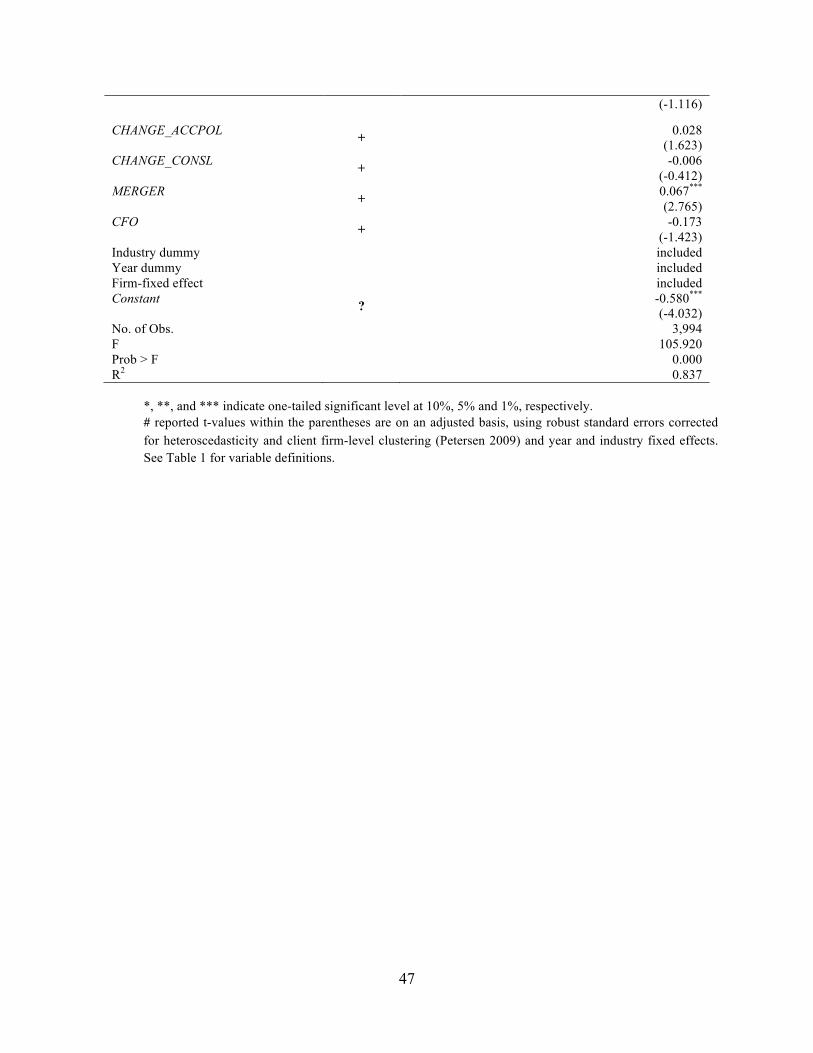
47
(-1.116)
CHANGE_ACCPOL + 0.028 (1.623)
CHANGE_CONSL + -0.006 (-0.412)
MERGER + 0.067*** (2.765)
CFO + -0.173 (-1.423)
Industry dummy included Year dummy included Firm-fixed effect included Constant ? -0.580***
(-4.032) No. of Obs. F Prob > F R2
3,994 105.920
0.000 0.837
*, **, and *** indicate one-tailed significant level at 10%, 5% and 1%, respectively. # reported t-values within the parentheses are on an adjusted basis, using robust standard errors corrected for heteroscedasticity and client firm-level clustering (Petersen 2009) and year and industry fixed effects. See Table 1 for variable definitions.
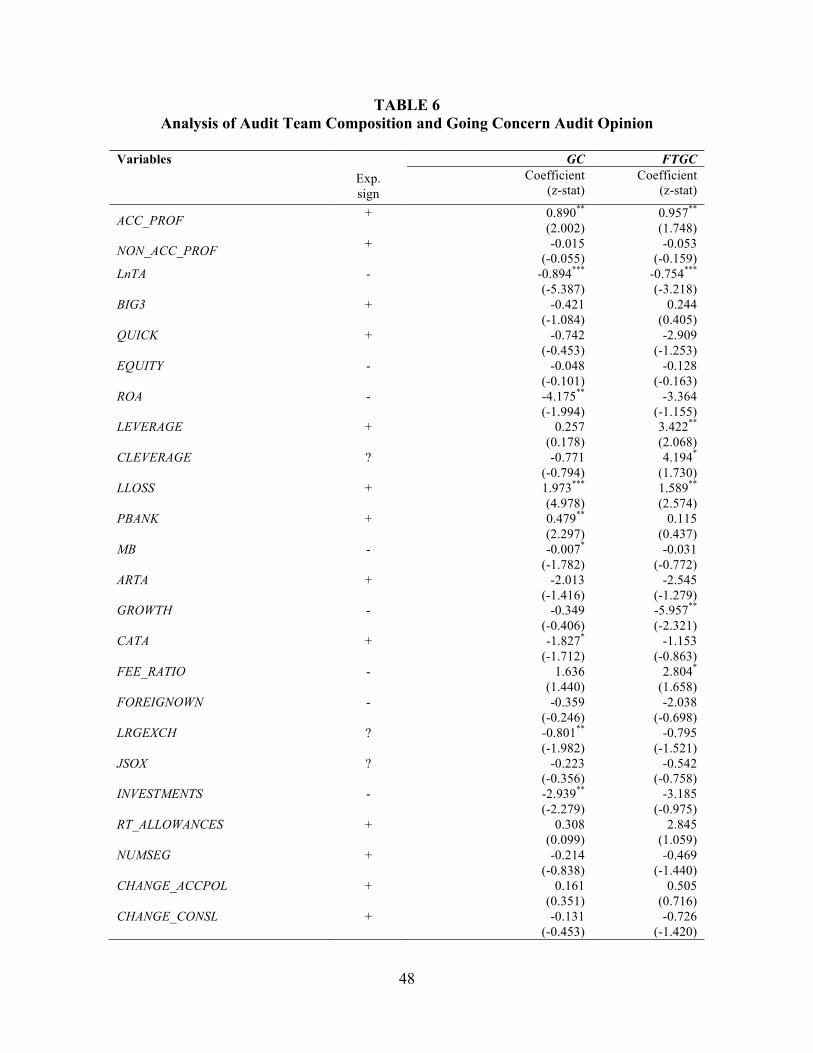
48
TABLE 6 Analysis of Audit Team Composition and Going Concern Audit Opinion
Variables GC FTGC Exp.
sign Coefficient
(z-stat) Coefficient
(z-stat)
ACC_PROF + 0.890** (2.002)
0.957** (1.748)
NON_ACC_PROF + -0.015 (-0.055)
-0.053 (-0.159)
LnTA - -0.894*** (-5.387)
-0.754*** (-3.218)
BIG3 + -0.421 (-1.084)
0.244 (0.405)
QUICK + -0.742 (-0.453)
-2.909 (-1.253)
EQUITY - -0.048 (-0.101)
-0.128 (-0.163)
ROA - -4.175** (-1.994)
-3.364 (-1.155)
LEVERAGE + 0.257 (0.178)
3.422** (2.068)
CLEVERAGE ? -0.771 (-0.794)
4.194* (1.730)
LLOSS + 1.973*** (4.978)
1.589** (2.574)
PBANK + 0.479** (2.297)
0.115 (0.437)
MB - -0.007* (-1.782)
-0.031 (-0.772)
ARTA + -2.013 (-1.416)
-2.545 (-1.279)
GROWTH - -0.349 (-0.406)
-5.957** (-2.321)
CATA + -1.827* (-1.712)
-1.153 (-0.863)
FEE_RATIO - 1.636 (1.440)
2.804* (1.658)
FOREIGNOWN - -0.359 (-0.246)
-2.038 (-0.698)
LRGEXCH ? -0.801** (-1.982)
-0.795 (-1.521)
JSOX ? -0.223 (-0.356)
-0.542 (-0.758)
INVESTMENTS - -2.939** (-2.279)
-3.185 (-0.975)
RT_ALLOWANCES + 0.308 (0.099)
2.845 (1.059)
NUMSEG + -0.214 (-0.838)
-0.469 (-1.440)
CHANGE_ACCPOL + 0.161 (0.351)
0.505 (0.716)
CHANGE_CONSL + -0.131 (-0.453)
-0.726 (-1.420)
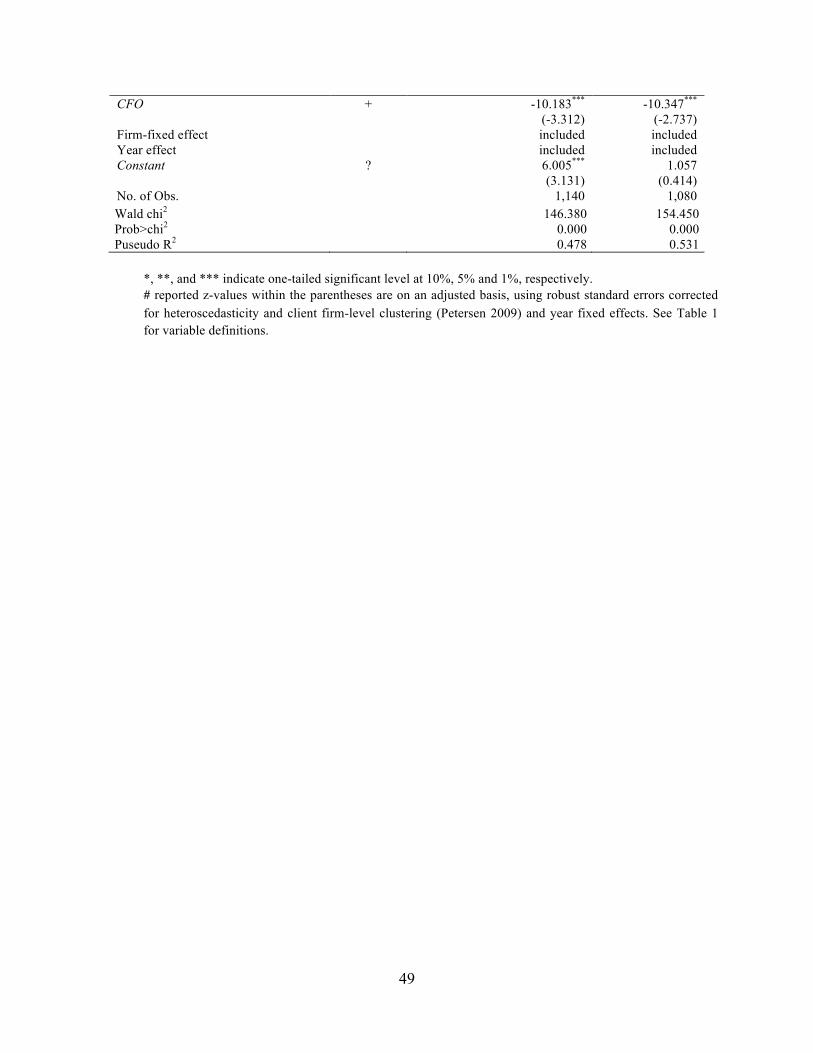
49
CFO + -10.183*** (-3.312)
-10.347*** (-2.737)
Firm-fixed effect included included Year effect included included Constant ? 6.005***
(3.131) 1.057
(0.414) No. of Obs. 1,140 1,080 Wald chi2 146.380 154.450 Prob>chi2 0.000 0.000 Puseudo R2 0.478 0.531
*, **, and *** indicate one-tailed significant level at 10%, 5% and 1%, respectively. # reported z-values within the parentheses are on an adjusted basis, using robust standard errors corrected for heteroscedasticity and client firm-level clustering (Petersen 2009) and year fixed effects. See Table 1 for variable definitions.
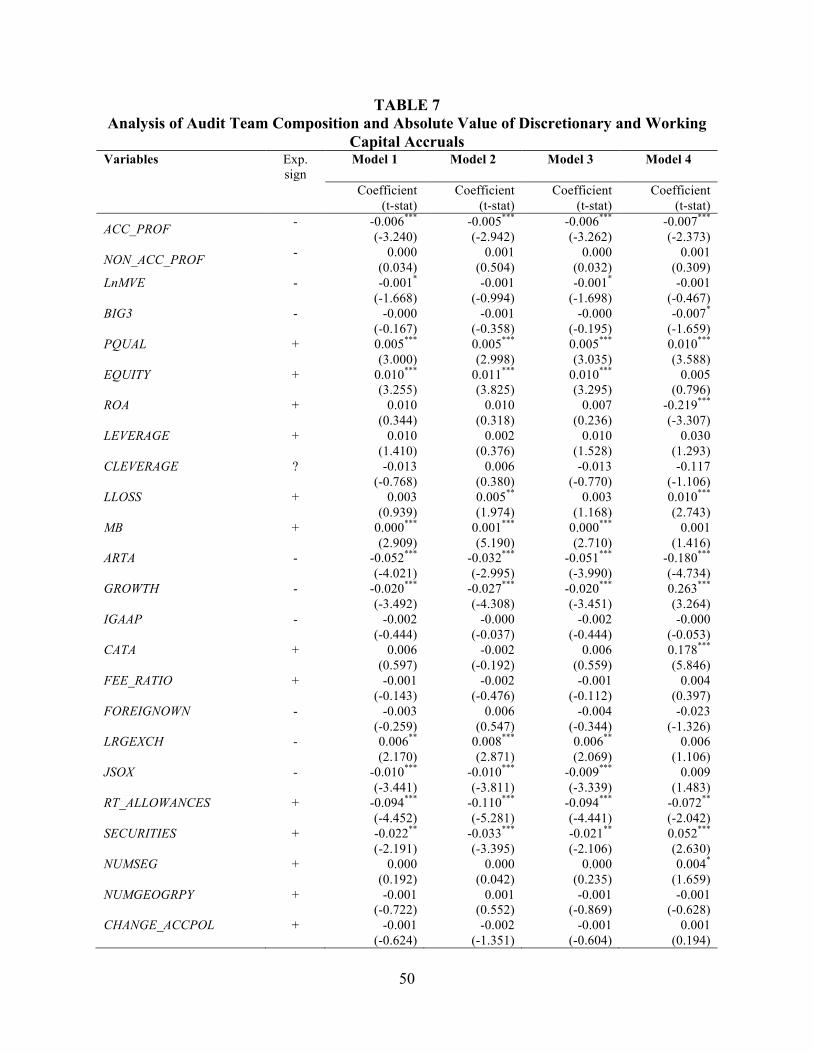
50
TABLE 7 Analysis of Audit Team Composition and Absolute Value of Discretionary and Working
Capital Accruals Variables Exp.
sign Model 1 Model 2 Model 3 Model 4
Coefficient (t-stat)
Coefficient (t-stat)
Coefficient (t-stat)
Coefficient (t-stat)
ACC_PROF - -0.006*** (-3.240)
-0.005*** (-2.942)
-0.006*** (-3.262)
-0.007*** (-2.373)
NON_ACC_PROF - 0.000 (0.034)
0.001 (0.504)
0.000 (0.032)
0.001 (0.309)
LnMVE - -0.001* (-1.668)
-0.001 (-0.994)
-0.001* (-1.698)
-0.001 (-0.467)
BIG3 - -0.000 (-0.167)
-0.001 (-0.358)
-0.000 (-0.195)
-0.007* (-1.659)
PQUAL + 0.005*** (3.000)
0.005*** (2.998)
0.005*** (3.035)
0.010*** (3.588)
EQUITY + 0.010*** (3.255)
0.011*** (3.825)
0.010*** (3.295)
0.005 (0.796)
ROA + 0.010 (0.344)
0.010 (0.318)
0.007 (0.236)
-0.219*** (-3.307)
LEVERAGE + 0.010 (1.410)
0.002 (0.376)
0.010 (1.528)
0.030 (1.293)
CLEVERAGE ? -0.013 (-0.768)
0.006 (0.380)
-0.013 (-0.770)
-0.117 (-1.106)
LLOSS + 0.003 (0.939)
0.005** (1.974)
0.003 (1.168)
0.010*** (2.743)
MB + 0.000*** (2.909)
0.001*** (5.190)
0.000*** (2.710)
0.001 (1.416)
ARTA - -0.052*** (-4.021)
-0.032*** (-2.995)
-0.051*** (-3.990)
-0.180*** (-4.734)
GROWTH - -0.020*** (-3.492)
-0.027*** (-4.308)
-0.020*** (-3.451)
0.263*** (3.264)
IGAAP - -0.002 (-0.444)
-0.000 (-0.037)
-0.002 (-0.444)
-0.000 (-0.053)
CATA + 0.006 (0.597)
-0.002 (-0.192)
0.006 (0.559)
0.178*** (5.846)
FEE_RATIO + -0.001 (-0.143)
-0.002 (-0.476)
-0.001 (-0.112)
0.004 (0.397)
FOREIGNOWN - -0.003 (-0.259)
0.006 (0.547)
-0.004 (-0.344)
-0.023 (-1.326)
LRGEXCH - 0.006** (2.170)
0.008*** (2.871)
0.006** (2.069)
0.006 (1.106)
JSOX - -0.010*** (-3.441)
-0.010*** (-3.811)
-0.009*** (-3.339)
0.009 (1.483)
RT_ALLOWANCES + -0.094*** (-4.452)
-0.110*** (-5.281)
-0.094*** (-4.441)
-0.072** (-2.042)
SECURITIES + -0.022** (-2.191)
-0.033*** (-3.395)
-0.021** (-2.106)
0.052*** (2.630)
NUMSEG + 0.000 (0.192)
0.000 (0.042)
0.000 (0.235)
0.004* (1.659)
NUMGEOGRPY + -0.001 (-0.722)
0.001 (0.552)
-0.001 (-0.869)
-0.001 (-0.628)
CHANGE_ACCPOL + -0.001 (-0.624)
-0.002 (-1.351)
-0.001 (-0.604)
0.001 (0.194)
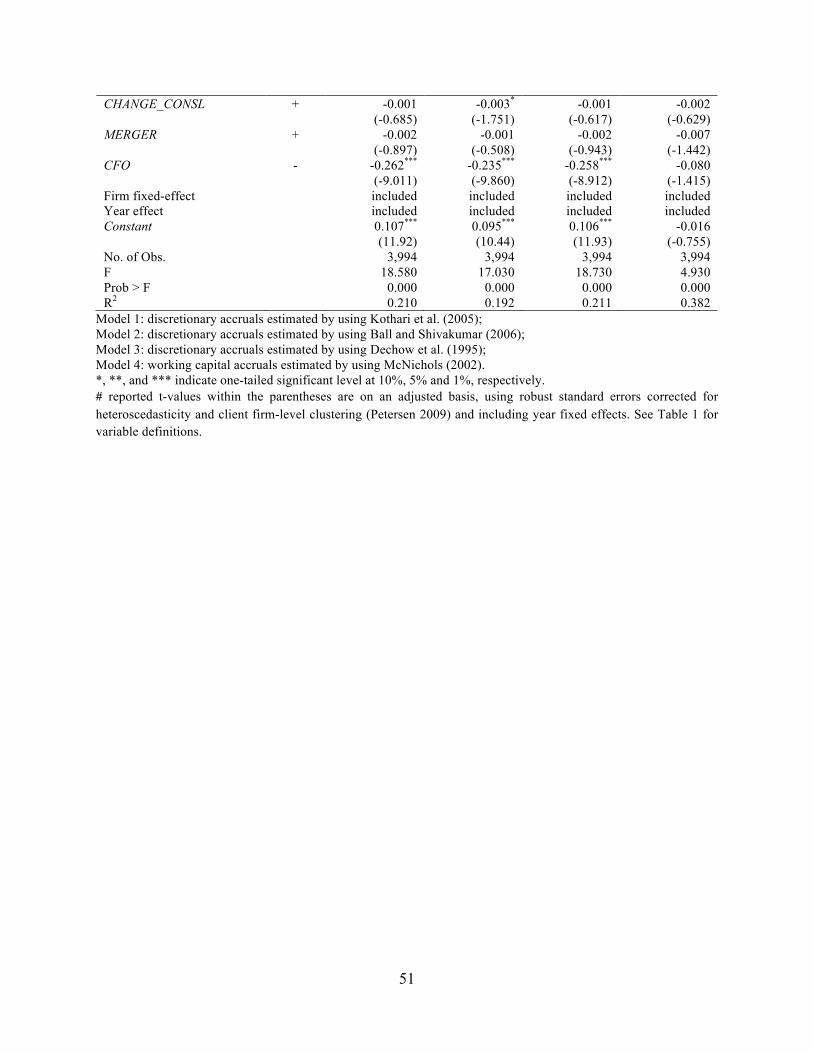
51
CHANGE_CONSL + -0.001 (-0.685)
-0.003* (-1.751)
-0.001 (-0.617)
-0.002 (-0.629)
MERGER + -0.002 (-0.897)
-0.001 (-0.508)
-0.002 (-0.943)
-0.007 (-1.442)
CFO - -0.262*** (-9.011)
-0.235*** (-9.860)
-0.258*** (-8.912)
-0.080 (-1.415)
Firm fixed-effect included included included included Year effect included included included included Constant 0.107***
(11.92) 0.095*** (10.44)
0.106*** (11.93)
-0.016 (-0.755)
No. of Obs. 3,994 3,994 3,994 3,994 F 18.580 17.030 18.730 4.930 Prob > F 0.000 0.000 0.000 0.000 R2 0.210 0.192 0.211 0.382
Model 1: discretionary accruals estimated by using Kothari et al. (2005); Model 2: discretionary accruals estimated by using Ball and Shivakumar (2006); Model 3: discretionary accruals estimated by using Dechow et al. (1995); Model 4: working capital accruals estimated by using McNichols (2002). *, **, and *** indicate one-tailed significant level at 10%, 5% and 1%, respectively. # reported t-values within the parentheses are on an adjusted basis, using robust standard errors corrected for heteroscedasticity and client firm-level clustering (Petersen 2009) and including year fixed effects. See Table 1 for variable definitions.