The Regional Comprehensive Economic Partnership: New ...€¦ · The Regional Comprehensive...
41
The Regional Comprehensive Economic Partnership: New Paradigm or Old Wine in a New Bottle? Sanchita Basu Das Institute of Southeast Asian Studies E-mail: [email protected] and Reema B. Jagtiani Institute of Southeast Asian Studies E-mail: [email protected] ISEAS Economics Working Paper No.2014-3 November 2014 Abstract: ASEAN is currently negotiating the Regional Comprehensive Economic Partnership (RCEP) agreement with its six trading partners. The RCEP has the potential to expand into a Free Trade Agreement of the Asia-Pacific (FTAAP) as it intends to harmonise rules and regulations across multiple overlapping trade agreements in the region. However, it faces challenges. The mention of a flexibility principle and the “ASEAN Way” of decision-making has led many to believe that the RCEP will be yet another low-quality trade agreement in the region. As such, the RCEP presents all ASEAN members an opportunity to take a central role in setting the agenda for a region-wide agreement. Hence, ASEAN must make efforts to attain an attractive RCEP vis-à-vis other competing regional agreements. Accordingly, this paper highlights what the RCEP is, how it has emerged and the issues that might affect the agreement’s final quality in order to evaluate it as a new paradigm or a repackaged version of ASEAN’s existing trade agreements. Keywords: Free Trade; Trade Agreements; ASEAN; RCEP; FTAAP JEL Classification: F13, F14, F15, F53 Institute of Southeast Asian Studies 30 Heng Mui Keng Terrace Pasir Panjang, Singapore 119614 http://www.iseas.edu.sg
Transcript of The Regional Comprehensive Economic Partnership: New ...€¦ · The Regional Comprehensive...
The Regional Comprehensive Economic Partnership:
New Paradigm or Old Wine in a New Bottle?
Sanchita Basu Das
Institute of Southeast Asian Studies
E-mail: [email protected]
and
Reema B. Jagtiani
Institute of Southeast Asian Studies
E-mail: [email protected]
ISEAS Economics Working Paper No.2014-3
November 2014
Abstract: ASEAN is currently negotiating the Regional Comprehensive Economic Partnership (RCEP)
agreement with its six trading partners. The RCEP has the potential to expand into a Free Trade
Agreement of the Asia-Pacific (FTAAP) as it intends to harmonise rules and regulations across multiple
overlapping trade agreements in the region. However, it faces challenges. The mention of a flexibility
principle and the “ASEAN Way” of decision-making has led many to believe that the RCEP will be yet
another low-quality trade agreement in the region. As such, the RCEP presents all ASEAN members
an opportunity to take a central role in setting the agenda for a region-wide agreement. Hence, ASEAN
must make efforts to attain an attractive RCEP vis-à-vis other competing regional agreements.
Accordingly, this paper highlights what the RCEP is, how it has emerged and the issues that might
affect the agreement’s final quality in order to evaluate it as a new paradigm or a repackaged version of
ASEAN’s existing trade agreements.
Keywords: Free Trade; Trade Agreements; ASEAN; RCEP; FTAAP
JEL Classification: F13, F14, F15, F53
Institute of Southeast Asian Studies 30 Heng Mui Keng Terrace Pasir Panjang, Singapore 119614 http://www.iseas.edu.sg

1
The Regional Comprehensive Economic Partnership:
New Paradigm or Old Wine in a New Bottle?
Sanchita Basu Das and Reema B. Jagtiani
1. Introduction
The Association of Southeast Asian Nations (ASEAN) has been pursuing economic
regionalism since the early 1990s. It started with its own integration process of an ASEAN
Free Trade Area (AFTA) in 1992 and thereafter, in 2003, expanded the process to a deeper and
wider form of economic cooperation via the ASEAN Economic Community (AEC).
Concurrently, ASEAN members started to integrate themselves into the global economy, using
a dual-track approach of bilateral and ASEAN+1 trading agreements.1 Despite such efforts,
FTAs in the region have yet to fully support the market-driven integration that has taken place
through trade, foreign direct investment (FDI), production networks and supply chains.2 Of key
importance, multi-national corporations (MNCs) remained ignorant of FTAs, leading to low
utilisation rates of FTA preferences (Kawai and Wignaraja 2011; Hu 2013; World Bank 2013).
The low rates can be attributed to lack of information among businesses, low margins of
preference, the prevalence of non-tariff barriers and exclusion lists, and multiple rules of origin
(ROOs) – all of which have led to delays and high administrative costs.
1 While ASEAN has signed five FTAs with six of its dialogue partners - Australia-New Zealand, India, China, South Korea and Japan, individual ASEAN members are working on several bilateral FTAs with these dialogue partners, that are in different stages of completion (Singapore - 6, Malaysia – 5, Thailand – 5, Indonesia – 4, Vietnam – 2) (Asia Regional Integration Center, Asian Development Bank 2014). See also Table 1 in the Appendix. 2 For the last three decades, East Asian economies have undergone a market-driven integration through trade, FDI and the formation of production networks and supply chains. This form of economic integration needed further liberalization of trade and FDI, as well as the harmonization of policies, rules and standards. An increasing number of the region’s policy-makers believe that comprehensive FTAs can support the growth of trade and FDI through the elimination of cross-border impediments and the facilitation of trade and FDI. Thus, FTAs are viewed as part of a supporting policy framework for deepening market-driven integration led by the global multi-nationals (Kawai and Wignaraja 2013).

2
This has led policy-makers to embark on a new initiative of a region-wide FTA, named the
Regional Comprehensive Economic Partnership (RCEP) agreement. The RCEP is said to be
somewhat atypical and does not fall into the same category as other often-discussed bilateral
or plurilateral agreements. Rather, the RCEP signifies an unprecedented regional economic
cooperation arrangement among 16 predominantly developing countries and has implications
for regionalism and the World Trade Organisation (WTO), and for the balance of economic
power among the major trading blocs.3 The RCEP has the potential to harmonise rules and
regulations across the multiple and overlapping FTAs in the region, thereby serving as a
building block for the multilateral trading system. It also has the potential to create a new
paradigm for economic regionalism by forming the basis for a Free Trade Area of the Asia-
Pacific (FTAAP).4 However, if RCEP negotiations are not undertaken with a big vision in
mind, these potentials are unlikely to materialise. ASEAN, a leader in the negotiations, has
already mentioned that the RCEP includes a flexibility principle, which can either support or
hinder the negotiation process. In addition, statements such as “the agreement can be
accomplished in a sequential manner or single undertaking or through any other agreed
modality” and “the agreement shall provide for special and differential treatment to ASEAN
Member States” (ASEAN Secretariat 2011), are evidence of the grouping’s culture and its
unique style of decision-making process.5 The RCEP’s flexibility provision combined with the
‘ASEAN Way’ of decision-making have led many to believe that the RCEP will be another
loose and low-quality agreement in the region (Menon 2013). This may discourage many new
members, who strive to be part of good FTAs, from joining the grouping in the future.
3 Singapore, Brunei, Australia, Japan, New Zealand and South Korea are the developed countries in the grouping with high per-capita income. 4 Please see “Factsheet on the Regional Comprehensive Economic Partnership (RCEP)”. Available at: <http://www.fta.gov.sg/press_release%5CFACTSHEET%20ON%20RCEP_final.pdf> (accessed 6 August 2014). 5 The decision making process in ASEAN is termed as ‘ASEAN Way’ that involves musyawarah (discussion and consultation), mufakat (unanimous decision) and consensus (Hew 2007, p. 218).

3
In short, the RCEP has the potential to become an important agreement for the Asian region,
although there are also chances of pitfalls. This paper, hence, seeks to highlight what the RCEP
is, how it has emerged, and what negotiating issues may affect the agreement’s final quality.
This, in turn, will determine if it will serve as a new paradigm or a repackaged version of
ASEAN’s existing FTAs.
2. The RCEP- Idea, Genesis and Rationale
Idea
During the 19th ASEAN Summit in November 2011, a decision was reached to establish an
FTA involving sixteen countries – the ten ASEAN member countries, China, Japan, Korea,
India, Australia and New Zealand – under the framework of the RCEP. The objective of the
RCEP is to attain a comprehensive and mutually beneficial economic partnership agreement
that is WTO-consistent and transparent, and is expected to involve deeper engagement between
ASEAN and its FTA partners (and subsequently with other external economic partners)
(ASEAN Secretariat 2011). The broader economic ends of the RCEP are to widen members’
participation in regional and global production networks as well as minimise transaction costs
for businesses and inefficiencies created by multiple ASEAN-based trade agreements (Basu
Das 2013a).
During the November 2012 Summit, the Leaders of ASEAN+6 endorsed the guiding
principles, which lists eight negotiation areas - trade in goods, services, and investment,
economic and technical cooperation, intellectual property, competition, dispute settlement,

4
among others, and aims for significant improvements over the existing ASEAN+1 FTAs.6 The
document further mentions that it is open to “including other issues covered by FTAs among
RCEP participating countries . . . in the course of negotiations . . . ”.7 Therefore, the partnership
aims for significant improvements over the existing “ASEAN Plus” FTAs which have thus far
focused on the more traditional tenets of trade liberalization – increasing market access for
goods, services and investment (Scollay 2012; Sally 2013).
The leaders of the sixteen countries decided to launch the RCEP negotiations in May 2013 in
Brunei, with proposed end-date as the end of 2015.
Genesis
The genesis of the RCEP can be seen as a reaction to the debate on the East Asia Free Trade
Area (EAFTA), which is based on the ASEAN+3 formula (favoured by China), and the
Comprehensive Economic Partnership for East Asia (CEPEA), which is based on the East Asia
Summit (EAS) model (favoured by Japan) (Basu Das 2012).
As early as 2001, the East Asia Vision Group (EAVG) recommended the establishment of an
EAFTA to the leaders of ASEAN+3. This picked up steam in 2004 when ASEAN+3 Economic
Ministers decided to set up an expert group initiated by China to conduct a feasibility study.
The joint expert group, in 2006, recommended that the economic benefits from an EAFTA
would exceed those from the AFTA, any ASEAN+1 FTA, or other bilateral and sub-regional
6 Guiding Principles and Objectives for Negotiating the Regional Comprehensive Economic Partnership. Available at: http://www10.iadb.org/intal/intalcdi/PE/CM%202013/11581.pdf (accessed 10 June 2014). Currently, ASEAN has five FTAs with Australia-New Zealand (jointly known as Closer Economic Relation, CER), China, India, Japan and South Korea. 7 Guiding Principles and Objectives for Negotiating the Regional Comprehensive Economic Partnership. Available at: http://www10.iadb.org/intal/intalcdi/PE/CM%202013/11581.pdf (accessed 10 June 2014).

5
arrangements.8 The report recommended that an EAFTA should be comprehensive, high
standard and negotiated (and implemented) as a single undertaking. It recommended that an
EAFTA go beyond existing East Asian FTAs, and should be formed among ASEAN+3
countries first, and subsequently extended to other countries in the region. The group urged
East Asian leaders to start the process of forming an EAFTA soon. However, there was not
much action on the recommendations provided in the 2006 report. In 2009, against the
backdrop of 2008 global economic crisis and the rapid proliferation of FTAs among East Asian
countries, Korea conducted a Phase II EAFTA study. The study suggested that an EAFTA
would help enhance the resilience of the East Asian regional economy against external shocks
and sustain regional economic growth. It could also help overcome the problems caused by the
proliferation of FTAs with differing ROOs and overlapping agreements that have resulted in
an increase in transaction costs for intra-regional trade and a rise in production costs for
production networks in East Asia. It further recommended that an EAFTA should adopt a
gradual and realistic strategy and must begin with the consolidation of the three existing
ASEAN+1 FTAs. The report attached importance to concrete trade and investment facilitation
measures which could help all participating economies fully realize the benefits of an EAFTA.9
In the meantime, Japan proposed an alternative approach, the CEPEA, based on the earlier EAS
framework established in 2006. A study group was set up in 2007 to prepare a report of
recommendations for the ASEAN+6 Economic Ministers. The report, presented in 2008,
argued that a wider regional economic partnership that included India, Australia and New
8 Joint Expert Group for Feasibility Study on EAFTA. “Towards an East Asian FTA: Modality and Roadmap”, 22 July 2006. Available at <http://www.thaifta.com/thaifta/Portals/0/eafta_report.pdf> (accessed 13 June 2014). 9 Joint Expert Group on EAFTA Phase II Study. “Desirable and Feasible Option for an East Asia FTA”, 7 June 2009. Available at http://www.thaifta.com/thaifta/Portals/0/eafta_phase2.pdf (accessed 13 August 2014).

6
Zealand would create gains greater than any other regional FTA.10 The study set out CEPEA’s
objectives of deepening economic integration, narrowing development gaps, and achieving
sustainable development through the three pillars of economic cooperation, facilitation of trade
and investment, and liberalization of trade and investment, as well as institutional
developments.11
Following these studies, during the 4th EAS in October 2009, officials were tasked to consider
the recommendations of both the EAFTA and CEPEA studies. In August 2011, EAS Economic
Ministers welcomed a Chinese and Japanese joint “Initiative on Speeding up the Establishment
of EAFTA and CEPEA”. To end the debate, in November 2011, ASEAN proposed its own
model for an ASEAN-centric regional FTA - the RCEP (Figure 1).
Figure 1: Efforts under Various Frameworks
ASEAN+3 (EAFTA): ASEAN+ China,
Japan, Korea
RCEP ASEAN+6 (CEPEA): ASEAN+ China,
Japan, Korea, India, Australia, New
Zealand
10 According to the Global Trade Analysis Project (GTAP) model, the EAFTA would result in a 1.93 per cent increase of gross domestic product, while the CEPEA would result in a 2.05 per cent increase in gross domestic product (CEPEA Track Two Study Group 2009). 11 Track Two Study Group on Comprehensive Economic Partnership in East Asia (CEPEA). “Phase II Report of the Track Two Study Group on Comprehensive Economic Partnership in East Asia”, 3 July 2009. Available at https://www.dfat.gov.au/asean/eas/cepea-phase-2-report.pdf (accessed 26 August 2014).
7
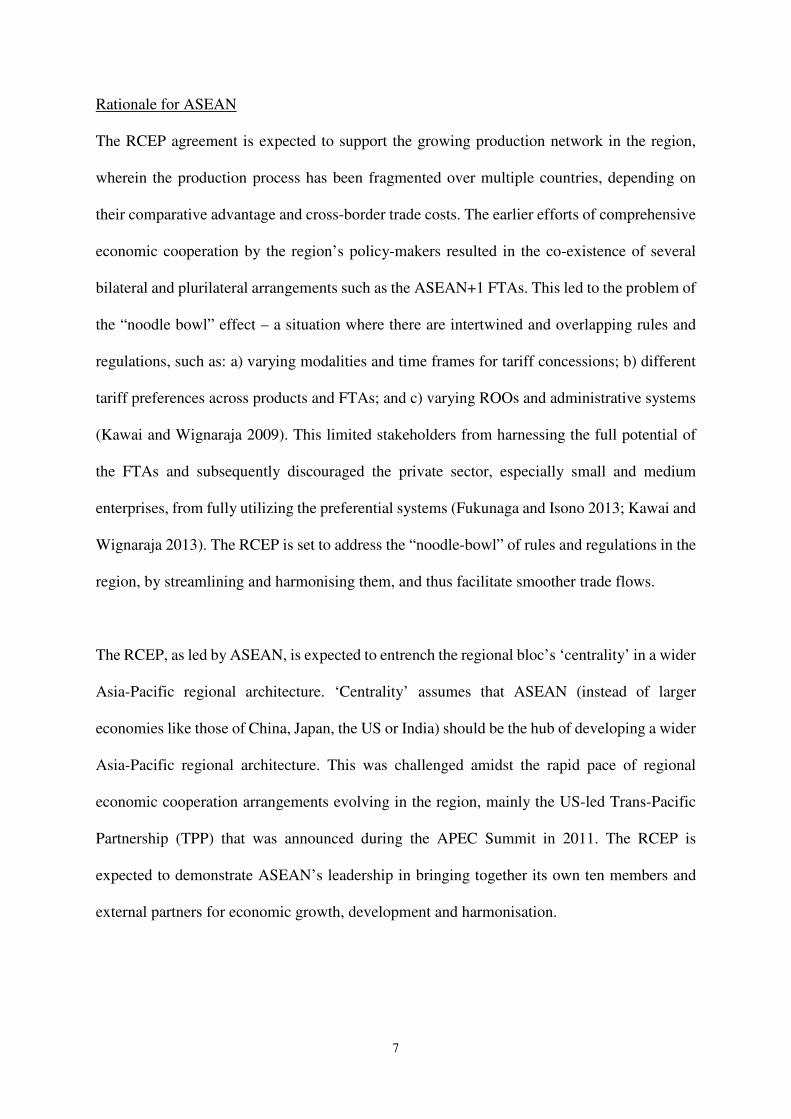
Rationale for ASEAN
The RCEP agreement is expected to support the growing production network in the region,
wherein the production process has been fragmented over multiple countries, depending on
their comparative advantage and cross-border trade costs. The earlier efforts of comprehensive
economic cooperation by the region’s policy-makers resulted in the co-existence of several
bilateral and plurilateral arrangements such as the ASEAN+1 FTAs. This led to the problem of
the “noodle bowl” effect – a situation where there are intertwined and overlapping rules and
regulations, such as: a) varying modalities and time frames for tariff concessions; b) different
tariff preferences across products and FTAs; and c) varying ROOs and administrative systems
(Kawai and Wignaraja 2009). This limited stakeholders from harnessing the full potential of
the FTAs and subsequently discouraged the private sector, especially small and medium
enterprises, from fully utilizing the preferential systems (Fukunaga and Isono 2013; Kawai and
Wignaraja 2013). The RCEP is set to address the “noodle-bowl” of rules and regulations in the
region, by streamlining and harmonising them, and thus facilitate smoother trade flows.
The RCEP, as led by ASEAN, is expected to entrench the regional bloc’s ‘centrality’ in a wider
Asia-Pacific regional architecture. ‘Centrality’ assumes that ASEAN (instead of larger
economies like those of China, Japan, the US or India) should be the hub of developing a wider
Asia-Pacific regional architecture. This was challenged amidst the rapid pace of regional
economic cooperation arrangements evolving in the region, mainly the US-led Trans-Pacific
Partnership (TPP) that was announced during the APEC Summit in 2011. The RCEP is
expected to demonstrate ASEAN’s leadership in bringing together its own ten members and
external partners for economic growth, development and harmonisation.

8
In general economic terms, if successfully negotiated by 2015, the RCEP member economies
are likely to generate a GDP of US$28 trillion (approximately 30 per cent of the world’s
economy), covering about 3.5 billion people (48 per cent of the global population). In 2012,
the RCEP grouping accounted for 28.4 per cent (US$10.5 trillion) of world trade, after APEC
at 48.5 per cent (US$17.1 trillion) and the E.U. at 33 per cent (US$11.7 trillion). The 12 TPP
countries that are currently negotiating the agreement accounted for 26 per cent (US$9.5
trillion) of world trade in 2012.
There are several studies that have examined and estimated the impact of the ASEAN++ FTAs
on Asian economies, as well as on the rest of the world using computable general equilibrium
(CGE) modelling. One such study by Kawai and Wignaraja illustrated the income effects of
the EAFTA and CEPEA on member countries and suggested two key results: (i) region-wide
agreements in East Asia prove to be beneficial among the economies of the member countries
in the presence of ASEAN+1 FTAs and (ii) the CEPEA (ASEAN+6) has higher income effects
on member economies than the EAFTA (ASEAN+3). More specifically, ASEAN members are
expected to derive the following projected gains (percentage change from 2017 baseline
income) under the CEPEA: Thailand (12.8 per cent); Vietnam (7.6 per cent); Malaysia (6.3 per
cent); Singapore (5.4 per cent); and below 3 per cent for the other ASEAN members (Kawai
and Wignaraja 2010). In terms of projected changes in output across sectors per economy,
Francois and Wignaraja (2008) showed that the manufacturing and services sectors of the
ASEAN members will most significantly benefit under the CEPEA scenario.
Moreover, Itakura (2013, cited in Fukunaga and Isono 2013) has estimated the potential impact
of various FTAs and the RCEP on member countries’ GDP. The estimates show that all of the
FTAs, in which the ASEAN member countries are participating, tend to raise welfare. Among
9
the FTA policy scenarios examined thus far,12 the RCEP (ASEAN+6 FTA) leads to the largest
positive impact on real GDP for almost all of the ASEAN member countries. This implies the
need for liberalization reforms to attract more investments and generate higher volumes of
international trade. Measures such as the lowering of barriers to trade, reducing or eliminating
import tariffs, improving custom administrative procedures, and improving transport and
logistics are important components of liberalization reforms.
The recent policy study by Petri and Plummer (2014) also suggests that while the income of
ASEAN countries is expected to go up by around 3 per cent under RCEP by 2025, it is likely
to go up by 1.7 per cent for India, 3.9 per cent for Korea, 1.8 per cent for Japan, 1.4 per cent
for China, 1.4 per cent for Australia and 0.9 per cent for New Zealand.
3. Implications of RCEP
Implications for ASEAN
If the leaders of the 16 countries succeed in completing the RCEP negotiations, developing it
as a basis for an Asia-Pacific Trade Agreement, such as an FTAAP, the RCEP would be a
major milestone. This is because Asian countries have been deliberating several models of
economic integration through the ASEAN+3 and ASEAN+6 for more than a decade. An
expanded RCEP could realise a new path of integration, where none of the big economies –
China, Japan or India – are the drivers, instead it will see ASEAN as a central player. Moreover,
in case the expanded RCEP becomes the basis for a future FTAAP, economic integration is
12 I.e., ASEAN; the coexistence of 5 ASEAN+1 FTAs; and the coexistence of 5 ASEAN+1 FTAs and the CJK FTA.
10
more likely to develop along the lines envisioned by the members of ASEAN than by members
of other models such as the Asia Pacific Economic Cooperation (APEC).13
ASEAN’s idea to initiate talks on the RCEP is, therefore, quite astute as it has the potential to
counter the pressure generated by the TPP, the US-led agreement launched as a “gold standard”
FTA in 2011. The grand promotion of the TPP by the US on the potential benefits and real
opportunity costs of trade liberalization seems to have cornered ASEAN states, sweeping away
the ASEAN-centred pattern of “plus” diplomacy that has underpinned Asian regionalism to
date (ASEAN+1, +3 or +6 and later +8). Moreover, it was felt that the US was not interested
in promoting regional trade integration with ASEAN countries as a group. While China, India,
Australia, New Zealand, Japan and Korea have enacted FTAs with ASEAN, and the EU has
been proposing an FTA with ASEAN as well, the US has not discussed the possibility of a US-
ASEAN FTA. Instead, the US opted for bilateral FTAs with Singapore in 2002 under the Bush
administration and other selected ASEAN countries under the framework of the TPP, more
recently. This reflected US interests in high-level FTAs with comprehensive coverage and its
views on the lack of preparedness of some ASEAN countries. Even the older forum, APEC,
which was supported by the US and connected it to Asia includes only seven ASEAN members
– Brunei, Indonesia, Malaysia, the Philippines, Singapore, Thailand and Vietnam.14 In contrast,
the RCEP showcases ASEAN’s principle of “all for one and one for all” as a key component
of its foreign economic relations.
13 Established in 1989, APEC is a forum committed to facilitating free and open trade and investment and comprises 21 member economies: Australia; Brunei Darussalam; Canada; Chile; China; Hong Kong; Indonesia; Japan; Korea; Malaysia; Mexico; New Zealand; Papua New Guinea; Peru; the Philippines; Russia; Singapore; Taiwan; Thailand; the US; and Vietnam. Its member economies account for approximately 40 per cent of the world’s population, 55 per cent of world GDP, and 44 per cent of world trade (APEC Secretariat 2014). 14 When APEC was established in 1989, ASEAN comprised of only six members – Indonesia, Malaysia, the Philippines, Singapore, Thailand and Brunei. Vietnam joined ASEAN in 1995, Laos and Myanmar in 1997 and Cambodia in 1999.

11
ASEAN’s decision to launch the RCEP negotiations is also very forward-looking. In the future,
if the RCEP negotiations and expansion are successful, then ASEAN, in consultation with the
big economic powers of Asia (like Japan, China, India), will be the agenda-setter with respect
to the scope and depth of a future FTAAP. In addition, if the RCEP agreement grows into an
FTAAP, then it could be a key component of the global economic order. At present, there are
three major economic blocs – the Americas, Europe and Asia – and none of them can be singled
out as being the most powerful (Ravenhill 2002). An Asia-led integration, like the RCEP, has
the potential to alter the balance into a two-bloc model, comprising the US (possibly via the
TPP) and the Asia-Pacific (this latter group could include states in Asia, Europe and Oceania).
This arrangement could have some joint members, including a number of ASEAN countries,
Australia, and most likely Japan (Findlay and Thangavelu 2013).
Furthermore, the RCEP agreement has the potential to multilateralize aspects of economic
regionalism (Menon 2013; Gupta 2014), and this could facilitate the creation of an FTAAP. In
other words, the complexity and inconsistency of regulations, and the “noodle bowl” effect
arising from different ROOs could be addressed if a handful of countries agree to harmonise
their commitments to which new countries may accede (Basu Das 2012; Findlay and
Thangavelu 2013). The RCEP, as led by ASEAN, has the potential to offer its policy of “open
regionalism” to the world, and, hence, can be viewed as a building block for the multilateral
trading system, rather than the stumbling block that most of the current FTAs present
(Bhagwati 2008).
Following ASEAN’s experience of gradual economic integration and its ability to draw in big
Asian economic powers – China, Japan, India and Korea – to participate in various economic

12
and security forums, the RCEP has the potential to create a new paradigm for regional trade
agreements. Rather than pursuing bilateral economic cooperation, wherein many initiatives
apply not just to the two participating countries, but to the rest of the world too,15 the RCEP
would bring together multiple countries from both nearby and distant regions. The RCEP, in
its guiding principles, has already laid out its objectives: “to achieve a modern, comprehensive,
high-quality and mutually beneficial economic partnership agreement”, explicitly stating its
intention to deliver a better agreement compared to the existing ones. If the RCEP is negotiated
based on these terms, it is possible that the agreement could lead to an FTAAP in the future.
Implications for the WTO
If RCEP membership expands further, capturing a significant proportion of Asia-Pacific GDP
and trade, it may help to facilitate negotiations for the WTO. Being a comprehensive agreement
that is WTO-consistent, the RCEP can complement WTO negotiations. In addition, the
countries that are not yet members of RCEP or other major trade agreements such as the TPP
or APEC, may subsequently see more reasons to reinvigorate WTO issues. Nevertheless, the
nature of the impact of the RCEP on the WTO could also be negative as participating countries
may realize that it is easier to reach a decision within RCEP, which has a handful of countries
compared to the WTO, which has 160 member economies. Also, as the RCEP deals with
agendas that are not yet covered under the WTO (such as investment rules), it may undermine
the global multilateral process.
15 Initiatives like harmonization of customs rules and regulations or facilitation measures are not meant for two participating countries in a bilateral agreement, but for multiple countries.

13
4. Challenges to the RCEP Negotiations
Although the RCEP negotiations had a good start, it is evident that the negotiations will not be
a smooth process, but one that will face several economic and political obstacles16. As a
regional economic integration arrangement among predominantly developing countries, the
RCEP is the first of its kind and has no precedent to emulate. It involves three different
dynamics among its sixteen participating members: (i) the ten ASEAN members; (ii) ASEAN
and its FTA partners; and (iii) the six FTA partners. While the ten members of ASEAN have
pledged to work on economic integration since the 1990s, ASEAN and its member countries
have been working with the FTA partners since 2000. It is the six FTA partners that may not
have existing comprehensive trade agreements with one another (Appendix 1).
Moreover, political factors such as historical conflicts and unsettled territorial disputes will
continue to underline the difficulties of negotiations among the three Northeast Asian countries.
Similarly, although India has been viewed as a rising economic power, its position in multi-
party trade negotiations remains rather conservative. It has been branded a hardliner with a
‘defensive strategy’ (Ramdasi 2010). Hence, the current 2015 deadline for completing the
RCEP negotiations looks too optimistic (Xin 2011). Even upon completion, the RCEP is likely
to face several procedural hurdles that will need to be addressed before its member countries
can carry on with domestic implementation. Therefore, RCEP expansion is far from guaranteed
and so is the formation of an FTAAP. That said, this paper sets out some of the challenges that
RCEP may face while negotiating the agreement process and thereafter. It first discusses two
sticky issues – agriculture and services sector liberalization – that have always been difficult
to negotiate in a trade agreement, followed by discussions on the development gap among the
16 New Zealand Ministry of Foreign Affairs and Trade, Regional Comprehensive Economic Partnership (http://www.mfat.govt.nz/Trade-and-Economic-Relations/2-Trade-Relationships-and-Agreements/RCEP/; accessed on 14 November 2014)

14
member economies and the basis for the RCEP agreement, i.e., what could be a base or template
from where negotiations on the granting of additional market access can be discussed by
members.
Sticky Issues for Negotiation
In most FTA negotiations, issues related to coverage pose a substantive challenge. While all
participating members agree with the benefits of market access liberalization measures, they
also face domestic pressure to limit competition in their home markets (Chandra 2008; Milner
1997). While the RCEP comprises a country like Singapore, which is relatively unique and is
the least concerned with liberalization, at least with respect to trade in goods, it also includes
countries like Indonesia and India, which are likely to make market access negotiations
difficult. Accordingly, there will be a number of potential sticking points during negotiations.
This section briefly discusses two such issues: agriculture and services sector liberalization.
a) Agriculture Sector Agriculture has always been a protected sector in most economies and promoting
comprehensive coverage of agricultural trade is a key challenge, especially for an East Asian
FTA (Kawai and Wignaraja 2013). For ASEAN countries, as the sector employs more than a
third of its workforce, protecting agricultural employment is a key factor during negotiations
of trade liberalisation. (Appendix 2). More importantly, in the case of less developed
economies like Cambodia, Laos and Myanmar, the agriculture sector contributes substantially
to their GDP. In 2012, shares of agriculture in GDP in Cambodia and Laos were 35.6 per cent
and 28 per cent respectively.17 While ASEAN countries initially excluded unprocessed
17 2006 figures for Myanmar indicate that its share of agriculture in GDP was more than 40 per cent that year.
15
agricultural products from trade liberalization, a majority of agricultural commodities are now
included in ASEAN’s own liberalization measures.
In Japan’s case, although it recognizes FTAs as one of its key trade policy options, it is
unwilling to liberalize agricultural products due to its domestic farm policies. The country has
always remained sensitive and firmly committed to protecting five ‘sacred’ farm products –
rice, wheat, beef and poultry, dairy products and sugar (Banno 2014). It has one of the world’s
highest tariffs of 777.7 per cent on imported polished rice. Although Japan signed bilateral
FTAs with Singapore in 2002, Mexico in 2005, it did not open up much in the area of
agriculture trade liberalization (Urata 2005). Its FTA negotiations with Korea, which
commenced in 2003, could not be concluded as one of the major concerns was trade in
agricultural products.
The agriculture sector is also protected in Korea with low market orientation. According to a
WTO trade policy study in 2004, Korea’s net agricultural support exceeded the sector’s GDP
contribution of 3.6 per cent in 2003, and was among the highest in the OECD. Its average
Producer Support Estimate (PSE) for agriculture was 60 per cent in 2003, and was highest at
74 per cent for rice and 89 per cent for oilseeds.18 The protectionist nature of the Korean
agriculture sector is also reflected in its bilateral FTAs. With the ASEAN-Korea FTA, Korea
had managed to exempt 45 highly sensitive agricultural and marine products (rice, beef,
poultry, garlic, onion, red pepper, most fruits, and certain frozen and live fish items) from
liberalization.
18 Producer support estimate (PSE) is a measure of domestic support. It is an indicator of the annual monetary value of gross transfers from consumers and taxpayers to agricultural producers, measured at the farm gate, arising from policy measures that support agriculture, regardless of their nature, objectives or impacts on farm production or income.

16
India has a ‘defensive’ stance on agriculture (Ramdasi 2010). It is an important sector for the
economy mainly in terms of employment, GDP and food security. It employs more than 40 per
cent of the work force and contributes about 18 per cent of the country’s GDP. In terms of
international trade, it remains a marginal player.19 India is one of the most protected markets
for agricultural products in the developing world, with final bound duties going up to 300 per
cent for oilseeds, fats and oil, and 150 per cent for several unprocessed agricultural products.
India’s position on its agriculture sector at trade negotiations emanates from the necessity to
safeguard the livelihood of its large number of poor farmers. It took seven long years for the
ASEAN-India FTA (AIFTA) to conclude negotiations on trade in goods, mostly due to
pressure from Indian producers of oilseeds and plantation crops who feared competition.
Therefore, sensitivities relating to the agriculture sector among key RCEP members cast doubts
on just how much of the agriculture sector will be committed for liberalization.
b) Services Sector A second issue that may prove difficult to negotiate is facilitating services trade liberalization.
This sector accounts for a significant share in both a country’s output and employment
(Appendix 3), and this shows its importance in growth rates and employment creation. Despite
that, its unique multifaceted and intangible nature makes it very difficult to track and measure
its cross-border movements. This puts trade in services in direct contrast to trade in goods,
which is easier to define, track and measure.
The 1994 General Agreement on Trade in Services (GATS) has identified four modes of
supply: cross-border trade; consumption abroad; commercial presence; and the movement of
19 India has a share of less than 2 per cent of world trade in agriculture (FAOSTAT).

17
suppliers.20 While the first two modes are quite close to the conventional notion of ‘trade’, and
the flows of services can be measured to a certain extent in balance of payment statistics, the
last two modes are the ones that create complications. Trade statistics in the provision of
services are difficult to capture with respect to commercial presence and the movement of
suppliers, and both these modes account for a large part of services trade. Nevertheless, trade
agreements, including the ones in Asia, have broadly followed the definitions and terminology
of the GATS. The negotiations take into account of all of the modes of supply, and schedules
of commitments usually list restrictions according to all modes.
ASEAN has emphasized services sector liberalization through the ASEAN Framework
Agreement of Services (AFAS), which was initiated in 1995. Thereafter, the ASEAN
Economic Community (AEC) built on the AFAS and identified five services sectors (air travel,
e-ASEAN, healthcare, tourism and logistics) that are likely to undergo full integration by 2015.
In addition to these, ASEAN members have undertaken separate negotiations on financial
services and air transport. Services have also been included in the FTAs with ASEAN’s
dialogue partners – all of which have been concluded, except for the FTA with Japan.
However, for more than 15 years, negotiations under the AFAS resulted only in marginal
liberalization (Nikomborirak and Jitdumrong 2013). As Corbett (2008) notes: “The broad
conclusion here is that AFAS is not particularly liberalizing compared with GATS
commitments (Stephenson and Nikomborirak 2002; Vo and Bartlett 2006; Roy et al. 2006;
Fink and Molinuevo 2007) and that most regional PTAs do not add significant new liberalizing
20 Cross-border trade is said to take place when neither producer nor consumer move and the service itself is traded (e.g. business or financial services provided by mail or telephone). Consumption abroad occurs when consumers move to the location of the service, such as tourism. Commercial presence: when producers enter in a host country via a long-term presence (mode 3, commercial presence). Movement of suppliers: when producers enter a host country by a shorter-term movement of people (e.g. a foreign IT-expert travelling to a site to implement its technology plan).

18
elements over GATS (Ochiai et al. 2007). Since AFAS does not go much beyond the GATS it
is, therefore, not providing much impetus to liberalizing services trade within ASEAN.”
In order to expedite the liberalization of services trade, ASEAN has adopted the ‘ASEAN
minus X’ formula that allows members who are prepared to embark on cooperative initiatives
at a pace faster than the rest of the grouping. While this may speed up some degree of
liberalization, it also risks slowing down the liberalization process by removing the pressure
on slower moving members. In addition, this is far from an MFN approach and may make it
more difficult to extend a liberalized treatment to non-ASEAN countries. This raises concerns
about the type of approach that will eventually be adopted by the RCEP.
In the case of regional FTAs such as the AEC, services sector liberalization is hampered by
several political (e.g. legal/constitutional) and economic barriers (Llanto and Ortiz 2013).
Progress is limited by liberalization bottlenecks in foreign equity participation in local
businesses,21 restrictions on landholding22 and sensitivities in relaxing restrictions on the
movement of professionals across states.23 Moreover, in areas where an agreement has been
21 The AEC Blueprint talks about 70 per cent of ASEAN equity share under liberalization in mode 3 (commercial presence). Sector-wise, most of the ASEAN member countries have complied with foreign equity ownership in hotel and lodging services (under tourism industry). However, certain members like Cambodia, Indonesia, the Philippines and Thailand impose stringent foreign share participation for non-luxury hotels in order to protect small local providers. Also, certain members impose restrictive foreign equity participation for restaurant services, which are tied to the hotel and lodging services. Under e-ASEAN, the liberalization of ICT services and investment is most challenging as it requires member countries’ to change their foreign investment rule. Many ASEAN member states restrict foreign equity participation in their telecommunication sectors to a minority share. Only Singapore (highly competitive telecom market), Laos, Cambodia, and Myanmar, allow wholly foreign owned operations. Again, state enterprises dominate ccertain member countries (the main telecom services providers in Vietnam are all state enterprises - Viettel, the Military Electronic Telecommunications Company, the Hanoi Telecom, the Vietnam Shipping Telecommunication Company (VISHIPEL), the Saigon Post and Telecom (SPT) and the Electricity Telecommunication Company (ETC). 22 Among ASEAN countries, Brunei, Laos, Myanmar, Philippines, Singapore, Thailand and Vietnam, impose restrictions on foreigners owning land. Foreigners often resort to leasing land for a maximum period of time permitted by law which varies across countries. 23 For example, ASEAN members have concluded MRAs in seven professionals - engineering and architecture, nursing, accountancy and surveying, medical and dental professionals – but it will not
19
reached, domestic rules and regulations tend to hinder actual implementation (Nikomborirak
and Jitdumrong 2013).
As services sector liberalization (in the case of both ASEAN and the ASEAN+ partners) is still
undergoing negotiations, it is difficult to say anything with certainty on the depth of integration
at this stage. Indeed, as was discussed above, despite negotiating FTAs since late 1990s (among
ASEAN members) and since the early 2000s (between ASEAN and its FTA partners), sticking
points over foreign ownership or the movement of labour, for example, remain unresolved.
These unresolved issues may have repercussions on the RCEP negotiations.
Development Gaps
A major challenge for the RCEP is the difference in the development stages of its participating
countries (Tables 1 and 2). These differences are manifested not only in terms of differences
in GDP per capita, but also differences in human development indicators such as life
expectancy, literacy, public expenditure in health and education, and poverty. In terms of per
capita income, the difference is particularly pronounced between less developed ASEAN
member countries and mature economies like Korea, Australia, Singapore, New Zealand and
Japan. Vo (2005) has raised concerns that any kind of deeper economic integration could lead
to huge social costs incurred by the less developed economies of ASEAN. This could be due
to structural adjustments and the risks of falling into a low-cost labour trap, where there is little
incentive for domestic industries to move up the value chain. Hence, due consideration and
appropriate resources should be allocated to these economies. Although there is a flexibility
clause built into the RCEP framework to take into account development differences, the clause
result in unrestricted flows as domestic rules and regulations would still apply. Moreover, it is only the engineering and architecture that talks about recognition of registered ASEAN professional, rest are broad principles and framework agreements for negotiating bilateral and multilateral agreements.

20
could turn out to be a boon or bane for the RCEP (Menon 2013). While it could help break
deadlocks and protect disparate national interests, it could also limit change or curtail progress
in achieving greater liberalization.
Table 1: Varying Levels of Development
Low Income Economies (US$1,025
or less)
Lower Middle-Income Economies
(US$1,026-US$4,035)
Upper Middle Income Economies (US$4,036- US$12,475)
High Income Economies
(US$12,476 and more)
Cambodia and Myanmar
Indonesia, India, Laos, Philippines, Vietnam
China, Malaysia, Thailand
Australia, Brunei, Japan, Korea, Rep., New Zealand, Singapore
Note: Economies are divided among income groups according to 2011 gross national income (GNI) per capita
Source: Author’s compilation from World Bank (country classification data)
Table 2: Human Development Indicators and Incidence of Poverty among RCEP
Members
Economy HDI
(Rank) Life Expectancy at birth (years) (2013)
Adult Literacy rate (% age 15 & above) (2012)
Public Expenditure on Health (% of GDP) (2012)
Public Expenditure on Education (% of GDP) (2012)
Population in Poverty (national Poverty Line, in percentage)
Proportion of Population below US$1 (PPP) a day (in %)
Bru 30 78.5 95.4 2.1 3.3 ..
Cam 136 71.9 73.9 1.3 2.6 .. 18.6(b)
Indon 108 70.8 92.8 1.2 2.8 12 16.2(d)
Lao 139 68.3 72.7 1.5 3.3 .. 33.9(a)
Mal 62 75 93.1 2.2 5.1 1.7
Mya 150 65.2 92.7 0.4 0.8 ..
Php 117 68.7 95.4 1.7 2.7 25.2 18.4(b)
Sing 9 82.3 95.9 1.7 3.3 ..
Th 89 74.4 93.5 3.0 5.8 .. 0.4 (c)
Viet 121 75.9 93.4 2.8 6.6 17.2 16.9 (a)
Aus 2 82.5 6.1 5.1 ..
NZ 7 81.1 8.5 7.2 ..
China 91 75.3 95.1 3.0 .. 11.8 (b)
India 135 66.4 62.8 1.3 3.3 21.9 32.7 (c)
Japan 17 83.6 8.3 3.8 ..
Korea 15 81.5 4.1 5 .. Note: a – data in 2008; b – data in 2009; c – data in 2010; d – data in 2011 Source: UNDP Human Development Report 2014 and World Development Indicators

21
One of the reasons for initiating the RCEP agreement was to address ‘behind the border’
measures for cross-border trade and investment, and to strengthen regulatory reforms. These
are important issues for the private sector, as these are the factors that have restricted the private
sector from taking opportunities by trade and investment liberalization measures, thereby
constraining their utilisation of FTAs. However the sixteen partners currently vary in terms of
their competitiveness. According to the World Bank’s Doing Business Index (Appendix 4),
members are on various platforms – while Singapore, New Zealand and Malaysia occupy the
1st, 3rd and 6th positions respectively, Cambodia, Laos and Myanmar occupy the 137th, 159th
and 182nd positions. Although the RCEP has the ability to bridge these wide gaps, fundamental
economic reforms will be required, especially for developing member countries. It would be
interesting to see how the participating RCEP members arrive at a decision on these issues, as
failure to do so will limit the realization of benefits arising from a promised comprehensive
agreement.
Issue of Negotiating Architecture
A key issue for RCEP negotiations is whether the agreement ought to be modelled as leading
to an FTAAP24 in the future, or whether it ought to be structured based on one of the ASEAN+1
FTAs, most probably the lowest quality one. If it is the latter, it would have fewer chances of
transforming into a larger region-wide agreement. A quick comparison of the key provisions
of each “+1” FTA will reveal that the ASEAN-Australia-New Zealand FTA (AANZFTA) and
the ASEAN-China (ACFTA) are respectively the best and second best agreements. This is not
only in terms of provisions but also with reference to the degree of tariff elimination rates and
24 Free Trade Area of the Asia-Pacific (FTAAP) is expected to be comprehensive and high-quality in nature and is expected to harmonise rules of integration of small-scale FTAs in the region. It was first discussed under the APEC framework. In the last two years, RCEP and TPP are seen as pathways for a future FTAAP.
22
the rules of origin. This section discusses some of the key components of, and challenges in,
the current ASEAN+1 FTAs, namely tariffs, ROOs, and services, and is based on existing
studies by Medalla (2011), Kawai and Wignaraja (2013), Fukunaga and Isono (2013), Sally
(2013) and Basu Das (2013). It also draws from the existing framework and legal text of the
agreements that have been ratified and implemented by the members concerned.
First, the five FTAs have been signed in different time periods, starting from the early 1990s
up till just recently (Table 3). Negotiations are still taking place for the ASEAN-Japan
Comprehensive Economic Partnership (AJCEP) for services and investment agreements. It
should be noted that there are differences in the way these FTAs are negotiated -- while China
has negotiated its FTA with ASEAN as a group (other than its only bilateral FTA with
Singapore), Japan places more emphasis on bilateral linkages, concluding 7 bilateral FTAs with
ASEAN members and subsequently combining the bilateral ones for a regional ASEAN-Japan
FTA. The provisions under each of these agreements also differ at this stage, although all the
FTAs are broad agreements with many WTO-Plus elements (Table 4).25 Also within the broad
categories of, say trade in goods, provisions vary across the agreements. For example, while
technical barriers to trade are mentioned in agreements with the three North-eastern partners,
this topic is not included in the AIFTA and AANZFTA. Similarly, customs administrations
and procedures are only mentioned in the AANZFTA and AIFTA.
25 WTO Plus is the difference between commitments under FTAs and those under the GATS, meaning ‘additions’ to the WTO.

23
Table 3: ASEAN and ASEAN+1 FTAs
Plus one Partner
Nature of Agreement
Framework Agreement Signed/ Negotiation Completed and Signed
Status of Agreement, Dec 2013
ASEAN-10 Comprehensive 1992 Agreement in force, 1993
Australia-New Zealand
Comprehensive 2009 Agreement in force; January 2010 (G, S, I)
China Comprehensive 2002/ 2004 Agreement in force; July 2005 (G), July 2007 (S) and Feb 2010 (I)
India Comprehensive 2004 / 2009 Agreement in force; Jan 2010 (G)
Japan Comprehensive 2005/2008 Agreement in force; Dec 2008 (G)
Korea Comprehensive 2004/ 2006 Agreement in force; Jun 2007 (G), May 2009 (S) and Sept 2009 (I)
Source: compiled by author from International Enterprise Singapore website (www.fta.gov.sg)
Notes: The nature of agreement is dependent on the stated objectives while being proposed. Comprehensive
Agreement: Implies an agreement involving broader economic cooperation, trade in goods, and non-trade issues,
and trade in services and investments.
G: Goods, S: Services and I: Investment
Table 4: Key Provisions in ASEAN and ASEAN+1 FTAs, Dec 2013
Chapters Included
AFTA AANZFTA ACFTA AIFTA AJCEP AKFTA
Trade in Goods
√ √ √ √ √ √
Trade in Services
√ √ √ x x √
Investment √ √ √ x x √
Movement of Business Person
√ √ x x x x
Dispute Settlement
√ √ √ √ √ √
Intellectual Property
√ √ x x x x
Source: compiled by author from Singapore FTA website (www.fta.gov.sg) Note: √ implies chapter is already included in the EPA. x implies chapter is not yet included in the agreement.

24
Secondly, tariff elimination rates and the coverage of goods differ significantly across the 5
ASEAN+1 FTAs. The AANZFTA agreement agreed to eliminate 90 per cent of tariffs as soon
as it went into effect in 2010, and an additional 6 per cent, mostly covering agricultural
commodities, are to be eliminated by 2020. The rest of the commodities are excluded. While
collectively, Australia and New Zealand have provided long transition periods for textiles,
clothing and leather goods, Australia alone has excluded cars and car parts, and Indonesia has
excluded sugar. Dairy products get a transition period of ten years under the AANZFTA.
Cambodia, Laos, Myanmar and Indonesia have transition periods up to 2025.
For the ACFTA, the participating countries are committed to reducing or eliminating tariffs
under 5 different schedules. The Early Harvest Programme (EHP) allowed for the accelerated
reduction of tariffs on certain products before the onset of the FTA. The programme reduced
tariffs on these products over three years to: 10 per cent by 2004; 5 per cent by 2005; and zero
tariffs by 2006. The bulk of tariff eliminations between China and the ASEAN-6 members was
completed by 2010, with the ASEAN-4 members complying by 2015 (Normal Track One). A
second track eliminates some tariffs by 2012 (Normal Track Two). The two tracks together
with the EHP cover 90 per cent of tariff lines. There is also a Sensitive Track that divides
products under ‘sensitive’ and ‘highly sensitive’ lists and stipulates that China and the ASEAN-
6 countries reduce their tariffs to 0-5 per cent by 2018, followed by ASEAN-4 members by
2020.
In the case of the AIFTA, 80 per cent of Indian tariffs are subject to tariff elimination, although
the rate is higher for ASEAN. The AIFTA has 6 nomenclatures for tariff reduction or
elimination. First, under Normal Track One, India and the ASEAN-5 countries – Singapore,
Malaysia, Thailand, Brunei and Indonesia – have promised to eliminate tariffs by 2013. Under
the same track, India and the Philippines get an extended schedule till 2016 and Cambodia,
Laos, Vietnam and Myanmar (also ASEAN-4) get until 2018 to comply. Second, the Normal
25
Track Two stipulates that India and the ASEAN-5 have until 2016 to eliminate tariffs, while
India and the Philippines, and India and the ASEAN-4 have until 2019 and 2021, respectively,
to comply. Third, the Sensitive Track brings down 10 per cent of tariffs to a maximum of 5 per
cent by 2016 for India and the ASEAN-5, while extending the time period to 2019 for India
and the Philippines and 2021 for India and the ASEAN-4 members. Fourth, the Highly
Sensitive List reduces tariffs to 25 per cent or 50 per cent for India, Malaysia, Thailand, the
Philippines, Cambodia and Vietnam. Fifth, the list of Special Products, covering palm oil and
pepper, are subject to tariff reductions but with very high caps. Finally, an Exclusion List
contains about 10 per cent of Indian agricultural products.
The AJCEP eliminates tariffs on 93 per cent of imports for Japan and ASEAN-6 countries
within the first ten years of the agreement’s effectiveness. The ASEAN-4 countries have
flexibility for additional 5-8 years to comply. Although most of the tariff elimination of Japan
and ASEAN-6 countries follows the CEPT rates or maximum tariff of five percent by 2010,
some tariffs have transition periods of 6-16 years. The agriculture sector is excluded to a great
extent or is only subject to tariff reduction over a long period or subject to tariff-rate quotas
(TRQs). As AJCEP is an agglomeration of Japan’s bilateral FTAs with ASEAN countries, the
tariff schedule and transition period varies according to participating countries.
The AKFTA eliminates around 90 per cent of tariff lines for Korea and ASEAN-6 countries
by 2010. The agreement has a ‘Sensitive List’, under which tariffs have to come down to 0-5
percent by 2016; and a ‘Highly Sensitive List’ that has five tariff groups with tariff caps up to
50 percent, TRQs and excluded products. As for the ASEAN-4 countries, they were given until
2016-18 for the bulk of their tariff elimination, with an extra 5 per cent of tariffs to be
eliminated by 2018-2020.

26
The difference in tariff reduction and coverage of goods across the ASEAN+1 FTAs makes it
an important consideration for RCEP negotiations. Table 5 below shows comprehensively the
tariff elimination target years under ASEAN+1 FTAs.
Table 5: Tariff Elimination Target Years under the ASEAN+1 FTAs26
ASEAN 6 CLMV Countries FTA Partners
Elimination (Normal Track or
SL)
Other Reduction
(SL or HSL)
Elimination (Normal Track or
SL)
Other Reduction
(SL or HSL)
Elimination (Normal Track or
SL)
Other Reduction
(SL or HSL)
AANZFTA 2020-2025 2020-2025
2020-2024 2025 2020 --
ACFTA 20121 2018 20181 2018 20121 2018
AIFTA 2017-20203 2017-2020
20223 2022 20173
(20204) 2020
AJFTA 2018 2018-2024
2023-2026 2026 2018 2018
AKFTA 20125
(20176) 2016 2018-20205 2021-
2024 2010 2016
Notes: 1 Including Normal Track 2. Normal Track 1 for ASEAN6 and China has completed in 2010.
2 In AIFTA, each year corresponds to 31 December of the previous year. For example, 2014 means 31 December
2013.
3 Including Normal Track 2.
4 To the Philippines.
5 Including Normal Track 2. Normal Track 1 for ASEAN5 has completed in 2010.
6 Thailand
Source: Fukunaga and Isono 2013.
Third, with regard to the rules of origin (ROO), there are four major methods of origin
determination used in the various ASEAN+1 FTAs: Wholly obtained or produced (WO);
Regional Value Content (RVC); Change in Tariff Classification (CTC); and Specific Process
Rule (SPR). Product specific rules (PSRs) are attached as Annexes. All FTAs provide a general
rule in the main text of the agreement (i.e., the applicable ROO), other than anything specified
26 Columns for “Elimination” show the target years for tariff elimination to reach the elimination coverage ratios summarized in Table 2
27
in the Annex (like the Product Specific Rule, which could be a co-equal rule, combination, or
variation of the different methods of determining origin). In most of the ASEAN FTAs, the
ROO involves a combination of criteria (Table 6).
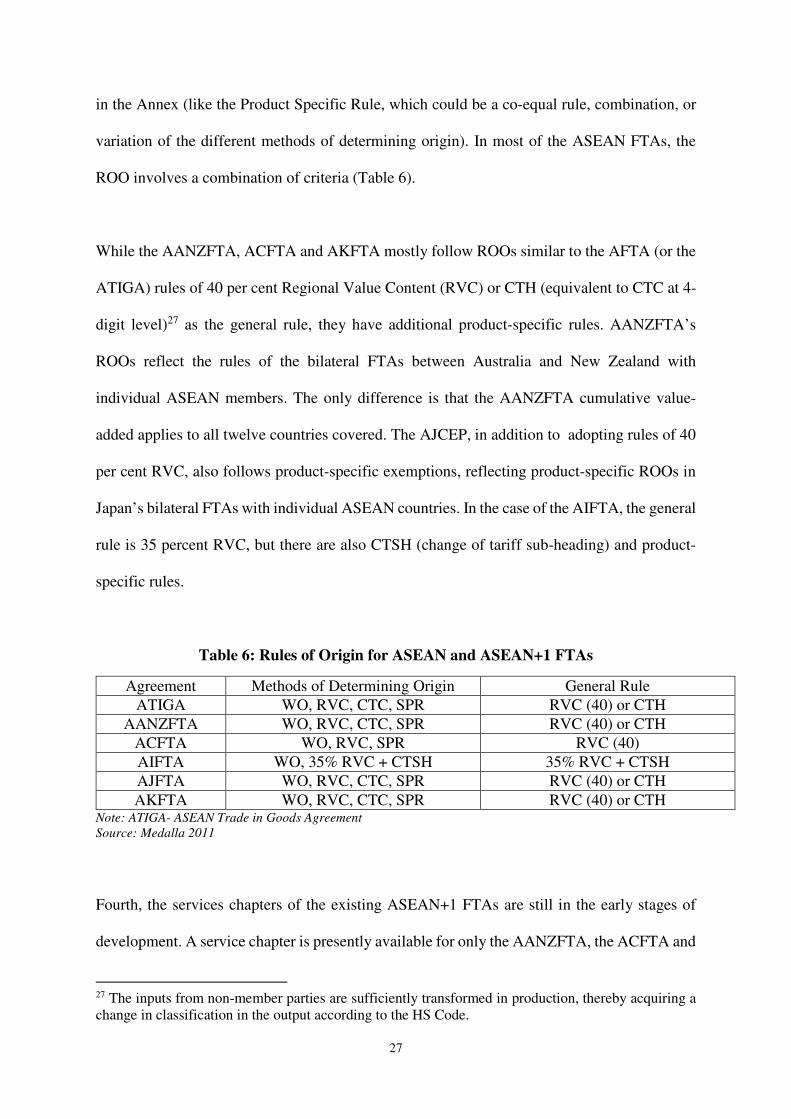
While the AANZFTA, ACFTA and AKFTA mostly follow ROOs similar to the AFTA (or the
ATIGA) rules of 40 per cent Regional Value Content (RVC) or CTH (equivalent to CTC at 4-
digit level)27 as the general rule, they have additional product-specific rules. AANZFTA’s
ROOs reflect the rules of the bilateral FTAs between Australia and New Zealand with
individual ASEAN members. The only difference is that the AANZFTA cumulative value-
added applies to all twelve countries covered. The AJCEP, in addition to adopting rules of 40
per cent RVC, also follows product-specific exemptions, reflecting product-specific ROOs in
Japan’s bilateral FTAs with individual ASEAN countries. In the case of the AIFTA, the general
rule is 35 percent RVC, but there are also CTSH (change of tariff sub-heading) and product-
specific rules.
Table 6: Rules of Origin for ASEAN and ASEAN+1 FTAs
Agreement Methods of Determining Origin General Rule
ATIGA WO, RVC, CTC, SPR RVC (40) or CTH
AANZFTA WO, RVC, CTC, SPR RVC (40) or CTH
ACFTA WO, RVC, SPR RVC (40)
AIFTA WO, 35% RVC + CTSH 35% RVC + CTSH
AJFTA WO, RVC, CTC, SPR RVC (40) or CTH
AKFTA WO, RVC, CTC, SPR RVC (40) or CTH Note: ATIGA- ASEAN Trade in Goods Agreement
Source: Medalla 2011
Fourth, the services chapters of the existing ASEAN+1 FTAs are still in the early stages of
development. A service chapter is presently available for only the AANZFTA, the ACFTA and
27 The inputs from non-member parties are sufficiently transformed in production, thereby acquiring a change in classification in the output according to the HS Code.
28
the AKFTA. The services sector adopts WTO’s GATS-style reporting. Looking individually,
in the case of the AANZFTA, the services sector agreement is negotiated based on a positive
list approach, with financial and telecommunications services included as annexures. While
there are some GATS-plus commitments by a few ASEAN members on education, finance and
telecom services, they do not entail substantial new liberalization. The AANZFTA has modest
WTO-plus commitments on the movement of business persons through a provision for business
visas. In contrast to the AANZFTA, most of the other services sector agreements that are
concluded under the ASEAN+1 framework like the ACFTA and AKFTA are limited in scope
and have limitations in terms of movement of natural persons or participation of foreign capital,
implying that they have yet to go beyond the GATS provisions.
Fifth, investment liberalization in the 3 ASEAN +1 agreements (AANZFTA, ACFTA and
AKFTA have completed the agreement) have stated objectives of promoting investments and
to creating a liberal, facilitative, transparent and competitive investment regime. In general,
they have agreed to: a) enter into negotiations to gradually liberalise the investment regime; b)
strengthen cooperation in investment, facilitate investment and improve transparency of
investment rules and regulations; and c) provide for the protection of investments. This way
the focus is not just liberalization, but also facilitation. Though the investment chapter of the
AANZFTA has some post-establishment disciplines and investor-state dispute settlement, it is
more of an investor protection agreement, rather than an investment liberalization agreement
for now. The ACFTA and AKFTA also do not address the issue of investment liberalization
but focus on facilitation.
Lastly, with regard to other areas of economic cooperation, issues like Mutual Recognition
Arrangements (MRAs), government procurement, intellectual property and movement of

29
business persons are not yet covered uniformly in these agreements. Nonetheless, each
ASEAN+1 FTA goes beyond liberalization in trade in goods, services and investments. The
ACFTA lists five priority sectors and infrastructure projects, such as the Mekong River Basin
and the Singapore-Kunming Rail Project. The AANZFTA includes provisions on negotiating
future sectoral MRAs and for cooperation on sanitary and phytosanitary issues (SPS). General
principles and cooperative mechanisms are outlined on competition rules. The agreement also
contains chapters on e-commerce and intellectual-property provisions, including copyrights
and transparency. The AJCEP agreement mentions cooperation mechanisms for SPS and
technical barriers to trade (TBT).
Based on the above comparative analysis, a key challenge for RCEP negotiations is agreeing
to a common base or template, from where negotiations on the granting of additional market
access can be discussed by the members. There are chances that governments may continue to
succumb to domestic pressures and may seek significant exclusions from a path-breaking
agreement especially as the RCEP members have agreed on multilateralising and following a
‘single undertaking’28 approach. In addition to these issues, the RCEP is yet to garner key
domestic support, which is a key factor during ratifying and implementing the agreement.
Often, the private sector complains about a lack of information and almost no consultation on
FTAs. One should note that the RCEP was announced at a time when the private sector was
struggling to understand other agendas such as the AEC 2015 and the existing bilateral FTAs.
Experience from the ASEAN-China FTA that came in force in 201029 leads to assertions that
FTA-type engagements are still viewed as threats by the private sector.
28 Single undertaking – virtually every item of the negotiation is part of a whole and indivisible package and cannot be agreed separately. The other approach is sequential – a leading country decides whether to negotiate sequentially with only a subset of countries or simultaneously with all countries. 29 The ASEAN-China FTA raised apprehension among the Indonesian private sector that the entry of cheaper Chinese products would undermine domestic manufacturing. Indonesian industries had

30
Against this backdrop, it may well be the case that the RCEP will appear on the surface to be
representative of a ‘new paradigm’, but will in fact still represent the domestic interests of
member countries. Although the RCEP could be an easier negotiating path for the ASEAN
nations and others, there is a high chance that it may lose sight of its strategic goals that make
it an attractive proposition in the first place30.
For the RCEP to serve as a model for a future FTAAP, it has to be an agreement that other
countries would be interested in joining. It has to set a target of 95 per cent tariff elimination
with a ‘common concession’ approach rather than a bundle of schedules or exclusion lists for
every possible bilateral combination among the member countries. The agreement should be
able to address the issue of prevalence of non-tariff barriers in the region, should pursue a
simplified approach to ROOs, coequality of rules31 and the accumulation of value content. The
RCEP should also be able to introduce tangible trade facilitation measures and should take into
account the issue of FTA utilization rates. Services sector liberalization should have a higher
target than the AFAS packages. These initiatives will help ASEAN to maintain its ‘centrality’
in the regional architecture and will help RCEP members contribute to global production
networks.
submitted a request to delay the implementation of tariff reductions on some 228 items including iron and steel, textiles, machinery, electronics, chemicals and furniture.
30 With RCEP in place, ASEAN may fulfill its strategic aspiration of ‘centrality’ in the broader Asia-
pacific region. 31 Coequal approach implies that exporters can choose between meeting a Regional Value Content (40 percent) standard or a Change in Tariff Classification at the four-digit HS level.

31
ASEAN should remember that the RCEP agreement is not the only option available for Asia-
Pacific regionalism. The ongoing TPP negotiations can also potentially serve as an FTAAP
model, giving the US a lead role in setting the agenda for a future regional architecture.
5. Conclusion
The group of ASEAN nations undertook a wise decision to embark on the Regional
Comprehensive Economic Partnership agreement, as it has the potential to assert ASEAN’s
central position in a larger regional integration architecture. It also serves an opportunity for
ASEAN to play a key role in forming a free trade area of the Asia-Pacific (FTAAP) in the
future. The RCEP agreement has the potential not only to consolidate the existing multiple,
smaller FTAs, but also to act as a building block for the multilateral trading system.
If the RCEP negotiations: conclude with a positive outcome of tariff elimination coverage of
95 per cent (Fukunaga and Kuno 2012); have a common market access schedule and
comprehensive coverage of WTO-plus issues (such as, deeper cooperation in investment,
environmental protection financial services and labour standards); focus on domestic structural
reforms; and give consideration to private sector interests and ‘behind the border’ integration
measures such as road connectivity, port services bottlenecks, and customs delays (Das 2012;
Gupta 2014), it will have the capacity to attract new members and concurrently reduce trade
and investment barriers among an increasing number of participants. However, there are
significant risks that the RCEP may not be able to live up to its expectations. The more the
RCEP looks like ASEAN’s least attractive FTA, with the exclusion of products that the
participating countries consider sensitive, the less likely the chances are of the partnership
attracting new members. Hence, as the chair of the RCEP negotiations, ASEAN must deliberate

32
on its objectives for the agreement. In addition, ASEAN should earnestly work on its own
integration process, so that it leaves the impression that the region is striving for a high-standard
agreement that may eventually become the basis for an FTAAP.
There are a number of challenges that may thwart the RCEP negotiations before they are
concluded. These challenges may also result in the creation of an agreement that is not too
different from the existing ASEAN+1 FTAs. Nonetheless, the RCEP agreement has the
potential to become a new paradigm in the international trading system, to support ASEAN’s
objective of centrality in the regional architecture, and to begin the process of consolidating
fragmented trading agreements. Indeed, the short-term trade-offs are significant, but hopefully
ASEAN and other currently participating countries can undertake difficult decisions to deliver
a comprehensive and mutually beneficial economic partnership agreement.
33
References
ASEAN Framework for Regional Comprehensive Economic Partnership. Available at:
http://www.asean.org/news/item/asean-framework-for-regional-comprehensive-
economic-partnership (accessed 15 August 2014).
ASEAN Integration Monitoring Report 2013. Available at:
http://documents.worldbank.org/curated/en/2013/01/18780456/association-southeast-
asian-nations-asean-integration-monitoring-report-joint-report-asean-secretariat-
world-bank (accessed 25 July 2014).
Asia Regional Integration Centre, Asian Development Bank. Available at:
http://aric.adb.org/fta-all (accessed 13 August 2014)
ASEAN Statistical Yearbook 2013. Jakarta: ASEAN Secretariat, 2014. Available at:
http://www.asean.org/images/resources/Statistics/2014/StatisticalPublications/asean%
20stattistical%20yearbook%202013%20(publication).pdf (accessed 26 August 2014).
Basu Das, Sanchita (2013a). “Challenges in Negotiating the Regional Comprehensive
Economic Partnership Agreement”. ISEAS Perspective No. 47-2013. Singapore:
Institute of Southeast Asian Studies.
Basu Das, Sanchita (2013b). “Moving ASEAN+1 FTAs towards an effective RCEP”. ISEAS
Perspective No. 29-2013. Singapore: Institute of Southeast Asian Studies.
Basu Das, Sanchita (2012). “RCEP: Going Beyond ASEAN+1 FTAs”. ISEAS Perspective.
Singapore: Institute of Southeast Asian Studies.
Basu Das, Sanchita (2014). “The Political Economy of the Regional Comprehensive Economic
Partnership (RCEP) and the Trans-Pacific Partnership (TPP) Agreements: An ASEAN
Perspective”. Trends in Southeast Asia no. 2-2014 (ISSN: 0219-3213). Singapore:
Institute of Southeast Asian Studies.
Bhagwati, Jagdish (2008). Termites in the Trading System: How Preferential Agreements
Undermine Free Trade. New York: Oxford University Press. Banno, Yuko (2014). “Japanese agricultural policy: Last chance for change”. The Tokyo
Foundation. Available at: http://www.tokyofoundation.org/en/articles/2014/japanese-agricultural-policy (accessed 13 August 2014).
Chandra, Alexander C (2008). Indonesia and ASEAN Free Trade Agreement: Nationalist and
Regional Integration Strategy. Lanham: Lexington Books. Corbett, Jenny (2008). “Services Trade Liberalisation in the ASEAN Economic Community
and Beyond”. In Deepening Economic Integration- The ASEAN Economic Community
and Beyond. ERIA Research Project Report 2007-1-2, edited by Hadi Soesastro. Chiba: IDE-JETRO.

34
Deunden, Nikomborirak and Jitdumrong, Supunnavadee (2013). “ASEAN Trade in Services”.
In The ASEAN Economic Community: A Work in Progress, edited by Sanchita Basu
Das, Jayant Menon, Omkar L. Shrestha and Rodolfo Severino. Singapore: Institute of
Southeast Asian Studies.
Doing Business 2013: Smarter Regulations for Small and Medium-Size Enterprises. Washington D.C.: World Bank, 2013.
Findlay, Christopher and Shandre Thangavelu. “The Living Noodle Bowl: ASEAN Trade Agreements.” East Asia Forum, 29 March 2013. Available at: <http://www.eastasiaforum.org/2013/03/29/the-living-noodle-bowl-asean-trade-agreements/> (accessed 15 August 2013).
Food and Agriculture Organization of the United Nations. FAOSTAT Database. (Latest update: 07 Mar 2014). Available at: http://data.fao.org/ref/262b79ca-279c-4517-93de-ee3b7c7cb553.html?version=1.0 (accessed 4 September 2014).
Fukunaga Y. and A. Kuno. “Toward a Consolidated Preferential Tariff Structure in East Asia: Going Beyond ASEAN+1 FTAs”. ERIA Policy Brief 2012-03. Available at: http://www.eria.org/publications/policy_briefs/toward-a-consolidated-preferential-tariff-structure-in-east-asia-going-beyond-asean1-ftas.html (accessed 13 June 2014).
Fukunaga, Y. and I. Isono (2013). “Taking ASEAN+1 FTAs towards the RCEP: A Mapping Study”. ERIA Discussion Paper Series 2013-02. Jakarta: Economic Research Institute for ASEAN and East Asia.
Gupta, Sourabh. “Making RCEP about Region-Wide Liberalisation”. East Asia Forum, 23 February 2014. Available at: <http://www.eastasiaforum.org/2014/02/23/making-rcep-about-region-wide-liberalisation/> (accessed 13 June 2014).
Hew, Denis (2007). “Conclusion: Towards an ASEAN Economic Community by 2015”. In
Brick by Brick: The Building of an ASEAN Economic Community, edited by Denis Hew.
Singapore: Institute of Southeast Asian Studies.
Hu, Albert (2013). “ASEAN Economic Community Business Survey”. In The ASEAN
Economic Community: A Work in Progress, edited by Sanchita Basu Das, Jayant
Menon, Omkar L. Shrestha and Rodolfo Severino. Singapore: Institute of Southeast
Asian Studies.
ILOSTAT DATABASE. Geneva: International Labour Organization. Available at:
http://www.ilo.org/ilostat/faces/home/statisticaldata?_afrLoop=89927540977253#%4
0%3F_afrLoop%3D89927540977253%26_adf.ctrl-state%3Dv3acwjqtr_4 (accessed
15 August 2014).
International Enterprise Singapore. “Singapore FTAs”. 2010. Available at:
http://www.fta.gov.sg/ (accessed 13 August 2014).
Itakura, Ken. “Impact of Liberalization and Improved Connectivity and Facilitation in ASEAN
for the ASEAN Economic Community”. ERIA Discussion Paper Series 2013-01.

35
Jakarta: ERIA, 2013. Available at http://www.eria.org/ERIA-DP-2013-01.pdf
(accessed 4 September 2014).
Joint Expert Group on EAFTA Phase II Study. “Desirable and Feasible Option for an East
Asia FTA”, 7 June 2009. Available at
http://www.thaifta.com/thaifta/Portals/0/eafta_phase2.pdf (accessed 13 August 2014).
Joint Expert Group for Feasibility Study on EAFTA. “Towards an East Asian FTA: Modality
and Roadmap”, 22 July 2006. Available at
<http://www.thaifta.com/thaifta/Portals/0/eafta_report.pdf> (accessed, 13 June 2014).
Kawai, Masahiro and Ganeshan Wignaraja (eds.) Asia’s Free Trade Agreements: How Is
Business Responding? Cheltenham: Asian Development Bank and Asian Development Bank Institute, 2011.
Kawai, Masahiro and Ganeshan Wignaraja (2013). “Patterns of Free Trade Areas in Asia”.
East West Policy Studies No. 65.
Kawai, Masahiro and Ganeshan Wagnaraja (2010). “Asian FTAs: Trends, Prospects, and Challenges” ADBI Working Paper Series No. 226. Tokyo: Asian Development Bank Institute.
< http://www.un.org/esa/ffd/msc/regionalcooperation/ADB_WPs.pdf> (accessed 20 August 2014)
Kawai, Masahiro and Ganeshan Wagnaraja (2009). “The Asian ‘noodle-bowl’: is it serious
for business?” ADBI Working Paper Series No. 136. Tokyo: Asian Development Bank Institute.
<http://www.adbi.org/files/2009.04.14.wp136.asian.noodle.bowl.serious.business.pdf> (accessed 20 August 2014)
Llanto, Gilberto M. and Ma. Kristina P. Ortiz (2013). “Regional Comprehensive Economic
Partnership: Reform Challenges and Key Tasks for the Philippines”. Discussion Paper Series No. 2013-51. Manila: Philippine Institute for Development Studies.
Medalla, E.M (2011). “Taking Stock of the ROOs in the ASEAN+1 FTAs: Toward Deepening
East Asian Integration”. Discussion Paper Series No. 2011-36. Manila: Philippine
Institute for Development Studies.
Menon, Jayant. “The challenge facing Asia’s Regional Comprehensive Economic
Partnership”. East Asia Forum, 23 June 2013.
<http://www.eastasiaforum.org/2013/06/23/the-challenge-facing-asias-regional-
comprehensive-economic-partnership/> (accessed 13 August 2014).
Menon, Jayant. “How to Multilateralise Asian regionalism”. East Asia Forum, 6 January 2013. Available at: <http://www.eastasiaforum.org/2013/01/06/how-to-multilateralise-asian-regionalism/> (accessed 13 August 2014).
Milner, Helen V (1997). Interests, Institutions and Information: Domestic Politics and
International Relations. New Jersey: Princeton University Press.
Petri, Peter A. and Michael G. Plummer. “Asia-Pacific Regional Integration: Economic Effects
and Implications for the Global Trading System”, 5 June 2014 [blog post on
Econbrowser.com]. Available online at
36
http://econbrowser.com/archives/2014/06/guest-contribution-asia-pacific-regional-
integration (accessed 1 September 2014).
Ramdasi, Preeti. “An Overview of India’s Trade Strategy”. IDDRI SciencesPo No 01/2010 March. Available at <http://www.iddri.org/Publications/Collections/Idees-pour-le-debat/id-012010_ramdasi.pdf> (accessed 13 August 2014).
Ravenhill, John (2002). “A Three Bloc World? The New East Asian Regionalism”.
International Relations of the Asia-Pacific 2, no. 2: 167-195.
Sally, Razeen (2013). “ASEAN FTAs: State of Play and Outlook for ASEAN’s Regional and
Global Integration” in The ASEAN Economic Community: A Work in Progress, edited
by Sanchita Basu Das, Jayant Menon, Omkar L. Shrestha and Rodolfo Severino.
Singapore: Institute of Southeast Asian Studies.
Scollay, Robert (2012). “APEC’s Regional Economic Integration Agenda and the Evolution of
Economic Integration in the Asia-Pacific Region”. KIEP APEC Study Series 12-02.
Seoul: Korea Institute for International Economic Policy.
Track Two Study Group on Comprehensive Economic Partnership in East Asia (CEPEA).
“Phase II Report of the Track Two Study Group on Comprehensive Economic
Partnership in East Asia”, 3 July 2009. Available at
https://www.dfat.gov.au/asean/eas/cepea-phase-2-report.pdf (accessed 26 August
2014).
UNDP. “Human Development Report 2014. Sustaining Human Progress: Reducing
Vulnerabilities and Building Resilience”. Available at:
http://hdr.undp.org/sites/default/files/hdr14-report-en-1.pdf (accessed 15 August
2014).
Urata, Shujiro (2005). “Free Trade Agreements: A Catalyst for Japan’s Economic Revitalization”. In Reviving Japan’s Economy: Problems and Prescriptions. Edited by Takatoshi Ito, Hugh Patrick and David E. Weinstein. MA: MIT Press.
Vo Tri Tanh (2005). “ASEAN Economic Community: Perspective from ASEAN’s Transitional Economies”. In Roadmap to an ASEAN Economic Community, edited by Denis Hew. Singapore: Institute of Southeast Asian Studies.
World Development Indicators. Washington D.C.: World Bank, 2013. Doi: 10.1596/978-0-8213-9824-1.
WTO (2004). “Trade Policy Review: Republic of Korea 2004” (WT/TPR/S/137). World Trade
Organization. Xin, Zhiming. “North Asia free-trade area agreement enormously beneficial but years away,”
China Daily [online], 1 September 2011. Available at:
http://usa.chinadaily.com.cn/epaper/2011-09/01/content_13595524.htm (accessed 15
August 2014).

37
Appendix 1: Status of FTAs between RCEP Members
Bru Cam Indon Lao Mal Mya Php Sing Th Viet ASEAN Aus NZ China India Japan Korea
Bru - S/E S/E
Cam - S/E
Indon - N N S/E N
Lao - S/E S/E
Mal - S/E S/E S/E S/E S/E P
Mya - S/E
Php - S/E P S/E
Sing - S/E S/E S/E S/E S/E S/E S/E
Th S/E - S/E S/E S/E S/E FA(S) S/E P
Viet - S/E S/E N
ASEAN S/E S/E S/E S/E S/E S/E S/E S/E S/E S/E - S/E S/E S/E S/E S/E S/E
Aus N S/E P S/E S/E S/E - S/E N S
NZ S/E S/E S/E S/E S/E - S/E N P N
China S/E S/E S/E N S/E - P N N
India N S/E S/E FA(S) S/E N P - S/E
Japan S/E S/E S/E S/E S/E S/E S/E S/E P N S/E -
Korea N P S/E P N S/E S N N -
Note: Except for the status of the FTAs listed under the column “ASEAN”, this table documents the status of bilateral FTAs between RCEP members that have been proposed or negotiated outside of the “ASEAN+1” process: S – Signed, S/E – Signed and in Effect, N- Negotiation Launched, P – Proposed and Under Study. Source: Author’s compilation; Asia Regional Integration Centre (ARIC), ADB.

38
Appendix 2: Share of Agriculture Sector in RCEP Member Economies (2012)
Note: a – data in 2010; b – data in 2011; c – data in 2012 from ASEAN Statistical Yearbook 2013 Source: World Development Indicators (World Bank); ILOSTAT Database (ILO); ASEAN Statistical Yearbook 2013
Bru Cam Indon Laos Mal Mya Php Sing Th Viet Aus NZ China India Japan Korea
% share in GDP 0.7 35.6 14.5 28.0 10.1 34.9 (c)
11.8 0.0 12.3 19.7 2.4 7.2 (a)
10.1 17.5 1.2 2.5
% Share in total employment
n.a. 51 35 n.a. 12.6 n.a. 32.2 0.0 39.6 47.4 2.9 6.8 34.8 (b)
47.2 3.8 6.2

39
Appendix 3: Share of Services Sector in RCEP Member Economies (2012)
Bru Cam Indon Lao Mal Mya Php Sing Th Viet Aus NZ China India Japan Korea
% share in GDP
28.2 40.2 38.7 35.8 49.1 37.7 (d)
57.1 73.3 44.2 41.7 69.4 69 (b)
44.6 56.3 731. 59.5
% Share in total employment
n.a. 30.4 43.2 n.a. 59 n.a. 52.5 77.1 (a)
39.4 31.5 75.5. 72.5 (a)
35.7 (c)
28.1 67.2 69.4
Note: a – data in 2009; b – data in 2010; c – data in 201; d – data in 2012 from ASEAN Statistical Yearbook 2013
Source: World Development Indicators (World Bank); ILOSTAT Database (ILO); ASEAN Statistical Yearbook 2013

40
Appendix 4: Ease of Doing Business in RCEP Member Economies (2013)
Economy Ease of Doing Business Rank
Starting a Business
Dealing With
Construction Permits
Getting Electricity
Registering Property
Getting Credit
Protecting Investors
Paying Taxes
Trading Across Borders
Enforcing Contracts
Resolving Insolvency
Bru 59 137 46 29 116 55 115 20 39 161 48
Cam 137 184 161 134 118 42 80 65 114 162 163
Indon 120 175 88 121 101 86 52 137 54 147 144
Lao 159 85 96 140 76 159 187 119 161 104 189
Mal 6 16 43 21 35 1 4 36 5 30 42
Mya 182 189 150 126 154 170 182 107 113 188 155
Php 108 170 99 33 121 86 128 131 42 114 100
Sing 1 3 3 6 28 3 2 5 1 12 4
Th 18 91 14 12 29 73 12 70 24 22 58
Viet 99 109 29 156 51 42 157 149 65 46 149
Aus 11 4 10 34 40 3 68 44 46 14 18
NZ 3 1 12 45 2 3 1 23 21 18 12
China 96 158 185 119 48 73 98 120 74 19 78
India 134 179 182 111 92 28 34 158 132 186 121
Japan 27 120 91 26 66 28 16 140 23 36 1
Korea 7 34 18 2 75 13 52 25 3 2 15
Source: Doing Business 2013