The Real Economy 62 - turnaround.org
20
USMCA IS A SOLID OPPORTUNITY FOR THE MIDDLE MARKET WOMEN OUTNUMBER MEN IN THE WORKFORCE, AND THE MIDDLE MARKET MUST ADAPT INDUSTRY SPOTLIGHT: AS AMERICAN FARMERS STRUGGLE, LENDERS BECOME ADVISERS MIDDLE MARKET TREND WATCH: RETAIL AND DIGITAL TRANSFORMATION THE REAL ECONOMY VOLUME 62 MIDDLE MARKET TO FEEL A SLOWING ECONOMY IN 2020
Transcript of The Real Economy 62 - turnaround.org

USMCA IS A SOLID OPPORTUNITYFOR THE MIDDLE MARKET
WOMEN OUTNUMBER MEN IN THE WORKFORCE, AND THE MIDDLE MARKET MUST ADAPT
INDUSTRY SPOTLIGHT: AS AMERICAN FARMERS STRUGGLE, LENDERS BECOME ADVISERS
MIDDLE MARKET TREND WATCH:RETAIL AND DIGITAL TRANSFORMATION
THE REAL ECONOMY VOLUME 62
MIDDLE MARKETTO FEEL A SLOWINGECONOMY IN 2020

2 | F E B R UA RY 2 0 2 0
Joseph Brusuelas Chief Economist, RSM US LLP
Brandon KoeserFinancial Services Senior Analyst, Senior Manager,RSM US LLP
Laura Dietzel Real Estate Senior Analyst,Partner,RSM US LLP
ABOUT THE AUTHORS
Our thought leaders are professionals with years of experience in their fields who strive to help you and your business succeed. Contributors to this issue include:

R S M | T H E R E A L E C O N O M Y | 3
This publication represents the views of the author(s), and does not necessarily represent the views of RSM. This publication does not constitute professional advice.
Middle market to feel a slowing economy in 2020 4
USMCA is a solid opportunity for the middle market 10
Women outnumber men in the workforce,and the middle market must adapt 14
Industry spotlight: As American farmers struggle, lenders become advisers 16
Middle market trend watch: Retail and digital transformation 18
TABLE OF CONTENTS
4 | F E B R UA RY 2 0 2 0
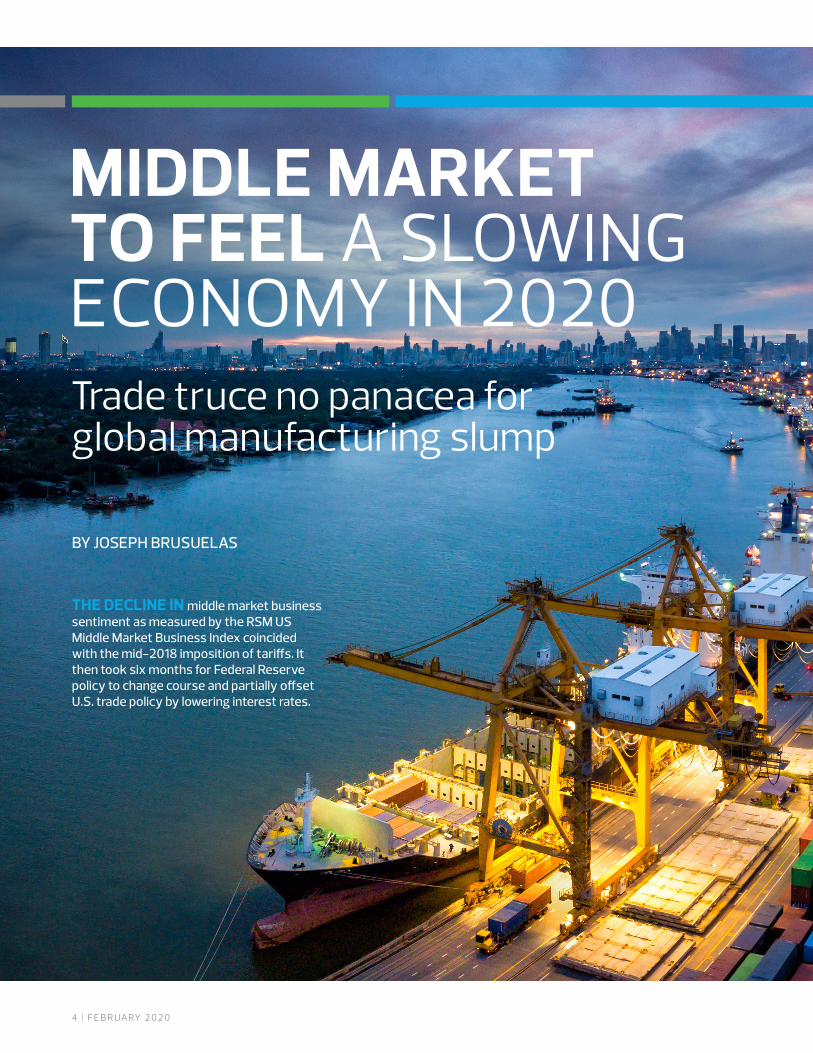
MIDDLE MARKET TO FEEL A SLOWING ECONOMY IN 2020 Trade truce no panacea for global manufacturing slump
BY JOSEPH BRUSUELAS
THE DECLINE IN middle market business sentiment as measured by the RSM US Middle Market Business Index coincided with the mid-2018 imposition of tariffs. It then took six months for Federal Reserve policy to change course and partially offset U.S. trade policy by lowering interest rates.

Fourth quarter growth buoyed by defense spending amid weaker data
The U.S. growth picture in the fourth quarter of 2019 was spot on trend, driven by strong government spending amid solid but slowing personal consumption. A large drop in imports, along with noticeable easing of spending, denotes some caution on the outlook in light of growing domestic and global risks.
Private investment fell by 6.1% on an annualized basis in the fourth quarter, and personal consumption—which has been the mainstay of the economy—grew by only 1.8%, with declines in both durable and non-durable purchases.
The economy enters 2020 on unsteady footing, linked to a far less attractive composition of growth, the shutdown of 737 Max production at Boeing and global headwinds that may pick up linked to the coronavirus crisis across the globe. As such, we expect the underlying economy to continue growing at its sub-2% rate.
This moderate growth outlook is clearly affecting global financial markets. The yield on the 10-year U.S. government security is trading near 1.57%, down 34 basis points since the beginning of the year. For now, this will not move the needle on Federal Reserve policy. We think the Fed will prefer to spend 2020 on the sidelines and out of the harsh political spotlight.
R S M | T H E R E A L E C O N O M Y | 5
Middle market business sentiment and Fed policy
0.00
0.50
1.00
1.50
2.00
2.50
3.00
110
115
120
125
130
135
140
2015 2016 2017 2018 2019 2020
Fed
fund
s ra
te (%
)
Busi
ness
sen
timen
t (di
ffus
ion
inde
x)
MMBI business sentiment index Fed funds rate (%)
Market-implied Fed funds rate
Source: Bloomberg; RSM US LLP
1992 1995 1998 2001 2004 2007 2010 2013 2016 2019
U.S. real GDP growth and RSM monthly index ofeconomic activity
Real GDP by expenditure (YOY %) (smo)
Model index
Projection
-10
-8
-6
-4
-2
0
2
4
6
(YOY
% )
RSM US projection
Source: BEA; BLS; Census; Bloomberg; RSM US LLP
6 | F E B R UA RY 2 0 2 0
There are downside risks to our forecast if the downward revisions to nonfarm payrolls and the downward trend in the number of hours worked are not reversed.
Risk of permanent damage to U.S. manufacturing base
The 2017 Tax Cuts and Jobs Act provided a shot of adrenaline for upper-income consumer spending. Between personal (household) consumption and government spending, those sectors were able to maintain real GDP growth in the 2% range.
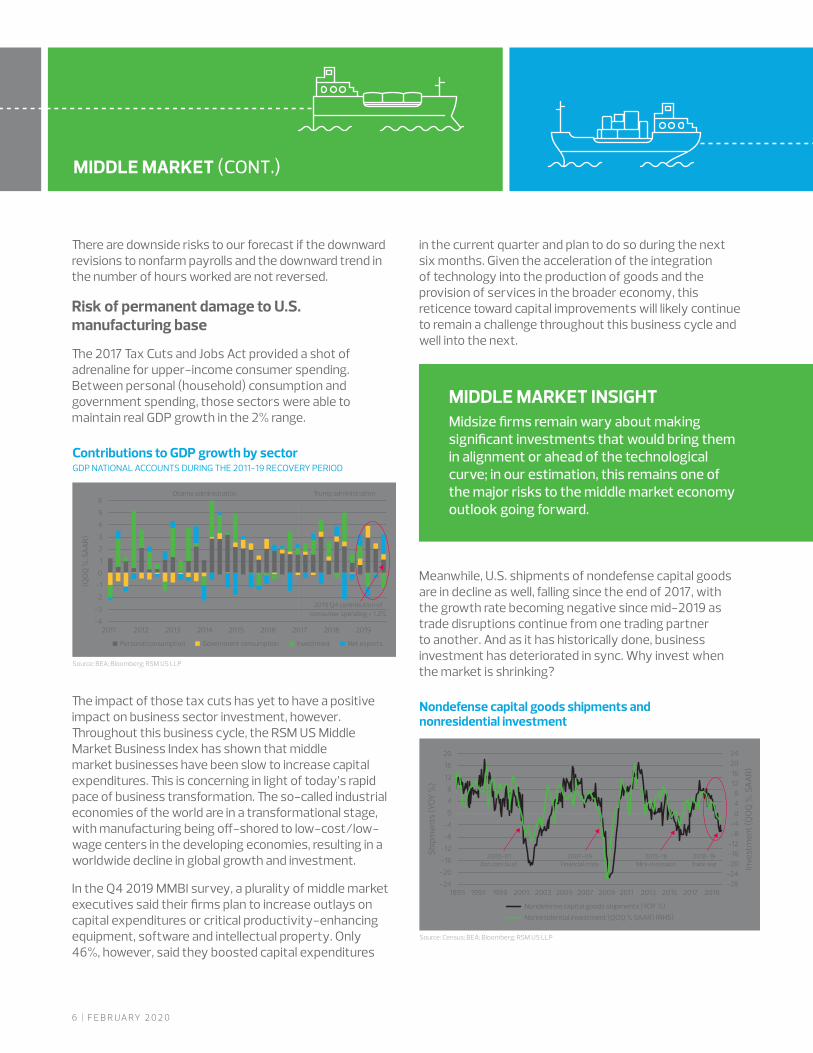
The impact of those tax cuts has yet to have a positive impact on business sector investment, however. Throughout this business cycle, the RSM US Middle Market Business Index has shown that middle market businesses have been slow to increase capital expenditures. This is concerning in light of today’s rapid pace of business transformation. The so-called industrial economies of the world are in a transformational stage, with manufacturing being off-shored to low-cost/low-wage centers in the developing economies, resulting in a worldwide decline in global growth and investment.
In the Q4 2019 MMBI survey, a plurality of middle market executives said their firms plan to increase outlays on capital expenditures or critical productivity-enhancing equipment, software and intellectual property. Only 46%, however, said they boosted capital expenditures
in the current quarter and plan to do so during the next six months. Given the acceleration of the integration of technology into the production of goods and the provision of services in the broader economy, this reticence toward capital improvements will likely continue to remain a challenge throughout this business cycle and well into the next.
Meanwhile, U.S. shipments of nondefense capital goods are in decline as well, falling since the end of 2017, with the growth rate becoming negative since mid-2019 as trade disruptions continue from one trading partner to another. And as it has historically done, business investment has deteriorated in sync. Why invest when the market is shrinking?
MIDDLE MARKET (CONT.)
MIDDLE MARKET INSIGHTMidsize firms remain wary about making significant investments that would bring them in alignment or ahead of the technological curve; in our estimation, this remains one of the major risks to the middle market economy outlook going forward.
1995 1997 1999 2001 2003 2005 2007 2009 2011 2013 2015 2017 2019
Nondefense capital goods shipments and nonresidential investment
-28-24-20-16-12-8-4
048
1216
2024
-24
-20
-16
-12
-8
-4
0
4
8
12
16
20In
vest
men
t (Q
OQ
%, S
AA
R)
Ship
men
ts (Y
OY %
)
Nondefense capital goods shipments (YOY %)Nonresidential investment (QOQ % SAAR) (RHS)
2000-01Dot.com bust
2007-09Financial crisis
2015-16Mini-recession
2018-19Trade war
Source: Census; BEA; Bloomberg; RSM US LLP
Contributions to GDP growth by sectorGDP NATIONAL ACCOUNTS DURING THE 2011-19 RECOVERY PERIOD
-4
-3
-2
-1
0
1
2
3
4
5
6
2011 2012 2013 2014 2015 2016 2017 2018 2019
(QO
Q %
, SA
AR)
Personal consumption
2019 Q4 contribution ofconsumer spending = 1.2%
Trump administrationObama administration
Government consumption Investment Net exports
Source: BEA; Bloomberg; RSM US LLP
R S M | T H E R E A L E C O N O M Y | 7
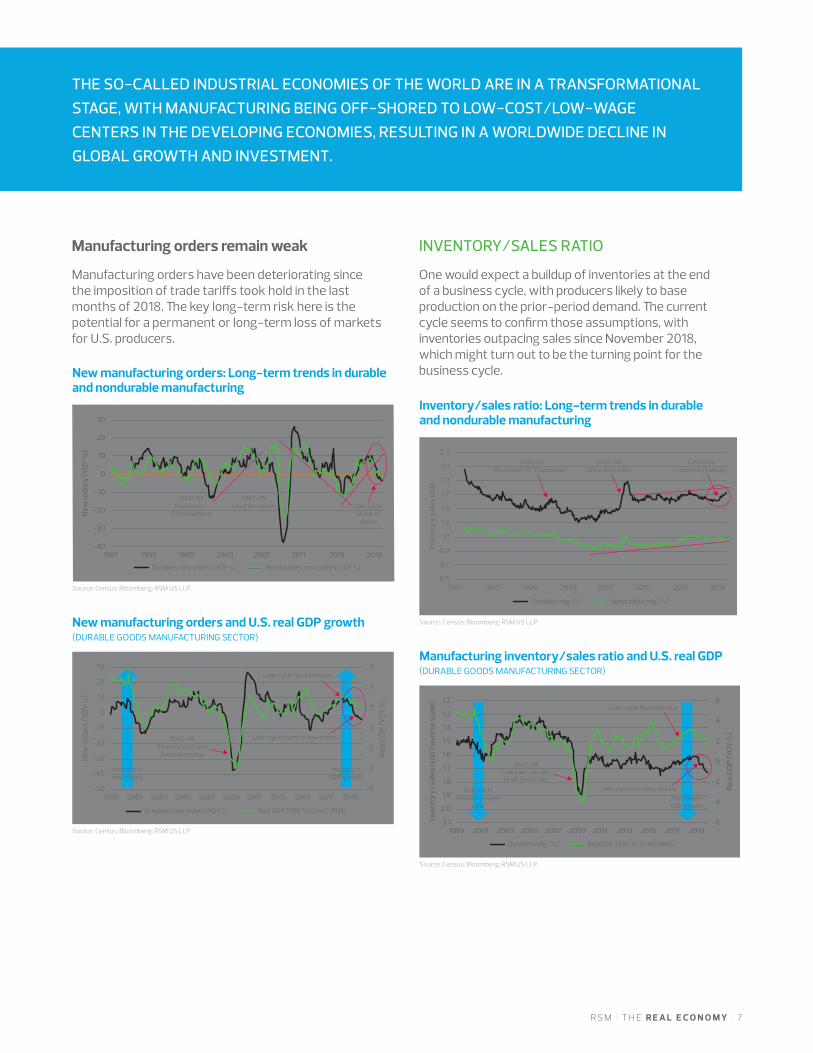
Manufacturing orders remain weak
Manufacturing orders have been deteriorating since the imposition of trade tariffs took hold in the last months of 2018. The key long-term risk here is the potential for a permanent or long-term loss of markets for U.S. producers.
INVENTORY/SALES RATIO
One would expect a buildup of inventories at the end of a business cycle, with producers likely to base production on the prior-period demand. The current cycle seems to confirm those assumptions, with inventories outpacing sales since November 2018, which might turn out to be the turning point for the business cycle.New manufacturing orders: Long-term trends in durable
and nondurable manufacturing
Durables new orders (YOY %) Nondurables new orders (YOY %)
-40
-30
-20
-10
0
10
20
30
1991 1995 1999 2003 2007 2011 2015 2019
New
ord
ers
(YOY
%)
2000-01Recession–
9/11 slowdown
2007-09Great Recession Late cycle
slump inorders
Source: Census; Bloomberg; RSM US LLP
New manufacturing orders and U.S. real GDP growth(DURABLE GOODS MANUFACTURING SECTOR)
1999 2001 2003 2005 2007 2009 2011 2013 2015 2017 2019-6
-4
-2
0
2
4
6
-50
-40
-30
-20
-10
0
10
20
30
Real
GD
P (Y
OY %
)
New
ord
ers
(YOY
%)
Durables new orders (YOY %) Real GDP (YOY %) (smo) (RHS)
Increase innew orders
Increase inGDP growth
2007-09Financial crisis and
Great Recession
Late-cycle slump in new orders
Late-cycle fiscal stimulus
Source: Census; Bloomberg; RSM US LLP
Inventory/sales ratio: Long-term trends in durable and nondurable manufacturing
Durables mfg. (%) Nondurable mfg. (%)
0.5
0.7
0.9
1.1
1.3
1.5
1.7
1.9
2.1
2.3
1991 1995 1999 2003 2007 2011 2015 2019
Inve
ntor
y sa
les
ratio
2000-01Recession–9/11 slowdown
2007-09Great Recession
Late cycleinventory buildup
Source: Census; Bloomberg; RSM US LLP
Manufacturing inventory/sales ratio and U.S. real GDP(DURABLE GOODS MANUFACTURING SECTOR)
-6
-4
-2
0
2
4
61.2
1.3
1.4
1.5
1.6
1.7
1.8
1.9
2.0
2.11999 2001 2003 2005 2007 2009 2011 2013 2015 2017 2019
Real
GD
P (Y
OY %
)
Inve
ntor
y/sa
les
ratio
(rev
erse
sca
le)
Durables mfg. (%) Real GDP (YOY %) (smo) (RHS)
Late-cycle inventory buildupIncrease ininventory/sales
ratioDecrease inGDP growth
2007-09Financial crisis and
Great Recession
Late-cycle fiscal stimulus
Source: Census; Bloomberg; RSM US LLP
THE SO-CALLED INDUSTRIAL ECONOMIES OF THE WORLD ARE IN A TRANSFORMATIONAL STAGE, WITH MANUFACTURING BEING OFF-SHORED TO LOW-COST/LOW-WAGE CENTERS IN THE DEVELOPING ECONOMIES, RESULTING IN A WORLDWIDE DECLINE IN GLOBAL GROWTH AND INVESTMENT.

CAPACITY UTILIZATION
Excess capacity for manufacturers of durable (and now nondurable) goods since mid-2017 illustrates the damage caused by the trade wars and the global manufacturing recession. The losses from underused capacity are unlikely to be recovered. •
8 | F E B R UA RY 2 0 2 0
North American manufacturing activity3-MONTH MOVING AVERAGES
-20
-15
-10
-5
0
5
10
15
20
-30
-20
-10
0
10
20
30
2001 2003 2005 2007 2009 2011 2013 2015 2017 2019
Indu
stria
l pro
duct
ion
(YOY
%)
Mfg
. pro
duct
ion
(YOY
%)
Manufacturingrecessions
U.S. new mfg. orders (YOY %) (smo) Canada mfg. orders (YOY %) (smo)Mexico mfg. production (YOY %) (smo) (RHS)
Source: US Census; StatsCan; INEGI; Bloomberg; RSM US LLP
U.K. and Germany manufacturing activity3-MONTH MOVING AVERAGES
-30
-20
-10
0
10
20
-15
-10
-5
0
5
10
1999 2001 2003 2005 2007 2009 2011 2013 2015 2017 2019
Ger
man
y m
fg. s
ales
(YOY
%)
U.K
. mfg
. out
put (
YOY
%)
U.K. mfg. output(YOY %) (smo)
Germany mfg. orders(YOY %) (smo)
Manufacturingrecessions
Source: ONS; Deutsche Bank; Bloomberg; RSM US LLP
Capacity utilization: Long-term trends in durableand nondurable manufacturing
Capacity utilization: Durables mfg. (%) Capacity utilization: Nondurable mfg. (%)
55
60
65
70
75
80
85
90
95
1969 1974 1979 1984 1989 1994 1999 2004 2009 2014 2019
Capa
city
util
izat
ion
(%)
2007-09Great Recession
2018-19Trade warrecession
2000-01Dot.com recession
–9/11 slowdown
1991-92Bush recession
1970sStagflation era
Source: Federal Reserve; Bloomberg; RSM US LLP
Capacity utilization and U.S. real GDP growth(DURABLE GOODS MANUFACTURING)
-6
-4
-2
0
2
4
6
8
10
55
60
65
70
75
80
85
90
95
1969 1974 1979 1984 1989 1994 1999 2004 2009 2014 2019
Real
GD
P (Y
OY %
)
Capa
city
util
izat
ion
(%)
2019Resumption of
manufacturing downtrend
2007-09Financial crisis and
Great Recession
Capacity utilization: Durables mfg. (%) Real GDP (YOY %) (smo) (RHS)
Source: Federal Reserve; Bloomberg; RSM US LLP
GLOBAL MANUFACTURING MAY TAKE YEARS TO RECOVER FROM TRADE WARSManufacturing among the developed economies continues to struggle despite nascent signs that the worst might be behind us. But as an old economics professor of mine once stressed, an hour of lost labor can never be recovered. The damage of U.S. trade wars on China and then Germany might take a generation of growth to overcome, if ever. The same goes for the U.K. as it plots its split from the European common market.
MIDDLE MARKET (CONT.)
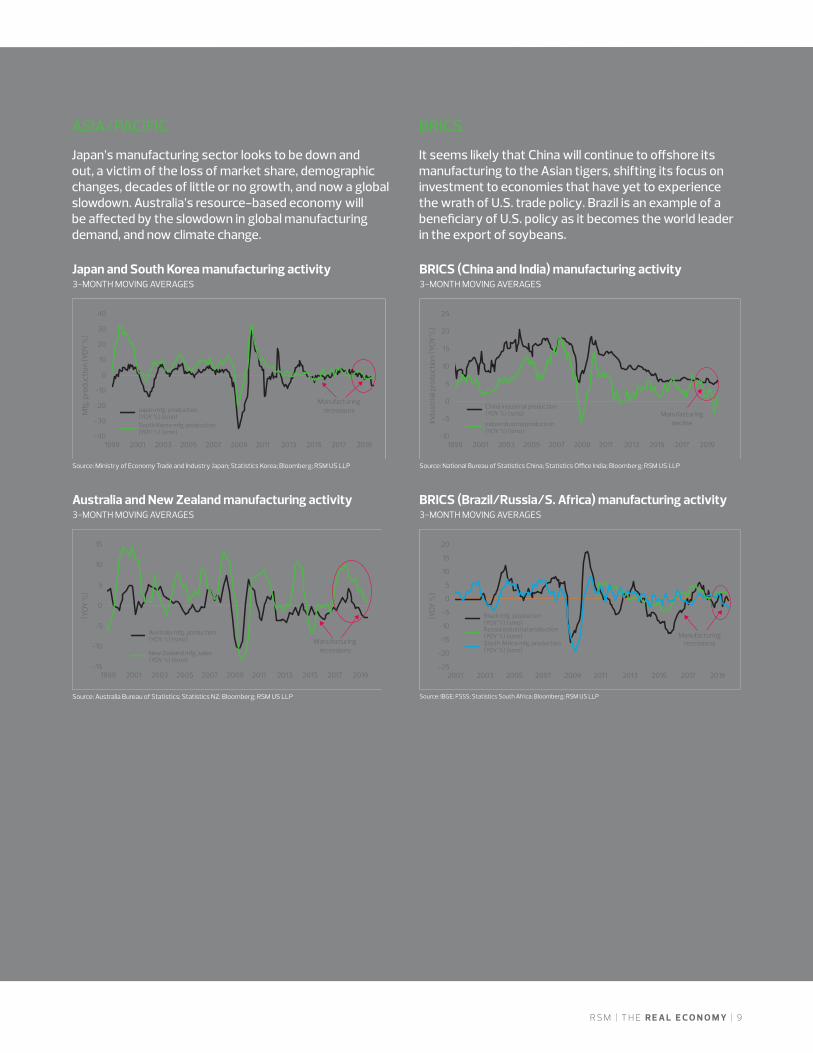
ASIA/PACIFIC
Japan’s manufacturing sector looks to be down and out, a victim of the loss of market share, demographic changes, decades of little or no growth, and now a global slowdown. Australia’s resource-based economy will be affected by the slowdown in global manufacturing demand, and now climate change.
BRICS
It seems likely that China will continue to offshore its manufacturing to the Asian tigers, shifting its focus on investment to economies that have yet to experience the wrath of U.S. trade policy. Brazil is an example of a beneficiary of U.S. policy as it becomes the world leader in the export of soybeans.
R S M | T H E R E A L E C O N O M Y | 9
Japan and South Korea manufacturing activity3-MONTH MOVING AVERAGES
-40
-30
-20
-10
0
10
20
30
40
1999 2001 2003 2005 2007 2009 2011 2013 2015 2017 2019
Mfg
. pro
duct
ion
(YOY
%)
Japan mfg. production(YOY %) (smo)South Korea mfg. production(YOY %) (smo)
Manufacturingrecessions
Source: Ministry of Economy Trade and Industry Japan; Statistics Korea; Bloomberg; RSM US LLP
BRICS (China and India) manufacturing activity3-MONTH MOVING AVERAGES
-10
-5
0
5
10
15
20
25
1999 2001 2003 2005 2007 2009 2011 2013 2015 2017 2019
Indu
stria
l pro
duct
ion
(YOY
%)
China industrial production(YOY %) (smo)
India industrial production(YOY %) (smo)
Manufacturingdecline
Source: National Bureau of Statistics China; Statistics Office India; Bloomberg; RSM US LLP
Australia and New Zealand manufacturing activity3-MONTH MOVING AVERAGES
-15
-10
-5
0
5
10
15
1999 2001 2003 2005 2007 2009 2011 2013 2015 2017 2019
(YOY
%)
Australia mfg. production(YOY %) (smo)
New Zealand mfg. sales(YOY %) (smo)
Manufacturingrecessions
Source: Australia Bureau of Statistics; Statistics NZ; Bloomberg; RSM US LLP Source: IBGE; FSSS; Statistics South Africa; Bloomberg; RSM US LLP
BRICS (Brazil/Russia/S. Africa) manufacturing activity3-MONTH MOVING AVERAGES
-25
-20
-15
-10
-5
0
5
10
15
20
2001 2003 2005 2007 2009 2011 2013 2015 2017 2019
(YOY
%)
Manufacturingrecessions
Brazil mfg. production(YOY %) (smo)Russia industrial production(YOY %) (smo)South Africa mfg. production(YOY %) (smo)

1 0 | F E B R UA RY 2 0 2 0
USMCA IS A SOLID OPPORTUNITY FOR THE MIDDLE MARKETBY JOSEPH BRUSUELAS
THE NEW NORTH AMERICAN trade agreement represents a solid opportunity for American middle market firms to expand their participation in the regional and global economies.
The pact, called the United States-Mexico-Canada Agreement, includes a chapter dedicated to small and medium enterprises—a first for a multilateral trade agreement—and also, adopts a wide array of provisions from the abrogated Trans-Pacific Partnership trade treaty. Both of these provisions are major wins. Before the House Democrats introduced their ideas around labor, the environment and pharmaceuticals, language from the TPP represented close to three-quarters of the USCMA text.
In broader terms, the new agreement shows that all of the talk about the end of globalization is perhaps premature. Rather, one might say that we are headed toward an era of reglobalization featuring regional trade arrangements until the United States and China can reach accommodations on larger macroeconomic and security issues.
The deal includes new requirements for improved labor practices, environmental policies, facilitating digital trade, cross-border trade in services, protecting intellectual property and reducing the role of state-owned enterprises. In our estimation, the chapters covering these substantial areas have created a positive framework and lay the groundwork for subsequent trade accords.
Despite those wins, though, the agreement will have costs, particularly for the auto industry.
MIDDLE MARKET INSIGHTDespite some good provisions, the agreement will have costs, particularly when it comes to the auto industry.

R S M | T H E R E A L E C O N O M Y | 1 1
The new treaty increases the required ratio of parts made in North America—known as the auto rules of origin—from 62.5% to 75% if the vehicle is to avoid import duties. It also requires that 30% of a car be made at a plant where workers earn at least $16 an hour to qualify for duty-free status. That ratio increases to 40% by 2023 if that auto is produced with 70% of steel and aluminum made in North America. In either scenario, the new requirements will result in higher prices on vehicles and their parts.
Put in dollar terms, these new requirements will erode the roughly $5,000 discount for all autos produced and purchased within the North American supply chain. And this, in turn, will ultimately lead to a modest roll back of the deep economic integration of the three economies organized around auto production.
While the inclusion of language from the TPP is an undeniable positive, additional layers of costly regulations and a move toward managed trade as opposed to free trade in the North American auto chain will result in higher prices for all firms that participate. Most important, the burden of adjustment will fall squarely on the shoulders of middle market producers in the United States, Canada and Mexico, with firms in Mexico bearing a disproportionate share.
Also of interest is section 32.10 of the agreement, which states that if any party enters into a free trade agreement with a nonmarket economy, the other parties would have the option of terminating the agreement. Essentially, this represents a poison pill that will severely curtail the ability of Mexico and Canada to enter into trade agreements with China. This stems from the larger U.S. trade dispute with China and will most likely be part of other U.S. trade treaties going forward.
From a broader strategic standpoint, it is the first in what can be expected to be a long-term effort by the United States to constrain China’s ability to further penetrate the North American trade bloc and other critical U.S. economic and trade relationships.
The treaty, subject to language verification, is comprised of 34 separate chapters, 13 annexes and 13 side letters. The following is a quick summary and analysis of those chapters that have the biggest impact on the economy and middle market enterprises.
Small and medium enterprises: Chapter 25
The text in the agreement on small and medium enterprises sets up a mechanism to increase trade and investment opportunities and ensure that large firms do not squeeze out smaller firms. It marks the first time that formal language ensuring fair participation in trade and investment for small- and medium-size enterprises has been included in a multilateral trade treaty.
The treaty sets up cooperation among the three countries to support small- and medium-size business infrastructures, including dedicated enterprise centers for businesses, incubators and accelerators, and export assistance centers. The goal is to create an international network that allows these businesses to share best practices, exchange market research and promote participation in international trade, as well as promote business growth in local markets.
1 2 | F E B R UA RY 2 0 2 0
The oversight measures outlined in the chapter call for a meeting at least once a year to discuss the experiences and best practices of small- and medium-size businesses in supporting and assisting exporters. In addition, all three countries in the treaty will support and facilitate training programs, trade education, trade finance, trade missions, trade facilitation, digital trade, and identify commercial partners in other countries and establish good business credentials.
Rules of origin: Chapters 4 and 5
The basic premise of current trade policy out of Washington, D.C., represents an attempt to repatriate global supply chains back to the United States. On that account, the new treaty is likely to fall short of that lofty goal. The rules of origin chapters are the formal expression of that policy goal.
Unfortunately, those rules will result in higher costs for consumers and producers. The USMCA is the first trade treaty entered into by the United States that formally increases trade barriers rather than reducing them. In the end, it will result in a loss of auto production jobs across all three economies.
The structure of the agreement, when it comes to the auto supply chain, most likely serves as an incentive for firms to make further investments closer to the global growth areas in China and India. Moreover, with respect to the internal dynamics within the North American supply chain, the wage floor included in the modernization will almost certainly result in a greater use of automation and robotics inside an auto supply chain that is already among the most technologically advanced in the world.
While there may be a reduction in auto exports from Mexico into the United States, especially at the lower end of the price spectrum, and price hikes across the industry over the midterm, further automation is highly probable as firms adjust to politically managed rather than free trade. The result will be higher prices and the loss of competitiveness for middle market firms that feed into the North American auto supply chain.
In our estimation, rather than moving supply chains back to the United States, firms like Volkswagen that export affordable autos into the United States and Canada will most likely opt to pay the 2.5% tariff. If a household chooses to purchase a VW Atlas SUV, the current base price of $30,750 would increase by roughly $768.
Then there are the demographic headwinds. The United States has not breached 18 million auto sales on an annual basis over the past 20 years. It makes little sense for automakers to bring production back home to a market that, in population-adjusted terms, is falling. Instead, they will almost certainly look to make new investments closer to the growth markets of Brazil, China and India.
On the second point, consider if a firm produces glass in Mexico that feeds into the North American auto and housing supply chains, it faces a difficult choice to either lift wages to meet the new wage floor or choose to move toward 100% automation. A firm like this will most likely choose to focus on retaining higher-value-added
MIDDLE MARKET INSIGHTThe result of the USMCA will be higher prices and the loss of competitiveness for middle market firms that feed into the North American auto supply chain.
USMCA (CONT.)
R S M | T H E R E A L E C O N O M Y | 1 3
employees, release lower-paid workers and then move to automate with the end game resulting in decreasing costs of production and retaining access to the wealthy American and Canadian markets. The result will be greater reliance on robotics in auto production for all three economies.
One of the more disappointing aspects of the new agreement is that it appears to be designed for an American industrial economy that is slowly shrinking relative to the fast-growing new economy organized around sophisticated technology. With most products used in auto production crossing the border an average of six times, it is virtually impossible to place a value on origin. Ultimately, the expectations on production and job gains in the auto sector are not well aligned with empirical reality. More important, the agreement does not appear to have considered the impact of advances in the use of data, artificial intelligence and machine learning in the production of autos and other manufactured goods.
Textiles and apparel: Chapter 6
The chapter on textiles and apparel is vague and will require further interpretation once the agreement’s language is verified. But it does promote a greater use of American-produced fabrics and yarn while using enhanced customs enforcement and trans-shipment of goods produced outside of the agreement through third parties. This does represent a rollback of market pricing and will over time most likely increase the probability that nonmarket barriers to trade will be put in place. Ultimately, that increases the overall costs of production and consumption.
The text appears to reduce the ability to use non-USMCA inputs, which if implemented, will certainly result in higher costs of production and thinner margins for those dependent upon the textile and apparel supply chains along the U.S.-Mexican border. To gain
preferential treatment under the new trade agreement requires that unspecified inputs be incorporated into finished products and be made in the same region as that finished product. There is specific language that applies to coated fabric, narrow elastic bands, pocketing fabric and sewing thread. To put this in context, a dress shirt produced in Mexico must use goods made in the United States, Canada and Mexico.
Chapter 6 is one of the most technical in the agreement and will require an in-depth investigation to provide greater clarity on its impact to the apparel and textile supply chains. But one thing is clear: The importation of goods from outside the North American trade bloc will face higher duties and will increase the cost of production. This is in line with the overall efforts of the administration to limit the ability of Chinese exporters to make further inroads in the North American economy.
Modest changes in other chapters like the much-hyped access for U.S. dairy farms to the Canadian market were simply an adoption of what had already been agreed upon inside the TPP. While it does reduce some market distortions on the Canadian side of the border, the increase in total dairy exports from the United States to Canada will be quite small and in line with the TPP.
De minimis thresholds that apply to low-value shipments were reduced while there was nothing in the treaty that encouraged an increase in energy market trade, which is a conceivable future point of further liberalization within the treaty. More problematic, the aluminum and steel tariffs put in place on both Canada and Mexico were not removed despite the update of the trade agreement. The increased costs associated with that specific set of policies will continue to offset any gains in the agricultural sector linked to greater market access for U.S. firms. •
ONE OF THE MORE DISAPPOINTING ASPECTS OF THE NEW AGREEMENT IS THAT IT APPEARS TO BE DESIGNED FOR AN AMERICAN INDUSTRIAL ECONOMY THAT IS SLOWLY SHRINKING RELATIVE TO THE FAST-GROWING NEW ECONOMY ORGANIZED AROUND SOPHISTICATED TECHNOLOGY.

1 4 | F E B R UA RY 2 0 2 0
WOMEN OUTNUMBER MEN IN THE WORKFORCE, AND THE MIDDLE MARKET MUST ADAPTBY JOSEPH BRUSUELAS AND LAURA DIETZEL
RARELY ARE INFLECTION points in the history of an economy or a nation observed in real time. Profound change is often only identified long after it has occurred. The December U.S. employment report provided a hint that the U.S. labor market, economy and the basic organization structure of the relationship between work and the individual have reached an inflection point.
The emerging female majority in the labor force is unlikely to be content with a glacial pace of change.
Women now outnumber men in the workforce by 50.04% to 49.96%. There are 109,000 more women than men in the American workforce, excluding agricultural jobs. In our estimation, this foreshadows a significant period of change in wages, benefits and the way in which work is organized inside firms of all sizes.
MIDDLE MARKET INSIGHTIs the middle market at risk of missing the opportunity in this demographic shift? Special questions in the fourth quarter 2019 RSM US Middle Market Business Index uncovered that only 27% of executives indicated their organization supports gender-equality causes, and 46% reported that they are focused on women’s issues and empowerment as part of their diversity and inclusion efforts. Without a stronger focus on women, the middle market will miss out on all of the benefits driven by this shift in the workforce and the diverse perspectives it brings to business.

R S M | T H E R E A L E C O N O M Y | 1 5
A long time coming
American labor market dynamics are tilting in the direction of women. Forward-looking CEOs and corporate boards should anticipate greater demands for change in the workplace, particularly around wage disparity. The data visualization below illustrates the long-term changes in the domestic workforce. Notice how the changes that began in the early 1960s, then accelerated in the 1990s, have finally come to fruition in 2020.
To provide some context around the significance of this change, consider that in 1965 there were 10.8 million women working in private service-providing jobs. Today that number has exploded to 58.3 million, with women holding about 54% of all service-providing jobs. Even in traditionally male-dominated goods-production industries, female employment increased by 2.4% versus 0.4% for men.
The U.S. prime-aged labor force participation rate of women ages 25 to 54 stands at a cyclical high of 76.5%. Given that the fastest areas of growth within the domestic labor force are services—health care, education and business services—the present-day 20% average pay gap between men and women in the workplace is unsustainable.
Change is here
Cyclical labor dynamics strongly imply that women now have the initiative in traditional employment. Medium- and large-sized firms will need to quickly change the way they recruit, retain and provide work flexibility to accommodate the emerging demographic majority within the labor force. Moreover, there needs to be an equalization of wages in the near-term. This cannot happen fast enough.
The new demographic shift will demand a greater focus on family-friendly policies and benefits, and flexibility will become table stakes as women continue to bear their traditional burden of childcare and eldercare. It won’t be enough, however, for companies to simply offer these benefits; employees must see that their careers won’t be penalized for taking advantage of them to help meet their work and personal demands.
Even the most forward-looking managers and policymakers typically demand tangible evidence of change. That change is now evident in the hard data provided by the U.S. Labor Department and can be used as a benchmark to measure equality and inequality in the labor force and the economy.
Diversity, inclusion and equality are noble and achievable goals. Given the demographic changes underway in the economy, best illustrated by changes in employment data, firms need to rapidly adapt and evolve to accommodate those goals and operationalize them within the firm.
The emerging majority in the labor force is unlikely to be content with a glacial pace of change; they will likely just get on with it, while reinterpreting the pantheon of wages, workplace and the economy. •
Women and men employees as a percentageof total employees
December 2019Women: 50.04%
Men: 49.96%
Women (% of total) Men (% of total)
20%
30%
40%
50%
60%
70%
80%
1964 1969 1974 1979 1984 1989 1994 1999 2004 2009 2014 2019
% o
f tot
al e
mpl
oyee
s
Source: BLS; FRED; RSM US LLP
WOMEN NOW OUTNUMBER MEN IN THE WORKFORCE BY 50.04% TO 49.96%. THERE ARE 109,000 MORE WOMEN THAN MEN IN THE AMERICAN WORKFORCE, EXCLUDING AGRICULTURAL JOBS.

1 6 | F E B R UA RY 2 0 2 0
INDUSTRY SPOTLIGHT
AS AMERICAN FARMERS STRUGGLE, LENDERS BECOME ADVISERSBY BRANDON KOESER
THIS YEAR HAS been one to forget for the American farmer. Weather, trade and depressed commodity prices have combined to weigh on farmers’ abilities to generate income not only to support their family and way of life, but also to finance the debt they carry to operate their enterprises.
It has been a perfect storm of sorts, forcing farmers to make tough decisions as they try to get by. And many aren’t. The American Farm Bureau Federation reported that farm bankruptcies were up 24% nationwide for the 12 months ending Sept. 30, with more than 40% of those taking place in the 13-state Midwest region.
As painful as this has been for the farmers, it is also forcing a reckoning among lenders and should prompt a rethinking of their role, one that goes beyond primarily being a source of financing, and instead, becoming more of a trusted adviser. Farmers, after all, are often consumed with day-to-day operational challenges, and need help thinking through longer-term decisions.
According to a joint survey released in November by the American Bankers Association and the Federal Agricultural Mortgage Corporation, better known
as Farmer Mac, the top five concerns of agriculture lenders for their borrowers are the following, in order of most critical:
• Liquidity • Farm level incomes • Total leverage • Uncertainty around tariffs • Trade and weather
In the end, these five concerns can be translated into a broader view of the challenges facing agriculture lenders—credit quality and loan deterioration.
From lender to adviser
Although a majority of the survey respondents indicated that they are not anticipating more charge-offs on agriculture loans in 2020, the reality is that net charge-offs reported by banks have been steadily increasing since 2016. The second quarter of 2019 saw the highest single quarter of net charge-offs on agricultural loans since the fourth quarter of 2012. Agriculture lenders will need to embrace this role of a trusted adviser to ensure that farm operators are making appropriate decisions that sustain their operations.
AGRICULTURE

R S M | T H E R E A L E C O N O M Y | 1 7
Such decisions won’t be limited only to advising on reducing capital purchases, but also to leveraging unencumbered land to support increased debt loads on farm production loans to exploring alternative income sources that could cut down on the cash need from the farm operations.
Keeping an eye on loan balances
One way bankers are able to gauge the health of their agriculture borrowers is by watching the loan balances, especially those loans tied to farm operations, otherwise known as the operating lines of credit.
Typically, a farmer’s operating line of credit comes due at the end of the harvest season or early the following year, at which point the line of credit, in a perfect world, is paid off by the income generated from harvested crops. But it is becoming increasingly common that these loans are not paid off, and any outstanding balance is either rolled over into the next year’s operating line of credit or moved into a new term note and put on a payment schedule to be repaid over time.
Agriculture loan balances have been increasing steadily since 2010. When it comes to operating lines of credit, the balance increases throughout the year as farmers buy the seeds and other products necessary to grow their crops. These loan balances generally peak late in the second quarter through the middle of the third quarter as harvest begins, and they remain elevated through the end of the year before being paid down or paid off in the first quarter of the following year.
But a troubling trend has taken place in recent years: The level of repayments occurring in the first quarter of each year has slowly declined.
The decline in balances on farm production loans from the fourth quarter in 2018 to the first quarter in 2019 was the smallest amount reported since 2008. When this is combined with the average growth in farm production loan balances, one conclusion can be drawn: Operating lines of credit are not being repaid at an appropriate level.
2020 and beyond
This ballooning debt places more responsibility on agriculture lenders to remain cautious in how they approach their borrowers. The $28 billion in aid payments farmers have received the last two years are most certainly not enough to compensate a farmer for the cost of doing business.
Even with the not-yet-signed phase one trade deal with China in place, the impact to commodities and related prices will take some time to be seen in farmers’ bank accounts. And that still doesn’t account for global commodity demands, weather conditions and other environmental factors that can affect the results of the farmer’s growing season.
The takeaway
Although an uncertain future will still result in continued difficulties for the agriculture sector, it doesn’t mean that lenders should or need to forcefully tighten underwriting standards to reduce their exposure to these borrowers. Rather, an increased level of vigilance and monitoring, along with an advisory mindset, will be the difference between helping a borrower make it through a difficult time and the borrower shutting down the operation entirely, leaving the banks holding the bill. •
-20
0
20
40
60
80
100
120
2011 2012 2013 2014 2015 2016 2017 2018 2019
Amou
nts
in m
illion
s
Farmland loans Farm production loans
Net farm charge-offs by quarter
Source: FDIC; RSM US LLP
Farm loan activity
50,000
60,000
70,000
80,000
90,000
100,000
110,000
2010 2011 2012 2013 2014 2015 2016 2017 2018 2019
Amou
nts
in m
illion
s
Farm loans
Farm production loans
12 month mvg. avg. (farm production loans)
Source: FDIC; RSM US LLP

1 8 | F E B R UA RY 2 0 2 0
RETAIL AND DIGITAL TRANSFORMATION
MIDDLE MARKET TREND WATCH
HOW ARE MIDDLE MARKET retailers prioritizing digital strategy and investments? According to an RSM survey, the near-term focus for many organizations is on customer-facing technologies. Here are some top findings: Fifty percent of executives reported
5G technology as extremely important in terms of digital investments in their organizations. Following 5G, mobile technologies, e-commerce platforms, business intelligence and digital marketing ranked highest among retail executives’ priorities.
Surveyed executives reported frictionless customer experiences (38%), new differentiated markets (28%), improved data storage (27%) and improved customer relationships (27%) as the top benefits from digital investments, highlighting the augmented focus on customers in the retail industry.
Executives are recognizing the importance of integrating technologies and processes as well as the difficulties associated with them across their organizations. The top three business processes respondents cited as needing greater integration included order fulfillment (38%), profiling customer information (37%) and in-store pickup (37%).
Digital transformation has become a priority for the middle market retailer C-suite, reflecting the importance of digital transformation across an entire retail organization. A majority of CEOs take ownership for leading strategy (53%), trailed by CFOs and CIOs (31% and 14%, respectively).
KEY TAKEAWAY
For optimal investment return and outcomes, middle market retailers should ensure that they have a well-thought-out, comprehensive and documented digital road map that they can execute on, rather than taking a project-by-project approach to their digital transformation.

R S M | T H E R E A L E C O N O M Y | 1 9
REAL BUSINESS INSIGHTS FOR MIDDLE MARKET COMPANIESCheck out The Real Economy: Industry Outlook and get data-driven, sector-specific insights from RSM’s senior industry analysts, a select group of professionals dedicated to studying economic and industry data, market trends and the emerging issues faced by middle market businesses like yours.
Each outlook provides unique perspectives and planning opportunities affecting businesses in the following industries:
• Consumer products
• Financial services
• Health care
• Industrial products
• Life sciences
• Real estate
• Technology, media and telecom
Read our current issue and subscribe to receive future outlooks.
1
VOLUME 3 WINTER 2020

This document contains general information, may be based on authorities that are subject to change, and is not a substitute for professional advice or services. This document does not constitute audit, tax, consulting, business, financial, investment, legal or other professional advice, and you should consult a qualified professional advisor before taking any action based on the information herein. RSM US LLP, its affiliates and related entities are not responsible for any loss resulting from or relating to reliance on this document by any person. Internal Revenue Service rules require us to inform you that this communication may be deemed a solicitation to provide tax services. This communication is being sent to individuals who have subscribed to receive it or who we believe would have an interest in the topics discussed.
RSM US LLP is a limited liability partnership and the U.S. member firm of RSM International, a global network of independent audit, tax and consulting firms. The member firms of RSM International collaborate to provide services to global clients, but are separate and distinct legal entities that cannot obligate each other. Each member firm is responsible only for its own acts and omissions, and not those of any other party. Visit rsmus.com/aboutus for more information regarding RSM US LLP and RSM International.
RSM, the RSM logo and the power of being understood are registered trademarks of RSM International Association.
© 2020 RSM US LLP. All Rights Reserved. TRE-NT-ALL-ALL-0220
For more information on RSM, please visit rsmus.com.
For media inquiries, please contact Terri Andrews, national public relations director, +1 980 233 4710 or [email protected].
For more information on RSM thought leadership, please contact Deborah Cohen, thought leadership director, +1 312 634 3975 or [email protected].