
THE RARE BIOSPHERE A NEW PARADIGM FOR … RARE BIOSPHERE: A NEW PARADIGM FOR MICROBIOLOGY Status...
36
THE RARE BIOSPHERE: A NEW PARADIGM FOR MICROBIOLOGY Status Report: - November 1, 2011 The goals of this project include 1) exploring the distribution of microbial populations inclusive of very low-abundance taxa in fresh water distribution systems in Falmouth, MA and Boulder, CO, 2) modeling the occurrence of singletons in a large collection of pyrotags from many samples, 3) STAMPS - Strategies and Techniques for Analyzing Microbial Population Structures – an MBL workshop, 4) American Academy of Microbiology colloquium - The Rare Biosphere. 1. Distribution of Microbial Populations in Water Distribution Systems: The original experimental design outlined the monthly collection of water samples from 9 stations in the Falmouth Water supply over a two - three year period and the collection of a single set of samples from Boulder CO. When this project started, technology constrained pyrotag analyses to the V6 region. With the introduction of Titanium sequencing mid-way through the project, we could no longer collect very short V6 regions (a technical constraint imposed by the switch to sequencing kits and hardware required for Titanium chemistry). Instead we participated in a collaboration with Roche to develop and ground-truth amplicon sequencing of the V6-V4 region. The table shows the total number of pyrotags and samples collected over the course of the project thru October, 2011. Data sets tags V6 Falmouth 124 2,335,440 V6 Boulder 11 85,248 V6-V4 Falmouth 144 2,894,967 V6-V4 Boulder 9 240,000 All Samples 288 5,555,655 The surprising aspect of the overall dataset is the rapid change observed at all stations throughout the entire calendar year. In some cases it reflects pulses throughout the system of photosynthetic organisms – both cyanobacteria and eukaryotic chloroplasts. In other cases there were dominant pulses of Sphingomondales or non-human sources of Burkholderiales or Neisseria of non-human source. Shorter temporal samplings collected daily during late October, 2010 showed less chaotic behavior. The datasets are complex and they display numerous examples of pulses for taxa in successive months that could not be detected before or after the pulse. The panels shown below display examples of temporal change patterns over a 10-month period from North Falmouth Fire Station (NFF) and the MBL (Panel 1 and Panel 2) followed by a daily sampling collected from the Woods Hole Fire Station (WFS) over a 12 day period. Both temporal patterns display sudden changes in community composition as defined by composition and relative abundance. We do not believe these changes reflect technical artefacts. Panels 1 and 2 include technical excellent replicates for June 14 samples. One unanticipated result that we cannot yet explain includes a large population of
Transcript of THE RARE BIOSPHERE A NEW PARADIGM FOR … RARE BIOSPHERE: A NEW PARADIGM FOR MICROBIOLOGY Status...
THE RARE BIOSPHERE: A NEW PARADIGM FOR MICROBIOLOGY Status Report: - November 1, 2011
The goals of this project include 1) exploring the distribution of microbial populations inclusive of very low-abundance taxa in fresh water distribution systems in Falmouth, MA and Boulder, CO, 2) modeling the occurrence of singletons in a large collection of pyrotags from many samples, 3) STAMPS - Strategies and Techniques for Analyzing Microbial Population Structures – an MBL workshop, 4) American Academy of Microbiology colloquium - The Rare Biosphere. 1. Distribution of Microbial Populations in Water Distribution Systems: The original experimental design outlined the monthly collection of water samples from 9 stations in the Falmouth Water supply over a two - three year period and the collection of a single set of samples from Boulder CO. When this project started, technology constrained pyrotag analyses to the V6 region. With the introduction of Titanium sequencing mid-way through the project, we could no longer collect very short V6 regions (a technical constraint imposed by the switch to sequencing kits and hardware required for Titanium chemistry). Instead we participated in a collaboration with Roche to develop and ground-truth amplicon sequencing of the V6-V4 region. The table shows the total number of pyrotags and samples collected over the course of the project thru October, 2011. Data sets tags V6 Falmouth 124 2,335,440 V6 Boulder 11 85,248 V6-V4 Falmouth 144 2,894,967 V6-V4 Boulder 9 240,000 All Samples 288 5,555,655
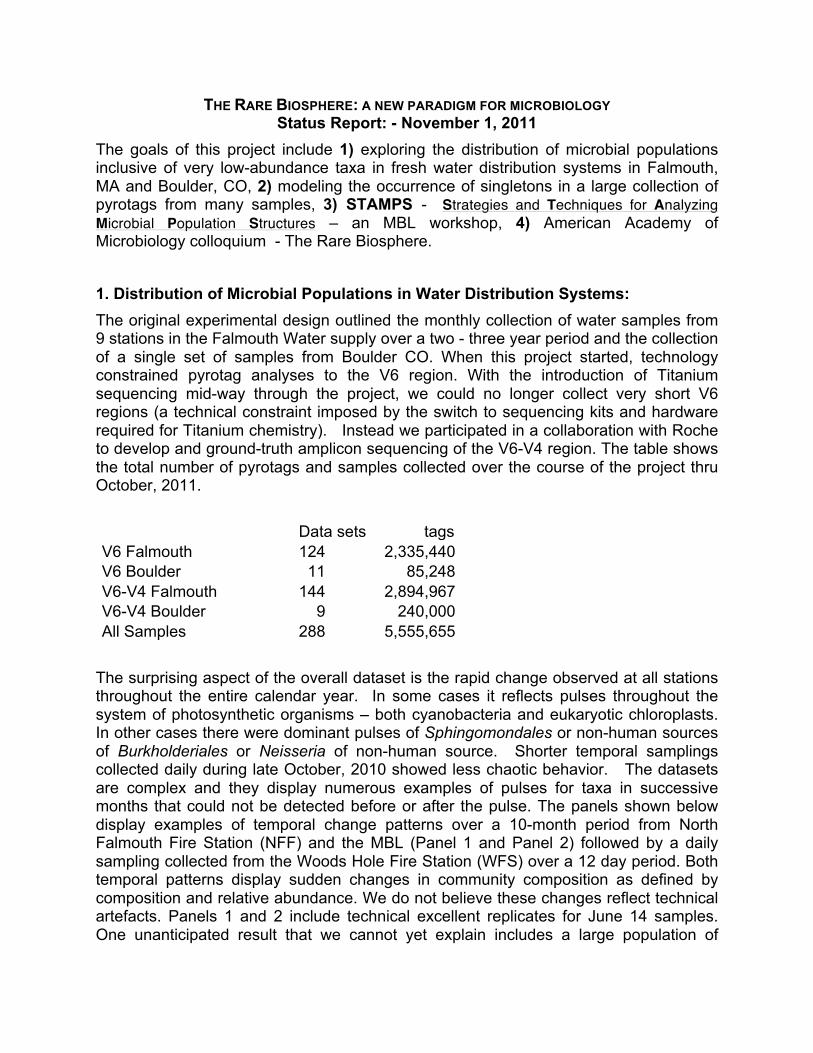
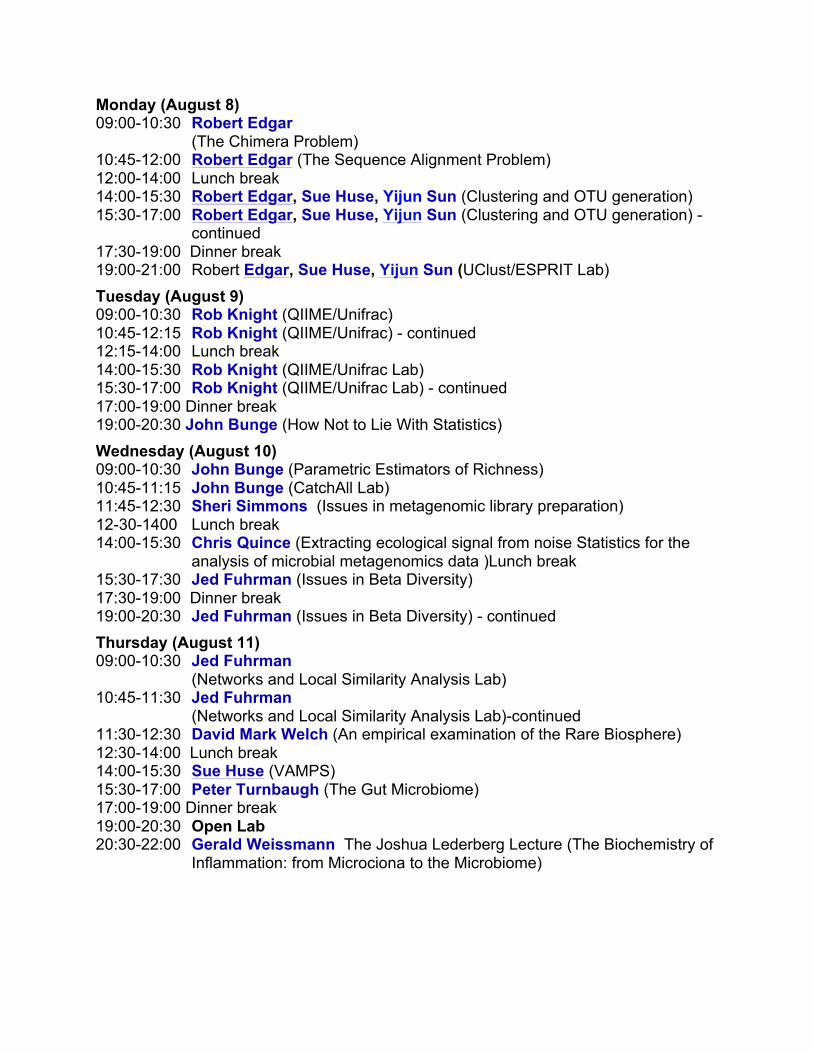
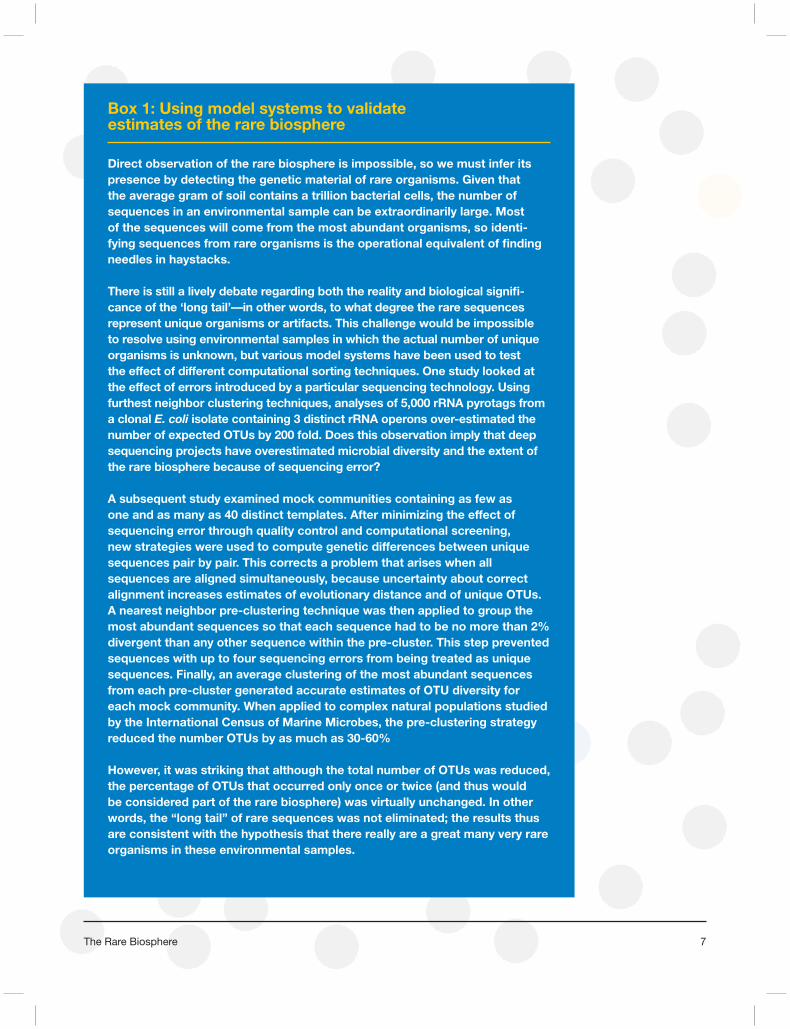
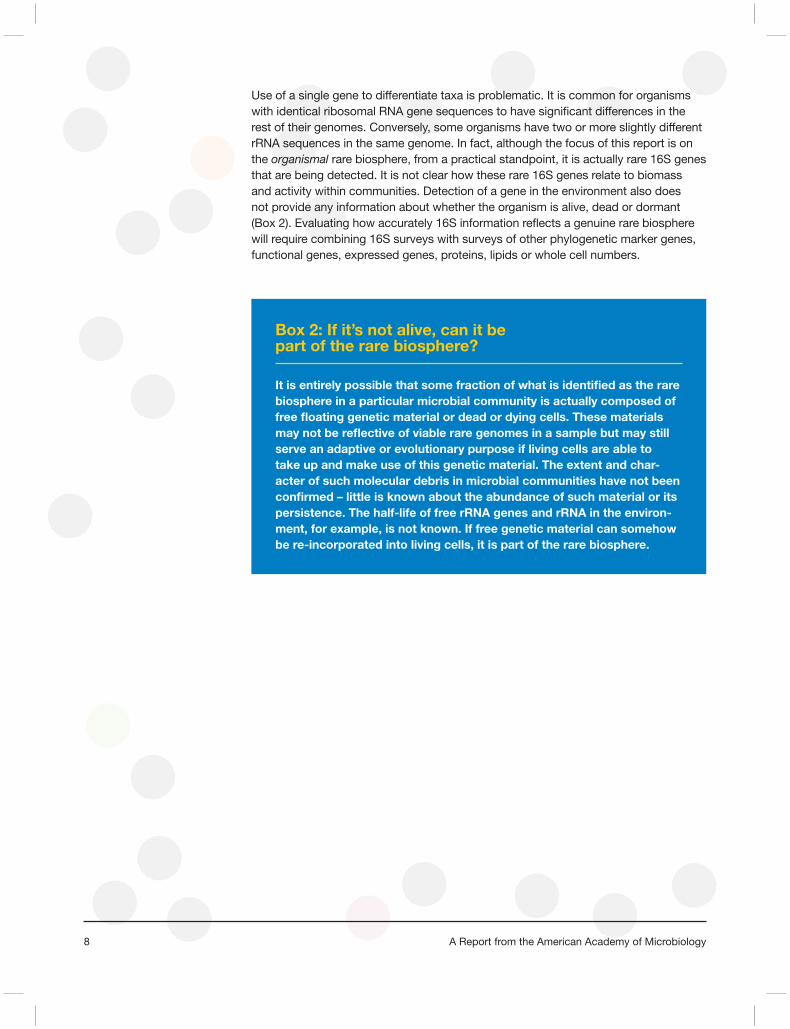
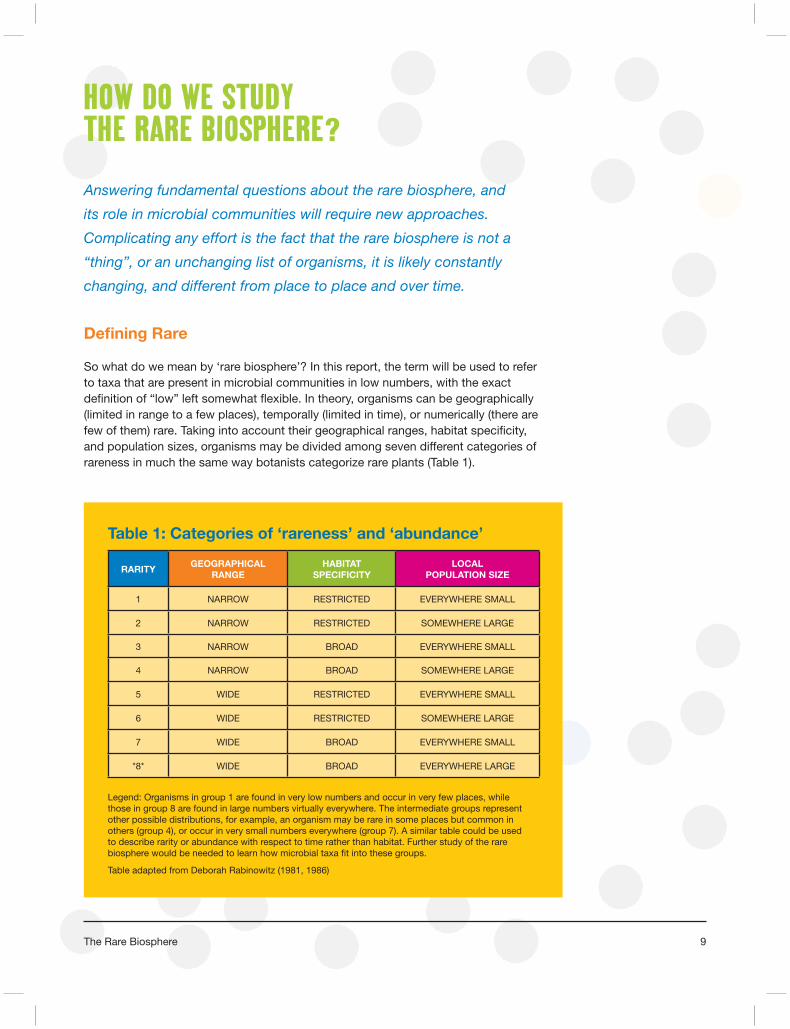
The surprising aspect of the overall dataset is the rapid change observed at all stations throughout the entire calendar year. In some cases it reflects pulses throughout the system of photosynthetic organisms – both cyanobacteria and eukaryotic chloroplasts. In other cases there were dominant pulses of Sphingomondales or non-human sources of Burkholderiales or Neisseria of non-human source. Shorter temporal samplings collected daily during late October, 2010 showed less chaotic behavior. The datasets are complex and they display numerous examples of pulses for taxa in successive months that could not be detected before or after the pulse. The panels shown below display examples of temporal change patterns over a 10-month period from North Falmouth Fire Station (NFF) and the MBL (Panel 1 and Panel 2) followed by a daily sampling collected from the Woods Hole Fire Station (WFS) over a 12 day period. Both temporal patterns display sudden changes in community composition as defined by composition and relative abundance. We do not believe these changes reflect technical artefacts. Panels 1 and 2 include technical excellent replicates for June 14 samples. One unanticipated result that we cannot yet explain includes a large population of
wolf
Text Box
SOGIN: RARE BIOSPHERE
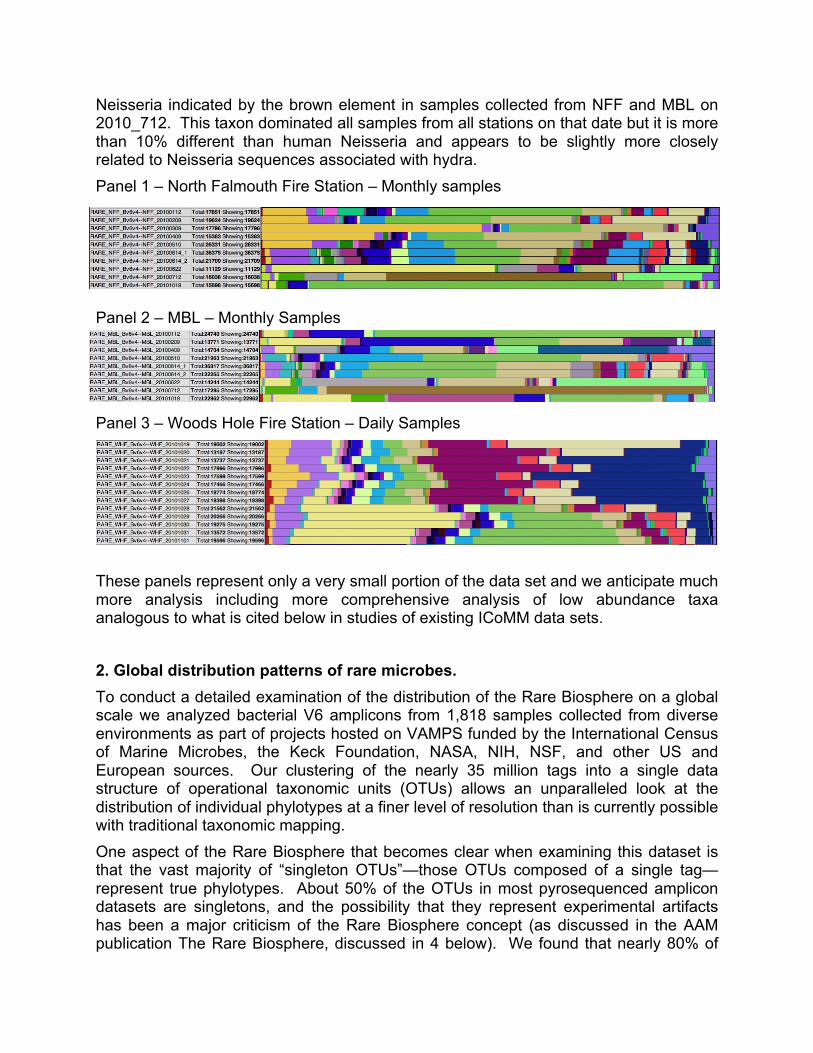
Neisseria indicated by the brown element in samples collected from NFF and MBL on 2010_712. This taxon dominated all samples from all stations on that date but it is more than 10% different than human Neisseria and appears to be slightly more closely related to Neisseria sequences associated with hydra. Panel 1 – North Falmouth Fire Station – Monthly samples
Panel 2 – MBL – Monthly Samples
Panel 3 – Woods Hole Fire Station – Daily Samples
These panels represent only a very small portion of the data set and we anticipate much more analysis including more comprehensive analysis of low abundance taxa analogous to what is cited below in studies of existing ICoMM data sets. 2. Global distribution patterns of rare microbes. To conduct a detailed examination of the distribution of the Rare Biosphere on a global scale we analyzed bacterial V6 amplicons from 1,818 samples collected from diverse environments as part of projects hosted on VAMPS funded by the International Census of Marine Microbes, the Keck Foundation, NASA, NIH, NSF, and other US and European sources. Our clustering of the nearly 35 million tags into a single data structure of operational taxonomic units (OTUs) allows an unparalleled look at the distribution of individual phylotypes at a finer level of resolution than is currently possible with traditional taxonomic mapping. One aspect of the Rare Biosphere that becomes clear when examining this dataset is that the vast majority of “singleton OTUs”—those OTUs composed of a single tag—represent true phylotypes. About 50% of the OTUs in most pyrosequenced amplicon datasets are singletons, and the possibility that they represent experimental artifacts has been a major criticism of the Rare Biosphere concept (as discussed in the AAM publication The Rare Biosphere, discussed in 4 below). We found that nearly 80% of

the singleton OTUs present in any one V6 amplicon dataset from marine samples were also present in another sample—often at high abundance. We also found that unique singleton OTUs—those that occur in only a single sample—are not significantly more frequent than unique OTUs composed of more than one tag. These finding strongly reinforce the validity of deep amplicon sequencing to monitor a biologically real Rare Biosphere. When examining the global distribution of OTUs certain patterns become apparent. Most significantly, all OTUs are rare in at least some environments. As can be seen in panel 4, within marine environments even the most frequently occuring OTUs are at times rare; in fact most are rare in 20-30% of the samples in which they are found. These same OTUs can make up more than 1% of the total community in other samples. Environment-specific patterns in the distribution of Rare Biosphere can be seen when this data is broken out into individual biomes such as epipelagic, mesopelagic, and bathypelagic ocean depths (not shown). Panel 4 – Frequency and Abundance of Bacterial Phylotypes. The 100 most frequently occurring phylotypes (3% OTUs) are shown with the proportion of times that each occurs at rare, low, medium, or high abundance, or is not found.
phylotypes
samples

3. STAMPS – Our original proposal described hosting an international meeting on the Rare Biosphere. However, with the increased usage of next generation sequencing in molecular microbial ecology, we requested and received permission to modify this objective by organizing a workshop at the MBL titled Strategies and Techniques for Analyzing Microbial Population Structures. The rapidly expanding flow of information from next generation DNA sequencing platforms has fueled healthy debate about best practices for data analysis while at the same time building a user demand for tools that can address important questions in microbial ecology. STAMPS consisted of lectures by experts in the analysis of molecular datasets and hands-on tutorials in use of computational packages by their designers, and emphasizes discussion and the exchange of ideas between faculty and students. The course served graduate students postdocs, and established faculty from around the world. We received more than 140 applications for sixty positions in the course. The course was very favorably reviewed by the students and if we are able to secure resources, we will offer the course in 2012. VAMPS: August 3-August 12 2011 Wednesday, 3 August 2011: Arrival and opening reception in the Meigs Room, Swope Building, 7pm - 9pm All Lectures and Labs are in Loeb G70hursday Thursday (August 4) 09:00-10:30 Mitch Sogin - Introduction 10:45-12:15 Antonis Rokas (Next Gen methods and applications) 12:15-14:00 Lunch break 14:00-15:30 Hilary Morrison (Amplicon generation and tag sequencing) 15:30-17:00 Sue Huse (NextGen QA/QC) 17:00-19:00 Dinner break 19:00-20:30 David Mark Welch and TAs (Unix tutorial) Friday (August 5) 09:00-10:30 Patrick Schloss (mothur lecture) 10:45-12:15 Patrick Schloss (mothur lecture) - continued 12:15-14:00 Lunch break 14:00-15:30 Patrick Schloss (mothur lecture) 15:30-17:00 Patrick Schloss (mothur lecture/lab) 17:00-19:00 Dinner break 19:00-20:30 Patrick Schloss (mothur lab) Saturday (August 6) 09:00-10:30 Christopher Quince (Noise removal from pyrosequenced amplicons ) 10:45-12:15 Christopher Quince (AmpliconNoise Lab) 12:15-14:00 Lunch break 14:00-15:30 Jim Cole (The RDP 454 pipeline and classifier) 15:30-16:30 Amy Apprill (Taxon identification and primer design with Arb) 16:30-18:30 Huse, Apprill, Cole GAST/Arb/RDP Lab 19:00-21:30 Course Banquet
Monday (August 8) 09:00-10:30 Robert Edgar
(The Chimera Problem) 10:45-12:00 Robert Edgar (The Sequence Alignment Problem) 12:00-14:00 Lunch break 14:00-15:30 Robert Edgar, Sue Huse, Yijun Sun (Clustering and OTU generation) 15:30-17:00 Robert Edgar, Sue Huse, Yijun Sun (Clustering and OTU generation) -
continued 17:30-19:00 Dinner break 19:00-21:00 Robert Edgar, Sue Huse, Yijun Sun (UClust/ESPRIT Lab) Tuesday (August 9) 09:00-10:30 Rob Knight (QIIME/Unifrac) 10:45-12:15 Rob Knight (QIIME/Unifrac) - continued 12:15-14:00 Lunch break 14:00-15:30 Rob Knight (QIIME/Unifrac Lab) 15:30-17:00 Rob Knight (QIIME/Unifrac Lab) - continued 17:00-19:00 Dinner break 19:00-20:30 John Bunge (How Not to Lie With Statistics) Wednesday (August 10) 09:00-10:30 John Bunge (Parametric Estimators of Richness) 10:45-11:15 John Bunge (CatchAll Lab) 11:45-12:30 Sheri Simmons (Issues in metagenomic library preparation) 12-30-1400 Lunch break 14:00-15:30 Chris Quince (Extracting ecological signal from noise Statistics for the
analysis of microbial metagenomics data )Lunch break 15:30-17:30 Jed Fuhrman (Issues in Beta Diversity) 17:30-19:00 Dinner break 19:00-20:30 Jed Fuhrman (Issues in Beta Diversity) - continued Thursday (August 11) 09:00-10:30 Jed Fuhrman
(Networks and Local Similarity Analysis Lab) 10:45-11:30 Jed Fuhrman
(Networks and Local Similarity Analysis Lab)-continued 11:30-12:30 David Mark Welch (An empirical examination of the Rare Biosphere) 12:30-14:00 Lunch break 14:00-15:30 Sue Huse (VAMPS) 15:30-17:00 Peter Turnbaugh (The Gut Microbiome) 17:00-19:00 Dinner break 19:00-20:30 Open Lab 20:30-22:00 Gerald Weissmann The Joshua Lederberg Lecture (The Biochemistry of
Inflammation: from Microciona to the Microbiome)

Friday (August 12) 09:00-10:30 Folker Meyer (Metagenomics) 10:45-12:15 Folker Meyer (MGRAST Lab) 12:15-14:00 Lunch break 14:00-15:30 Alice McHardy (Metagenomics)) 15:30-17:00 Alice McHardy (PhyloPythia Lab) 17:00-19:00 Dinner break 19:00-20:30 Open Lab – Wrap up 4) The final milestone was the publication of the proceedings of an American Academy Colloquium - The Rare Biosphere. The microbial world represents the last truly unexplored frontier in the diversity of life on Earth. New environmental sampling technologies have revealed a wealth of rare microbial species in the soil, ocean, even our own bodies that were effectively cloaked from previous sampling methods by more abundant species. Dubbed the rare biosphere, these microbial species, while individually rare, collectively account for more than 75% of the biomass of some microbial communities, yet little is known about them. This rare biosphere represents a treasure trove of genetic novelty that may possess numerous unique bioprocesses and biomaterials. These rare species may play keystone roles in microbial communities and act as a reservoir of genetic diversity. But how can scientists effectively study the rare biosphere? In April 2009 the American Academy of Microbiology convened a colloquium to explore this question. Based on that colloquium, this report analyzes the current state of study of the rare biosphere and identifies where gaps in knowledge exist. The report concludes that the Herculean task of studying the rare biosphere requires an international collaborative effort and additional environmental sampling, coupled with a focus on advancing sequencing and data analysis technologies. With less than 1% of microbial species able to be grown in the laboratory, the prospects of new discoveries in the rare biosphere seem as vast as microbial diversity itself.
A REPORT FROM THE AMERICAN ACADEMY OF MICROBIOLOGY
A Report from the American Academy of Microbiology
The Rare Biosphereby Ann Reid and Merry Buckley
This report is based on a colloquium convened by the American Academy of Microbiology on April 27-29, 2009 in San Francisco, CA.
The American Academy of Microbiology is the honorifi c leadership group of the American Society for Microbiology. The mission of the American Academy of Microbiology is to recognize scientifi c excellence and foster knowledge and understanding in the microbiological sciences.
The American Academy of Microbiology is grateful for the generosity of the Alfred P. Sloan Foundation for support of this project.
The opinions expressed in this report are those solely of the colloquium participants and do not necessarily refl ect the offi cial positions of the sponsor or the American Society for Microbiology.
Copyright ©2011
American Academy of Microbiology1752 N Street, NWWashington, DC 20036
www.asm.org
Participant list:
Co-ChairsThomas M.
Schmidt, Ph.D. Mitchell L. Sogin, Ph.D.
Steering CommitteeJulian Caley, Ph.D. Hugh Ducklow, Ph.D. Norman R. Pace, Ph.D. Larry Smarr, Ph.D.
Sponsor RepresentativePaula Olsiewski, Ph.D.,
Alfred P. Sloan Foundation
Academy StaffCarol Colgan, Director,
American Academy of Microbiology
Peggy McNult, Manager, American Academy of Microbiology
Merry Buckley, science writer
ParticipantsJohn A. Baross, Ph.D.Antje Boetius, Ph.D.John A. Bunge, Ph.D.Craig A. Carlson, Ph.D.David A. Caron, Ph.D.Tom P. Curtis, Ph.D.Jonathan Eisen, Ph.D.Claire M. Fraser-
Liggett, Ph.D.Jed Fuhrman, Ph.D.Paul Gilna, Ph.D.Adam Godzik, Ph.D.Julie A. Huber, Ph.D.David L. Kirchman, Ph.D.Ruth E. Ley, Ph.D.Anne E. Magurran, Ph.D.Margaret McFall-
Ngai, Ph.D.Victoria J. Orphan, Ph.D.Carlos Pedros-Alio, Ph.D.Martin F. Polz, Ph.D.Alban Ramette, Ph.D.David Relman, M.D.Pat Schloss, Ph.D.George F. Sprague, Ph.D.Matthew B. SullivanCurtis Suttle, Ph.D.David M. Welch, Ph.D.Rachel J. Whitaker, Ph.D.Alexandra Z.
Worden, Ph.D.

1The Rare Biosphere
EXECUTIVE SUMMARY
One might think that the age of great discoveries in biology is
past––that humans have been everywhere and seen everything on
Earth. But in fact, biology still boasts some formidable unknowns,
and many are now being explored in the once invisible world of
microbes. In the last 20 years, technological advances have made
it possible to explore a microbial world that has proven vastly more
extensive, important, and diverse than previously imagined. Analyses
of microbial communities in the soil, in the ocean, and even in the
human body, have shown that previous methods detected only a
tiny percentage of the different microbes in these environments. It
seems that each technological advance and every new environment
sampled reveal even greater diversity in the microbial world. Is there
a limit? How can the nature and extent of microbial diversity be
satisfactorily characterized? On a more fundamental level, how did
evolution generate such diversity, how is it maintained, and what are
its practical implications?
Molecular methods for analyzing microbial communities suggest that in addition to a few abundant microorganisms, which can exist at concentrations of thousands or even millions per liter of water or gram of sediment, nearly all microbial communities include many members that are rare. Thus, microbial communities are like libraries that contain hundreds of copies of a few books and a single copy each of thousands of others. In some cases, the rare groups in microbial communities can, collectively, comprise up to 75% of the biomass in their communities, and the total number of genomes represented in this fraction is potentially huge. An emerging term for these groups is “the rare biosphere”.
In April, 2009, the American Academy for Microbiology convened a colloquium in San Francisco, California to review the current state of research on the rare biosphere and describe knowledge gaps on which to focus future work to move our understanding of these taxa forward. This document summarizes those discussions.
Indeed, much remains to be learned about the rare biosphere. It is not known, for example, whether there are some groups that are always rare, in every environ-ment—in other words, groups for which “rareness” is an evolutionarily conserved way of life. Whether the rare groups are transient or persistent in any given commu-nity also is not clear. Some groups that are rare in one environment may be abundant in others, or groups that are rare under certain conditions may become abundant
2 A Report from the American Academy of Microbiology
when conditions change. These open questions suggest that defi ning particular groups as “rare” and others as “non-rare” will be context-dependent.
The number of different habitats in which microbial assemblages are found is vast; not only does every environment––sea, soil, building surface, even cloud––host a variety of different microbial communities, so does every animal and plant. If, as is likely, the rare biosphere is made up of different groups in each of these habitats, it represents a truly staggering potential reservoir of genetic diversity.
Humans are host to many different microbial communities that live on our skin, in our guts, in our mouths and elsewhere. Collectively called the human microbiome––these microbial communities are increasingly being shown to be critical to human health and well-being. Thus, in addition to roles the rare biosphere may play in the environ-ment, further study of the rare biosphere portion of the human microbiome could provide insights into such issues as hygiene theory, infections in infancy, gut metha-nogenesis, and the impacts of commensal diversity on human health and disease.
The consistent detection of a large number of rare groups in most microbial assem-blages could have signifi cant fundamental and practical implications and suggests that they have a role to play in microbial community dynamics. They may carry out keystone physiological functions, maintain community-level function in the face of environmental change, or serve as a reservoir of genetic resources that can provide novel material to the community as needed.
The most appropriate spatial and temporal scales for exploring the dynamics and functional role of the rare biosphere will vary for different habitats. Appropriate specifi c experimental strategies will be required to explore microbial diversity in all potential habitats, but in general, more intensive, or “deep” sequencing than is typical of microbial community analysis, and repeated sampling over time will likely be needed in order to better capture community dynamics and explore the temporal stability of the rare biosphere.
To address these questions research should focus on the spatial and temporal distribution of rare taxa, their functional and ecological roles, and evolutionary mechanisms that maintain a rare biosphere of highly diverse, low abundance micro-bial populations. These investigations must also assess how varying sampling and extraction techniques might affect our understanding of the rare biosphere.
The consistent
detection of a
large number of
rare groups in
most microbial
assemblages could
have signifi cant
fundamental
and practical
implications and
suggests that
they have a role to
play in microbial
community
dynamics.

3The Rare Biosphere
INTRODUCTION
There are ten-million-fold more bacterial and archaeal cells on our
small planet than there are stars in the visible universe, and they may
contain as much carbon as all plant and animal life put together. The
microbial world is vast in size and diversity, but the microbes we know
about account for only a tiny fraction of that immense total. We’re
only beginning to see the tip of the iceberg with respect to microbial
diversity. During the past 20 years, studies using molecular methods
for analyzing microbial population structures have revealed so many
microorganisms with so many incredible combinations of forms
and functions that it’s proving diffi cult even to fi nd a rational and
consistent way to categorize or name them all.
Traditional methods of characterizing microbes relied on observing such properties of microbes in pure culture as size, shape, and nutrient requirements. The advent of DNA sequencing technologies spurred two major revelations: fi rst, morphological characteristics were not a reliable indicator of genetic relatedness, and second, there were many times more different kinds of microbes than had ever been observed in laboratory culture. Current estimates are that less than 1% of microbes can be grown in the lab.
One sequencing approach that has been applied to studying microbial communi-ties relies on sequencing genes shared by all organisms. In these environmental gene surveys, each unique variant of a shared gene found in an environmental DNA sample serves as a proxy for the occurrence of a unique type of organism and its clonal relatives. Early efforts in characterizing complex microbial communities in this way generally described genes for only a few percent of the most abundant organ-isms, providing rather limited information about community structure and dynamics. Still, sequencing of shared genes allows broad shifts of community composition under different conditions to be detected. Studies in mice, for example, show that as mice lose weight, the percentage of their associated microbial community in the gut made up of the group Bacteriodetes increases from a few percent to around 20%, with the percentage of Firmicutes dropping by an equal amount (Ley, 2006).
Another approach to studying microbial community structure, shotgun metage-nomics, attempts to sequence of all genetic materials from all the microbes in a particular environment. Shotgun metagenomic sequencing can identify genes that are responsible for critical microbial community functions and it is sometimes possible to associate those genes with specifi c taxa. For example, in a microbial community living in highly acidic mine drainage, the species Leptospirillum ferrodi-azotrophum, which accounts for less than 10% of the community biomass, is solely responsible for nitrogen fi xation (Tyson, 2005). However, with current techniques, a fi ner-grained understanding of community structure-function remains elusive.
4 A Report from the American Academy of Microbiology
Environmental gene surveys, in which specifi c genes are sequenced from all microbes in an environment, provide a thorough census of microbial communities and have revealed some intriguing patterns. In addition to detecting many nearly identical examples of a given target gene from plentiful community members, these sequencing experiments are also fi nding a large number of targeted gene sequences that differ from the majority of sequences but appear infrequently, suggesting that they represent sequences from rare members of the community. What this report explores is the extent and signifi cance of this fi nding––that microbial communi-ties appear to include a very large number of members that are present in very low numbers: in short, a rare biosphere.
5The Rare Biosphere
WHY STUDY THE RARE BIOSPHERE?
There are several compelling arguments for studying the rare
biosphere and its roles in the environment and human health:
■ The rare biosphere may represent an enormous pool of unexplored genetic and physiological diversity on the planet. Currently, we have accessed far less than 1% of the genetic diversity of life on Earth; our antibiotics, our evolutionary perspective, our biotechnology, are all based on only a small portion of the potential diversity on the planet. We need to explore the other 99%. There are examples in which novel properties have been found in rare organisms. Tapping the reservoir of diversity in the rare biosphere may offer wonderful possibilities for discovery and provide novel approaches to the production of such resources as biofuels, pharmaceuticals and other biomaterials.
■ The rare biosphere may be the microbial world’s equivalent of heterozygocity in the multicellular world. The genetic variation generated by sexual reproduction in animals and plants helps them survive threats of extinction caused by disease or major shifts in environmental conditions. In an analogous manner, lateral gene transfer mechanisms between microorganisms provide access to the genetic variability of the microbial realm. The well of genetic complexity found in the rare biosphere might serve as an inexhaustible source of novel genes to help microbial communities adapt to environmental conditions of the future.
■ Study of the rare biosphere could inform other areas of science and biology. Are there new fundamental laws that govern microbial diversity? This would be important to know for understanding the human microbiome and some chronic and rare diseases, for example.
■ The rare biosphere may serve an important role in biological interaction and succession of different taxa in microbial communities. Do members of the rare biosphere become more abundant in response to shifting environmental contexts and how does this infl uence the relative abundances of other taxa in complex communities? For instance, understanding such interactions could explain transient and long-term impacts of antibiotic treatment.
Microbial ecologists seldom focus their efforts on the rare biosphere. The microbes that make up the rare biosphere may be diffi cult to detect and study in their natural habitat, and their low numbers imply transience or a minor role in microbially medi-ated processes. But many of these microbes bear utterly novel physiologies and functions that might serve important roles in microbial communities. To understand the natural microbial world, it will be necessary to explore the rare biosphere using tractable experimental approaches, aiming to identify the roles these organisms play, and establishing predictive power so that we may understand and harness the capacities of these organisms in the future.
6 A Report from the American Academy of Microbiology
FIRST STEPS: DEFINING THE RARE BIOSPHERE
The existence of a rare biosphere in animal, plant and microbial
communities has raised some profound biological questions with
important implications for nature conservation, medicine and other
fi elds of societal relevance. Defi ning the rare biosphere in microbial
communities is a major challenge, both because the composition
of microbial communities is constantly changing, and because
the methods we use to analyze microbial communities require
careful application and interpretation. Before we can determine the
implications and importance of the rare biosphere, research must
address these questions.
To determine whether a particular microorganism is rare or abundant, we must be able to distinguish the different types represented in the environment. Because the concept of species is, for a number of reasons, problematic when used to categorize microbes, microbiologists compare sequences of highly conserved genes to differ-entiate unique organisms–skirting the problem of whether they represent “species”. Sequences are compared using phylogenetics––a bioinformatic tool that arranges sequences into trees showing the sequences’ degree of relatedness. Each branch of the tree represents a unique phylogenetic type, or phylotype. Independent of the molecular method used, the aim is to identify all of the different sequence variants in the community under investigation. These sequence variants refl ect the abun-dance of different phylotypes and can be defi ned as “operational taxonomic units” (OTUs). Sequences from closely related organisms will be similar, with the number of sequence differences providing a rough measure of evolutionary distance. If the sequences differ by more than a pre-determined threshold, they are considered to represent unique phylotypes or OTUs. Depending on the threshold used, similar phylotypes can be combined to different taxonomic levels. Microbiologists have commonly relied upon 16S ribosomal RNA genes to defi ne evolutionary relationships among Bacteria, Archaea and Eukarya.
Early evidence of the rare biosphere was found in rank abundance curves for OTUs –– graphs that describe the relative abundance of different microbes in an envi-ronment. In rank abundance curves, the most common OTU is ranked fi rst, then the next most common, and so on, with the rare taxa, represented by just a few members, making up the tail of the curve. Rank abundance curves can look quite different from one ecosystem to another and ecologists use them to compare ecosystems to each other and over time. The rank abundance curves generated by deep sequencing of microbial communities reveal a surprising number of very low abundance phylotypes that form a seemingly inexhaustible “long tail” in the taxon distribution curve.
7The Rare Biosphere
Box 1: Using model systems to validate estimates of the rare biosphere
Direct observation of the rare biosphere is impossible, so we must infer its presence by detecting the genetic material of rare organisms. Given that the average gram of soil contains a trillion bacterial cells, the number of sequences in an environmental sample can be extraordinarily large. Most of the sequences will come from the most abundant organisms, so identi-fying sequences from rare organisms is the operational equivalent of fi nding needles in haystacks.
There is still a lively debate regarding both the reality and biological signifi -cance of the ‘long tail’—in other words, to what degree the rare sequences represent unique organisms or artifacts. This challenge would be impossible to resolve using environmental samples in which the actual number of unique organisms is unknown, but various model systems have been used to test the effect of different computational sorting techniques. One study looked at the effect of errors introduced by a particular sequencing technology. Using furthest neighbor clustering techniques, analyses of 5,000 rRNA pyrotags from a clonal E. coli isolate containing 3 distinct rRNA operons over-estimated the number of expected OTUs by 200 fold. Does this observation imply that deep sequencing projects have overestimated microbial diversity and the extent of the rare biosphere because of sequencing error?
A subsequent study examined mock communities containing as few as one and as many as 40 distinct templates. After minimizing the effect of sequencing error through quality control and computational screening, new strategies were used to compute genetic differences between unique sequences pair by pair. This corrects a problem that arises when all sequences are aligned simultaneously, because uncertainty about correct alignment increases estimates of evolutionary distance and of unique OTUs. A nearest neighbor pre-clustering technique was then applied to group the most abundant sequences so that each sequence had to be no more than 2% divergent than any other sequence within the pre-cluster. This step prevented sequences with up to four sequencing errors from being treated as unique sequences. Finally, an average clustering of the most abundant sequences from each pre-cluster generated accurate estimates of OTU diversity for each mock community. When applied to complex natural populations studied by the International Census of Marine Microbes, the pre-clustering strategy reduced the number OTUs by as much as 30-60%
However, it was striking that although the total number of OTUs was reduced, the percentage of OTUs that occurred only once or twice (and thus would be considered part of the rare biosphere) was virtually unchanged. In other words, the “long tail” of rare sequences was not eliminated; the results thus are consistent with the hypothesis that there really are a great many very rare organisms in these environmental samples.
8 A Report from the American Academy of Microbiology
Use of a single gene to differentiate taxa is problematic. It is common for organisms with identical ribosomal RNA gene sequences to have signifi cant differences in the rest of their genomes. Conversely, some organisms have two or more slightly different rRNA sequences in the same genome. In fact, although the focus of this report is on the organismal rare biosphere, from a practical standpoint, it is actually rare 16S genes that are being detected. It is not clear how these rare 16S genes relate to biomass and activity within communities. Detection of a gene in the environment also does not provide any information about whether the organism is alive, dead or dormant (Box 2). Evaluating how accurately 16S information refl ects a genuine rare biosphere will require combining 16S surveys with surveys of other phylogenetic marker genes, functional genes, expressed genes, proteins, lipids or whole cell numbers.
Box 2: If it’s not alive, can it be part of the rare biosphere?
It is entirely possible that some fraction of what is identifi ed as the rare biosphere in a particular microbial community is actually composed of free fl oating genetic material or dead or dying cells. These materials may not be refl ective of viable rare genomes in a sample but may still serve an adaptive or evolutionary purpose if living cells are able to take up and make use of this genetic material. The extent and char-acter of such molecular debris in microbial communities have not been confi rmed – little is known about the abundance of such material or its persistence. The half-life of free rRNA genes and rRNA in the environ-ment, for example, is not known. If free genetic material can somehow be re-incorporated into living cells, it is part of the rare biosphere.
9The Rare Biosphere
HOW DO WE STUDY THE RARE BIOSPHERE?
Answering fundamental questions about the rare biosphere, and
its role in microbial communities will require new approaches.
Complicating any effort is the fact that the rare biosphere is not a
“thing”, or an unchanging list of organisms, it is likely constantly
changing, and different from place to place and over time.
Defi ning Rare
So what do we mean by ‘rare biosphere’? In this report, the term will be used to refer to taxa that are present in microbial communities in low numbers, with the exact defi nition of “low” left somewhat fl exible. In theory, organisms can be geographically (limited in range to a few places), temporally (limited in time), or numerically (there are few of them) rare. Taking into account their geographical ranges, habitat specifi city, and population sizes, organisms may be divided among seven different categories of rareness in much the same way botanists categorize rare plants (Table 1).
Table 1: Categories of ‘rareness’ and ‘abundance’
Legend: Organisms in group 1 are found in very low numbers and occur in very few places, while those in group 8 are found in large numbers virtually everywhere. The intermediate groups represent other possible distributions, for example, an organism may be rare in some places but common in others (group 4), or occur in very small numbers everywhere (group 7). A similar table could be used to describe rarity or abundance with respect to time rather than habitat. Further study of the rare biosphere would be needed to learn how microbial taxa fi t into these groups.
Table adapted from Deborah Rabinowitz (1981, 1986)
RARITYGEOGRAPHICAL
RANGEHABITAT
SPECIFICITYLOCAL
POPULATION SIZE
1 NARROW RESTRICTED EVERYWHERE SMALL
2 NARROW RESTRICTED SOMEWHERE LARGE
3 NARROW BROAD EVERYWHERE SMALL
4 NARROW BROAD SOMEWHERE LARGE
5 WIDE RESTRICTED EVERYWHERE SMALL
6 WIDE RESTRICTED SOMEWHERE LARGE
7 WIDE BROAD EVERYWHERE SMALL
*8* WIDE BROAD EVERYWHERE LARGE

10 A Report from the American Academy of Microbiology
Though these defi nitions of “rare” are useful, it is easier to defi ne what is not rare: taxa that represent more than 0.1-1% of the total number of organisms in a given microbial community are not rare. Explorations of the rare biosphere are still in the early stages, and it is too soon to defi ne a fi xed threshold of abundance to separate rare taxa from abundant ones. At this stage, thresholds would not be particularly useful, since they would by necessity be based on arbitrary distinctions or technology, and not on biology. The fi rst order of business is to learn more about the distribution of organ-isms in the rare biosphere, then see if fi xed thresholds make sense. It may eventually be possible to defi ne “rare taxa” by a biological parameter, but for now, it is best to let the environment or the question under investigation defi ne the threshold, then test with multiple methods and at different taxonomic levels.
Experimental approaches to defi ning the rare biosphere
Microbiologists are just becoming aware of the extent of the rare biosphere, so an important fi rst step in research must be a systematic survey that gathers more temporal and spatial resolution at different taxonomic levels. This task is essential for defi ning this fi eld of study and determining the membership of the rare biosphere.
To ensure the rare biosphere is not an artifact of the molecular methods we use in community analysis, we need to think about other ways of studying the rare biosphere in addition to deep sequencing. Researchers can use currently avail-able tools to establish what portion of the rare biosphere is alive and essential. For example, the combination of molecular probes with imaging, for example combinato-rial Fluorescence In Situ Hybridization (FISH), could be used to visualize rare cells.1 To better understand the relative sizes of viable, dormant, and dead cells and viruses in the rare biosphere, we can use methods like cell-sorting and magnetic capture to enrich for rare organisms in a community and get rid of numerically dominant members. Follow-up work should:
■ Test the hypothesis that the rare biosphere contains many dead cells: ■ Characterize the community using 16S rDNAand rRNA profi ling techniques, ■ Conduct live/dead stain of the community, ■ Separate dead and live cells via cell sorting, ■ Characterize dead and live fractions using the
same 16S rDNA technique, and ■ Compare the live and dead profi les. ■ This type of investigation could go to the next level by applying
metagenomics to explore the live and dead fractions.
■ Test the hypothesis that many cells in the rare biosphere are dormant: ■ Develop new methods to differentiate dormant cells from dead or alive. ■ Determine whether members of the rare biosphere are
metabolically active or capable of increasing in numbers. ■ Examine the persistence of rare taxa in chemostat dilution
studies to determine whether members of the rare biosphere are metabolically active and capable of producing progeny.
1 Fluorescence In Situ Hybridization (FISH) is a technique in which DNA probes are fl uorescently labeled and bound to cells; cells containing DNA that matches the probe are then visible under the microscope.

11The Rare Biosphere
Where does the rare biosphere come from?
Some taxa that are rare in a particular environment may have originated from places in which they were abundant, reaching their current location by dispersal. Although dispersal is probably not an adequate explanation for all rare taxa (since there are examples of taxa that are globally distributed and rare), there is evidence that certain taxa, like Escherichia coli and symbiotic vibrios, for example, disperse from their native locales and become part of the rare biosphere in exactly this manner.
The possibility that microbes may disperse from endemic sites and become rare raises the possibility that there are many endemic sites of which we are not yet aware. For example descriptions of the rare biosphere in globally distributed marine sites correspond to the sampling of only 1 part out of 1018 parts of the ocean. If the rare biosphere refl ects dispersal from indigenous sites the number of potential microbial niches would be staggering. Potential sites include microbial communi-ties that live in association with animals––to what degree are microbes dispersed via excretion just as birds disperse plant seeds? We probably won’t establish all these environments or microenvironments simply through surveys; other approaches or experiments may be necessary to locate and defi ne endemic sites. Also, if we do locate endemic sites of high abundance, we should not automatically assume that rare occurrences of those taxa elsewhere are always due to dispersal, since these taxa may grow and persist at low abundance.
Experimental approaches to determining where the rare biosphere comes from might include:
■ Increasingly frequent sampling in situ, which may also provide insights into the mechanisms that maintain rare biospheres,
■ Laboratory mesocosm (experimental ecosystems of moderate complexity) experiments that follow the rare biosphere through time, and
■ Close examination of diversity within a taxon. If the rare biosphere of a particular location is locally maintained, founder effects should make it genetically homogeneous. In contrast, a diverse population would indicate that the rare biosphere is regularly replenished by new arrivals.
Characterizing Richness and Evenness
Richness and evenness are terms ecologists use to characterize the distribution of species in an ecosystem. Richness is a measure of how many species are present, while evenness measures how population numbers vary from species to species. Traditional ecological measures of community diversity are predicated on the notion of discrete and identifi able species or other categories of taxonomic relatedness. However, setting a specifi c limit on the amount of genetic or phenotypic divergence necessary to distinguish between microbial species or populations is problematic because genes can move laterally between microorganisms. Consequently, the pool of genes potentially available to any particular species is far larger than in any indi-vidual representative of that species. It is unclear how often such transfers happen and to what extent these genome remodeling processes redefi ne evolutionary
The pool of
genes potentially
available to any
particular species
is far larger than
in any individual
representative
of that species.
12 A Report from the American Academy of Microbiology
distances between genomes. Furthermore the frequency of gene transfer processes may be different for eukaryotes, bacteria, and archaea, or even for different lineages within these domains. There is currently no single acceptable defi nition of species or other taxonomic units for microorganisms that can be applied to measure commu-nity richness or evenness. Since there is no one-size-fi ts-all way to characterize the diversity of microbial communities, the rare biosphere concept, too, remains a work in progress.
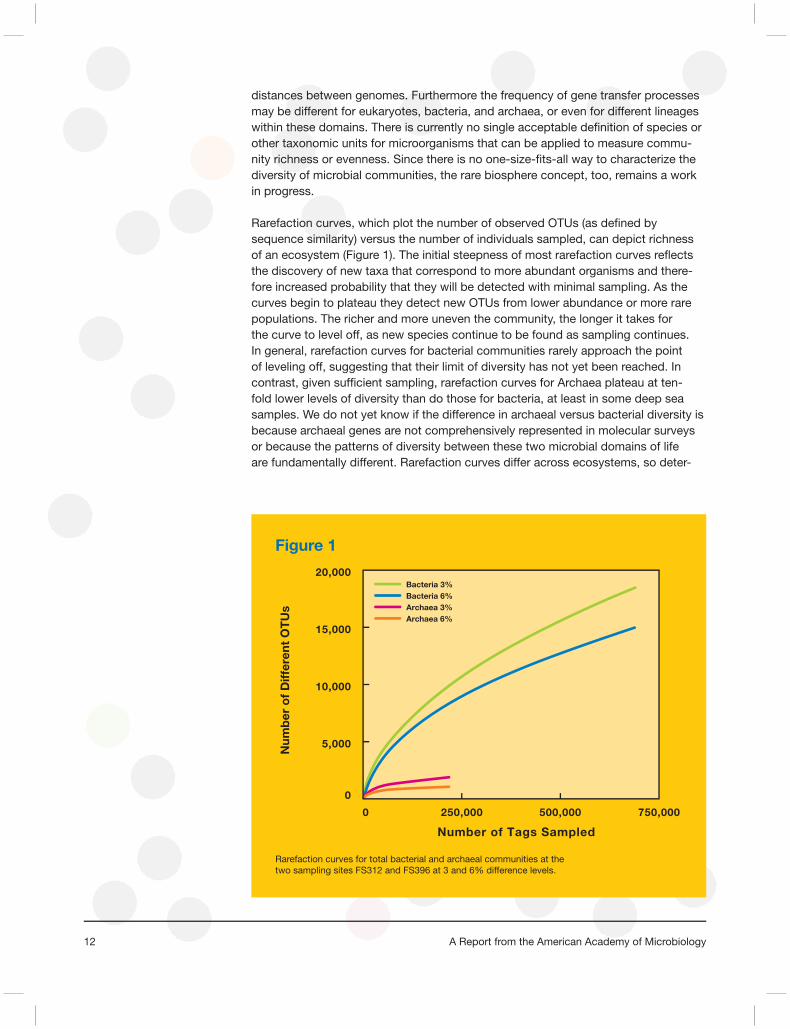
Rarefaction curves, which plot the number of observed OTUs (as defi ned by sequence similarity) versus the number of individuals sampled, can depict richness of an ecosystem (Figure 1). The initial steepness of most rarefaction curves refl ects the discovery of new taxa that correspond to more abundant organisms and there-fore increased probability that they will be detected with minimal sampling. As the curves begin to plateau they detect new OTUs from lower abundance or more rare populations. The richer and more uneven the community, the longer it takes for the curve to level off, as new species continue to be found as sampling continues. In general, rarefaction curves for bacterial communities rarely approach the point of leveling off, suggesting that their limit of diversity has not yet been reached. In contrast, given suffi cient sampling, rarefaction curves for Archaea plateau at ten-fold lower levels of diversity than do those for bacteria, at least in some deep sea samples. We do not yet know if the difference in archaeal versus bacterial diversity is because archaeal genes are not comprehensively represented in molecular surveys or because the patterns of diversity between these two microbial domains of life are fundamentally different. Rarefaction curves differ across ecosystems, so deter-
Figure 1
Rarefaction curves for total bacterial and archaeal communities at the two sampling sites FS312 and FS396 at 3 and 6% difference levels.
Bacteria 3%Bacteria 6%Archaea 3%Archaea 6%
20,000
250,000 500,000 750,000
15,000
10,000
5,000
0
0
Num
ber
of
Diff
eren
t O
TU
s
Number of Tags Sampled

13The Rare Biosphere
mining what portion of a curve represents rare organisms will have to be conducted on a case-by-case basis. Furthermore, sampling methodologies can make a major difference in how many taxa are detected, as can changes in the parameters used to analyze the data. Explicit descriptions of sampling and analysis techniques will be critical in order to compare results in different microbial communities.
The richness and evenness of a community’s composition can affect the detection and magnitude of that community’s rare biosphere. In some communities with only a few highly abundant taxa, the long tail that represents the rare biosphere may or may not be present. For example, the squid Euprymna has a specialized organ for producing light—the light is actually produced by a specifi c type of bacteria that live in the light organ. There are no other inhabitants, so this is an example of a simple microbial community that appears to lack a rare biosphere. Interestingly, the specifi c bacterial species that colonizes newborn squid and triggers the development of the light organ is quite rare in the surrounding seawater, thus, this species moves from the rare biosphere in one environment to dominance in another (Nyholm and McFall-Ngai 2007). In some other relatively simple microbial communities, like the ones that live in highly acidic mine drainages of Iron Mountain or the Rio Tinto of Southwestern Spain, determining whether or not there is a rare biosphere is diffi cult because the few abundant taxa make up such a huge proportion of sequences found in metagenomic analysis that low abundance taxa are obscured. Extremely extensive sequencing is required to detect the extent and composition of the rare biosphere in such communities.
The shape of rank-abundance and rarefaction curves will depend on how ‘species’ ––or, in the case of microbial communities, OTUs,––are defi ned. Depending on which gene, or set of genes, is sampled, the shape of the curves could change. Ultimately, the best way to characterize the richness and evenness of microbial communities will depend on the specifi c questions being asked of the data, so researchers may need to apply different OTU defi nitions for different groups or environments, and state, upfront, the defi nition employed in any particular study.
How does the rare biosphere vary from place to place?
Much about the spatial distribution of the rare biosphere, including whether these taxa are rare wherever they are found, whether they may be both rare and widely distributed, or follow other patterns defi ned in Table 1, remains a mystery. Existing data sets indicate that long tails of rare taxa are not found everywhere. Habitat conditions that seem to restrict the number of rare taxa include:
■ High selectivity,
■ Stability,
■ Isolation from immigration, and
■ Perfect utilization of all resources.
Since the rare biosphere exhibits these spatial patterns, there must be ecological controls on the distributions of these taxa. Some habitats may not exhibit the

14 A Report from the American Academy of Microbiology
conditions necessary for sustaining rare taxa; the size of the rare biosphere (if any) probably forms a continuum across different environments.
Environments in which novelty and evolution are not favored are less likely to house rare taxa. For example, obligate endosymbioses, some epibionts (organisms that live on the surface of other organisms) and environments with temperature or pH extremes may have fewer rare taxa than other, more variable and diverse environments.
Sampling of most microbial communities is challenging because relatively little is known about the spatial scale across which the communities vary, but what little is known suggests that the spatial scale can vary dramatically. Studies of the human mouth, for example, have shown that different surfaces of the same tooth have distinguishable microbial communities (Zaura 2009), while in the open ocean microbial communities may be stable across many kilometers. The right sample size will therefore differ depending on the community of interest. The spatial scales that are most suitable for any given study are not always known at the outset, but there are strategies for determining this by examining the questions to be addressed, the system, and the species of interest. Adaptive cluster sampling, for instance, takes into account variations found in initial samples and adjusts subsequent sampling strategy accordingly. It is worth noting that sampling of the rare biosphere is further complicated by the presence of microhabitats: taxa may be numerically rare in a sample, but numerous in a specifi c microhabitat within the sample.
How does the rare biosphere vary over time?
As with spatial scales, the most appropriate temporal scales for exploring the rare biosphere are dependent upon the question, the system, and the taxa of interest. It may be possible to apply adaptive cluster sampling on a temporal scale to determine the appropriate scales.
As for the possible temporal trends in the rare biosphere, we do not yet know enough to discern any patterns between rarity and growth rate. Some rare taxa may be fast growers that are continually reintroduced to niches where they then quickly die, or slow growers that persist in ecosystems, or rarity may have no consistent relationship with growth rate. The rare biosphere probably includes host-associated microbes dispersed from the guts of plankton and other organisms in the oceans, for example, and via animal waste, wind-blown seeds and other mechanisms on land. In such cases, the time scale for detecting these microbes in the rare biosphere would be related to when the host or carrier is present, which could vary by time of day, season, or migration route.
Studies of microbial ecology, in general, need to include more sampling over time, in order to better capture community dynamics and explore the temporal stability of the rare biosphere on a system-by-system basis at a wide variety of temporal scales. There are many examples of huge temporal changes in microbial communi-ties, and very few organisms are present at all times – even abundant organisms can disappear from sampling sets. Examples from the human microbiome, for example, suggest there is tremendous natural variation in abundance, even in the absence of experimental perturbation. Hence, defi ning “rare” requires multiple measures at
Studies of the
human mouth,
for example, have
shown that different
surfaces of the
same tooth have
distinguishable
microbial
communities
(Zaura 2009),
while in the open
ocean microbial
communities may
be stable across
many kilometers.
15The Rare Biosphere
different spatial and temporal points. What appears to be abundant in one single experiment may actually be rare most of the time or vice versa.
How do organisms remain rare?
There are a number of possible mechanisms by which rare taxa can remain rare, all of which are strongly intermingled in nature, including dispersal, physiological mechanisms, resource limitation, occupation of microenvironments, and interactions with other populations.
As discussed in the previous section, some members of the rare biosphere may be rare by virtue of dispersal or dilution from sites where they are abundant and are main-tained in the communities they fi nd themselves in by ongoing reintroduction. Learning to differentiate between rare biosphere taxa that occupy a niche in their community and transient, reintroduced populations will be an important area of research .
Physiological mechanisms that may help keep a taxon rare include:
■ Suppression of certain community members by chemical signals from others (eg. Quorum sensing molecules),
■ Low metabolic or growth rates relative to the dominant members,
■ Balance between growth and removal rates, and
■ Specialization in substrates or habitats.
Limitations in resources like nutrients, energy sources, and niches can also play a role in maintaining rare populations. We know very little about competition for substrates and specialization of microbes for substrates that are always rare. For substrates that are not necessarily rare, two taxa in direct competition can both be rare if they are both affected by another outside factor. For example, two rare competing strains with the same phenotype in sewage sludge could exhibit cycles of high and low abun-dance due to the antagonistic activity of strain-specifi c bacteriophage.
Though sampling may lump them together for analysis and obscure their physical separation in situ, some taxa may specialize in occupying rare, physically isolated microenvironments within communities. Occupying isolated niches would remove these taxa from direct competition with more abundant rivals and allow them to persist in low abundance. In this scenario, abundant, successful species would never be completely effective at outcompeting inferiors. We need to be cognizant of the possibility that worlds or universes of microenvironments, each home to rare taxa, may be present in a single sample.
Interactions with other organisms, for example predation, chemical inhibition, or essential community interactions like consortia trade-offs and syntrophy, can also maintain the rare status of microbial community members.
One fi nal possibility is that rare taxa do not rely on any of these mechanisms and are simply dormant, that is, not actively feeding, reproducing, or contributing to the
16 A Report from the American Academy of Microbiology
function of the community they fi nd themselves in. This idea is controversial, as it can be argued that any member of a community that is not actively maintaining itself is on its way out. If we cannot fi nd an explanation for how a member of the rare biosphere is maintained in a community, perhaps we are looking at the wrong time scales to observe the phenomenon at work. Critical questions include survival times of microbes under suboptimal conditions, energy thresholds for microbial life in dormancy, and the nature of processes leading to extinction of microbes.
How do rare organisms become abundant?
There are a number of basic ecological and evolutionary principles that might account for taxa shifting from rarity to abundance:
■ Growth,
■ Mortality of competitors, predators, or grazers,
■ Immigration,
■ Emigration of competitors, predators, or grazers,
■ Speciation by mutation followed by rapid expansion of the new population
■ Gene transfer events that increase the fi tness of a rare population,
■ Ordinary selection dynamics (including niche perturbations like changes in syntrophic associations, altered nutrient inputs, predation pressure changes, etc.).
Such members of the rare biosphere would be detected as spatially and temporarily fl uctuating groups. Examples of such shifts have been documented. For example, mice treated with antibiotics show a dramatic shift in the composition of their gut microbial communities (Figure 2). Researchers performed deep sequencing of gut microbial communities of mice immediately after antibiotic treatment and six weeks later and compared the diversity of those communities to the microbial communities of control mice. The results showed that sequences corresponding to members of the Enterobacteriaceae family that were rare (~1%) in control mice became dominant (73%) in response to the antibiotic treatment. Microbial communities from mice that were given two weeks to recover after antibiotic treatment recovered a commu-nity structure similar to untreated mice, although the level of Enterobacteriaceae sequences remained somewhat elevated (6%). Similarly, an experiment performed on microbial communities growing in microcosms (large tanks) of seawater showed that bacteria of the Alcanivorax were rare in untreated seawater, but when oil and nutrients were added to the microcosms, after 15 days, Alcanivorax made up 47% of the microbial community. Understanding the role of the rare biosphere in community succession and such ecological characteristics as resilience, resistance to invasion and recovery will require many more such studies.

17The Rare Biosphere
How might the rare biosphere differ for eukaryotes, bacteria, archaea, viruses, and metazoa?
Rank abundance curves for eukaryotes, bacteria, and archaea, all look similar, suggesting that the concept of the rare biosphere is applicable to all of them. However, the mechanisms that generate and maintain rare organisms in these phylo-genetic domains may differ.
These organisms have varied life cycles, so the ecological consequences of rarity may differ between groups, creating characteristic frequencies of dispersal, persis-tence times, rates of lateral gene transfer, perhaps unique proportions of functional and core genes. Also, each of these groups has differing levels of interdependency, which constrains them to different degrees. Sexual reproduction, for example, imposes requirements for minimum population densities, and may discourage rarity. Finally, each group exhibits its own temporal and spatial patterns that may encourage or discourage the presence of rare members.
Viruses present a unique case in discussions of the rare biosphere. Determining whether a particular virus is rare is especially challenging, since many viruses have very high mutation rates (some, like HIV, can produce variation at every nucleo-tide position in a single host) and frequently pick up and discard segments of host genetic material. Viruses have no metabolism of their own, and are dependent on their ability to infect a host cell. A mutation that allows a virus to infect a new host or re-infect an old host can result in a virtually immediate shift from extraordinary rarity to dominance. In a sense, one might say that rarity is the main evolutionary strategy of viruses––by generating millions of unique variations during each infection cycle, the virus optimizes the chances of generating a new, highly successful variant.
Figure 2
Figure legend: The gut microbial community of mice shows a dramatic shift in composition after treatment with antibiotics, then returns to a composition similar to baseline when antibiotic treatment ceases.
1.1 ± 0.5 0.14 ± 0.11
22.1 ± 12.0
70.1 ± 11.8
1.6 ± 0.66.0 ± 4.9
75.5 ± 9.9
7.5 ± 5.2
16.8 ± 4.5
1.1 ± 1.1
23.3 ± 13.2
74.4 ± 12.3
Phylum leveltag assignment
number of animals 9
435,908
Control RecoveryAntibioticTreated
2
102,822
10
467,407number of tags
Bacteroidetes
Firmicutes
Proteobacteria
Other Bacterial phyla

18 A Report from the American Academy of Microbiology
ECOLOGICAL ROLES OF THE RARE BIOSPHERE
The rare biosphere may play several critical ecological roles in
microbial communities, including (but not limited to):
■ Carrying out keystone physiological functions, including some that are relevant in biogeochemical cycling of the elements. Examples include the marine nitrogen-fi xing cyanobacteria Crocosphaera watsonii, and methane oxidizers in soil.
■ Preserving community-level function in the face of chemical, physical, or community-level diversity changes.
■ Metabolizing rare or unusual energy sources like hydrocarbons or DDT.
■ Detoxifi cation of deleterious compounds, including dechlorination.
Oil degraders in the sea are an important example of rare microorganisms providing important functions. Although oil has been seeping into the sea from underground reservoirs for millions of years, it has never accumulated in the ocean. When more oil suddenly becomes available (as in the case of the 2010 Deepwater Horizon spill), the rare oil degraders will grow and utilize this potential energy source effi ciently. The natural seed community can expand quickly to cope with even catastrophic oil spills and contribute signifi cantly to the restoration of impacted ecosystems.
The rare biosphere may also serve as an archive or reservoir of genetic resources that can provide novel genetic material to the community as needed, giving refuge to genes for ecological functions that can be accessed and selected for when envi-ronmental conditions change. There are good examples of organisms furnishing formerly rare genes for their communities (including the ramping-up of antibiotic resistance gene abundance), but it is not known whether these genes are neces-sarily derived from the rare biosphere. Nor do we know how many different kinds of genes the rare biosphere holds or how much genetic variation (beyond rRNA genes) it encompasses, but the potential genetic novelty of the rare biosphere is of great interest to industry.

19The Rare Biosphere
The signifi cance of the rare biosphere’s role as a gene reservoir is far from clear, since a number of limiting factors stand in the way of the fl uid engagement of rare genomes with the larger community. The “rules” governing horizontal gene transfer are not known––how many interactions are there between receptive hosts and the rare biosphere, and how often does this result in passage of selec-tively advantageous genetic material? How are these rates affected by changes in the environment? What is the role of phage in transferring genes out of the rare biosphere? The total number of genomes available in the rare biosphere is huge. The total number of predicted interactions between receptive hosts and rare taxa is potentially quite large –possibly even large enough to render the rare biosphere a signifi cant source of novel genes for microbial communities enduring change.
The rare biosphere as a sentinel for global change
Microbes have been used as indicator species for detecting environmental distur-bances, like oil reservoirs (hydrocarbon degraders), and earthquakes (methanogens), so it seems possible in theory that changes in the rare biosphere could serve as markers of far-reaching changes in the planet. There is evidence from the Interna-tional Census of Marine Microbes that rare taxa differ more between different water masses than do more abundant taxa. This would be consistent with these low abun-dant populations being sensitive to subtle differences in ecosystem parameters.
20 A Report from the American Academy of Microbiology
THE RARE BIOSPHERE AND HUMAN HEALTH
Though we know comparatively little about the rare biosphere, it
is nevertheless possible to envision several roles these taxa might
play in human health and well being. Within the human microbiome,
rare taxa may play any of the ecological roles described above.
For example, just as rare environmental taxa may play a role in
detoxifi cation or metabolizing rare energy sources, intestinal rare
taxa may play a role in detoxifying ingested chemicals or digesting
rare compounds in the diet. It is entirely possible that rare taxa
play a role in how individuals respond differently to drugs. Rare
taxa may also play a role in stimulating the human immune system,
including ‘training’ the immune system to recognize a wide variety of
non-pathogenic organisms during early development. It is known that
the intestinal microbiome varies substantially from person to person
and responds to changes in diet with major shifts in composition.
Whether the rare biosphere also changes under those circumstances
is unknown. The magnitude and membership of the rare biosphere
in the human microbiome has not yet been explored, but it may also
include established or emerging pathogens and may thus play a
role in chronic illnesses, or be of particular concern as a source of
infections in immuno-compromised individuals.
Directing research effort toward a better understanding of the rare biosphere within the human microbiome could affect our understanding of human commensal assemblages, enabling greater insights into hygiene theory, infections in infancy, gut methanogens, and the impacts of commensal diversity on human health and disease. Considering the rich interactions between the human body and its micro-biome, pathogens, and other microorganisms, humans could prove to be useful (and accessible) model systems for studies of rare populations.
21The Rare Biosphere
CHALLENGES IN STUDYING THE RARE BIOSPHERE
Efforts to characterize microbial communities face common
challenges––the need to determine an appropriate sampling
strategy, collect adequate data about when, where, and how
the samples were collected, defi ne the limits of reproducibility,
organize and analyze vast data sets, and separate ‘signal’ from
‘noise’. Each of these challenges is even more acute when it
comes to studying the rare biosphere.
Fully investigating the rare biosphere––its membership, distribution and change over time and space––will require addressing each of these challenges.
What defi nes “good data”?
The characteristics of the rare biosphere must be deduced based on the detection of unusual or unique sequences in metagenomic datasets. As such, experimental design, sampling strategy and the collection of metadata, computational parameters and data analyses take on particular importance. Determining the quality of the data on which conclusions about the rare biosphere are based is a fundamental fi rst step.
The defi ning feature of good data is, in a word, reproducibility. However, ability to reproduce results is not a suffi cient test of data validity because every method has inherent problems and systematic biases. The large data sets generated in metagenomic sequencing projects present real problems with respect to reproducibility between different labs, protocols, and technologies. Some analyses may underrepresent rare taxa. Ideally, each method should be validated to determine biases and variability.
An ongoing challenge for the interpretation of ecological patterns in the rare biosphere is the need to gather and make available ‘metadata’. Briefl y defi ned, metadata means ‘data about data’. How, when, and where samples are collected, the chemical and physical parameters of the sampled environment, how DNA is isolated, what type of sequencing technology is used, how the sequence data are fi ltered and processed – all of these parameters affect results and the ability of other researchers to replicate them. The fi eld is still new enough that understanding how these variables affect results is limited. What is clear is that any efforts to compare results across different laboratories, times or places, will require careful accounting of metadata. In studies of the rare biosphere, scrupulous attention to documenting methods and metadata is especially important.
22 A Report from the American Academy of Microbiology
Technological and methodological advances that would improve confi dence in data
As discussed earlier, understanding the rare biosphere is hampered by uncertainty about the signifi cance of rare sequences. There are a number of technological and methodological advances that would make it easier to determine when sequences genuinely represent rare organisms:
■ Identifying and quantifying artifacts that arise from the use of polymerase chain reaction (PCR), a technique that is useful for increasing the number of copies of rare sequences, but can also introduce various biases;
■ Developing and applying directed PCR approaches that selectively identify rare taxa;
■ Developing technologies (microfl uidics and others) that can detect functional or phylogenetically useful genes from single cells;
■ Comparing different tools for measuring relative abundance of all microbial populations in a studied community;
■ Developing and encouraging the use of best practices guidelines for DNA extraction and other procedures. DNA extraction method and storage conditions should at least be specifi ed, as these can have signifi cant effects on study results;
■ Determining the optimal level of sequencing effort necessary to detect low abundance populations in both targeted gene surveys and shotgun metagenomic analyses;
■ Improving DNA sequencing accuracy to better than 1 error/1000 positions and read lengths on massively parallel systems while lowering costs/nucleotide read;
■ Considering the necessity of sample replication on different spatial and temporal scales.
23The Rare Biosphere
Computational analysis: the microscope through which we see the rare biosphere
Across biology, it is becoming more and more common to test hypotheses by exploring datasets computationally. Genome-wide association studies and compara-tive genomics are just two of many examples. It is clear that sifting out the extremely rare sequences that represent the rare biosphere would quite simply be impossible without powerful computational tools. Addressing even the simplest questions about the rare biosphere (like “Are rare organisms everywhere?”, “Are some rare microor-ganisms associated with others?”) requires tremendous computational power, and asking broader questions will easily exceed both the available computing resources and the skill levels of many principal investigators. On the other hand, rich biological data sets and interesting biological questions are increasingly attracting the attention of computational scientists, mathematicians, and engineers. Microbial ecology, in general, and the rare biosphere, in particular, are research areas where collaboration among biologists, computer scientists, and mathematicians is critically important and highly promising.
Computational needs fall into four categories: hardware, software, human resources, and community resources. Together, these resources might be called cyberinfra-structure.
Increased computing power
New sequencing methods generate huge quantities of data that can exceed the ability of current cyberinfrastructure to manipulate. Microbial ecologists, in particular, will quickly be overwhelmed by data without the necessary computational infrastruc-ture. Other disciplines, including astronomy and particle physics, offer models for establishing cyberinfrastructure that could be instructive in this effort.
Research on the rare biosphere will require data manipulations like sequence bootstrapping, changing the cutoffs of OTUs, richness estimations, using various clustering algorithms and models that consider ecological fl ux, and other computa-tionally-intensive operations that require greater computing power than we currently have at our disposal. Bigger computers, and new tools that can handle large data-sets are needed.
Addressing even the
simplest questions
about the rare
biosphere (like “Are
rare organisms
everywhere?”,
“Are some rare
microorganisms
associated with
others?”) requires
tremendous
computational
power, and asking
broader questions
will easily exceed
both the available
computing
resources and
the skill levels of
many principal
investigators.

24 A Report from the American Academy of Microbiology
Robust community software
The limitations of computing power and infrastructure are serious, but research is currently more limited by software than by hardware. Software is frequently devel-oped in individual laboratories as needed. These ad hoc analytical systems are not optimized, nor made universally available. Extending these programs to the wider community, and making it possible for different programs to work together, would benefi t from community adoption of the same basic pipeline, which would increase standardization of methods and foster a uniform best practices approach. It is important for software to be modular so users can choose which aspect of a pipeline to use and easily insert modifi ed modules as needed. Programs like MOTHUR2 and QIIME3 are taking these approaches. VAMPS4, MoBeDAC5, Camera6 and the Kepler pPOD-project7 are also useful models, integrating biologists, bioinformati-cians, and computer scientists. Investment in the development, standardization, and integration of software tools would be widely useful.
Another software need is for the development of seamless interfaces between phylogenetic analyses, diversity estimations, and graphical representations. Today, connecting graphical representation to the fi rst two processes is not easy, but this is critical to characterizing the rare biosphere.
Human Resources:
There is a need for a larger workforce trained in data processing and analysis. As biology comes to rely more heavily on high-throughput data acquisition, many labo-ratories require this kind of expertise. The need is particularly acute in the study of the rare biosphere because of the challenge of distinguishing ‘signal’ from ‘noise’ in large metagenomic datasets.
2 http://www.mothur.org/software/index.html3 http://qiime.sourceforge.net/4 http://vamps.mbl.edu/resources/databases.php5 http://mobedac.org/6 http://camera.calit2.net)7 https://kepler-project.org/users/projects-using-kepler-1/ppod-project
There is a need
for a larger
workforce trained
in data processing
and analysis.
25The Rare Biosphere
Community standards
Across biology, the accumulation of huge amounts of data is creating a number of challenges. Each laboratory must create a data bank to store its results but funding for the curation and maintenance of these databanks is scarce. Agreement on standardized methods to characterize and annotate data is needed to allow data to be shared from laboratory to laboratory. The situation is made more complex by the extensive processing that is required to analyze data about the rare biosphere. The parameters used to analyze the data can have a major impact on the patterns seen and conclusions drawn, so information about analytical methods must be stored along with the data itself. Thus, reproducibility – that fundamental require-ment for sound science – requires not only that data be accessible, but also that the means used to analyze it also be transparent and documented. The methods used to analyze data represent another kind of metadata—as important as the time, place and methods of sample acquisition and manipulation.
26 A Report from the American Academy of Microbiology
RECOMMENDATIONS
We believe that the time is right to begin to address the above-
mentioned gaps in our understanding of the rare biosphere,
including the roles these taxa play in their communities, how much
genetic variation rare taxa maintain as compared with the community
as a whole, the mechanisms responsible for shifts from rareness to
abundance, and how to differentiate rare biosphere taxa that stably
occupy a niche in their community and transient, reintroduced
populations. The following recommendations outline a strategy for
best approaching this complex topic.
We recommend:
A collaborative, coordinated, international effort focused on acquiring the needed sequence data to answer many questions about the rare biosphere. Microbial ecology investigations need to include more sampling over time, in order to better capture community dynamics and explore the temporal stability of the rare biosphere on a system-by-system basis at a wide variety of temporal scales. We propose an international effort of sampling of globally distributed locales, with multiple locations per locale and a coordinated subsampling of relevant temporal and spatial scales, as well as joint methods and data interpretation approaches between labs (a tractable goal when spread out over fi ve to ten years). The effort should employ a combination of complementary methods, with particular atten-tion to emerging technologies, and it should include existing sample sites that are rich in metadata, such as LTER sites, ocean observatories such as the International Census of Marine Microbes, the National Health and Nutrition Examination Survey, and the Sloan Foundation’s Microbiology of the Built Environment, and the Human Microbiome Project. These efforts will require deep sequencing efforts in order to obtain statistically reliable estimates of the relative abundance of rare taxa. qPCR technologies can defi ne the absolute abundance of high, moderate, and low abun-dance OTUs in studied microbial communities.
27The Rare Biosphere
This effort should include the following components:
■ Estimation of the genetic diversity of the rare biosphere through deep sequencing at select sites.
■ Use of currently available tools to establish the scales of variability (both temporal and physical) among rare taxa in key, selected environments (possibly including existing fi eld programs).
■ Establishment of the baseline of membership and extent of the rare biosphere, including systematic mapping efforts. A systematic survey that gathers a lot more temporal and spatial resolution is essential for beginning this fi eld of study and defi ning the membership of the rare biosphere.
■ Experiments to determine whether the rare biosphere is associated with living, active microbes. We need to know whether the rare biosphere is real, not an artifact of the methods we use to analyze microbial communities. Before we can determine the impacts, importance, and future of the rare biosphere, research must address these fundamental issues.
Advances in technology and new, creative approaches could accelerate progress in characterizing the rare biosphere. We recommend investigation of the following possibilities:
■ Better and more effi cient DNA sequencing capacity
■ More sophisticated imaging capacities
■ Establishment of Centers of Microbial Ecology
■ Educational and training programs in biostatistics
■ Improvements in within-campus cyberinfrastructure
■ Open-source, platform-independent, easy to use, accessible software and improved education about tools
■ Exploration of the possibility of crowd sourcing to help explore microbial biodiversity. Perhaps internet users could be put to work on gene alignments or other problems using visual identifi cation and matching.
28 A Report from the American Academy of Microbiology
REFERENCES
■ Cappello, S. et al. Microbial community dynamics during assays of harbour oil spill bioremediation: a microscale simulation study (2007) Journal of Applied Microbiology 102:184-194
■ Ley, R. E., Turnbaugh, P. J., Klein,S. and Gordon, J.I.. Human gut microbes associated with obesity. (2006) Nature. 444:1022-1023.
■ Nechvatal, J. M. et al. Fecal collection, ambient preservation, and DNA extraction for PCR amplifi cation of bacterial and human markers from human feces. Journal of Microbiological Methods. (2008) Feb;72(2):124.
■ Nyholm S.V. and McFall-Ngai, M.J. The Winnowing: Establishing the Squid-Vibrio Symbiosis. (2004) Nature Reviews Microbiology 2:632-642.
■ Rabinowitz, D., Seven forms of rarity. (1981) in H. Synge, ed.; The Biological aspects of rare plant conservation (Wiley, New York).
■ Rabinowitz, D., Cairns, S. and Dillon, T. (1986) Seven forms of rarity and their frequency in the fl ora of the British Isles. In M.E. Soule, ed.; Conservation Biology: The Science of Scarcity and Diversity (Sinauer, Sunderland, MA).
■ Tyson, G.W. et al Genome-Directed Isolation of the Key Nitrogen Fixer Leptospirillum ferrodiazotrophum sp. nov. from an Acidophilic Microbial Community (2005)
■ Valm, A.M., Mark Welch, J., Rieken, C.W., Hasegawa, Y., Sogin, M.L., Oldenbourg, R., Borisy, G.G. Systems level analysis of microbial community organization: Combinatorial labeling and spectral imaging, (CLASI) to image microbial diversity. Proc. Natl. Acad. Sci. USA, (2011), in press
■ Whitman WB, Coleman DC, and Wiebe WJ (1998) Prokaryotes: The unseen majority. Proc Natl Acad Sci USA 95: 6578–6583.
■ Zaura, E., Keijser, B. J. F., S. M Huse, S.M. and Crielaard,W. (2009) Defi ning the healthy “core microbiome” of oral microbial communities. BMC Microbiol. 9: 259.


![UNESCO - Man and the Biosphere (MAB) …...a biosphere reserve which are given in order below.] UNESCO - Man and the Biosphere (MAB) Programme - Biosphere reserve nomination form:](https://static.fdocuments.us/doc/165x107/5f0db46a7e708231d43bac72/unesco-man-and-the-biosphere-mab-a-biosphere-reserve-which-are-given-in.jpg)

