The rapid assessment workshop to elicit expert consensus ...
44
The rapid assessment workshop to elicit expert consensus to inform the development of the GREAT BARRIER REEF Outlook Report 2014 Report prepared by: Trevor J Ward, Greenward Consulting, Perth for the Great Barrier Reef Marine Park Authority
Transcript of The rapid assessment workshop to elicit expert consensus ...

The rapid assessment workshop
to elicit expert consensus to inform the development of the
GREAT BARRIER REEF
Outlook Report 2014
Report prepared by:
Trevor J Ward, Greenward Consulting, Perth
for the
Great Barrier Reef Marine Park Authority


i
Report April, 2014
The rapid assessment workshop
to elicit expert consensus to inform the development of the
GREAT BARRIER REEF
Outlook Report
Report prepared by:
Trevor J Ward, Greenward Consulting, Perth
for the
Great Barrier Reef Marine Park Authority

ii
The rapid assessment workshop to elicit expert consensus to inform the development of the Great Barrier Reef outlook report 2014 is licensed by the Commonwealth of Australia for use under a Creative Commons By Attribution 3.0 licence with the exception of the Coat of Arms of the Commonwealth of Australia, the logo of the Great Barrier Reef Marine Park Authority, any other material protected by a trademark, content supplied by third parties and any images. For licence conditions see: Creative Commons Licence website
The Great Barrier Reef Marine Park Authority asserts the right to be attributed as copyright owner of the original material in the following manner:
© Commonwealth of Australia (Great Barrier Reef Marine Park Authority) 2014
The Great Barrier Reef Marine Park Authority has made all reasonable efforts to identify content supplied by third parties using the following format ‘© Copyright, [name of third party]’. Permission may need to be obtained from third parties to re-use their material.
Requests and inquiries concerning reproduction and rights should be addressed to Communications, Great Barrier Reef Marine Park Authority, PO Box 1379, Townsville Queensland 4810.
National Library of Australia Cataloguing-in-Publication entry
The rapid assessment workshop to elicit expert consensus to inform the development of the Great Barrier Reef outlook report 2014 / report prepared by: Trevor J Ward, Greenward Consulting, Perth for the Great Barrier Reef Marine Park Authority.
ISBN 9781922126375 (ebook)
Marine resources--Queensland--Great Barrier Reef. Conservation of natural resources--Queensland—Great Barrier Reef. Marine parks and reserves--Queensland--Great Barrier Reef--Management. Environmental management--Queensland--Great Barrier Reef.
Great Barrier Reef Marine Park (Qld.)
Ward, Trevor J., author.
551.42409943
This publication should be cited as:
Ward, T.J. 2014, The rapid assessment workshop to elicit expert consensus to inform the development of the Great Barrier Reef outlook report 2014. Report prepared by: Trevor J Ward, Greenward Consulting, Perth for the Great Barrier Reef Marine Park Authority, GBRMPA, Townsville.

iii
Acknowledgements
The time and effort given to this workshop by the participants is gratefully acknowledged. This includes the three days of the workshop but also preparatory work and post-workshop verification and re-polling.
The National Environmental Research Program—Tropical Ecosystems Hub, through their contestable funding program, is gratefully acknowledged for co-funding this work with the Great Barrier Reef Marine Park Authority.

iv
Summary
The Outlook consensus workshop was organised and convened by the Great Barrier Reef Marine Park Authority (GBRMPA) in Townsville on 14–16 October 2013. The objective of the workshop and surrounding process was to secure an independent set of expert judgements about condition, trends and risks in the Great Barrier Reef Region
1 that could be used to inform
GBRMPA’s preparation of the 2014 Great Barrier Reef Outlook Report. The workshop involved 31 GBRMPA-invited experts (28 attended the workshop and an additional three submitted their opinion as a set of score sheets prior to the workshop), selected because of their independence from GBRMPA, their expertise across a range of the types of issues that were expected to be encountered, and their long-standing experience of field work in the Region. The workshop outcomes reflect the combined and consensus judgement of these experts. The workshop was conducted and moderated by Trevor Ward, an external expert independent of GBRMPA with extensive experience in the conduct of independent marine performance assessment processes.
The three-day workshop process involved anonymous voting on the condition, trends and risks relating to the Great Barrier Reef Region. The voting procedures were conducted using a pre-set decision structure derived from the Great Barrier Reef Outlook Report 2009, and within a specified set of assumptions and guidance. This report has been prepared to summarise the outcomes and to document the process, constraints and guidance provided to workshop participants within which the findings should be interpreted.
As a result of a round of post-workshop verification of findings, the scores/outcomes in two sets of components were the subject of a significant dispute by the participants:
the accuracy of scores for condition of lagoon floor habitats and risks related to this issue, and
the scores for open water habitats.
Both disputes were raised in the context of provision of additional data and knowledge to inform scoring, and so both were subject to a re-poll of the scores coordinated by Trevor Ward through email, and kept anonymous at the expert’s discretion. The scores from the workshop were subsequently adjusted to reflect this remote voting procedure, but otherwise followed the same rules and process as voting in the workshop. The complete set of scores has been placed into a spreadsheet format for analysis in this report, and for archiving by GBRMPA.
The workshop outcomes confirm the extent and breadth of opinion held in the scientific community about a number of issues in the Region. A key outcome is confirmation that the condition of a substantial number of habitats and species in the Region is considered to be substantially degraded compared to their expected condition if there had been no human influence on the ecosystem. Human influence and hence impacts are continuing, and are considered to be resulting in a broad trend of continuing but variable declines in biodiversity and ecosystem health in the Region. The trend of current decline is evidenced by the much larger number of both biodiversity and ecosystem health condition components considered to be deteriorating compared to the number that are improving. This relates to the dominant current risks—impacts of climate change, human activities and development in the coastal areas and rivers discharging to the Region, and the direct extraction of resources, including fishing. The findings provide a strong basis for the development of a robust 2014 Outlook Report, which is the intended use of the outcomes of this workshop.
Workshop participants provided important feedback about the process, and offered a number of constructive comments about any future such workshops. This included suggestions for a process for archiving and making available the raw data scores in the public domain for reference in further workshops and more detailed analysis in subsequent years, and the need for confidence estimates to accompany the risk gradings. Overall, the participants considered
1 The Great Barrier Reef Region encompasses the Great Barrier Reef Marine Park as well as
the areas around major ports.

v
the workshop to be a success and to provide an important independent basis for preparation of the 2014 Great Barrier Reef Outlook Report.

vi
Contents
Acknowledgements ...................................................................................................................... iii
Summary ..................................................................................................................................... iv
Contents ...................................................................................................................................... vi
Background .................................................................................................................................. 1
The expert consensus workshop.................................................................................................. 2
Workshop approach ..................................................................................................................... 3
Real-time assessment.............................................................................................................. 3
The role of each expert in this process .................................................................................... 4
Workshop timeframe ................................................................................................................ 4
Remote input ............................................................................................................................ 5
Decision approach ........................................................................................................................ 5
Determining condition and trends ............................................................................................ 5
Determining risks ..................................................................................................................... 6
Workshop process ........................................................................................................................ 6
Indicators .................................................................................................................................. 6
Scoring and grading ................................................................................................................. 7
Condition .............................................................................................................................. 7
Trend.................................................................................................................................... 7
Confidence ........................................................................................................................... 8
Risks .................................................................................................................................... 8
Aggregation of scores .............................................................................................................. 8
Individual components ......................................................................................................... 8
Aggregation of components ................................................................................................. 9
Grading criteria statements ...................................................................................................... 9
Benchmarks ............................................................................................................................. 9
Elicitation bias ........................................................................................................................ 10
Recognition and use of information ............................................................................................ 10
Workshop outcomes ................................................................................................................... 10
Summary and overview ......................................................................................................... 10
Biodiversity ............................................................................................................................. 16
Ecosystem health ................................................................................................................... 22
Risks ...................................................................................................................................... 24
Participant workshop evaluation................................................................................................. 26
Anonymous feedback............................................................................................................. 26
Other comments ..................................................................................................................... 27
Appendix 1. Grading statements ................................................................................................ 29
Appendix 2. Workshop participants ............................................................................................ 35

Page | 1
Background
The Great Barrier Reef Outlook Report is focused on the Great Barrier Reef Region (Region) as defined in the Great Barrier Reef Marine Park Act 1975. The Region’s boundaries match those of the Great Barrier Reef Marine Park (Marine Park), except that the Region also includes designated areas around major ports. The Great Barrier Reef Outlook Report 2009 (hereafter 2009 Outlook Report) assessed all parts of the ecosystem within the Region, from mangroves and seagrass meadows to fish, coral reefs and the open ocean; these components of the natural marine system are collectively referred to as the Great Barrier Reef ecosystem. Where relevant, the report also looked beyond the boundaries of the Region and included information about adjacent islands, neighbouring marine areas and the river catchments adjacent to the Region.
The Outlook Report is structured around eight assessments required by the Great Barrier Reef Marine Park Act 1975, with each forming a chapter of the report:
Extract from the Great Barrier Reef Marine Park Act 1975:
Content of report
(3) The report must contain the following matters:
(a) an assessment of the current health of the ecosystem within the Great Barrier Reef Region and of the ecosystem outside that region to the extent it affects that region;
(b) an assessment of the current biodiversity within that region;
(c) an assessment of the commercial and non-commercial use of that region;
(d) an assessment of the risks to the ecosystem within that region;
(e) an assessment of the current resilience of the ecosystem within that region;
(f) an assessment of the existing measures to protect and manage the ecosystem within that region;
(g) an assessment of the factors influencing the current and projected future environmental, economic and social values of that region;
(h) an assessment of the long-term outlook for the ecosystem within that region;
(i) any other matter prescribed by the regulations for the purposes of this paragraph.
The 2014 Great Barrier Reef Outlook Report will also include one further chapter, an assessment of heritage values within the Region.
For each assessment in the 2009 Outlook Report a set of assessment criteria (comprising one or more components) was developed, allowing an ordered analysis of the available evidence. For each criterion, grading statements guided the allocation of a ‘grade of best fit’. A qualitative grading system was considered appropriate as it allowed a wide range of evidence and knowledge to be collectively assessed when assigning each grade. More quantitative approaches were impractical given the size of the ecosystem, the amount of evidence available, the lack of analytical resources and the variety of components to be assessed. Four grading options (Very Good, Good, Poor, Very Poor) precluded the natural tendency to ‘sit on the fence’ in allocating a grade. The 2009 Outlook Report was designed as outlined in Figure 1, and included a summary of each assessment at the end of each chapter together with the grades allocated.

Page | 2
Figure 1. Assessment approach for the 2009 Outlook Report
The Australia State of the Environment 2011 used a refinement of the 2009 Outlook Report method and, in addition, included trend information and confidence in scores information for each assessment component. This method was in turn adapted for use in the draft Great Barrier Reef Region Strategic Assessment undertaken by GBRMPA in 2012–13, and is intended to be also used for the 2014 Outlook Report. The 2014 Outlook Report is to be submitted to the Minister for the Environment by 30 June 2014.
The expert consensus workshop
This workshop was designed as an expert elicitation to consult a range of scientific experts and establish a consensus on the conditions, trends and risks in the Region. The consultation and workshop process has been adapted from the approach and decision model established for the assessment and reporting of Australia’s national marine environment (Australia State of the Environment 2011) and applied internationally for aspects of the United Nations Environment Program (UNEP) World Ocean Assessment). The focus of this workshop is on achieving a consensus of independent scientific experts on the biodiversity, ecosystem health and potential risks in the Region.
Experts were invited by GBRMPA to attend the workshop and participate in the elicitation process based primarily on their discipline expertise and their direct experience with, and conduct of, scientific research in the Region. Experts were selected to provide discipline expertise to cover the breadth of the issues expected to be addressed by the workshop and elicitation process. Thirty-one experts participated by invitation in the workshop process.

Page | 3
The outcomes from the workshop will be used to inform the development of the Great Barrier Reef Outlook Report 2014, and will contribute to a broader understanding of the issues and risks to the Region.
To assist the experts attending the workshop, GBRMPA provided a draft assessment of the condition, trends and risks developed from the 2009 Outlook Report, and updated to reflect the more recent knowledge of the Region and activities. Workshop participants were provided this draft material for their information; it was not intended that this should influence their assessments at the workshop other than to provide additional background information they may wish to draw upon in forming their independent conclusions and consensus.
The workshop was managed by an independent facilitator (Trevor Ward, Greenward Consulting) with oversight and control of the process, to ensure that independence and robustness of the outcomes were maintained. The consensus workshop focused on three assessments:
Biodiversity
Ecosystem health
Risks to the Reef.
Two or three GBRMPA staff attended each day of the workshop. Their role was to clarify information about the Outlook Report or the draft assessment provided to participants and to assist with logistics at the venue. They did not participate in the grading of any of the information over the three days.
Whereas the 2009 version of the Outlook Report had no precedent for the Great Barrier Reef Region, the 2014 Outlook Report will build on the processes used in the earlier report, which were further developed by the 2011 Australia State of the Environment (SoE) Report as well as GBRMPA’s draft Great Barrier Reef Region Strategic Assessment as a basis for assessing condition and trend. Grading statements and the assessment structure largely followed those used for the Strategic Assessment which were, in turn, adapted from the 2009 Outlook Report and the national SoE process.
Workshop approach
Real-time assessment
Scores and grades were assigned to the assessment components using a system of real-time anonymous voting by the individual experts, facilitated by the Turning Point software, with near real-time feedback. Each scoring question was posed to the workshop as a group after a brief statement about the question to bound the matters being addressed, and to identify the major elements of relevant knowledge/experience. A short period was then allocated for individual scoring (voting), and then the group scores were tallied and displayed. Three participants contributed gradings remotely, prior to the workshop. During the workshop the facilitator acted as proxy for these participants and submitted their scores. Any unusual patterns or issues raised by the facilitator or the experts were briefly discussed, and if necessary the question was re-polled before archiving as the group consensus decision.
Issues about any assessment component that could not be quickly resolved in the workshop were expected to be resolved in a post-workshop round of focused discussion and remote anonymous re-polling (by email), managed by the facilitator. The initial findings on two assessment components in condition and in risk were disputed, and were resolved in this way. A number of components could not be addressed in the workshop in the time available, and remote scoring was also used to finalise scoring for these components. All components scored (or re-scored) remotely in this way are identified in the outcome tables contained in the relevant appendices.

Page | 4
The role of each expert in this process
Background materials were distributed to help inform discussions during the workshop. Participants were invited to attend and contribute to the workshop but if they could not actually attend they were invited to provide input prior to the workshop. All participants were asked to:
Pre-workshop
Sign a non-disclosure agreement so that background material could be sent to each
participant.
Review the draft condition and trend scores and summary statements for biodiversity and
ecosystem, health assessment components.
Review the draft risk assessment.
Particularly where participants disagreed with a draft score, assemble robust information
and if possible provide references for points of discussion.
o For participants that could not be at the workshop but wished to have input, they
were to email this information to the independent facilitator prior to the workshop
for inclusion in discussions.
Provide feedback if there were any concerns with the methodology being used including
grading statements and benchmarks (see methodology).
During the workshop
Consider and make an informed judgement at the workshop based on the scientific and
other relevant knowledge about each scoring question.
Provide judgements that best represent professional personal opinion, not an institutional
position (in the case where that may be different, and recognising that polling is
anonymous).
Provide examples that best represent the underlying data/knowledge that supports the
score assigned, for annotation to the report.
Contribute to any discussion about issues and questions that arise during the workshop.
After the workshop
Verify workshop outputs by 30 October 2013.
Workshop timeframe
The timeframe for the workshop and achieving consensus was brief. The process was designed as a rapid assessment, for completion within two months of the workshop. The workshop itself was a full three-day event, with the assessment of biodiversity and ecosystem health considered on the first two days, and risks on the last day. In the week after the workshop, a summary of the full workshop results were circulated to participants for their verification, with a response time of two weeks. Two sets of issues arose from the first verification round, addressed and resolved through a remote re-poll as outlined above (and noted in the workshop spreadsheet).

Page | 5
Table 1. Timeframe for the independent consensus process
Date Milestone
14–16 October 2013 Workshop. Workshop outputs emailed to participants the week after the workshop.
30 October 2013 Participants asked to verify workshop outputs by this date
Mid-December 2013 Workshop report complete
End February 2014 Workshop outputs have informed draft Outlook Report
March to April 2014 Draft Outlook Report peer review
By 30 June 2014 2014 Outlook Report submitted to Minister for tabling in Parliament
Second half 2014 Outlook Report and Consensus Workshop Report publicly available
Remote input
For those scientific experts who could only attend the workshop in person for some part of the three days, but wished to remain as party to the outcomes, and where an expert could not attend at all, the following provisions were applied:
1. The facilitator was assigned as proxy to cast a vote for each question where the expert wished to vote but was unable to attend. This facility was established prior to the workshop with each intended vote provided in writing to the facilitator prior to the workshop for anonymous contribution to the poll on that question.
2. Where this vote was part of a contested score, or a re-poll, it was removed from the re-poll at the facilitator’s discretion, or at any subsequent part of the iterative process at the workshop.
3. The remotely voting experts were fully involved in verification rounds as if they had attended the workshop, contributing to the expert role as described above.
4. Experts who had mainly remote input under this provision were identified and acknowledged separately from those who attended the full workshop process.
Decision approach
The consensus workshop (and the supporting remote process) assessed the condition and trends of 53 biodiversity and ecosystem health components of the Region (Table 2) and the risks to biodiversity (38 threats and potential impacts). The outcome is a broadly based expert consensus on condition and trends, and an assessment of risks, to assist with the development of the 2014 Outlook Report by GBRMPA. This includes experts with a range of experience and expertise and, for many of the components considered, involved the pre-eminent regional experts, as well as scientists with long experience in the Region and scientists who are currently active in many relevant research fields.
Determining condition and trends
In this consensus workshop, the assessment of condition and trend is based on securing expert judgement on a set of components that adequately represent the biodiversity and the ecosystem health of the Region. These components are hierarchically arranged within the

Page | 6
values of biodiversity and ecosystem health (Table 2). The assessment required scores and grades (where possible) to be assigned to indicators of both condition and trend for each component, followed by an estimate of confidence in assigning those scores and grades.
Table 2. Biodiversity and ecosystem health of the Region assessed for condition, trend and confidence in the consensus workshop and remote process
Assessment Assessment criteria No. of components
Biodiversity
Habitats to support species 11
Species populations or groups of species
15
Ecosystem health
Physical processes 7
Chemical processes 4
Ecological processes 8
Outbreaks of disease, introduced species and pest species
4
Terrestrial habitats that support the Great Barrier Reef
4
Determining risks
Risks at the Region-wide scale were resolved into four grades based on the five-point grading scale of Likelihood and Consequence, as adopted in the 2009 Outlook Report and consistent with the widely adopted Australian Standard for Risk Assessment. Selected threats were categorised as Region-wide or local, based on the scale of the consequences of individual events. The definitions for each grade of the Likelihood and Consequence, and the aggregation structure (adapted from the 2009 Outlook Report) were provided prior to the workshop to guide participants in their voting decisions (Appendix 1). The risks assigned were those that are current, and remain in place even though there may be a range of management measures and activities underway; hence, the risks reported here are ‘residual’ risks—those expected to remain after considering current management arrangements.
Workshop process
Indicators
Condition and trend in the components were assigned to three indicators: Best10%, Most, and Worst10%. The exact meaning of each of these depends on the specific component being assessed, but broadly is used in the sense of a frequency distribution of scores across a spatial or other relevant gradient. So, for example, in assessing the habitat ‘mangrove forests’, for the Best10% indicator, a score was assigned that reflects the expert’s judgement about condition quality of mangrove forests in the best 10 per cent of the places (or area) where they occur across the Region—conceptually, this would be represented by the 90 per cent score on a frequency distribution of condition quality scores across individual areas/forests of the Region.

Page | 7
Similarly, the Worst10% represents the 10 per cent score on the same distribution. ‘Most’ represents the modal score of the full distribution.
The indicators therefore comprised these reporting quantities (or metrics): ‘Most places’, ‘Worst 10% places’ and ‘Best 10% places’ for condition. For trend, the metrics were Increasing, Stable, or Deteriorating, estimated as changes that have occurred over the last five years (since the 2009 Outlook Report). Experts were guided to apply their judgement at the scale of the whole Region, and not be overly influenced by small areas of very good or very bad condition, or small areas where changes are very great, but always relative to the historical or potential spatial distribution of the component being assessed. So, for example, if one habitat type (say Halimeda beds) only occurs in a proportion of the Region, then the assessment of condition and trend applies to the area occupied (either presently, historically, or potentially), to avoid an area-bias that would otherwise apply to small but important habitat types.
For species groups, the assignment of condition and trend in the worst–best indicator gradient was based on the number of species that constituted the condition quality—for example, in the sharks and rays group, the condition score assigned to the Worst10% indicator represents the condition score assigned to 10 per cent of the species considered to be in the worst condition. For crocodiles and dugongs (the only species-specific groups assessed in this workshop), the assessment of condition and trend applies spatially, to populations or subgroups of these animals.
Scoring and grading
Condition
At the workshop, scores were assigned (by voting) to each indicator on a scale from 0 to 10, where 0 is consistent with the weakest level of performance or achievement of the grading criterion (Appendix 1), and 10 is the strongest or highest level of achievement. Scores of 0 (although rarely occurring) were recorded manually and inserted later into the workshop scoring record, because of a limitation in the Turning Point equipment (a zero score could not be recorded by the Turning Point hardware used here for anonymous voting because of a limit on numbers available for scoring).
The grades are coarse levels of condition performance/achievement used for reporting purposes at the indicator level: Very Poor, Poor, Good, and Very Good. These were used in navigating towards a consensus score, constructed within the linear scale of 0 to 10 using thresholds of 2.5, 5, and 7.5 for the four categories of condition.
The voting system employed in this workshop used only whole integers, and at each of the specific thresholds, an integer score at the threshold is assigned to the grade (Figure 2). Scores of 5 were therefore assigned to Poor. In the aggregation of scores across components, the median score may be non-integer, but the same rule was applied: a score at the threshold is assigned to the lower grade, so a median score of 7.5 across a number of components would be assigned to Good, while 7.6 would be assigned to Very Good.
Figure 2. Scoring and grading scales for the consensus workshop
Trend
Trends related to the immediately previous five-year period, notionally the interval between the 2009 Outlook Report and the 2014 Outlook Report. The trend in each component was assigned to Best10%, Most and Worst10% within the four grades that relate to condition quality: Increasing, Stable, Deteriorating, or No Clear Trend (no data/information or not enough information to determine a trend).
Page | 8
Confidence
There were only limited data available for a number of components, but the condition scores and trend grades were assigned using best judgement of the scientific experts. The confidence assigned to the scores (as well as trend grades) was represented by one of the four confidence grades: High, Medium, Low or Unknown/No Score.
A High confidence grade was assigned when the score was considered to be based on information/evidence that was of an adequately high quality for assigning condition and trends at the level of resolution required by the grading statements (i.e. the four grades). Evidence was considered adequate for this purpose if it was sufficiently accurate and precise that, even if considerable further data/information became available (such as from a major program of research focused on the specific question of condition quality), then the expert’s personal judgement was that it would be unlikely that the true score would lie outside the range of a single grade, with about 95 per cent confidence.
So, for example, condition of mangrove forests across the Region was estimated to be 6 (representing Good) by a consensus of the experts contributing to the workshop using the grading statements for habitats, and was assigned with a confidence of Medium (limited evidence is available or there is a limited scientific consensus). This infers that it was considered by the experts that even if considerably better knowledge was to be developed about the conditions of mangrove forests, the true score would be highly unlikely to change by more than one grade (a confidence band of two grades) from the assigned score of 6
Similarly, the band of uncertainty for High confidence is one grade, inferring that the true value of the score is highly unlikely to fall outside the grade assigned to the nominated score; and for Low the uncertainty band is three grades. Confidence less than this level (i.e. a score cannot be assigned within confidence of three grades or better) is too low to score, and in these circumstances no score for condition and no confidence grades were assigned.
Risks
Risks were assessed for the current situation and as are expected to apply in the immediate future (notionally five years). The consequences of a factor that may affect the environment during this period were estimated by comparison with the current condition of the environment (notionally estimated as the condition prevailing over the past five years). The frequency and timeframe of factors contributing to an assigned risk grade is embedded in the definitions for the classes of likelihood. The classes of consequence are established based on the effects of the risk factors on ecological and ecosystem receptors, such as those described in the grading statements for condition and trend of habitats and species, combined with their spatial and temporal impacts relative to the current condition. The assessment of risk was undertaken taking account of existing management arrangements that currently mitigate the risk, and is therefore an assessment of residual risks. Voting for categories of likelihood and consequence was conducted in the same manner as for condition and trend.
Aggregation of scores
Individual components
Condition: for each component indicator, the maximum number of votes in each of the four grades (from the final poll when a re-poll was taken) was used to assign a grade to that indicator. While there are only two integer numeric scores (6, 7) available for ‘Good’ in this scoring system, and three for each of the other grades, this potential bias was avoided by ensuring that participants navigated to a score by first identifying a grade (Very Poor, Poor, Good, Very Good), then assigning a score (from 0 to 10) within that grade for polling. The consensus outcome for the Most grade will be used to inform the 2014 Outlook Report overall grade for the component, with the Best10% and Worst10% consensus grades determined here used to identify specific examples of performance issues, and provide context for descriptions of the spatial distribution of condition.
Trend: for each component indicator, the maximum number of votes (from the final re-poll when that was needed) was used to assign a grade to that indicator. In the event of a tie, the votes in adjacent grades were applied to break the tie. As for condition, the trend in the Most grade will inform the overall grade for the component in the 2014 Outlook Report, with the Best10% and

Page | 9
Worst10% grades used to identify specific examples of performance issues, and provide context for descriptions of the spatial distribution of trend.
Confidence: for each component, the maximum number of votes was used to identify the grade to be assigned to condition and trend, with ties resolved as above. GBRMPA will use this information when considering its confidence in the grades it assigns to the components in the 2014 Outlook Report.
Risk: Grade in Likelihood or Consequence (definitions provided in Appendix 1) was assigned using the maximum number of votes, within a ±1 vote envelope. Where this resulted in a tie and more than a single grade was assigned in Likelihood or Consequence, ties were resolved by applying the pattern of adjacent votes, and the resulting grade was carried through to assign risk. In a small number of cases, the Likelihood or Consequence could not be uniquely resolved in this way, and more than a single risk grade resulted which was preserved and carried through to the final risk assignment.
Cross-boundary scores: where there were sums of scores that covered more than one of the four grades of condition, or the three grades of trend, as for risk, a ±1 vote envelope was used to determine the final grade to apply. Where this resulted in a tie and more than a single grade was assigned, all assigned grades were carried through to assign the outcome. As a result, a number of components were assigned to a range of grades, such as Good–Very Good, which infers a broad spread of judgement across these two grades. The highest score assigned is reported as the first assigned grade in the outcome tables.
Aggregation of components
Condition, Trend, Confidence: the condition grade for an aggregated parameter (for example, the components of habitats all combined into a single set of estimates for the aggregate condition of habitats of the Region) was determined by the highest median number of votes for a score across the individual components. Ties were not resolved, and the range was carried through to the outcomes.
Grading criteria statements
The grading statements (Appendix 1) were uniquely derived for each group of the assessment components to represent and best meet the requirements of the Act for maintaining the structure and function of the Region’s ecosystems. The grading statements provided experts with the specific criteria and guidance about the thresholds to use in determining first a grade and then a score that is consistent with their knowledge of the data and information, and best represents their judgement at the indicator level of the decision model.
Benchmarks
The score/grade assigned to an indicator is formed by the experts based on relativity to a benchmark or point of reference. For this assessment, and to best meet the requirements of the Act, experts were required to form their judgement about current condition and trends relative to the condition that would have been expected to prevail if there had been no influence of human activity. This broadly represents the condition in the absence of human uses or exploitation, and can be considered to best represent a relatively natural set of conditions perhaps only slightly impacted by human activities.
The use of a ‘natural conditions’ benchmark here should not be confused with the setting of a target or an objective for current management systems to achieve. The benchmark is used here for ‘anchoring’ the scoring and grading system to a common point of reference that relates to all components that are assessed across the Region.
The use of the ‘natural conditions’ benchmark is a critical aspect of condition assessment, as it is only in this way that actual ‘distance’ of the current system from a natural and undisturbed system can be estimated. Estimates of this distance provide a point of reference that is common across the condition of all components, and enables a consistent form of evaluation of the different components within a single assessment framework. Such evaluations are central to the design of efficient and effective management to maintain or recover natural ecosystem structure and function, to avoid sliding baselines in long-term management systems, and to

Page | 10
enable robust prioritisation of investment strategies for management systems that address these issues.
Elicitation bias
The assessment process used in this workshop is potentially subject to a number of sources of bias. These include such matters as a limited representation of the extant knowledge base at the workshop (including insufficient experts in attendance), and the other forms of bias always inherent in a Delphi-style rapid assessment process. The most important aspect of this matter is recognising the type and extent of bias that may apply, and where any aspect may be important (taking account of the coarse resolution of the overall process), the existence of such bias should be addressed in the workshop, and documented in the workshop outcome.
The preamble to the workshop process briefly discussed the main types of individual and group bias that could affect the process. The main bias thought to potentially influence the workshop outcomes was the advance provision of the GBRMPA assessment of the same components that were being assessed in the workshop. The attention of all participants was drawn to this potential for ‘anchoring’ bias, so that it could be avoided. The workshop was advised that if any other forms of bias were suspected, they should be brought to the attention of the facilitator as soon as possible for corrective action. In the post-workshop verification round, one potentially misleading discussion of data/information was identified, and this was corrected by discussion of the inaccuracy and process failure that occurred. Following these discussions, a remote re-poll of these matters was instigated to inform a consensus post-workshop adjustment of the workshop outcomes (and so noted in the outcomes).
Recognition and use of information
GBRMPA acknowledges and recognises the substantial contribution that the 31 individual experts made to this workshop process, drawing on their time and their expertise. This workshop report identifies each expert and their institutional affiliation, and their role in contributing to the workshop (Appendix 2).
Information gathered through the consensus workshop is for informing the 2014 Outlook Report only. The outcomes of the workshop were made available to participants immediately after the workshop for verification. However, all information provided prior to and derived from the workshop is confidential unless already publicly available. Consistent with Australian Government guidelines, all participants signed a non-disclosure agreement. The full workshop report (this report) and all workshop outcomes will become public domain when published by GBRMPA after the 2014 Outlook Report is tabled in Parliament by the Minister of the Environment (expected mid-2014).
Workshop outcomes
Summary and overview
A summary of the raw data collected by the elicitation process is shown below in Table 3 (condition and trends) and Table 4 (residual risks).
A number of consistent patterns are evident in the judgements of the experts, but the dominant pattern demonstrated in the condition outcome is that, in the category Most (representing a notional 80 per cent of the Region or the values), there are 27 grades of uniquely Good condition (ignoring mixed grades) from the total of 53 components assessed and scored. This infers that, for about half of the components assessed, the judgement of the experts involved in this workshop is that the current condition is substantially degraded (from 30 to 50 per cent poorer) than would be the case if there had been no significant human impacts in the Region. Also, the equivalent statistic for the trend assessment is that 16 of the 53 components assessed are (uniquely) continuing to deteriorate. Nonetheless, a substantive number of these assessments were assigned with a low to medium level of confidence, identifying the need for further knowledge and perhaps more detailed clarification of the gradings based on more detailed scientific data/knowledge.

Page | 11
In contrast, only three of the 53 components were assessed as remaining in Very Good condition, with a medium level of confidence, inferring only slight and minor changes since European colonisation of the Region. Two of these (mangrove and macroalgae-dominated habitats) were considered to be Stable, and hence not showing any significant signs of current deterioration trend. While both of these habitat types were recognised as having been significantly impacted in some areas, this was considered to be constrained to less than 10 per cent of the natural area of each habitat type, although trends in these constrained areas could not be clearly established at the workshop and so current trajectory remains unclear (from this assessment process).
A second feature of the overview is that, amongst the areas in best condition, the condition of the vast majority of the Best10% areas is considered to be Very Good. None of the components assessed as being in the Best10% areas were considered to be in Poor or Very Poor condition, and also most were considered as Stable, although many of these judgements were also assigned with only low to medium confidence.
A third feature of the workshop findings on condition is that almost all the components assessed in the Worst10% areas (39 of 44 components) were considered to be substantially degraded, meeting the criteria for either Poor or Very Poor condition. This infers that in these constrained areas major impacts have occurred as a result of human development across the great majority of the Region’s environment.
Of the 38 threats assessed for residual risk, the dominant pattern of risk results from three classes of threat operating at broad and regional scales—climate change, land-based sources of impact, and the impacts of fishing. Some of these are also considered to pose high or very high risk at the local scale, including the impacts of artificial lighting, river and freshwater wetland modifications, a large oil spill, the introduction of non-endemic species, the dredging of the sea floor and the dumping/remobilisation of the subsequent dredge spoil.
While confidence in the expert judgements of likelihood and consequence (which are combined to assign a level of risk) were not assigned at the workshop, the distribution of individual votes was mostly constrained to within three of the five possible classes. The distribution of votes only twice extended across all five classes in either likelihood or consequence, and there was usually a dominant mode in the distribution of votes, inferring at least a measure of independent agreement amongst participants.
The self-assessed confidence estimates surrounding the condition and trend assignments provide a relative measure of certainty for the subsequently aggregated individual outcomes. This can infer a measure of relative precision in the final outcomes, but it does not necessarily confer estimates of accuracy. Therefore, the outcomes of this workshop should be interpreted with due caution—neither a finding assigned with a high level of confidence nor a low level of confidence infers high or low accuracy.
The finding of a specific condition or trend for a component should not be discounted because of its confidence—the condition may be accurately reflected in the outcomes even though confidence (which is based on a number of different uncertainties) may be expressed as low. The workshop outcomes can be confidently considered to represent a consensus of opinion from a broad base of extensive experience and capability independent of GBRMPA and, within the bounds of a rapid assessment process, will make a strong contribution to the development of the 2014 Outlook Report.

Page | 12
Table 3. Summary of workshop outcomes for all components—Condition, Trend and Confidence
Components Condition Trend
Worst10% Best10% Most Confidence Worst10% Best10% Most Confidence
Habitats Islands Poor Very Good Good Medium Deteriorating Stable Deteriorating-Stable
Medium
Beaches Very Poor Very Good Good Medium Deteriorating Stable Deteriorating Medium
Mangrove Very Poor Very Good Good Medium Deteriorating Stable Deteriorating Medium
Seagrass Very Poor Very Good Poor Medium Deteriorating Stable No clear trend Medium
Coral reef < 30 m Very Poor Very Good Poor High Deteriorating Stable Deteriorating High
Deep reef > 30 m Poor Very Good Good-Very Good
Low No clear trend Stable Stable-No clear trend
Low
Lagoon floor** Very Poor Very Good Good-Poor High-Medium Deteriorating-Stable
Stable Deteriorating-Stable
Medium
Shoals Very Poor Very Good Good Medium Stable-Deteriorating
Stable Stable-Deteriorating
Low
Halimeda banks Poor Very Good Good-Very Good
Low-Medium Stable-no clear trend
Stable Stable Low
Continental slope Poor Very Good Very Good-Good
Low No clear trend-Stable
Stable Stable Low
Open water** Very Poor Very Good Good Medium-High Deteriorating Stable Deteriorating Medium
Species Mangroves Good-Poor Very Good Very Good Medium Stable-No clear trend
Stable Stable Low
Seagrasses Poor Very Good Good Medium No clear trend Stable Stable Medium
Macroalgae Good Very Good Very Good Medium No clear trend Stable Stable Medium
Corals Very Poor-Poor
Very Good Good High Deteriorating Stable Deteriorating High
Other invertebrates Poor Very Good Good Low Deteriorating- No clear trend
Stable No clear trend Low
Bony fish Very Poor-Poor
Very Good Good Medium Deteriorating Stable Stable Medium
Sharks & rays Very Poor Very Good Poor Medium Deteriorating Stable Deteriorating Medium-Low
Sea snakes Very Poor Good-Very Good
Good Medium Deteriorating Stable No clear trend Low
Marine turtles Very Poor Good Poor High Deteriorating Improving Deteriorating High-Medium

Page | 13
Components Condition Trend
Worst10% Best10% Most Confidence Worst10% Best10% Most Confidence
Estuarine crocodiles not scored not scored Good Medium not scored not scored Improving High
Seabirds Very Poor Good Poor Medium Deteriorating Stable Deteriorating Medium
Whales not scored not scored Good Medium not scored not scored Improving Medium
Dolphins not scored not scored Poor Low not scored not scored No clear trend - Deteriorating
Low
Dugong not scored not scored Poor Medium not scored not scored Deteriorating Medium
Physical processes
Ocean currents not scored not scored Very Good Low not scored not scored No clear trend Low
Cyclones, wind not scored not scored Good-Very Good
Medium-Low not scored not scored No clear trend Medium
Freshwater inflow Very Poor-Poor
Very Good Good-Poor High Deteriorating-Stable
Stable Deteriorating High
Sedimentation Very Poor Very Good Poor High Deteriorating-Stable
Stable Deteriorating-Stable
High
Sea level Poor-Good Very Good Good High Deteriorating Deteriorating Deteriorating High
Sea temperature Very Poor-Poor
Good-Very Good
Poor High Deteriorating Deteriorating Deteriorating High
Light Very Poor Very Good Good Medium-High Stable-Deteriorating
Stable Stable Medium-High
Chemical processes
Nutrient cycling Very Poor Very Good Good High Deteriorating-Stable
Stable Stable-Deteriorating
High
Pesticide accumulation Very Poor Very Good Good Medium-High Deteriorating Stable Deteriorating-Stable
Medium
Ocean acidity Poor-Good Very Good Good High-Medium Deteriorating Deteriorating Deteriorating High
Ocean salinity Poor Very Good Poor-Very Good
High Stable Stable Stable High
Ecological processes
Primary production Poor Very Good Very Good-Good
Medium Stable-Deteriorating
Stable Stable-Deteriorating
Medium-High
Herbivory Poor Very Good Good Medium Deteriorating Deteriorating Deteriorating Medium
Predation Poor Very Good Good Low Deteriorating Stable Stable Medium
Symbiosis Good-Poor Very Good Good Low Deteriorating Deteriorating Deteriorating Medium
Reef building Very Poor Very Good Poor-Good Medium Deteriorating Deteriorating Deteriorating Medium
Competition Poor-Very Poor
Very Good Poor-Very Good
Low Deteriorating Stable Stable-Deteriorating
Low

Page | 14
Components Condition Trend
Worst10% Best10% Most Confidence Worst10% Best10% Most Confidence
Connectivity Very Poor-Poor
Very Good Poor-Good Medium-High Deteriorating-Stable
Stable Stable-No clear trend
Medium-High
Recruitment Very Poor-Poor
Very Good Good Medium Deteriorating Stable No clear trend Medium
Terrestrial processes
Salt marsh Very Poor Very Good Good Medium Deteriorating Stable Deteriorating Medium
Freshwater wetlands Very Poor Very Good Poor Medium Deteriorating Stable Deteriorating Medium
Forested floodplains Very Poor Good Poor High Stable Stable Deteriorating High-Medium
Water bodies Very Poor Good-Very Good
Poor High-Medium Deteriorating-Stable
Stable Deteriorating Medium
Outbreaks Disease Poor Very Good Good Medium Deteriorating Stable Deteriorating Low
Crown-of-thorns starfish Very Poor Very Good Poor Medium Deteriorating Stable Deteriorating Medium
Introduced species not scored not scored Poor Low-Medium not scored not scored No clear trend- Deteriorating
Low
Other outbreaks not scored not scored Good Low not scored not scored No clear trend Low
**components that were the subject of disagreement and were re-polled remotely and anonymously Colour Key
Condition Very Good Good Poor Very Poor
Trend Improving Stable Deteriorating No clear trend

Page | 15
Table 4. Summary of workshop outcomes for residual risks that were assessed
SUMMARY OF ALL ASSESSED RISKS SCALE OF RISKS
BROAD LOCAL
Climate change effects on weather patterns HIGH not assessed
Climate change induced altered ocean currents HIGH-VERY HIGH not assessed
Increased sea temperature VERY HIGH not assessed
Increasing acidity VERY HIGH not assessed
Rising sea level HIGH-VERY HIGH not assessed
Outbreak of disease HIGH not assessed
Nutrients from catchment run-off VERY HIGH not assessed
Outbreak of crown-of-thorns starfish HIGH not assessed
Pesticides from catchment run-off HIGH not assessed
Sediments from catchment run-off VERY HIGH not assessed
Outbreak or bloom of species other than crown-of-thorns starfish LOW-MEDIUM
not assessed
Dredging the sea floor MEDIUM HIGH
Dumping and resuspension of dredge material HIGH HIGH
Exposure of acid sulphate soils LOW MEDIUM-LOW
Terrestrial point source discharge MEDIUM not assessed
Introduced non-endemic species HIGH-MEDIUM HIGH
Manufactured material discarded, disposed HIGH not assessed
Artificial lighting MEDIUM HIGH-MEDIUM
Artificial barrier to riverine and estuarine flows HIGH VERY HIGH
Clearing or modifying wetlands, mangroves HIGH VERY HIGH
Noise from human activities MEDIUM not assessed
Death or injury to wildlife—vessel strike MEDIUM MEDIUM
Retained take (extraction) of primary producers LOW not assessed
Retained take (extraction) of herbivores** MEDIUM-VERY HIGH not assessed
Retained take (extraction) of particle feeders** MEDIUM-HIGH not assessed

Page | 16
Retained take (extraction) of low order predators** MEDIUM not assessed
Retained take (extraction) of top order predators** HIGH not assessed
Spill—large chemical LOW MEDIUM
Spill—large oil MEDIUM HIGH
Spill—small chemical and oil MEDIUM MEDIUM
Waste discharge from a vessel LOW-MEDIUM MEDIUM
Physical damage to non-reef benthos MEDIUM not assessed
Physical damage to reef benthos MEDIUM MEDIUM
Immediate or post-release effects (take)** HIGH not assessed
Illegal fishing, collecting and poaching HIGH not assessed
Grounding of large vessels (> 50 m) MEDIUM-LOW HIGH-MEDIUM
Grounding of small vessels (< 50 m) LOW MEDIUM
Illegal activities (other) LOW not assessed
**components that were the subject of disagreement and were re-polled remotely and anonymously
Biodiversity
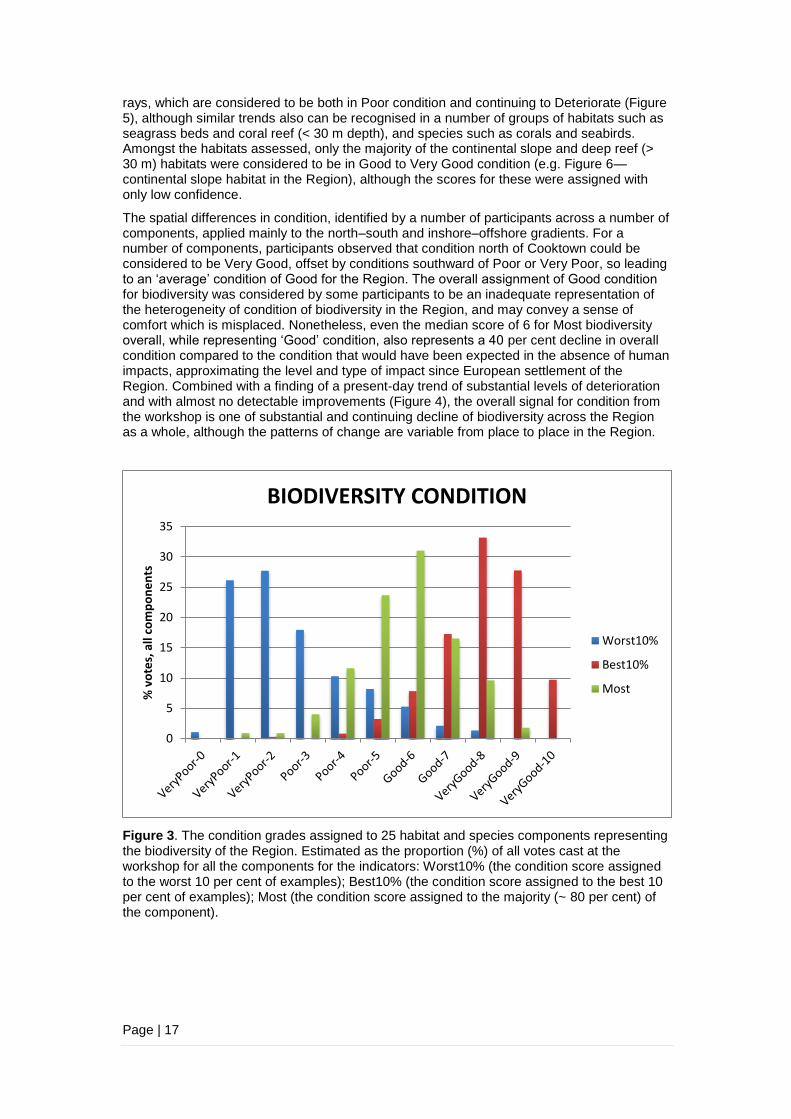
The workshop process resulted in consensus condition scores for 11 habitat types and 14 species groups/species, which taken together represent the biodiversity of the Region. The condition of the largest proportion (notionally 80 per cent) across all these components was considered to be Good, although the condition of large proportions of a number of components, such as seagrass habitat, was considered to be Poor or Very Poor. The greatest proportion of only two of these biodiversity components—area of the continental slope habitat and the majority of macroalgal species—were considered to be in Very Good condition (Figure 3).
Most habitats and species groups were considered to be in Stable condition, with only very few habitats or species groups considered to be Improving. A considerable number of the components were considered to be Deteriorating, or could not be assessed because of inadequate knowledge (Figure 4).
The judgements of the experts at the workshop about the biodiversity components were mainly assigned with a medium level of confidence. This infers that the experts collectively considered that a true estimate of both condition and trend for the majority of components assessed would be within the bounds of two grades. The condition and trend of only corals, coral reefs and marine turtles were estimated with a high level of confidence, although the trend in estuarine crocodiles was also expressed with a high level of confidence, inferring that the true condition/trend is highly unlikely to fall outside the grade to which it has been assigned.
Overall, the biodiversity of the Region can be summarised as being in Good condition, although there are substantial spatial differences from the north to south and from the east to west of the Region, and there are current trends of decline, recognisable in many of the biodiversity components. Deteriorating condition was most widely recognised in sharks and
Page | 17
rays, which are considered to be both in Poor condition and continuing to Deteriorate (Figure 5), although similar trends also can be recognised in a number of groups of habitats such as seagrass beds and coral reef (< 30 m depth), and species such as corals and seabirds. Amongst the habitats assessed, only the majority of the continental slope and deep reef (> 30 m) habitats were considered to be in Good to Very Good condition (e.g. Figure 6—continental slope habitat in the Region), although the scores for these were assigned with only low confidence.
The spatial differences in condition, identified by a number of participants across a number of components, applied mainly to the north–south and inshore–offshore gradients. For a number of components, participants observed that condition north of Cooktown could be considered to be Very Good, offset by conditions southward of Poor or Very Poor, so leading to an ‘average’ condition of Good for the Region. The overall assignment of Good condition for biodiversity was considered by some participants to be an inadequate representation of the heterogeneity of condition of biodiversity in the Region, and may convey a sense of comfort which is misplaced. Nonetheless, even the median score of 6 for Most biodiversity overall, while representing ‘Good’ condition, also represents a 40 per cent decline in overall condition compared to the condition that would have been expected in the absence of human impacts, approximating the level and type of impact since European settlement of the Region. Combined with a finding of a present-day trend of substantial levels of deterioration and with almost no detectable improvements (Figure 4), the overall signal for condition from the workshop is one of substantial and continuing decline of biodiversity across the Region as a whole, although the patterns of change are variable from place to place in the Region.
Figure 3. The condition grades assigned to 25 habitat and species components representing the biodiversity of the Region. Estimated as the proportion (%) of all votes cast at the workshop for all the components for the indicators: Worst10% (the condition score assigned to the worst 10 per cent of examples); Best10% (the condition score assigned to the best 10 per cent of examples); Most (the condition score assigned to the majority (~ 80 per cent) of the component).
0
5
10
15
20
25
30
35
% v
ote
s, a
ll co
mp
on
en
ts
BIODIVERSITY CONDITION
Worst10%
Best10%
Most

Page | 18
Figure 4. Trend in condition of all biodiversity components, estimated as the proportion (%) of all votes cast at the workshop for all the components for the indicators. NoTrend = no clear trend known or discernible from the available knowledge; Deteriorating = declining in condition; Stable = trending flat, although recognising there may be significant natural dynamics/variability; Improving = increasing in condition.
0
10
20
30
40
50
60
70
80
NoTrend Deteriorating Stable Improving
% v
ote
s, a
ll co
mp
on
en
ts
BIODIVERSITY TREND
Worst10%
Best10%
Most

Page | 19

Page | 20
Figure 5. Sharks and rays species group: scores/grades assigned to condition (left panel) and trend (right panel) for the Worst10% of the species, Most species, and the Best10% of the species; and the confidence (bottom) with which those scores were assigned.

Page | 21

Page | 22
Figure 6. Continental slope habitat: scores/grades assigned to condition (left panel) and trend (right panel) for the Worst10% of the area, Most area, and the Best10% of the area; and the confidence (bottom) with which those scores were assigned.
Ecosystem health
The workshop process resulted in consensus condition scores for seven physical, four chemical, and eight ecological processes, scores for the condition of four key terrestrial habitats that provide important ecological services for the Region’s marine ecosystems and species, and scores for the condition of four types of outbreaks of species and diseases that affect the Region. These sets of components are grouped together to represent a set of processes and ecological services that influence the habitats and species of the Region, and hence comprise key elements of the Region’s ecosystems and taken together represent the ecosystem health of the Region.
The condition of the largest proportion (notionally 80 per cent) across all these components was considered to be Good (score of 6), although the condition of large proportions of a number of components, such as the freshwater wetlands, forested floodplains and connecting water bodies of the adjacent terrestrial ecosystems, and the outbreaks of crown-of-thorns starfish and introduced species were considered to be Poor or Very Poor (Figure 7). A high proportion of the ecosystem health components (11 of the 27 Most components assessed) were also considered to be (uniquely) in declining condition (Figure 8).

Page | 23
The dominant pattern in the ecosystem health trends is the absence of any components that are considered to be Improving (Figure 8). As for biodiversity, while a large number of the components of ecosystem health are considered to be Stable, about the same number of components are considered to be Deteriorating. Given the lack of any components considered to be recovering, the ecosystem health of the Region is considered to be trending heavily in decline.
Figure 7. The grade assigned to 27 components representing the ecosystem health of the Region. Estimated as the proportion (%) of all votes cast at the workshop for all the components for the indicators: Worst10%, Best10% and Most (as in Figure 3).
Figure 8. Trend in condition of all ecosystem health components, estimated as the proportion (%) of all votes cast at the workshop for all the components for the indicators. Trend classes as in Figure 4.
0
5
10
15
20
25
30
35
% v
ote
s, a
ll co
mp
on
en
ts
ECOSYSTEM HEALTH CONDITION
Worst10%
Best10%
Most
0
10
20
30
40
50
60
70
NoTrend Deteriorating Stable Improving
% v
ote
s, a
ll co
mp
on
en
ts
ECOSYSTEM HEALTH TREND
Worst10%
Best10%
Most

Page | 24
Risks
Experts contributed their judgements about two aspects of each of the 38 identified threats—the likelihood of the threat occurring and, in the event that it did occur, the consequences that would arise for the ecosystems, habitats and species of the Region. The grading structure for Likelihood and Consequence were provided to workshop participants (Appendix 1), and the grades assigned at the workshop were converted to a risk assignment, according to the established conversion framework (Appendix 1) from the 2009 Outlook Report.
Of the 38 threats assessed for residual risk, the dominant pattern (18 of the 38 assessed threats) is of one high or very high risk resulting from three classes of threat operating at a broad and regional scale—climate change, land-based sources of impact, and the impacts of fishing (Table 4) which are present in the Region at a broad scale. The combination of frequent occurrence and major impacts from these threats (Table 5) results in the high to very high present-day and ongoing levels of risk operating at a broad scale across the Region. In addition to these 18 threats, a further four threats were identified as high risks operating at the local scale. Four threats—dumping and resuspension of dredge spoil material; introduction of non-endemic species; artificial barriers to riverine and estuarine flows; and clearing or modifying wetlands—were considered to be either high or very high risks operating across the Region at both broad and local scales.
Confidence estimates were not assigned to either likelihood or consequence as part of the workshop process. However, the distribution of votes rarely extended across all five classes in either likelihood or consequence, and there was usually a dominant mode in the distribution of votes. For example, the experts’ votes for issues associated with dredging congregate around a reasonably discrete distribution (Figure 9). While this is not an estimate of confidence equivalent to that used in the assessment of condition and trends, the simple form of vote distribution infers a measure of independent agreement amongst participants because the voting was anonymous, and re-polls did not frequently occur. Nonetheless, with more information and data specific to each of the risk issues, together with a more specific bounding of one or more typical threat scenarios, it is likely that the spread of opinion and confidence surrounding the final risk assignments would be significantly reduced.
While the risks as assigned at the workshop do not have a specific confidence envelope, this does not infer that they are either incorrect or inappropriate. Assignment of risk is inherently subjective, and this workshop has successfully secured estimates of risk from a sample of appropriate experts and expertise that can strongly inform the content of the 2014 Outlook Report.

Page | 25
Table 5. Likelihood and consequence of threats to the region—consensus judgement of the experts participating in the workshop process
THREAT LIKELIHOOD CONSEQUENCE
BROAD LOCAL
Climate change effects on weather patterns POSSIBLE-LIKELY MAJOR not assessed Climate change induced altered ocean currents POSSIBLE-ALMOST
CERTAIN
MAJOR not assessed Increased sea temperature ALMOST CERTAIN MAJOR not assessed Increasing acidity ALMOST CERTAIN MAJOR- CATASTROPHIC not assessed Rising sea level ALMOST CERTAIN MODERATE-MAJOR not assessed Outbreak of disease LIKELY MODERATE not assessed Nutrients from catchment run-off ALMOST CERTAIN MAJOR not assessed Outbreak of crown-of-thorns starfish LIKELY MAJOR not assessed Pesticides from catchment runoff LIKELY- ALMOST CERTAIN MODERATE not assessed Sediments from catchment runoff ALMOST CERTAIN MAJOR not assessed Outbreak or bloom of species other than crown-of-thorns
starfish POSSIBLE MINOR-MODERATE not assessed
Dredging the sea floor LIKELY MINOR MAJOR Dumping and resuspension of dredge material LIKELY MODERATE MAJOR Exposure of acid sulphate soils POSSIBLE MINOR MODERATE-MINOR Terrestrial point source discharge ALMOST CERTAIN MINOR not assessed Introduced non-endemic species LIKELY MODERATE-MINOR MODERATE Manufactured material discarded, disposed ALMOST CERTAIN MODERATE not assessed Artificial lighting ALMOST CERTAIN MINOR MODERATE-MINOR Artificial barrier to riverine and estuarine flows ALMOST CERTAIN MODERATE MAJOR Clearing of modifying wetlands, mangroves ALMOST CERTAIN MODERATE MAJOR Noise from human activities ALMOST CERTAIN MINOR not assessed Death or injury to wildlife – vessel strike LIKELY-ALMOST CERTAIN MINOR MINOR Retained take (extraction ) of primary producers LIKELY INSIGNIFICANT not assessed
Retained take (extraction ) of herbivores** ALMOST CERTAIN MINOR-MAJOR not assessed
Retained take (extraction ) of particle feeders ** LIKELY MINOR-MODERATE not assessed
Retained take (extraction ) of low order predators ** ALMOST CERTAIN MINOR not assessed
Retained take (extraction ) of top order predators ** ALMOST CERTAIN MODERATE not assessed
Spill – large chemical UNLIKELY MINOR MAJOR Spill – large oil POSSIBLE MODERATE MAJOR Spill – small chemical and oil LIKELY MINOR MINOR Waste discharge from a vessel ALMOST CERTAIN INSIGNIFICANT-MINOR MINOR Physical damage to non-reef benthos ALMOST CERTAIN MINOR not assessed Physical damage to reef benthos ALMOST CERTAIN MINOR MINOR Immediate or post-release effects (take) ** ALMOST CERTAIN MINOR not assessed
Illegal fishing, collecting and poaching ALMOST CERTAIN MODERATE not assessed
Grounding of large vessels (> 50 m) LIKELY-POSSIBLE MINOR MODERATE Grounding of small vessels (< 50 m) ALMOST CERTAIN INSIGNIFICANT MINOR Illegal activities (other) ALMOST CERTAIN INSIGNIFICANT not assessed
**components that were the subject of disagreement and were re-polled remotely and anonymously

Page | 26
Figure 9. Votes from the workshop for the likelihood of occurrence of threats associated with the act of dredging in coastal waters (top panels), and the consequent threats from the disposal and subsequent redistribution of dredged materials at sea, either in or near the Region. The consequences of both dredging and disposal are assessed at both the local scale (middle panels) and regional scales (bottom panels). The local consequences of disposed dredged material has the broadest distribution of expert opinion on this issue, ranging from minor to catastrophic, with a mode at major (9 of the 22 votes cast), which was transmitted as the consensus grade for this component (Table 5).
Participant workshop evaluation
Anonymous feedback
At the conclusion of the workshop, participants were invited to vote to indicate their agreement/disagreement (anonymously, as with all earlier polling) with each of the following eight statements designed to permit their evaluation of the workshop, the process and the outcomes. Participants were also invited to contribute written comments after the workshop.
Voting was sought from the participants on these statements:
“Within the constraints of a rapid assessment:
1. The structure of the decision problem was correctly framed to allow the key issues of risks to the reef to be appropriately addressed? [wholly disagree1 - wholly agree10]
2. My inputs to the workshop consensus process were able to be fully recognised and incorporated [wholly disagree1 - wholly agree10]
3. The workshop process was transparent, and potential bias was adequately managed [wholly disagree1 - wholly agree10]
4. The workshop process provided an appropriate mechanism for securing a broad consensus of expert opinion [wholly disagree1 - wholly agree10]
5. Arrangements to resolve any persisting disagreements amongst the experts seem appropriate [wholly disagree1 - wholly agree10]
6. The logistics, the facilitator and the venue arrangements were appropriate to enable an effective workshop [wholly disagree1 - wholly agree10]
0
5
10
15
Almostcertain Likely Possible Unlikely Rare
#votes
Likelihood
DREDGING
0
5
10
15
Catastrophic Major Moderate Minor Insignificant
#votes
Consequence-Local
DREDGING
0
5
10
15
20
Catastrophic Major Moderate Minor Insignificant
#votes
Consequence-Broad
DREDGING
0
5
10
15
Almostcertain Likely Possible Unlikely Rare
#votes
Likelihood
DREDGEDMATERIAL
0
5
10
Catastrophic Major Moderate Minor Insignificant
#vo
tes
Consequence-Local
DREDGEDMATERIAL
0
5
10
15
Catastrophic Major Moderate Minor Insignificant#votes
Consequence-Broad
DREDGEDMATERIAL

Page | 27
7. In general, I support the process and the outcomes [wholly disagree1 - wholly agree10]
8. I expect that the outcomes provide a robust basis for Outlook 2014 [wholly disagree1 - wholly agree10]
Any other comments or recommendations for this process of informing the Outlook report: submit either privately or openly by email to facilitator.”
Overall, the participants were highly supportive of the workshop process and the outcomes, with more than 80 per cent of votes assigned to scores of 6 or more (agreement to strong agreement with all the statements posed), and there was a substantial mode of agreement around scores of 7 and 8 (Figure 10). This infers a broadly based high level of agreement for the workshop and its outcomes. Nonetheless, for statement 4, only 60 per cent were in agreement, inferring that the process overall may not have secured a consensus of opinion from a base as broad as the participants had expected. This probably related to a perception that more time was needed to evaluate the information/data related to the components, more detailed background information was needed, or there were not enough discipline experts in attendance to discuss the context of complex issues. Key areas of support were 80 per cent agreement with statement 7, and 90 per cent agreement with statement 8, which provides a strong basis for GBRMPA to utilise the outcomes of this workshop to support the 2014 Outlook Report.
Figure 10. Participants’ votes for their extent of agreement (1 is wholly disagree, 10 is wholly agree) with the eight evaluation statements: mean % votes for each statement
Other comments
Throughout the course of the workshop, participants offered constructive comments about the workshop process, and how it might be improved for future iterations.
Condition/Trend
1. Several experts felt that it would have been useful to have an acknowledged opinion-leader or high-level scientist introduce each assessment decision with a short statement that bounds the decision problem being assessed, summarises the available evidence, and indicates their own score or grade and a short justification. This would clearly create an anchoring bias, but would probably assist with navigation to a stronger consensus position.
2. Two experts were concerned about the smoothing process inferred by determining a single grade for what is (in many components) a highly heterogeneous Region where the variability is not only a feature but may also assist in predicting local areas where residual risks may more important in the future.
0%
5%
10%
15%
20%
25%
30%
1 2 3 4 5 6 7 8 9 10
me
an %
vo
tes
disagree-agree scale
Workshop Evaluation

Page | 28
3. Several experts were concerned that the Region-scale ‘smoothing’ effect may cover up the substantial differences that exist across the Region (particularly north to south) and may be counterproductive by delaying corrective actions by setting priorities based on the Region-wide average rather than the addressing the 10 per cent ends of the distribution of condition and trend. The suggestion was that use of a spatial scale that is finer than the Region as a whole may provide a better assessment of the spatial variability (and in a different form to that provided by the 10 per cent indicators). Even though this may not be required by the Act, it may be able to provide better resolution of the issues, and hence better direct investments in corrective management actions and related research.
Risk assessment
4. A number of experts commented verbally that it would have been useful to include an explicit estimate of confidence for each grade of Likelihood or Consequence assigned. While this would be useful in future workshops of this type, it is not clear how this would be factored into final risk assignments, or (as in condition assessment) if it would be treated as contextual information.

Page | 29
Appendix 1. Grading statements
Biodiversity
Section 54(3)(b) of the Great Barrier Reef Marine Park Act 1975 requires “…an assessment of the current biodiversity within …" the Great Barrier Reef Region. This assessment is based on two assessment criteria:
habitats to support species
populations of species and groups of species.
Habitats to support species
Grading statement
Very Good All major habitats are essentially structurally and functionally intact and able to support all dependent species.
Good There is some habitat loss, degradation or alteration in some small areas, leading to minimal degradation but no persistent, substantial effects on populations of dependent species.
Poor Habitat loss, degradation or alteration has occurred in a number of areas leading to persistent substantial effects on populations of some dependent species.
Very Poor There is widespread habitat loss, degradation or alteration leading to persistent, substantial effects on many populations of dependent species.
Trend Improving Stable Deteriorating No clear trend
Confidence in condition and trend
High: Adequate high-quality evidence and high level of consensus
Medium: Limited evidence or limited consensus
Low: Very limited evidence, assessment based on anecdotal information
Populations of species and groups of species
Grading statement
Very Good Only a few, if any, populations of species have deteriorated.
Good Populations of some species (but no groups of species) have deteriorated significantly.
Poor Populations of many species or some groups of species have deteriorated significantly.
Very Poor Populations of a large number of species or groups of species have deteriorated significantly.
Trend Improving Stable Deteriorating No clear trend
Confidence in condition and trend
High: Adequate high-quality evidence and high level of consensus
Medium: Limited evidence or limited consensus
Low: Very limited evidence, assessment based on anecdotal information

Page | 30
Ecosystem health
Section 54(3)(a) of the Great Barrier Reef Marine Park Act 1975 requires “…an assessment of the current health of the ecosystem within the Great Barrier Reef Region and of the ecosystem outside that region to the extent that it affects that region”. This assessment is based on five assessment criteria:
physical processes
chemical processes
ecological processes
outbreaks of diseases, introduced species and pest species
terrestrial habitats that support the Great Barrier Reef.
Physical processes
Grading statement
Very Good There are no significant changes in physical processes.
Good There are some significant changes in physical processes in some areas, but these are not to the extent that they are significantly affecting ecosystem functions.
Poor There are substantial changes in physical processes and these are significantly affecting ecosystem functions in some areas.
Very Poor There are substantial changes in physical processes across a wide area and ecosystem functions are seriously affected in much of the area.
Trend Improving Stable Deteriorating No clear trend
Confidence in condition and trend
High: Adequate high-quality evidence and high level of consensus
Medium: Limited evidence or limited consensus
Low: Very limited evidence, assessment based on anecdotal information
Chemical processes
Grading statement
Very Good There are no significant changes in chemical processes.
Good There are some significant changes in chemical processes in some areas, but these are not to the extent that they are significantly affecting ecosystem functions.
Poor There are substantial changes in chemical processes and these are significantly affecting ecosystem functions in some areas.
Very Poor There are substantial changes in chemical processes across a wide area and ecosystem functions are seriously affected in much of the area.
Trend Improving Stable Deteriorating No clear trend
Confidence in condition and trend
High: Adequate high-quality evidence and high level of consensus
Medium: Limited evidence or limited consensus
Low: Very limited evidence, assessment based on anecdotal information

Page | 31
Ecological processes
Grading statement
Very Good There are no significant changes in ecological processes.
Good There are some significant changes in ecological processes in some areas, but these are not to the extent that they are significantly affecting ecosystem functions.
Poor There are substantial changes in ecological processes and these are significantly affecting ecosystem functions in some areas.
Very Poor There are substantial changes in ecological processes across a wide area and ecosystem functions are seriously affected in much of the area.
Trend Improving Stable Deteriorating No clear trend
Confidence in condition and trend
High: Adequate high-quality evidence and high level of consensus
Medium: Limited evidence or limited consensus
Low: Very limited evidence, assessment based on anecdotal information
Outbreaks of diseases, introduced species and pest species
Grading statement
Very Good No records of diseases above expected natural levels; no introduced species recorded; pest populations within naturally expected levels.
Good Disease occasionally above expected natural levels but recovery prompt; any occurrences of introduced species successfully addressed; pests sometimes present above natural levels with limited effects on ecosystem function.
Poor Unnaturally high levels of disease regularly recorded in some areas; occurrences of introduced species require significant intervention; pests in some areas affecting ecosystem function more than expected under natural conditions.
Very Poor Unnaturally high levels of disease often recorded in many areas; uncontrollable outbreaks of introduced pests; opportunistic pests seriously affecting ecosystem function in many areas.
Trend Improving Stable Deteriorating No clear trend
Confidence in condition and trend
High: Adequate high-quality evidence and high level of consensus
Medium: Limited evidence or limited consensus
Low: Very limited evidence, assessment based on anecdotal information

Page | 32
Terrestrial habitats that support the Great Barrier Reef
Grading statement
Very Good All major habitats are essentially structurally and functionally intact and able to support all dependent species.
Good There is some habitat loss, degradation or alteration in some small areas, leading to minimal degradation but no persistent, substantial effects on populations of dependent species.
Poor Habitat loss, degradation or alteration has occurred in a number of areas leading to persistent substantial effects on populations of some dependent species.
Very Poor There is widespread habitat loss, degradation or alteration leading to persistent, substantial effects on many populations of dependent species.
Trend Improving Stable Deteriorating No clear trend
Confidence in condition and trend
High: Adequate high-quality evidence and high level of consensus
Medium: Limited evidence or limited consensus
Low: Very limited evidence, assessment based on anecdotal information
Risks to the ecosystem
Section 54(3)(d) of the Great Barrier Reef Marine Park Act 1975 requires “…an assessment of the risks to the ecosystem…" within the Great Barrier Reef Region.
This assessment of risk is based on the current state and trends of the Great Barrier Reef ecosystem's biodiversity and health, the factors influencing the values of the Region, the effectiveness of protection and management arrangements and ultimately an understanding of the ecosystem's overall resilience.
In essence this is an assessment of the residual risk to the Region-wide ecosystem, noting the items above. For this risk assessment, threats are categorised as Region-wide or local based on the scale of the consequence. A threat may be happening in many places but when the consequence is considered, a threat is at Region-wide scale if the Region-wide ecosystem suffers, and at local scale alone if the consequence does not impact at the Region-wide scale.
For example:
Rising sea temperature happens over a very wide area and the Region-wide ecosystem as a whole suffers.
Ship groundings may happen in many places but the Region-wide system as a whole does not suffer.

Page | 33
Grading statements
Likelihood Expected frequency of a given threat
Almost Certain Expected to occur more or less continuously throughout a year
Likely Not expected to be continuous but expected to occur one or more times in a year
Possible Not expected to occur annually but expected to occur within a 10-year period
Unlikely Not expected to occur in a 10-year period but expected to occur in a 100-year period
Rare Not expected to occur within the next 100 years
Consequence Scale at which the consequence of the threat operates
Region-wide scale Local scale
Catastrophic Impact is clearly affecting, or would clearly affect, the nature of the ecosystem over a wide area.
Recovery periods greater than 20 years likely.
Major Impact is, or would be, significant at a wider level.
Recovery periods of 10 to 20 years likely.
Impact is, or would be, extremely serious and possibly irreversible to a sensitive population or community.
Condition of an affected part of the ecosystem possibly irretrievably compromised.
Moderate Impact is, or would be, present at a wider level.
Recovery periods of 5 to 10 years likely.
Impact is, or would be, extremely serious and possibly irreversible over a small area.
Recovery periods of 10 to 20 years likely.
Minor Impact is, or would be, not discernible at a wider level.
Impact would not impair the overall condition of the ecosystem, including sensitive populations or communities, over a wider level.
Impact is, or would be, significant to a sensitive population or community at a local level.
Recovery periods of 5 to 10 years likely.
Insignificant No impact or if impact is, or would be, present then only to the extent that it has no discernible effect on the overall condition of the ecosystem at a wider scale.
No impact or if impact is, or would be, present then only to the extent that it has no discernible effect on the overall condition of the ecosystem.

Page | 34
Combining likelihood and consequence to assign risk
Consequence
Likelihood Insignificant Minor Moderate Major Catastrophic
Almost Certain Low Medium High Very High Very High
Likely Low Medium High High Very High
Possible Low Low Medium High Very High
Unlikely Low Low Low Medium High
Rare Low Low Low Medium High

Page | 35
Appendix 2. Workshop participants
Participant Institution Day 1 Day 2 Day 3 Remote contribution
Ken Anthony Australian Institute of Marine Science
✔
Tony Ayling Sea Research ✔ ✔ ✔
Alvaro Berg Soto James Cook University ✔ ✔
Richard Brinkman Australian Institute of Marine Science
✔ ✔ ✔
Rob Coles James Cook University ✔ ✔ ✔
Catherine Collier James Cook University ✔ ✔
Brad Congdon James Cook University ✔ ✔ ✔
Guillermo Diaz Pulido
Griffith University ✔ ✔
Peter Doherty Australian Institute of Marine Science
✔ ✔ ✔
Leanne Fernandes Earth to Ocean ✔ ✔ ✔
Ashley Frisch James Cook University ✔
Mark Hamann James Cook University ✔ ✔
Kirsten Heimann James Cook University ✔ ✔ ✔
Pat Hutchings Australian Museum ✔ ✔ ✔
Frederieke Kroon CSIRO ✔ ✔ ✔
Stephen Lewis James Cook University ✔ ✔
Vimoksalehi Lukoschek
James Cook University ✔ ✔
Jamie Oliver Australian Institute of Marine Science
✔
Queensland Wetlands Program
Queensland Department of Environment and Heritage Protection
✔
Sue Sargent Burnett Mary Regional Group ✔ ✔ ✔

Page | 36
Participant Institution Day 1 Day 2 Day 3 Remote contribution
Britta Schaffelke Australian Institute of Marine Science
✔ ✔ ✔
Colin Simpfendorfer James Cook University ✔ ✔ ✔
Hugh Sweatman Australian Institute of Marine Science
✔ ✔ ✔
Linda Tonk University of Queensland ✔ ✔
Trevor Ward Greenward Consulting (facilitator)
✔ ✔ ✔
Jane Waterhouse C2O consulting ✔
Nicole Webster Australian Institute of Marine Science
✔ ✔ ✔
Clive Wilkinson Independent ✔ ✔ ✔
Dave Williamson James Cook University ✔ ✔ ✔
Bette Willis James Cook University ✔ ✔ ✔
Michelle Winning
Queensland Department of Agriculture, Fisheries and Forestry
✔ ✔ ✔