Rhode Island; Coastal Buffer Zone Planting Guide - University of Rhode Island

D E C E M B E R , 2 0 1 3
1 | P a g e
Providence Race to the Top Implementation Update: School Year 2012-2013 (Year 3) ________________________________________________________________________________________________
The Annual Stocktaking provides both the state and the Local Education Agency (LEA) with an opportunity to review LEA accomplishments and challenges over the course of the Race to the Top (RTT) grant implementation period (i.e., from September 2010 to date). In this summary, RIDE has included relevant LEA-reported data as well as other evidence sources (e.g., training participation) for the purposes of reviewing programmatic successes. The contents of this report were developed under a Race to the Top grant from the U.S. Department of Education. However, those contents do not necessarily represent the policy of the U.S. Department of Education, and you should not assume endorsement by the Federal Government.
This report also includes areas that LEAs self-identified as challenges in their ability to meet Race to the Top commitments. Additionally, Appendix A provides a summary of LEA progress against the student achievement targets set at the start of the grant.
LEA Self-Assessment of Year Three Performance The table below shows Providence self-reported status against the Year 3 Race to the Top projects. During Year 3, Providence has fully participated in the following projects: Model Curriculum and Intensive Curriculum Alignment, Formative Assessment and Data Use professional development, Educator Evaluation, the Instructional management System, and New Teacher Induction.
In addition, during Year 4, Providence may deepen their participation in the above mentioned initiatives as well as expand participation to include the Interim Assessment tools.
ON-TRACK The majority of tasks from the prior quarter are complete, and tasks from the current quarter are on-track to be completed.
DELAYED Some tasks from the prior quarter are complete, but others have yet to be completed, and/or the district may have difficulty completing the current tasks in the anticipated time frame.
OFF TRACK The majority of tasks anticipated to date have not been completed and/or the LEA is having significant challenges with some tasks.
NOT APPLICABLE The district elected not to participate in this project during the 2012-2013 school year.
Performance Management Participation As you know, participation in the Collaborative Learning for Outcomes (CLO) process and the submission of the corresponding quarterly progress report is our method for monitoring LEA progress against implementing RTT. More importantly, though, we believe that quality implementation of RTT is best supported through peer-to-peer sharing and that the CLO meetings provide LEAs with an opportunity to gain insights on how to address specific challenges of capacity and practice.
During the 2012-2013 year, Providence met the bar for participation in all four quarterly CLO meetings. All quarterly progress reports were submitted on time, and Providence sent consistent participants to the quarterly meetings, representing appropriate levels of LEA leadership.
In the upcoming year, we are looking forward to continuing our meaningful conversations around the implementation accomplishments and challenges faced by each LEA, as well as discussing how LEAs are building the necessary capacity to sustain this work beyond Race to the Top. With that in mind, we would encourage you to continue sharing the tools and strategies you are using in your district and have made suggestions in this report regarding areas that we would appreciate hearing about in greater detail from you and other LEA leaders.
As we near the end of the grant, we hope that Providence continues to participate at this exemplary level. We are looking forward to rich and meaningful conversation around implementation accomplishments and challenges, as well as the changes that LEAs will sustain beyond the grant period. With that in mind, we encourage you to be an active voice in shaping the focus of these meetings during Year 4.
CURRICULUM ALIGNMENT
FORMATIVE ASSESSMENT PD
INTERIM ASSESSMENTS
INSTRUCTIONAL MANAGEMENT
SYSTEM
DATA USE PD EDUCATOR EVALUATION
NEW TEACHER INDUCTION
Q1 Q2 Q3 Q4 Q1 Q2 Q3 Q4 Q1 Q2 Q3 Q4 Q1 Q2 Q3 Q4 Q1 Q2 Q3 Q4 Q1 Q2 Q3 Q4 Q1 Q2 Q3 Q4
Transforming Education in Rhode Island
The Race to the Top Opportunity
2 | P a g e
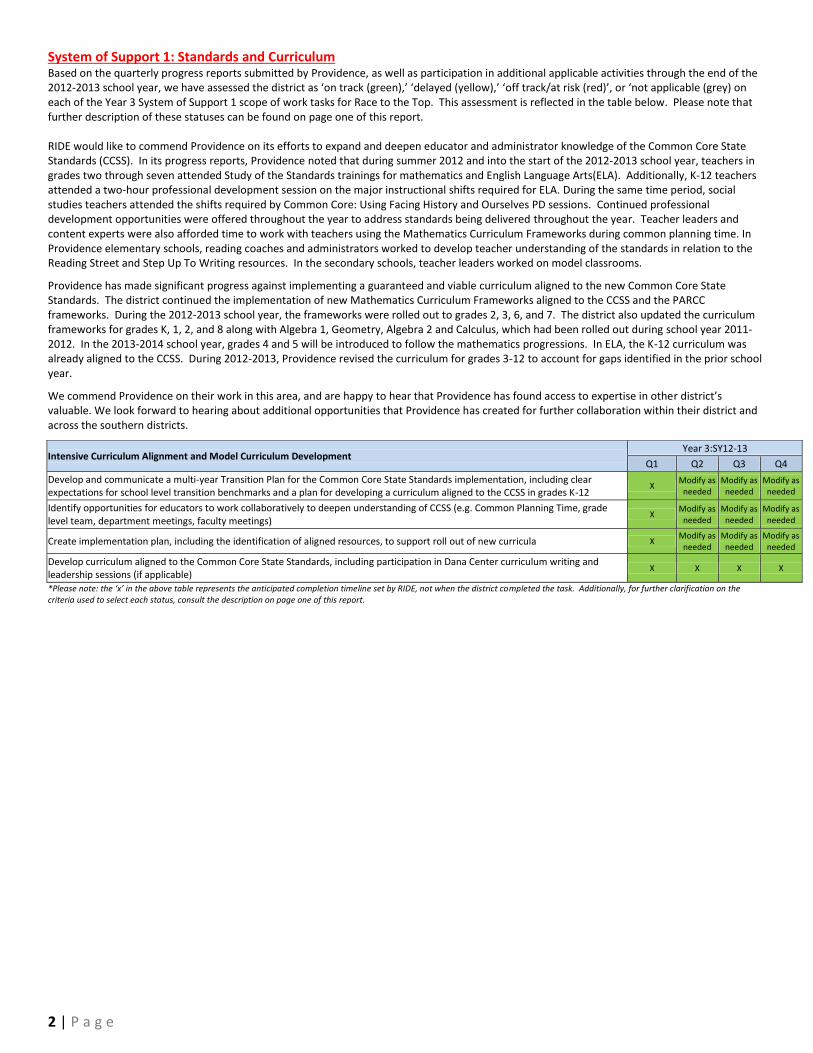
System of Support 1: Standards and Curriculum Based on the quarterly progress reports submitted by Providence, as well as participation in additional applicable activities through the end of the 2012-2013 school year, we have assessed the district as ‘on track (green),’ ‘delayed (yellow),’ ‘off track/at risk (red)’, or ‘not applicable (grey) on each of the Year 3 System of Support 1 scope of work tasks for Race to the Top. This assessment is reflected in the table below. Please note that further description of these statuses can be found on page one of this report. RIDE would like to commend Providence on its efforts to expand and deepen educator and administrator knowledge of the Common Core State Standards (CCSS). In its progress reports, Providence noted that during summer 2012 and into the start of the 2012-2013 school year, teachers in grades two through seven attended Study of the Standards trainings for mathematics and English Language Arts(ELA). Additionally, K-12 teachers attended a two-hour professional development session on the major instructional shifts required for ELA. During the same time period, social studies teachers attended the shifts required by Common Core: Using Facing History and Ourselves PD sessions. Continued professional development opportunities were offered throughout the year to address standards being delivered throughout the year. Teacher leaders and content experts were also afforded time to work with teachers using the Mathematics Curriculum Frameworks during common planning time. In Providence elementary schools, reading coaches and administrators worked to develop teacher understanding of the standards in relation to the Reading Street and Step Up To Writing resources. In the secondary schools, teacher leaders worked on model classrooms.
Providence has made significant progress against implementing a guaranteed and viable curriculum aligned to the new Common Core State Standards. The district continued the implementation of new Mathematics Curriculum Frameworks aligned to the CCSS and the PARCC frameworks. During the 2012-2013 school year, the frameworks were rolled out to grades 2, 3, 6, and 7. The district also updated the curriculum frameworks for grades K, 1, 2, and 8 along with Algebra 1, Geometry, Algebra 2 and Calculus, which had been rolled out during school year 2011-2012. In the 2013-2014 school year, grades 4 and 5 will be introduced to follow the mathematics progressions. In ELA, the K-12 curriculum was already aligned to the CCSS. During 2012-2013, Providence revised the curriculum for grades 3-12 to account for gaps identified in the prior school year.
We commend Providence on their work in this area, and are happy to hear that Providence has found access to expertise in other district’s valuable. We look forward to hearing about additional opportunities that Providence has created for further collaboration within their district and across the southern districts.
Intensive Curriculum Alignment and Model Curriculum Development Year 3:SY12-13
Q1 Q2 Q3 Q4
Develop and communicate a multi-year Transition Plan for the Common Core State Standards implementation, including clear expectations for school level transition benchmarks and a plan for developing a curriculum aligned to the CCSS in grades K-12
X Modify as
needed Modify as
needed Modify as
needed
Identify opportunities for educators to work collaboratively to deepen understanding of CCSS (e.g. Common Planning Time, grade level team, department meetings, faculty meetings)
X Modify as
needed Modify as
needed Modify as
needed
Create implementation plan, including the identification of aligned resources, to support roll out of new curricula X Modify as
needed Modify as
needed Modify as
needed
Develop curriculum aligned to the Common Core State Standards, including participation in Dana Center curriculum writing and leadership sessions (if applicable)
X X X X
*Please note: the ‘x’ in the above table represents the anticipated completion timeline set by RIDE, not when the district completed the task. Additionally, for further clarification on the criteria used to select each status, consult the description on page one of this report.

3 | P a g e
System of Support 2: Instructional Improvement Systems During the 2012-2013 school year, Providence chose to implement three of the four Race to the Top projects in System of Support 2. Based on the quarterly progress reports submitted by Providence, as well as participation in additional applicable activities through the end of the 2012-2013 school year, we have assessed the district on each of the Year 3 scope of work tasks for those applicable projects.
In addition to configuring the Instructional Management System (IMS) to provide educator access to both Interim Assessments and the Formative Assessment PD modules, Providence schools were encouraged to participate in the Formative Assessment PD modules during the 2012-2013 school year. While participation was limited due to technical challenges, Providence noted in their quarterly progress update report that they will once again encourage teachers to participate in the modules and communities of practice during SY13-14. PPSD curriculum was also loaded into the IMS, and Providence ‘super-trainers’ were trained by the IMS vendor. At the conclusion of the school year, Providence had made good progress in getting their teachers to validate their single sign-on accounts, a necessary pre-step to utilizing the IMS platform. Additionally, the district provided all teachers with the opportunity to participate in IMS end-user training provided by building-based technology support teachers.
Staff from Providence attended the Interim Assessment fixed-form and test construction tool trainings for informational purposes. While the district opted not to implement the fixed-form assessments, they intended to use the Test Construction Tool to build out end of quarter exams for grades 3-8 in ELA and mathematics. As of the end of the year, Providence had yet to engage in the Test Construction Tool due to functionality issues with the system. RIDE anticipates that, once the test construction and reporting are fully operational, Providence will use the system at a scale and scope that makes sense for their students and district.
During the 2012-2013 school year, three schools from Providence participated in the Data Use professional development series. The Principals from Carl Lauro, Gilbert Stuart, and Alvarez selected school data leadership team members that were able to sustain the work at the building and classroom level beyond the implementation period. As noted in the QPU reports, the district’s intention was that the protocols and processes from the training would become the standard mechanism for gathering and disseminating data throughout the school year.
In the upcoming CLO sessions, we look forward to hearing about the Providence’s plans for expanding the data use protocols, as well as supporting deeper engagement in initiatives implemented during the 2012-2013 school year.
Interim Assessments (accessed via the Instructional Management System) Year 3:SY12-13
Q1 Q2 Q3 Q4
Develop protocols or expectations regarding the use of interim assessment to inform instruction including timelines for administration and process for scoring and reporting results
X
Send LEA-determined facilitators to RIDE provided training on both the Fixed-Form assessment tool and the test-building tool Fixed Form Test
Builder
Train of educators in the LEA on the administration and use of interim assessments utilizing RIDE-trained facilitators X X X X
Administration of Interim Assessments in selected grades and content area(s) 1st Fixed Form Test
2nd Fixed Form Test
3rd Fixed Form Test
Instructional Management System (IMS) Year 3:SY12-13
Q1 Q2 Q3 Q4
Designate an LEA data steward to support decision making around data collections and systems implementation and to provide input and feedback on data initiatives through designated representatives
As needed As needed As needed As needed
Maintain data quality standards of local student information systems and upload local assessment data and program information as required by RIDE in a timely manner
X X X X
Following RIDE training, LEA Administrative Users and LEA Trainers configure the IMS for educator use and to provide end users with access and training needed to utilize the IMS for daily activities
X X X X
Deepen the understanding and use of the IMS among all educators X X X X
‘Data Use’ Professional Development Year 3:SY12-13
Q1 Q2 Q3 Q4
In coordination with RIDE, select ‘Data Use’ training dates for each cohort of schools, as applicable
Year 2
Identify and provide RIDE with the leadership team members from each school who will participate in Year 2 training cohorts, as applicable
Year 2
Following ‘Data Use’ professional development, identify district and school practices to sustain and deepen data use and collaboration
Year 1 Year 1 Year 1 Year 1
* Please note that, for this project, ‘year 1’ refers to cohort 1 taking place during the 2012-2013 school year, and ‘Year 2’ refers to cohort 2 taking place during the 2013-2014 school year.
Formative Assessment Professional Development Modules (accessed via the Instructional Management System) Year 3:SY12-13
Q1 Q2 Q3 Q4
Identify facilitators who will support the implementation of formative assessment practices in daily instruction
SY13-14
Coordinate participation of educators in training modules and communities of practice SY12-13 SY12-13 SY12-13 SY13-14
4 | P a g e
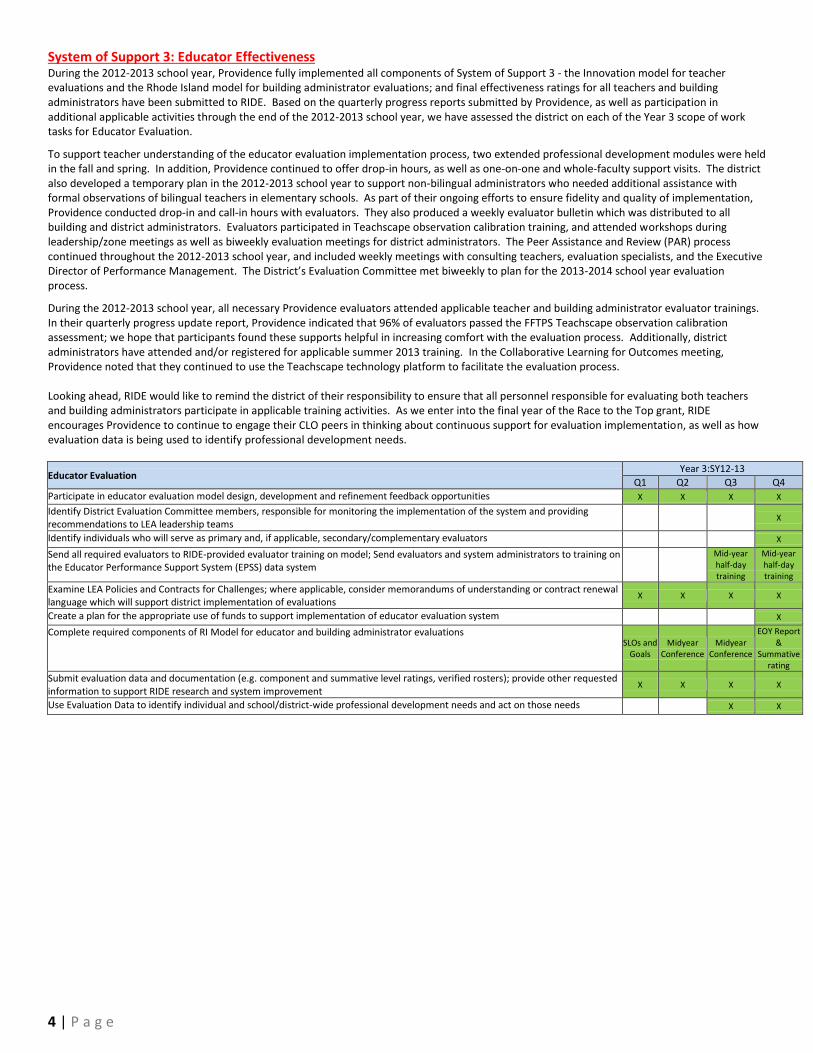
System of Support 3: Educator Effectiveness During the 2012-2013 school year, Providence fully implemented all components of System of Support 3 - the Innovation model for teacher evaluations and the Rhode Island model for building administrator evaluations; and final effectiveness ratings for all teachers and building administrators have been submitted to RIDE. Based on the quarterly progress reports submitted by Providence, as well as participation in additional applicable activities through the end of the 2012-2013 school year, we have assessed the district on each of the Year 3 scope of work tasks for Educator Evaluation.
To support teacher understanding of the educator evaluation implementation process, two extended professional development modules were held in the fall and spring. In addition, Providence continued to offer drop-in hours, as well as one-on-one and whole-faculty support visits. The district also developed a temporary plan in the 2012-2013 school year to support non-bilingual administrators who needed additional assistance with formal observations of bilingual teachers in elementary schools. As part of their ongoing efforts to ensure fidelity and quality of implementation, Providence conducted drop-in and call-in hours with evaluators. They also produced a weekly evaluator bulletin which was distributed to all building and district administrators. Evaluators participated in Teachscape observation calibration training, and attended workshops during leadership/zone meetings as well as biweekly evaluation meetings for district administrators. The Peer Assistance and Review (PAR) process continued throughout the 2012-2013 school year, and included weekly meetings with consulting teachers, evaluation specialists, and the Executive Director of Performance Management. The District’s Evaluation Committee met biweekly to plan for the 2013-2014 school year evaluation process.
During the 2012-2013 school year, all necessary Providence evaluators attended applicable teacher and building administrator evaluator trainings. In their quarterly progress update report, Providence indicated that 96% of evaluators passed the FFTPS Teachscape observation calibration assessment; we hope that participants found these supports helpful in increasing comfort with the evaluation process. Additionally, district administrators have attended and/or registered for applicable summer 2013 training. In the Collaborative Learning for Outcomes meeting, Providence noted that they continued to use the Teachscape technology platform to facilitate the evaluation process. Looking ahead, RIDE would like to remind the district of their responsibility to ensure that all personnel responsible for evaluating both teachers and building administrators participate in applicable training activities. As we enter into the final year of the Race to the Top grant, RIDE encourages Providence to continue to engage their CLO peers in thinking about continuous support for evaluation implementation, as well as how evaluation data is being used to identify professional development needs.
Educator Evaluation Year 3:SY12-13
Q1 Q2 Q3 Q4
Participate in educator evaluation model design, development and refinement feedback opportunities X X X X
Identify District Evaluation Committee members, responsible for monitoring the implementation of the system and providing recommendations to LEA leadership teams
X
Identify individuals who will serve as primary and, if applicable, secondary/complementary evaluators X
Send all required evaluators to RIDE-provided evaluator training on model; Send evaluators and system administrators to training on the Educator Performance Support System (EPSS) data system
Mid-year half-day training
Mid-year half-day training
Examine LEA Policies and Contracts for Challenges; where applicable, consider memorandums of understanding or contract renewal language which will support district implementation of evaluations
X X X X
Create a plan for the appropriate use of funds to support implementation of educator evaluation system X
Complete required components of RI Model for educator and building administrator evaluations SLOs and
Goals Midyear
Conference Midyear
Conference
EOY Report &
Summative rating
Submit evaluation data and documentation (e.g. component and summative level ratings, verified rosters); provide other requested information to support RIDE research and system improvement
X X X X
Use Evaluation Data to identify individual and school/district-wide professional development needs and act on those needs X X
5 | P a g e
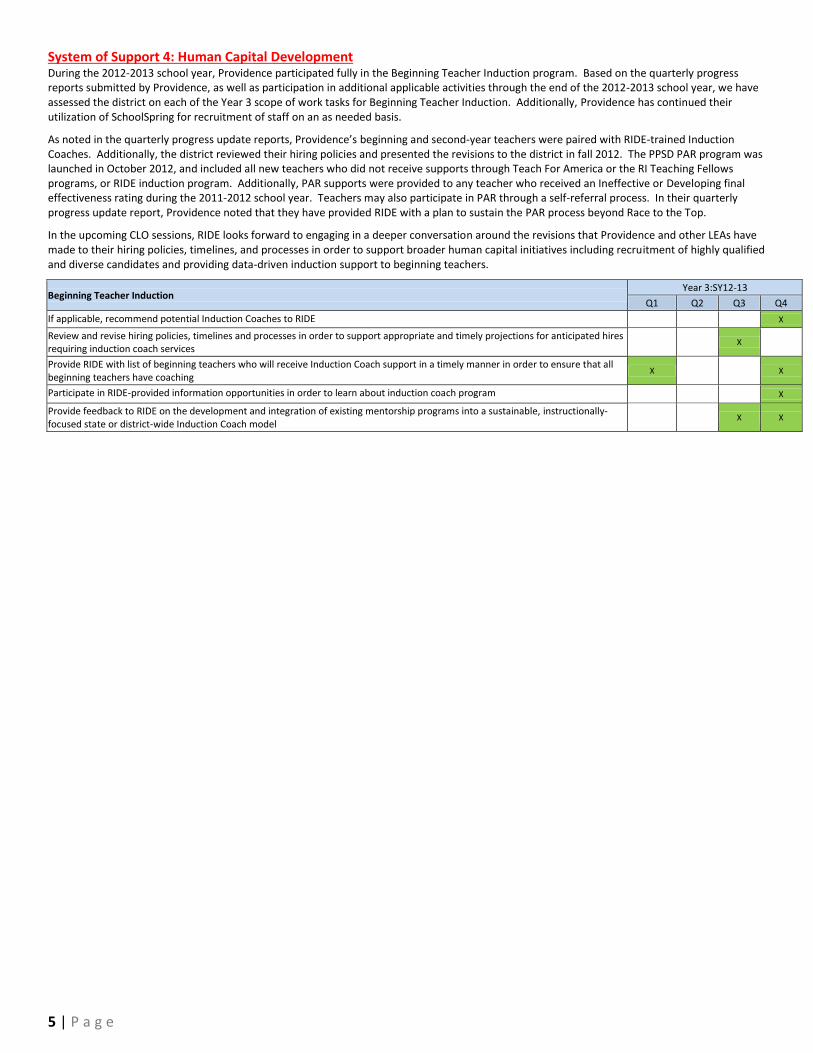
System of Support 4: Human Capital Development During the 2012-2013 school year, Providence participated fully in the Beginning Teacher Induction program. Based on the quarterly progress reports submitted by Providence, as well as participation in additional applicable activities through the end of the 2012-2013 school year, we have assessed the district on each of the Year 3 scope of work tasks for Beginning Teacher Induction. Additionally, Providence has continued their utilization of SchoolSpring for recruitment of staff on an as needed basis.
As noted in the quarterly progress update reports, Providence’s beginning and second-year teachers were paired with RIDE-trained Induction Coaches. Additionally, the district reviewed their hiring policies and presented the revisions to the district in fall 2012. The PPSD PAR program was launched in October 2012, and included all new teachers who did not receive supports through Teach For America or the RI Teaching Fellows programs, or RIDE induction program. Additionally, PAR supports were provided to any teacher who received an Ineffective or Developing final effectiveness rating during the 2011-2012 school year. Teachers may also participate in PAR through a self-referral process. In their quarterly progress update report, Providence noted that they have provided RIDE with a plan to sustain the PAR process beyond Race to the Top.
In the upcoming CLO sessions, RIDE looks forward to engaging in a deeper conversation around the revisions that Providence and other LEAs have made to their hiring policies, timelines, and processes in order to support broader human capital initiatives including recruitment of highly qualified and diverse candidates and providing data-driven induction support to beginning teachers.
Beginning Teacher Induction Year 3:SY12-13
Q1 Q2 Q3 Q4
If applicable, recommend potential Induction Coaches to RIDE
X
Review and revise hiring policies, timelines and processes in order to support appropriate and timely projections for anticipated hires requiring induction coach services
X
Provide RIDE with list of beginning teachers who will receive Induction Coach support in a timely manner in order to ensure that all beginning teachers have coaching
X X
Participate in RIDE-provided information opportunities in order to learn about induction coach program X
Provide feedback to RIDE on the development and integration of existing mentorship programs into a sustainable, instructionally-focused state or district-wide Induction Coach model
X X

6 | P a g e
System of Support 5: School Transformation and Innovation During the 2012-2013 school year, Providence continued to implement key school turnaround activities to ensure that Cohort I and II identified persistently lowest achieving schools moved forward on their respective plans to increase student achievement. We appreciate that, during the 2012-2013 school year, Providence maintained an active partnership with RIDE and that the district and schools jointly worked to ensure that school leadership teams participated in the professional development activities outlined in the scope of work tasks and commitments under Race to the Top. We encourage the district to refer to the monitoring and reporting completed under the school turnaround efforts for a more robust synopsis of that work.
School Achievement Specialists Year 3:SY12-13
Q1 Q2 Q3 Q4
Work with RIDE to establish progress monitoring plan for School Achievement Specialist vendor X
Monitor the effectiveness of cohort I and II school achievement specialists supporting identified schools in collaboration with RIDE X
Adjust and modify School Achievement Specialist supports to PLAs as needed X
Turnaround Principal Leaders Corps Year 3:SY12-13
Q1 Q2 Q3 Q4
Identify and recommend to RIDE school-based, district-based and non school-based leaders within the LEA as potential participants for the turnaround principal leadership corps group I and group II
II II
Turnaround Principal Corps members attend residency and professional development as offered by RIDE X X X X
Determine the placement for Turnaround Principal Leader corps members following successful completion of residency program X X
Spring 2012 and Summer Leadership Institute Year 3:SY12-13
Q1 Q2 Q3 Q4
Provide feedback on the design and delivery of spring 2012 and summer institutes X
Identify a core team to attend spring 2012 and summer institutes X
Attend spring 2012 and summer institute training
Summer 2013
Identify the need for up to 5 days of additional job-embedded follow-up to spring 2012/summer institute and coordinate delivery with the RIDE vendor
X
Teacher Evaluation Support Year 3:SY12-13
Q1 Q2 Q3 Q4
Hire/procure Teacher Evaluation Support services X
Work with RIDE to establish progress monitoring plan for Teacher Evaluation Support services and/or vendor X
Monitor the effectiveness of Teacher Evaluation Support vendor/services X X X X
The contents of this report were developed under a Race to the Top grant from the U.S. Department of Education. However, those contents do not
necessarily represent the policy of the U.S. Department of Education, and you should not assume endorsement by the Federal Government.

Appendix A: Overall District Goals and Performance Measures
The table below contains each district’s previously established performance measures. These measures provide the state and district with a baseline from which to monitor progress, be held accountable, and recognize success as we advance toward our goals. Please note: The RTT accountability goals set below are separate and performance against those goals does not have an impact on the state-wide accountability system. Additionally, since setting the goals, the US Department of Education has requested that the state revise its goals on college enrollment and college course completion. Therefore, at this time, we have not updated your progress towards these post-secondary goals. Each district has an opportunity to review their current data and revise the goals to better align with the state goals on these measures.
Providence Performance Measures 2009- 2010
2010- 2011
2011- 2012
2012- 2013
2013- 2014
2014-2015
Actual Goal Actual Goal Actual Goal Actual Goal Actual Goal
Students entering the fourth grade will be proficient in reading on NECAP
44% - 47% 48% 46% 54% 45.5% 60% 70%
-The gap between white and black students will be cut in half
19 - 15 17 15 15 5 11 9.5
-The gap between white and Hispanic students will be cut in half
18 - 15 16 21 14 4 11 9
-The gap between non-economically disadvantaged students and economically disadvantaged students will be cut in half
21 - 5 19 16 17 14 14 10.5
-The gap between students without IEPs and those with IEPs will be cut in half
40 - 43 37 40 34 46 27 20
Students entering the fourth grade will be proficient in mathematics on NECAP
35% - 41% 38% 43% 45% 43% 52% 60%
-The gap between white and black students will be cut in half
23 - 19 21 21 19 10 15 11.5
-The gap between white and Hispanic students will be cut in half
17 - 13 15 17 13 8 10 8.5
-The gap between non-economically disadvantaged students and economically disadvantaged students will be cut in half
12 - 3 10 12 9 10 8 6
-The gap between students without IEPs and those with IEPs will be cut in half
31 - 37 28 39 24 41 20 15.5
Students entering the eighth grade will be proficient in reading on NECAP
45% - 45% 50% 52% 55% 57% 62% 70%
-The gap between white and black students will be cut in half
18 - 10 16 21 14 16 12 9
-The gap between white and Hispanic students will be cut in half
15 - 15 13 23 11 21 9 7.5
-The gap between non-economically disadvantaged students and economically disadvantaged students will be cut in half
2 - 5.7 2 9 1 2 1 1
-The gap between students without IEPs and those with IEPs will be cut in half
43 - 40 40 50 36 39 30 21.5
Students entering the eighth grade will be proficient in mathematics on NECAP
28% - 26% 33% 31% 38% 33% 45% 50%
-The gap between white and black students will be cut in half
21 - 14 19 21 17 6 14 10.5
-The gap between white and Hispanic students will be cut in half
19 - 14 17 22 15 10 13 9.5
-The gap between non-economically disadvantaged students and economically disadvantaged students will be cut in half
10 - 5 8 11 7 12 6 5
-The gap between students without IEPs and those with IEPs will be cut in half
31 - 27 28 30 24 35 20 15.5
85% of students who first entered 9th grade 4 years prior will graduate from high school
66% - n/a* 67% 66% 69% 65% 71% 73%
77% of students who graduate from high school will enroll in an institution of higher education (IHE) within 16 months of receiving a diploma
61% - n/a 63% 59% 65% n/a 66% 67%
70% of high school students who enroll in an institution of higher education within 16 months of graduation will at least one year's worth of credit within two years of enrollment in the IHE
72% - n/a 73% n/a 74% n/a 75% 77%
*n/a indicates that the data is not available, either because the n size is below 20 or because there are no students in that category. Additionally, a hyphen ( - ) indicates that the LEA did not set a goal for the applicable performance measure.