The Quest Salary Survey & Staffing Trends 2014/15 Salary Survey & Staffing Trends 2014/15 ... 3.4...
100
-
Upload
truonghanh -
Category
Documents
-
view
218 -
download
0
Transcript of The Quest Salary Survey & Staffing Trends 2014/15 Salary Survey & Staffing Trends 2014/15 ... 3.4...


The Quest Salary Survey & Staffing Trends 2014/15
First published October 2014
Publisher: Quest Staffing Solutions (Pty) Ltd
Executive Sponsor:Kay Vittee (MBA, B.Com)Chief Executive Officer, Quest Staffing Solutions (Pty) Ltd
Editors: KC Makhubele (MBA, B.Com)Quest Staffing Solutions (Pty) Ltd;Andy Quinan, Database Solutions
Research Analyst:Fungai Chigwendere (Msc Mgt Research, B.Com)Quest Staffing Solutions (Pty) Ltd
Research Analysis & Statistics: Analogue Marketing Information Services
Design & Production:June15 Brand Movement
Copyright: All rights are reserved by Quest Staffing Solutions (Pty) Ltd. No part of this publication may be reproduced, stored in a retrieval system or transmitted, in any form or by any means, electronic, mechanical, photocopying, recording or otherwise, without the prior written permission of the copyright owner.
Copyright © text, data, tables and graphs: Quest Staffing Solutions (Pty) LtdCopyright © published edition: Quest Staffing Solutions (Pty) Ltd
Quest Salary Survey & Staffing Trends 2014/15 ©
| 1
TM
Contents
FOREWORD 3
INTRODUCTION 4
EXECUTIVE SUMMARY 5
Key findings 5
Section i: General survey 5
Section ii: Contact centre survey 5
Section iii: Recruitment services uptake 6
Section iv: Staffing trends 2014/2015 6
METHODOLOGY 7
REPORT & ANALYSIS OF FINDINGS 10
SECTION I 10-61
1 WHITE COLLAR SURVEY RESULTS 10
1.1 Profile of respondents 10
1.2 Primary White Collar Positions 12
1.2.1 National 12
1.2.2 Gauteng 17
1.2.3 Western Cape 20
1.2.4 KwaZulu-Natal 22
1.2.5 Other Provinces 24
1.2.6 Analysis of Median Salary by province 25
1.2.7 Construction & Engineering: Permanent Salaries (general) 28
1.2.8 Education & Business/Professional Services (general) 30
1.2.9 Financial Services (general) 32
1.2.10 Industrial/Manufacturing (general) 36
1.2.11 Information Technology & Telecommunications (general) 39
1.2.12 Logistics & Distribution (general) 41
1.2.13 Travel, Media & Entertainment (general) 43
1.3 Industry-Specific White Collar Positions 45
1.3.1 Financial Services 45
1.3.2 Construction & Engineering 46
1.3.3 Industrial/Manufacturing 47
1.3.4 Logistics & Distribution 47
1.3.5 Information Technology & Telecommunications 47
1.4 Provincial Median Salaries Comparison 48
1.4.1 Permanent 0 – 5 years experience 48
1.4.2 Permanent 5 or more years experience 50
1.5 Size of company median salaries comparison (permanent) 53
1.5.1 1 to 50 employees (National) 53
1.5.2 50 to 100 employees (National) 55
1.5.3 100 to 500 employees (National) 57
1.5.4 500+ employees (National) 58
1.6 Size of company median salaries comparison (temporary
salaries & commission) 60
1.6.1 500+ employees 60

Quest Salary Survey & Staffing Trends 2014/15 ©
| 2
TM
Contents
SECTION II 62-81
2 CONTACT CENTRE SALARY SURVEY RESULTS 62-81
2.1 Profile of respondents 63
2.2 Contact Centre Agent Salaries 65
2.2.1 National 65
2.2.2 Gauteng 67
2.2.3 Western Cape 68
2.2.4 KwaZulu-Natal 69
2.2.5 Financial Services 70
2.2.6 BPO Outsourcing 72
2.3 Contact Centre Supervisor/Manager Salaries 74
2.3.1 National 74
2.3.2 Gauteng 75
2.3.3 BPO Outsourcing 76
2.4 Contact Centre Support Staff Salaries 76
2.4.1 National 76
2.4.2 Gauteng 78
2.4.3 Western Cape, KwaZulu-Natal 79
2.4.4 BPO Outsourcing 81
SECTION III 82-86
3 AN OUTLOOK ON SERVICES OFFERED BY
RECRUITMENT AGENCIES 82-86
3.1 Outsourced Staffing Services 83
3.2 Permanent Placement Services 83
3.3 Field Service 83
3.4 Recruitment Process Outsourcing Service 83
3.5 Managed Service Providers (MSPs) Service 83
SECTION IV 87-93
4 QUEST’S PICK OF THE KEY STAFFING AND
RECRUITMENT TRENDS FOR 2014/15 87-93
4.1 Employer Trends 88
4.2 Employee Trends 91
SECTION V 94-96
5 ABOUT QUEST 94-96
5.1 ABOUT QUEST 95
5.2 Quest Services Offering 9699

Quest Salary Survey & Staffing Trends 2014/15 ©
| 3
TM
Whether you are a business owner starting or expanding your
business or a job seeker searching for the ideal company to work
for, in order to make good business, financial or career decisions,
there is critical information that you need to know.
For example, wouldn’t it be useful to know the average salary
for a specific position within a particular industry, by area? by
province? differentiating between levels of experience and
temporary or permanent employment?
How about the financial and employment opportunities in each
province?
The aim of the research presented in this report is to provide these
kinds of benchmarks.
The report which follows outlines the research results of white
collar salary levels across South Africa.
The research was conducted via an online questionnaire, which
was designed to be quick and easy for respondents to complete.
Data collected included high, low and median salary levels across
a wide range of common job functions. Survey respondents were
also given the opportunity to give additional comments. This
allowed for further insights and trends to be identified such as
factors influencing recruitment and job-seeker motivation to join
a company.
The intention of this report is to present the results in an easy-to-
read format for all stakeholders, business owners and managers,
recruiters and job seekers.
We hope that you find this report of tremendous value.
Kay Vittee, Chief Executive Officer
Quest Staffing Solutions (Pty) Ltd
FOREWORDBy Kay Vittee
Kay Vittee, Chief Executive Officer Quest Staffing Solutions (Pty) Ltd

Quest Salary Survey & Staffing Trends 2014/15 ©
| 4
TM
There are a number of syndicated and subscription-based salary
research services that offer accurate salary information, at a price.
Quest has produced a white collar salary survey which covers 38
key job functions employed by the greater majority of companies,
as well as a number of additional industry-specific job functions.
The objective of this survey is to set industry benchmarks, in an
easily accessible format. This allows South African businesses
of all sizes the opportunity to compare salaries across several
experience levels and all nine provinces, at no cost to themselves.
When the survey was launched in June 2014, Quest received
an enthusiastic response from business as a whole. The volume
of responses received for the general industry survey (section I)
was high with valid responses from 418 companies representing
all nine provinces and major industry sectors. For the contact
centre survey (section II), valid responses were received from 150
companies. The majority of these responses were from Gauteng,
Western Cape and KwaZulu-Natal. A unique aspect of Quest’s
contact centre salary survey is that the data reveals the salary
differences between permanent and temporary staff employed
directly by the company and through agencies.
A detailed analysis of the respondents is provided in section
I for the general industry survey and section II for the contact
centre survey. The survey report was designed as a quick and easy
reference tool for high, low and median salary levels across a wide
range of common job functions, with additional comments and
insights added where necessary.
The report consists of tables depicting the median salary level for
each job function as well as the minimum (less the lowest 10%
of responses received) and maximum (less the highest 10% of
responses received) salary levels. We chose not to include data
where the response level (“n” = number in the tables) was less
than five and as a result the reader will observe gaps in these
instances - as the data was insufficiently validated. Despite
this strict validation discipline, we managed to maintain a very
comprehensive set of result tables - covering the entire industry
spectrum and each of the major provinces: Gauteng, KwaZulu-
Natal and Western Cape. The data on the six remaining provinces
was merged to form a category “Other Provinces”.
We hope that the report will prove useful to recruiters and
management as the data included provides a valid and easily
accessible reference tool to benchmark white collar salary levels
across the country.
INTRODUCTION
“The data on the six remaining provinces was merged to form a category “Other Provinces”.

Quest Salary Survey & Staffing Trends 2014/15 ©
| 5
TM
KEY FINDINGSSection I: General industry survey
• Use of temporary versus permanent staff:
- 64.4% of respondent companies employ temporary/contract
staff in addition to their permanent staff.
- The highest paid temporary staff are in the industrial and
manufacturing industry. This industry pays substantially higher
salaries for every temporary job function, when compared to
the national median salaries for temporary staff. For example,
Bookkeepers are paid 38.8% more and Admin/Office Managers
30.8% more.
• Median Salary differences by experience level & province:
Salaries of employees with less than five years experience in
Gauteng are 7.3% higher than the national median level. This is
in contrast with salaries in KwaZulu-Natal which are 15.6% lower
than the national median, Western Cape salaries which are 5%
lower and the salaries of the Other Provinces which are 13.9%
lower. These are quite sizable variances. For further analysis of the
differences in provincial salary levels please see page 25.
• Industry-specific positions (highlights)
Financial sector: Temporary staff are paid 37% less than their
permanent counterparts with less than five years experience.
Construction & Engineering: The salaries of all job functions
included under the Construction & Engineering industry increase
substantially when staff have five or more years experience. In
fact, in almost every case, the salaries are more than double those
of their counterparts with less than five years experience.
Information Technology & Telecommunications: Engineers,
analysts and quantity surveyors (as a group) earn the highest
salaries in comparison to all other positions reviewed in the survey
once they have five or more years experience.
• Payment of Commission: Key Account Managers are the
highest commission earners, earning commission equivalent
to 55.3% of their salaries, whereas Sales Managers and Sales
Representatives earn commission equivalent to 18.6% and
34.8% of their salaries respectively.
Section II: Contact centre survey
• General overview of salaries: Salary levels in the industry have
remained the same since 2013 for most job categories - when the
results of this survey are compared with other comparable surveys
completed 12 months earlier. However, there are job categories
in which salaries have increased, either because of skills shortages
or an increase in demand as trends change. The categories that
EXECUTIVE SUMMARY
Quest Salary Survey & Staffing Trends 2014/15 ©
| 6
TM EXECUTIVE SUMMARYCont.
“ Quest has identified 22 staffing trends that it believes will continue
to pick up in 2014/15”
stand out are Inbound Sales Agents, Trainers, Quality Assessors
and WFM specialists – salaries for these positions have increased
by between 20% and 30% when compared to last year.
• Use of temporary staff: Close to 50% of all contact centres
with 10 or more employees use temporary staff employed by an
agency.
• Agent Salaries:
- In the Collections sector of the industry, significantly higher
salaries are paid to temporary agents employed by agencies. In
the case of Collections agents with less than one year’s experience
for example, the difference can be up to 80% more.
- Provincial salaries are closely aligned to national salaries, except
for KwaZulu-Natal Customer Service Inbound salaries which are
lower than both the national median and Western Cape salaries
by up to 40%.
- In the Financial Services Industry, temporary agents employed by
a company are marginally better paid than agents supplied by an
agency. The exception is with Outbound Customer Service agents
who have less than one year’s experience. In this case, temporary
agents employed by a company are paid 28.6% more.
- The IT Helpdesk category is the only agent category where BPO
pays higher salaries than Financial Services. This is because BPO
Outsourcers probably take on more complex work than is found
at Financial Services Helpdesks.
• Supervisor/Manager Salaries: BPO Outsource Supervisor and
Manager salaries are slightly lower than or equal to the national
median. However, the salaries of Gauteng Managers are higher
than the national median. In the case of Gauteng Managers with
less than five years experience, their salaries are up to +47.6%
higher at R27, 000.
• Support Staff Salaries:
- Gauteng salaries are usually equal to or are higher than national
and Western Cape salaries. For example, QA salaries for those
with more than five years experience are 10% higher in Gauteng
at R19, 000.
- BPO Outsource permanent Support Staff salaries are significantly
lower than the national median of R17, 000. The highest variance
in this regard lies in the salaries of WFM specialists. For example,
salaries of WFM specialists with less than five years experience are
35.3% lower than the national median salary.
Section III: Recruitment services uptake
• There will be an increased uptake of the recruitment services
surveyed in the research, namely: Outsourced Staffing Services
(OSS); Permanent Placement Services; Field Service; Recruitment
Process Outsourcing Service (RPO); and Managed Service Providers
(MSPs) Service. RPO in particular shows an increase (+14.5%) in
uptake nationally while OSS also shows a significant increase
(+17.2%) in uptake.
Section IV: Staffing trends 2014/2015
• Quest has identified 22 staffing trends that it believes will
continue to pick up in 2014/15. These include the ‘bring your
own device’ (BYOD) practice and Statement of Work (SOW).
We have also identified 10 employee trends relating to common
attributes candidates look for in a new employer.
Quest Salary Survey & Staffing Trends 2014/15 ©
| 7
TM
Section I & Section III: General White Collar Survey & Uptake of
recruitment services
The research took place during the months of June and July 2014.
A web-based questionnaire was developed and an internet and
email campaign was employed to generate responses. The primary
sample was drawn from the Interactive Direct business database
which is made up of 277, 000 executives and white collar staff,
all with opt-in email addresses. The database represents 47, 000
businesses with 10 or more employees. The email campaign,
aimed at 46, 000 CEO’s, HR and Finance Managers, was launched
in June and closed mid-July. The survey campaign was then
supplemented with advertising on the most prominent human
resources websites and email newsletters.
Based on ongoing database research over the past 10 years,
Interactive Direct estimates that there are between 70, 000 and
80, 000 businesses with 10 or more white collar staff operating
actively in South Africa. Although there are more than 4.2 million
companies and close corporations (CCs) registered with the
Companies and Intellectual Property Commission (CIPC) - 1.4
million of them coded as trading - the reality is that there are
only approximately 600, 000 active business entities, of which a
much smaller number of approximately 70, 000 employ the bulk
of white collar workers in South Africa.
Validity:
418 fully completed questionnaires were received, which we
consider to be a more than sufficient sample to create a valid
picture of salary levels in the country. The established research
industry norm for a valid response, which achieves a 95%
confidence level in the sample, is 0.5% of the population – i.e.
150 responses from the 30, 000 plus companies contacted.
Achieving over 400 responses, which is a 1.4% response rate,
safely exceeds the response norm.
Section II: Contact Centre Survey
The contact centre survey was an option offered at the end of the
main white collar survey questionnaire which took place during
the months of June and July 2014. A web-based questionnaire
was developed and an internet and email campaign was used to
generate responses. 10% of the main questionnaire respondents
completed the contact centre section. The campaign was
supplemented with advertising on the most prominent human
resources websites and in their email newsletters as well as by
emailing to the Rod Jones Contact Centre Consulting database
of 5, 000 contact centre executives. The balance of the responses
therefore came from contact centre management who were
reached through an extensive email campaign aimed specifically
at the industry. It was particularly gratifying to see that 22% of the
responses came from the BPO Outsourcing sector of the industry.
This is a vital growth sector with great potential for increasing
youth employment.
Validity:
150 fully completed questionnaires were received. We consider
this sample to be more than sufficient to create a valid picture
of salary levels in the country as the accepted number of call
centres in the country with 10 or more agents is between 2, 000
and 2, 500. If you use the higher number of contact centres as
the population, the response level is 6%. This is well above the
research industry norm of 0.5%. The contact centre industry
body, the CCMG, has a verified total of just over 2, 000 contact
centres on their database.
METHODOLOGY

Quest Salary Survey & Staffing Trends 2014/15 ©
| 8
TM
1 WHITE COLLAR SURVEY RESULTS
TM
Quest Salary Survey & Staffing Trends 2014/15 ©
| 9
TMWHITE COLLAR SURVEY RESULTS
1.1 PROFILE OF RESPONDENTS
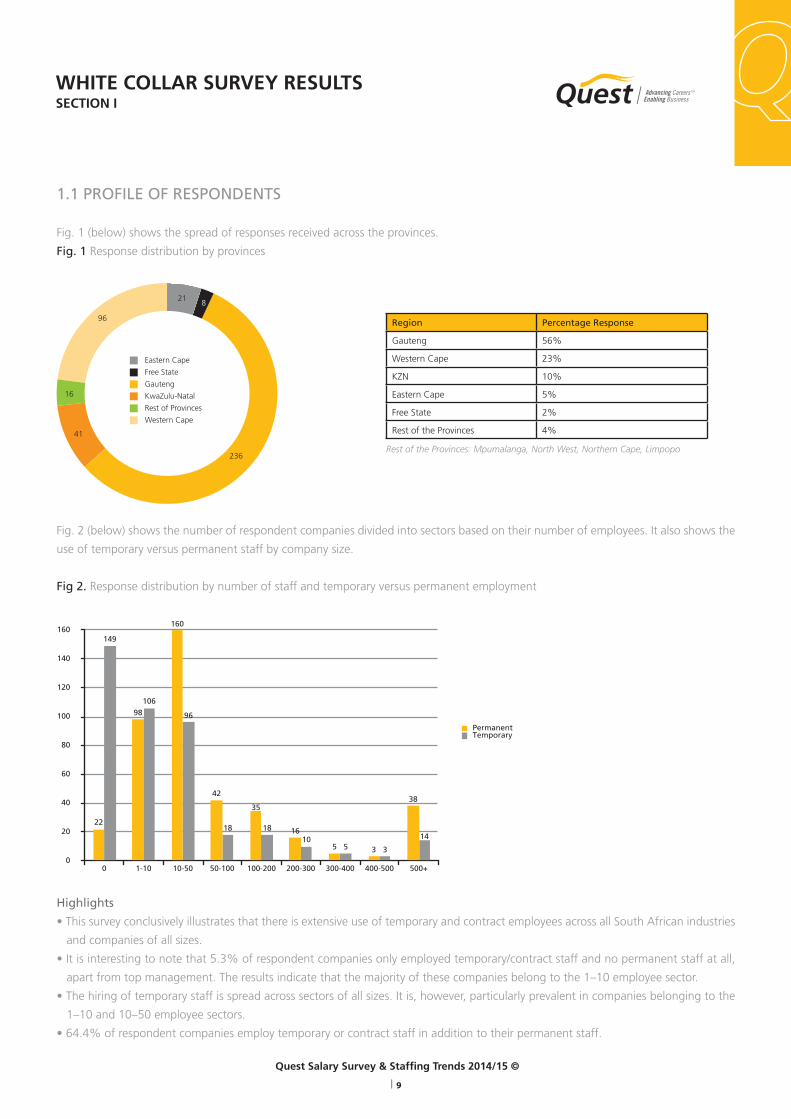
Fig. 1 (below) shows the spread of responses received across the provinces.
Fig. 1 Response distribution by provinces
Fig. 2 (below) shows the number of respondent companies divided into sectors based on their number of employees. It also shows the
use of temporary versus permanent staff by company size.
Fig 2. Response distribution by number of staff and temporary versus permanent employment
Highlights
• This survey conclusively illustrates that there is extensive use of temporary and contract employees across all South African industries
and companies of all sizes.
• It is interesting to note that 5.3% of respondent companies only employed temporary/contract staff and no permanent staff at all,
apart from top management. The results indicate that the majority of these companies belong to the 1–10 employee sector.
• The hiring of temporary staff is spread across sectors of all sizes. It is, however, particularly prevalent in companies belonging to the
1–10 and 10–50 employee sectors.
• 64.4% of respondent companies employ temporary or contract staff in addition to their permanent staff.
SECTION I
Rest of the Provinces: Mpumalanga, North West, Northern Cape, Limpopo
Region Percentage Response
Gauteng 56%
Western Cape 23%
KZN 10%
Eastern Cape 5%
Free State 2%
Rest of the Provinces 4%
218
236
96
16
41
Eastern Cape
Free State
Gauteng
KwaZulu-Natal
Rest of Provinces
Western Cape
0
20
40
60
80
100
120
140
160
0 1-10 10-50 50-100 100-200 200-300 300-400 400-500 500+
14
3510
1818
96
106
149
38
35
16
35
42
160
98
22
PermanentTemporary
Quest Salary Survey & Staffing Trends 2014/15 ©
| 10
TM
Respondent companies by industry sector
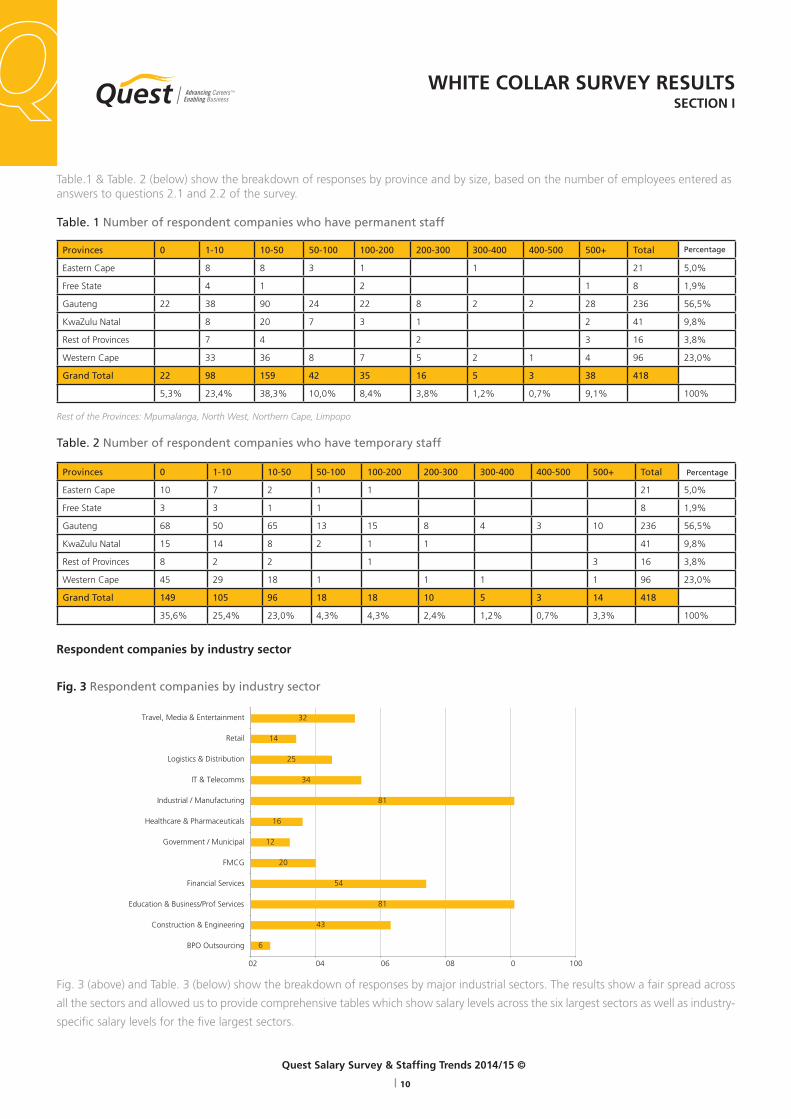
Fig. 3 Respondent companies by industry sector
Fig. 3 (above) and Table. 3 (below) show the breakdown of responses by major industrial sectors. The results show a fair spread across
all the sectors and allowed us to provide comprehensive tables which show salary levels across the six largest sectors as well as industry-
specific salary levels for the five largest sectors.
Provinces 0 1-10 10-50 50-100 100-200 200-300 300-400 400-500 500+ Total Percentage
Eastern Cape 8 8 3 1 1 21 5,0%
Free State 4 1 2 1 8 1,9%
Gauteng 22 38 90 24 22 8 2 2 28 236 56,5%
KwaZulu Natal 8 20 7 3 1 2 41 9,8%
Rest of Provinces 7 4 2 3 16 3,8%
Western Cape 33 36 8 7 5 2 1 4 96 23,0%
Grand Total 22 98 159 42 35 16 5 3 38 418
5,3% 23,4% 38,3% 10,0% 8,4% 3,8% 1,2% 0,7% 9,1% 100%
Provinces 0 1-10 10-50 50-100 100-200 200-300 300-400 400-500 500+ Total Percentage
Eastern Cape 10 7 2 1 1 21 5,0%
Free State 3 3 1 1 8 1,9%
Gauteng 68 50 65 13 15 8 4 3 10 236 56,5%
KwaZulu Natal 15 14 8 2 1 1 41 9,8%
Rest of Provinces 8 2 2 1 3 16 3,8%
Western Cape 45 29 18 1 1 1 1 96 23,0%
Grand Total 149 105 96 18 18 10 5 3 14 418
35,6% 25,4% 23,0% 4,3% 4,3% 2,4% 1,2% 0,7% 3,3% 100%
WHITE COLLAR SURVEY RESULTSSECTION I
Table.1 & Table. 2 (below) show the breakdown of responses by province and by size, based on the number of employees entered as answers to questions 2.1 and 2.2 of the survey.
Table. 1 Number of respondent companies who have permanent staff
Rest of the Provinces: Mpumalanga, North West, Northern Cape, Limpopo
Table. 2 Number of respondent companies who have temporary staff
Travel, Media & Entertainment
Retail
Logistics & Distribution
IT & Telecomms
Industrial / Manufacturing
Healthcare & Pharmaceuticals
Government / Municipal
FMCG
Financial Services
Education & Business/Prof Services
Construction & Engineering
BPO Outsourcing
02 04 06 08 0 100
6
43
81
54
20
12
16
81
34
25
14
32
Quest Salary Survey & Staffing Trends 2014/15 ©
| 11
TM
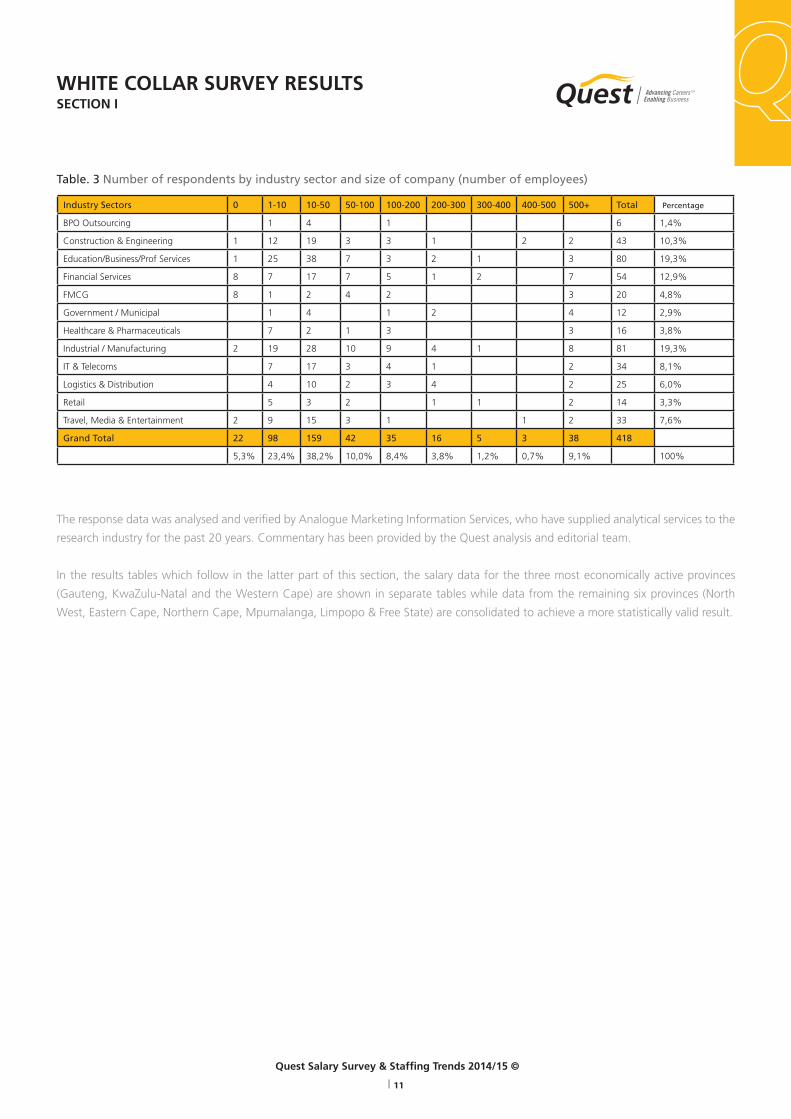
The response data was analysed and verified by Analogue Marketing Information Services, who have supplied analytical services to the
research industry for the past 20 years. Commentary has been provided by the Quest analysis and editorial team.
In the results tables which follow in the latter part of this section, the salary data for the three most economically active provinces
(Gauteng, KwaZulu-Natal and the Western Cape) are shown in separate tables while data from the remaining six provinces (North
West, Eastern Cape, Northern Cape, Mpumalanga, Limpopo & Free State) are consolidated to achieve a more statistically valid result.
Industry Sectors 0 1-10 10-50 50-100 100-200 200-300 300-400 400-500 500+ Total Percentage
BPO Outsourcing 1 4 1 6 1,4%
Construction & Engineering 1 12 19 3 3 1 2 2 43 10,3%
Education/Business/Prof Services 1 25 38 7 3 2 1 3 80 19,3%
Financial Services 8 7 17 7 5 1 2 7 54 12,9%
FMCG 8 1 2 4 2 3 20 4,8%
Government / Municipal 1 4 1 2 4 12 2,9%
Healthcare & Pharmaceuticals 7 2 1 3 3 16 3,8%
Industrial / Manufacturing 2 19 28 10 9 4 1 8 81 19,3%
IT & Telecoms 7 17 3 4 1 2 34 8,1%
Logistics & Distribution 4 10 2 3 4 2 25 6,0%
Retail 5 3 2 1 1 2 14 3,3%
Travel, Media & Entertainment 2 9 15 3 1 1 2 33 7,6%
Grand Total 22 98 159 42 35 16 5 3 38 418
5,3% 23,4% 38,2% 10,0% 8,4% 3,8% 1,2% 0,7% 9,1% 100%
WHITE COLLAR SURVEY RESULTSSECTION I
Table. 3 Number of respondents by industry sector and size of company (number of employees)

Quest Salary Survey & Staffing Trends 2014/15 ©
| 12
TM
1.2 PRIMARY WHITE COLLAR POSITIONS1.2.1 National
Table. 4 - National: Permanent Salaries
Permanent with 0 - 5 years experience Permanent with 5 or more years experience
Job Description n Median Min (10%) Max (90%) n Median Min (10%) Max (90%)
FINANCE
Accounts Clerk 75 11 000 5 000 19 000 87 13 000 7 000 23 000
Bookkeeper 102 16 000 7 000 27 000 132 19 000 13 000 32 500
Bookkeeper: Balance Sheet 47 15 000 7 000 27 000 62 20 000 11 000 32 500
Chartered Accountant 61 42 500 17 000 72 500 79 52 500 21 000 97 500
Credit Controller 63 13 000 7 000 27 000 98 17 000 11 000 32 500
Creditors Clerk 77 11 000 7 000 21 000 93 13 000 7 000 25 000
Debtors Clerk 73 11 000 5 000 17 000 101 13 000 7 000 21 000
Financial Manager 105 29 000 11 000 57 500 199 42 500 21 000 77 500
Payroll Administrator 73 13 000 7 000 25 000 105 17 000 9 000 29 000
HUMAN RESOURCES
HR Assistant 75 11 000 5 000 25 000 75 17 000 7 000 27 000
HR Manager 80 26 000 11 000 45 000 137 32 500 19 000 62 500
Trainer 52 17 000 5 000 29 000 55 21 000 9 000 42 500
Training Manager 46 26 000 7 000 52 500 65 32 500 13 000 57 500
MARKETING & SALES
Brand Manager 25 27 000 5 000 52 500 33 37 500 11 000 67 500
CSR/Enquiries Clerk 27 11 000 3 000 32 500 30 12 000 6 000 28 750
Key Accounts Manager 37 23 000 11 000 57 500 69 32 500 17 000 77 500
Marketing Manager 52 29 000 11 000 62 500 97 37 500 17 000 67 500
Marketing Support Staff 51 11 000 3 000 25 000 57 15 000 7 000 29 000
PR/Communications Mgr. 35 25 000 7 000 47 500 36 32 500 11 000 52 500
Sales Manager 55 27 000 9 000 57 500 115 42 500 19 000 72 500
Sales Representative 77 15 000 5 000 32 500 112 19 000 9 000 37 500
Telesales Representative 37 9 000 3 000 19 000 55 13 000 5 000 21 000
IT & SUPPORT
Data Capturer 46 9 000 5 000 19 000 56 9 000 5 000 21 000
Database Administrator 34 14 000 5 000 29 000 46 17 000 7 000 32 500
Infrastructure Manager 25 27 000 7 000 57 500 41 37 500 13 000 77 500
IT Manager 45 29 000 9 000 57 500 94 32 500 17 000 62 500
IT Support 59 13 000 5 000 25 000 69 17 000 11 000 29 000
Network Administrator 37 15 000 5 000 32 500 41 19 000 9 000 32 500
OTHER
Admin/Office Manager 74 13 000 5 000 32 500 107 19 000 9 000 42 500
Branch Manager 48 28 000 7 000 67 500 72 35 000 13 000 62 500
Business Analyst 38 23 000 9 000 52 500 44 32 500 15 000 57 500
Cleaner/Tea Lady 113 3 000 3 000 7 000 161 5 000 3 000 9 000
Clerical Assistant 67 7 000 3 000 15 000 69 11 000 5 000 17 000
Driver 88 7 000 3 000 11 000 120 7 000 5 000 13 000
Executive Secretary / PA 74 15 000 7 000 29 000 121 17 000 11 000 32 500
Procurement Manager 45 29 000 11 000 52 500 81 32 500 11 000 57 500
Receptionist 134 7 000 5 000 15 000 152 9 000 7 000 17 000
Typist 30 7 000 3 000 19 000 28 10 000 5 000 19 000
WHITE COLLAR SURVEY RESULTSSECTION I

Quest Salary Survey & Staffing Trends 2014/15 ©
| 13
TM
Highlights:
• There is a significant variance in the median salaries of
Financial Managers and Chartered Accountants with less than
five years experience, with Chartered Accountants being paid
46% more than Financial Managers. Chartered Accountants
with more than five years experience are paid 23% more than
their counterparts who have less experience. Financial Managers
with more than five years experience are paid 46% more than
their less experienced counterparts.
• Salaries of Sales, Brand and Marketing Managers increase
at a much higher rate when they have more than five years
experience, compared with the salaries of their lower ranked
marketing colleagues - see Fig. 4 (below). Sales Managers are
particularly well paid after five years in the position, with an
increase of 57%. Brand Managers’ median salaries increased
by 38.8% and Marketing Managers by 29.3% after five years
experience. The salaries of temporary staff are included in the
chart for comparison purposes and are closely aligned with the
salaries of staff with less than five years experience (see Table. 5
for temporary salaries and further commentary).
• The median salary of the highest paid job function with less than
five years experience, that of a Chartered Accountant, is 14.2
times higher than the lowest paid salary, that of a Cleaner/Tea
Lady. This variance highlights the significant difference in salaries
between manual workers and highly trained management in
South Africa.
Fig. 4 MARKETING: Permanent vs Temporary median salaries (National)
WHITE COLLAR SURVEY RESULTSSECTION I
0 20 000 40 000 60 000
CSR/Enqiuries Clerk
Marketing Support Staff
Telesales Representative
Sales Representative
Key Accounts Manager
Sales Manager
PR/Communications Manager
Brand Manager
Marketing Manager
Temporary or contract staff
Permanent with > 5 years experience
Permanent with < 5 years experience
Quest Salary Survey & Staffing Trends 2014/15 ©
| 14
TM
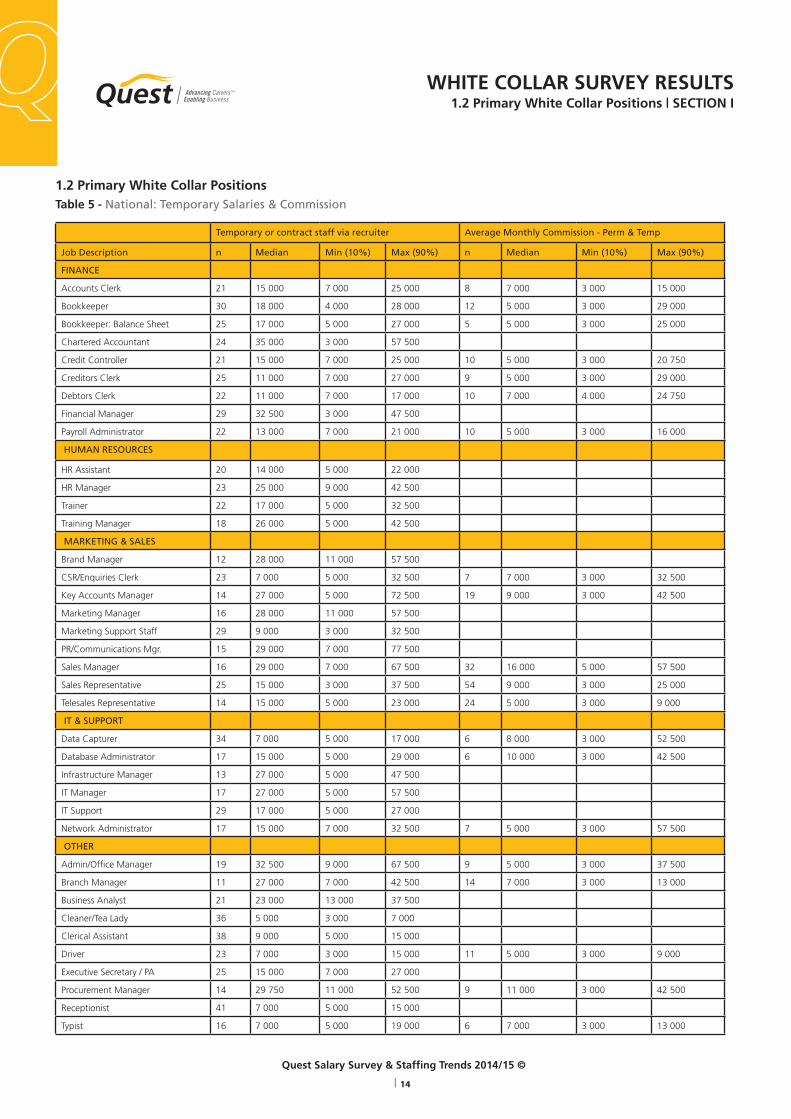
1.2 Primary White Collar PositionsTable 5 - National: Temporary Salaries & Commission
Temporary or contract staff via recruiter Average Monthly Commission - Perm & Temp
Job Description n Median Min (10%) Max (90%) n Median Min (10%) Max (90%)
FINANCE
Accounts Clerk 21 15 000 7 000 25 000 8 7 000 3 000 15 000
Bookkeeper 30 18 000 4 000 28 000 12 5 000 3 000 29 000
Bookkeeper: Balance Sheet 25 17 000 5 000 27 000 5 5 000 3 000 25 000
Chartered Accountant 24 35 000 3 000 57 500
Credit Controller 21 15 000 7 000 25 000 10 5 000 3 000 20 750
Creditors Clerk 25 11 000 7 000 27 000 9 5 000 3 000 29 000
Debtors Clerk 22 11 000 7 000 17 000 10 7 000 4 000 24 750
Financial Manager 29 32 500 3 000 47 500
Payroll Administrator 22 13 000 7 000 21 000 10 5 000 3 000 16 000
HUMAN RESOURCES
HR Assistant 20 14 000 5 000 22 000
HR Manager 23 25 000 9 000 42 500
Trainer 22 17 000 5 000 32 500
Training Manager 18 26 000 5 000 42 500
MARKETING & SALES
Brand Manager 12 28 000 11 000 57 500
CSR/Enquiries Clerk 23 7 000 5 000 32 500 7 7 000 3 000 32 500
Key Accounts Manager 14 27 000 5 000 72 500 19 9 000 3 000 42 500
Marketing Manager 16 28 000 11 000 57 500
Marketing Support Staff 29 9 000 3 000 32 500
PR/Communications Mgr. 15 29 000 7 000 77 500
Sales Manager 16 29 000 7 000 67 500 32 16 000 5 000 57 500
Sales Representative 25 15 000 3 000 37 500 54 9 000 3 000 25 000
Telesales Representative 14 15 000 5 000 23 000 24 5 000 3 000 9 000
IT & SUPPORT
Data Capturer 34 7 000 5 000 17 000 6 8 000 3 000 52 500
Database Administrator 17 15 000 5 000 29 000 6 10 000 3 000 42 500
Infrastructure Manager 13 27 000 5 000 47 500
IT Manager 17 27 000 5 000 57 500
IT Support 29 17 000 5 000 27 000
Network Administrator 17 15 000 7 000 32 500 7 5 000 3 000 57 500
OTHER
Admin/Office Manager 19 32 500 9 000 67 500 9 5 000 3 000 37 500
Branch Manager 11 27 000 7 000 42 500 14 7 000 3 000 13 000
Business Analyst 21 23 000 13 000 37 500
Cleaner/Tea Lady 36 5 000 3 000 7 000
Clerical Assistant 38 9 000 5 000 15 000
Driver 23 7 000 3 000 15 000 11 5 000 3 000 9 000
Executive Secretary / PA 25 15 000 7 000 27 000
Procurement Manager 14 29 750 11 000 52 500 9 11 000 3 000 42 500
Receptionist 41 7 000 5 000 15 000
Typist 16 7 000 5 000 19 000 6 7 000 3 000 13 000
WHITE COLLAR SURVEY RESULTS1.2 Primary White Collar Positions | SECTION I
Quest Salary Survey & Staffing Trends 2014/15 ©
| 15
TM
Highlights:
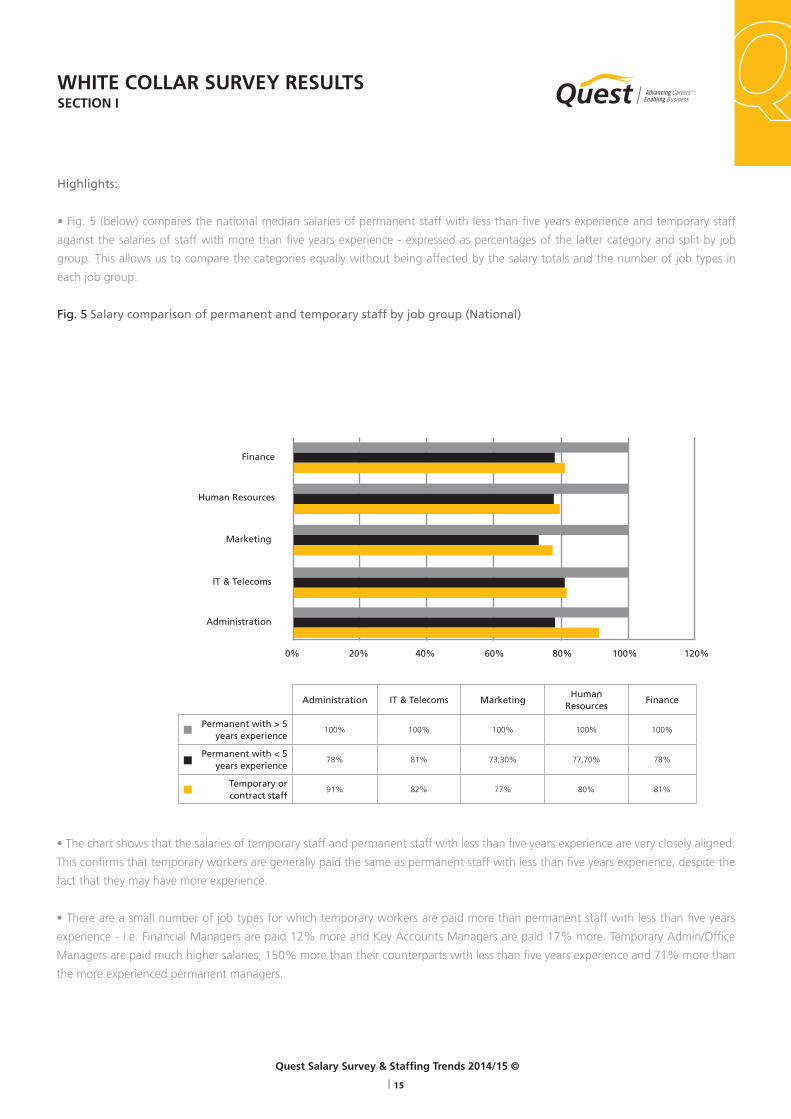
• Fig. 5 (below) compares the national median salaries of permanent staff with less than five years experience and temporary staff
against the salaries of staff with more than five years experience - expressed as percentages of the latter category and split by job
group. This allows us to compare the categories equally without being affected by the salary totals and the number of job types in
each job group.
Fig. 5 Salary comparison of permanent and temporary staff by job group (National)
• The chart shows that the salaries of temporary staff and permanent staff with less than five years experience are very closely aligned.
This confirms that temporary workers are generally paid the same as permanent staff with less than five years experience, despite the
fact that they may have more experience.
• There are a small number of job types for which temporary workers are paid more than permanent staff with less than five years
experience - i.e. Financial Managers are paid 12% more and Key Accounts Managers are paid 17% more. Temporary Admin/Office
Managers are paid much higher salaries, 150% more than their counterparts with less than five years experience and 71% more than
the more experienced permanent managers.
WHITE COLLAR SURVEY RESULTSSECTION I
Finance
Human Resources
Marketing
IT & Telecoms
Administration
0% 20% 40% 60% 80% 100% 120%
Administration IT & Telecoms MarketingHuman
ResourcesFinance
Permanent with > 5 years experience
100% 100% 100% 100% 100%
Permanent with < 5 years experience
78% 81% 73,30% 77,70% 78%
Temporary or contract staff
91% 82% 77% 80% 81%
Quest Salary Survey & Staffing Trends 2014/15 ©
| 16
TM
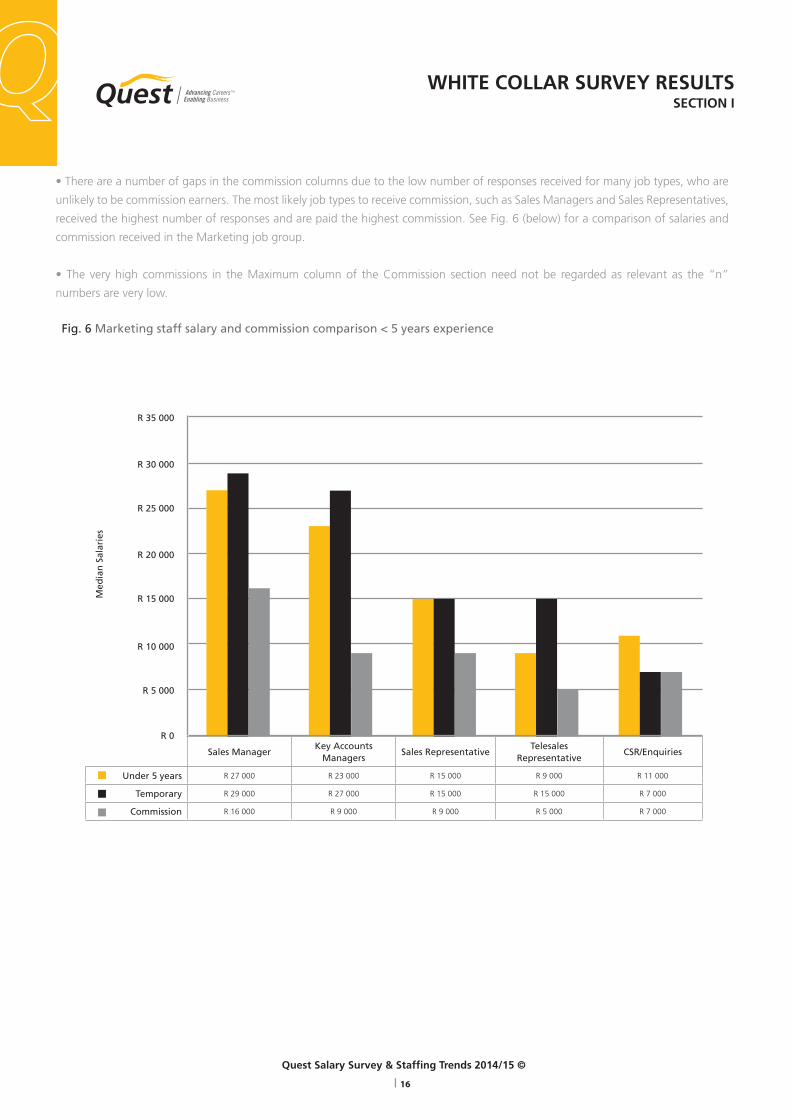
• There are a number of gaps in the commission columns due to the low number of responses received for many job types, who are
unlikely to be commission earners. The most likely job types to receive commission, such as Sales Managers and Sales Representatives,
received the highest number of responses and are paid the highest commission. See Fig. 6 (below) for a comparison of salaries and
commission received in the Marketing job group.
• The very high commissions in the Maximum column of the Commission section need not be regarded as relevant as the “n”
numbers are very low.
WHITE COLLAR SURVEY RESULTSSECTION I
Fig. 6 Marketing staff salary and commission comparison < 5 years experience
Sales ManagerKey Accounts
ManagersSales Representative
TelesalesRepresentative
CSR/Enquiries
Under 5 years R 27 000 R 23 000 R 15 000 R 9 000 R 11 000
Temporary R 29 000 R 27 000 R 15 000 R 15 000 R 7 000
Commission R 16 000 R 9 000 R 9 000 R 5 000 R 7 000
R 0
R 5 000
R 10 000
R 15 000
R 20 000
R 25 000
R 30 000
R 35 000
Med
ian
Sal
arie
s
Quest Salary Survey & Staffing Trends 2014/15 ©
| 17
TM
Temporary or contract staff via recruiter Average Monthly Commission - Perm & Temp
Job Description n Median Min (10%) Max (90%) n Median Min (10%) Max (90%)
FINANCE
Accounts Clerk 39 11 000 5 000 21 000 50 13 000 7 000 27 000
Bookkeeper 63 17 000 11 000 29 000 82 22 000 15 000 32 500
Bookkeeper: Balance Sheet 29 19 000 9 000 29 000 36 23 000 13 000 32 500
Chartered Accountant 37 47 500 17 000 97 500 48 60 000 21 000 97 500
Credit Controller 42 15 000 9 000 27 000 59 19 000 11 000 32 500
Creditors Clerk 45 13 000 7 000 21 000 50 15 000 9 000 26 000
Debtors Clerk 46 11 000 5 000 21 000 53 15 000 7 000 23 000
Financial Manager 69 32 500 15 000 62 500 120 47 500 20 000 80 000
Payroll Administrator 42 14 000 9 000 23 000 62 19 000 9 000 32 500
HUMAN RESOURCES
HR Assistant 40 11 000 7 000 25 000 46 17 000 9 000 27 000
HR Manager 48 32 500 13 000 47 500 82 37 500 19 000 67 500
Trainer 33 17 000 11 000 29 000 40 21 000 9 000 42 500
Training Manager 29 27 000 9 000 87 500 43 32 500 17 000 57 500
MARKETING & SALES
Brand Manager 16 25 000 7 000 92 500 24 32 500 11 000 67 500
CSR/Enquiries Clerk 19 11 000 7 000 52 500 23 13 000 7 000 19 000
Key Accounts Manager 23 23 000 13 000 52 500 48 32 500 17 000 92 500
Marketing Manager 31 29 000 15 000 62 500 61 42 500 17 000 67 500
Marketing Support Staff 30 13 000 5 000 28 750 31 15 000 11 000 29 000
PR/Communications Mgr. 21 23 000 7 000 42 500 23 32 500 11 000 52 500
Sales Manager 36 29 750 13 000 57 500 75 42 500 19 000 77 500
Sales Representative 50 15 000 7 000 35 000 68 22 000 11 000 37 500
Telesales Representative 27 11 000 3 000 19 000 39 13 000 5 000 21 000
IT & SUPPORT
Data Capturer 27 9 000 5 000 19 000 37 11 000 5 000 23 000
Database Administrator 20 16 000 9 000 28 000 28 17 000 7 000 32 500
Infrastructure Manager 16 29 000 9 000 97 500 28 37 500 9 000 92 500
IT Manager 23 32 500 11 000 57 500 57 37 500 17 000 77 500
IT Support 33 15 000 7 000 27 000 42 19 000 13 000 29 000
Network Administrator 22 15 000 9 000 32 500 30 18 000 10 000 35 000
OTHER
Admin/Office Manager 41 13 000 7 000 32 500 57 21 000 11 000 47 500
Branch Manager 29 27 000 9 000 87 500 44 35 000 13 000 67 500
Business Analyst 22 24 000 9 000 52 500 26 32 500 19 000 67 500
Cleaner/Tea Lady 60 3 000 3 000 7 000 94 5 000 3 000 9 000
Clerical Assistant 40 8 000 4 000 13 000 40 11 000 7 000 15 000
Driver 51 7 000 3 000 11 000 77 7 000 5 000 15 000
Executive Secretary / PA 45 17 000 7 000 32 500 69 21 000 11 000 37 500
Procurement Manager 24 32 500 15 000 52 500 45 37 500 15 000 62 500
Receptionist 74 9 000 5 000 15 000 87 9 000 7 000 17 000
Typist 17 9 000 5 000 19 000 17 11 000 7 000 19 000
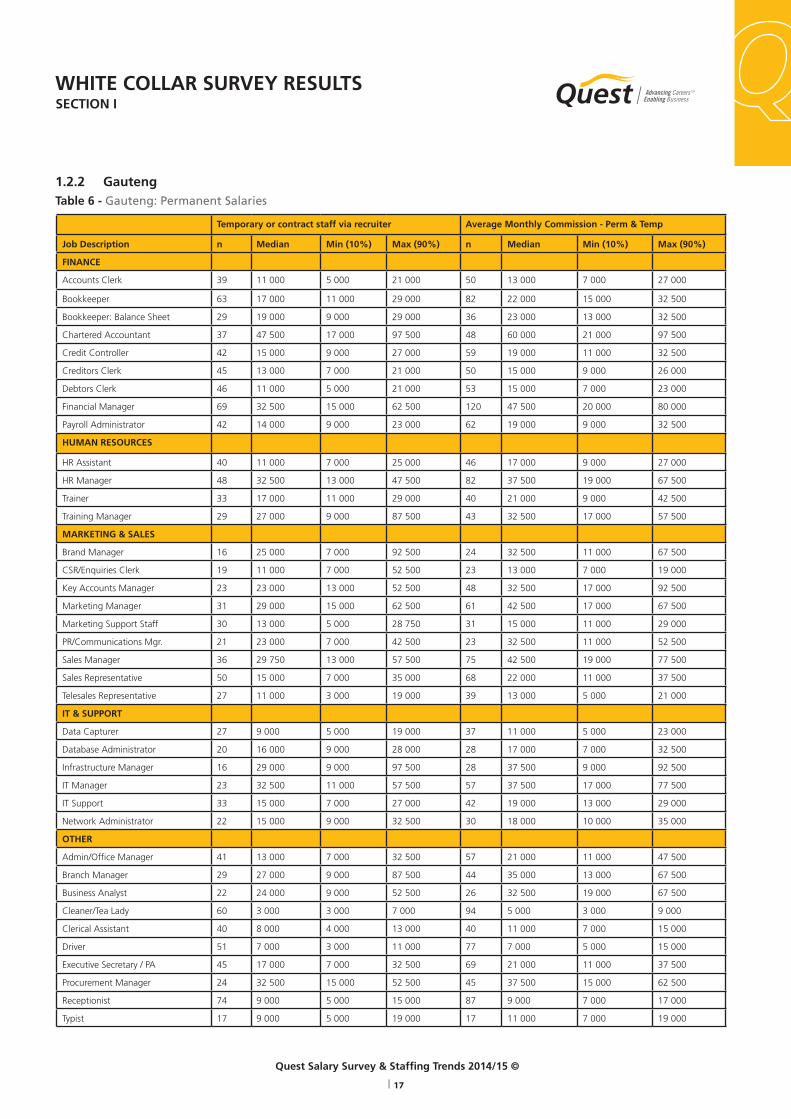
1.2.2 GautengTable 6 - Gauteng: Permanent Salaries
WHITE COLLAR SURVEY RESULTSSECTION I

Quest Salary Survey & Staffing Trends 2014/15 ©
| 18
TM
Highlights:
• The salaries of employees with less than five years experience
in Gauteng are 7.3% higher than the national median level and
the salaries of employees with more than five years experience are
6.4% higher than the national median level. These are significant
differences and illustrates the aggressive stance of Gauteng
businesses and national head offices in the province who are
willing to pay higher salaries to attract the best possible talent.
• After each provincial permanent salary table we have included
a chart to illustrate the different salary levels of a particular senior
management position across the provinces. Here we highlight the
salaries of Financial Managers:
• The salaries of Financial Managers in each province follow
common national patterns across experience levels. It is, however,
notable that the salaries of permanent managers with above and
below five years experience are at the same level in KwaZulu-
Natal. This indicates that you appear to hit a glass ceiling at five
years in the position of a Financial Manager in that province.
Fig. 7 Provincial salary differences: Financial Manager - Median Salaries
WHITE COLLAR SURVEY RESULTSSECTION I
R 0
R 5 000
R 10 000
R 15 000
R 20 000
R 25 000
R 30 000
R 35 000
Med
ian
Sal
arie
s
National Gauteng W Cape KZN Other
Perm < 5 years R 29 000 R 32 500 R 27 000 R 37 500 R 17 000
Perm > 5 years R 42 500 R 47 500 R 42 500 R 37 500 R 37 000
Temporary R 32 500 R 32 500
R 40 000
R 45 000
R 50 000

Quest Salary Survey & Staffing Trends 2014/15 ©
| 19
TM
Temporary or contract staff via recruiter Average Monthly Commission - Perm & Temp
Job Description n Median Min (10%) Max (90%) n Median Min (10%) Max (90%)
FINANCE
Accounts Clerk 14 17 000 11 000 29 000 5 9 000 3 000 15 000
Bookkeeper 20 19 000 7 000 30 750 6 5 000 3 000 29 000
Bookkeeper: Balance Sheet 17 19 000 7 000 27 000
Chartered Accountant 13 42 500 15 000 57 500
Credit Controller 15 17 000 9 000 27 000 7 5 000 3 000 32 500
Creditors Clerk 19 15 000 7 000 32 500 6 5 000 3 000 29 000
Debtors Clerk 16 12 000 7 000 25 000 8 7 000 3 000 32 500
Financial Manager 19 32 500 3 000 62 500
Payroll Administrator 15 13 000 9 000 21 000 6 7 000 3 000 19 000
HUMAN RESOURCES
HR Assistant 11 15 000 9 000 21 000
HR Manager 17 25 000 9 000 42 500
Trainer 14 17 000 9 000 29 000
Training Manager 12 27 000 11 000 42 500
MARKETING & SALES
Brand Manager 8 27 000 11 000 92 500
CSR/Enquiries Clerk 19 7 000 5 000 32 500 5 7 000 3 000 32 500
Key Accounts Manager 10 27 000 6 000 70 000 11 13 000 5 000 42 500
Marketing Manager 11 27 000 13 000 47 500
Marketing Support Staff 22 8 000 3 000 25 000
PR/Communications Mgr. 11 27 000 15 000 77 500
Sales Manager 8 27 000 7 000 97 500 24 13 000 5 000 57 500
Sales Representative 20 14 000 3 000 35 000 34 9 000 5 000 25 000
Telesales Representative 11 15 000 9 000 19 000 17 5 000 3 000 21 000
IT & SUPPORT
Data Capturer 30 7 000 5 000 17 000 4
Database Administrator 13 17 000 7 000 29 000 5 11 000 3 000 42 500
Infrastructure Manager 9 27 000 3 000 97 500
IT Manager 10 28 000 6 000 67 500
IT Support 22 18 000 7 000 25 000
Network Administrator 10 17 000 10 000 45 000 5 5 000 3 000 57 500
OTHER
Admin/Office Manager 15 32 500 11 000 67 500 6 7 000 3 000 37 500
Branch Manager 8 23 000 7 000 97 500 9 9 000 3 000 15 000
Business Analyst 16 22 000 13 000 37 500
Cleaner/Tea Lady 26 4 000 3 000 7 000
Clerical Assistant 34 9 000 7 000 13 000
Driver 16 6 000 3 000 17 000 9 5 000 3 000 9 000
Executive Secretary / PA 19 13 000 7 000 29 000
Procurement Manager 10 29 750 11 000 47 500 5 21 000 5 000 42 500
Receptionist 34 7 000 5 000 17 000
Typist 11 9 000 5 000 19 000
Primary White Collar Positions
Table. 7 Gauteng: Temporary Salaries & Commission
WHITE COLLAR SURVEY RESULTSSECTION I

Quest Salary Survey & Staffing Trends 2014/15 ©
| 20
TM
Highlights:
• Executive Secretary/PA salaries in Gauteng are higher than the national median, by 13% for PA’s with less than five years experience and by 23.5% for their counterparts
with more than five years experience. Temporary PA’s earn far less in Gauteng, 15% less than permanent PA’s with less than five years experience in that province.
1.2.3 Western Cape
Table. 8 - Western Cape: Permanent Salaries
Permanent with 0 - 5 years experience Permanent with 5 or more years experience
Job Description n Median Min (10%) Max (90%) n Median Min (10%) Max (90%)
FINANCE
Accounts Clerk 18 11 000 5 000 21 000 18 13 000 5 000 23 000
Bookkeeper 18 12 000 9 000 25 000 29 17 000 13 000 29 000
Bookkeeper: Balance Sheet 5 19 000 15 000 29 000 14 20 000 15 000 27 000
Chartered Accountant 6 33 250 27 000 67 500 14 45 000 32 500 87 500
Credit Controller 9 15 000 7 000 52 500 17 19 000 11 000 37 500
Creditors Clerk 14 11 000 7 000 17 000 20 11 000 7 000 25 000
Debtors Clerk 13 11 000 7 000 17 000 27 13 000 7 000 27 000
Financial Manager 12 27 000 11 000 42 500 44 42 500 23 000 72 500
Payroll Administrator 11 13 000 7 000 29 000 19 17 000 9 000 32 500
HUMAN RESOURCES
HR Assistant 14 13 000 5 000 29 000 14 15 000 9 000 21 000
HR Manager 11 21 000 11 000 37 500 26 28 000 13 000 57 500
Trainer 9 19 000 3 000 47 500 6 19 000 9 000 42 500
Training Manager 6 23 000 7 000 82 500 11 32 500 21 000 42 500
MARKETING & SALES
Brand Manager 2 4
CSR/Enquiries Clerk 4 3
Key Accounts Manager 5 25 000 13 000 97 500 14 32 500 17 000 52 500
Marketing Manager 8 26 750 7 000 87 500 22 37 500 17 000 57 500
Marketing Support Staff 9 11 000 3 000 17 000 17 15 000 7 000 21 000
PR/Communications Mgr. 5 27 000 13 000 92 500 6 29 750 19 000 42 500
Sales Manager 8 26 000 9 000 47 500 18 42 500 21 000 57 500
Sales Representative 17 9 000 5 000 23 000 27 19 000 9 000 32 500
Telesales Representative 5 7 000 5 000 11 000 8 12 000 7 000 17 000
IT & SUPPORT
Data Capturer 8 8 000 5 000 17 000 7 7 000 5 000 11 000
Database Administrator 7 13 000 5 000 29 000 9 19 000 11 000 32 500
Infrastructure Manager 2 7 42 500 13 000 92 500
IT Manager 11 25 000 13 000 52 500 22 32 500 25 000 57 500
IT Support 14 10 000 5 000 15 000 18 17 000 11 000 25 000
Network Administrator 8 15 000 7 000 47 500 4
OTHER
Admin/Office Manager 10 18 000 7 000 55 750 30 17 000 11 000 32 500
Branch Manager 8 26 750 5 000 87 500 15 32 500 15 000 57 500
Business Analyst 10 19 000 10 000 50 000 10 32 500 20 000 50 000
Cleaner/Tea Lady 22 3 000 3 000 5 000 40 5 000 3 000 7 000
Clerical Assistant 14 9 000 5 000 17 000 16 10 000 5 000 17 000
Driver 15 7 000 3 000 11 000 20 7 000 5 000 13 000
Executive Secretary / PA 19 13 000 7 000 29 000
Procurement Manager 10 29 750 11 000 47 500 5 21 000 5 000 42 500
Receptionist 34 7 000 5 000 17 000
Typist 11 9 000 5 000 19 000
WHITE COLLAR SURVEY RESULTSSECTION I
Quest Salary Survey & Staffing Trends 2014/15 ©
| 21
TM
Highlights:
• The salaries of employees with less than five years experience in Western Cape are 5% lower than the national median level and the
salaries of employees with more than five years experience are 3.4% lower than the national median level.
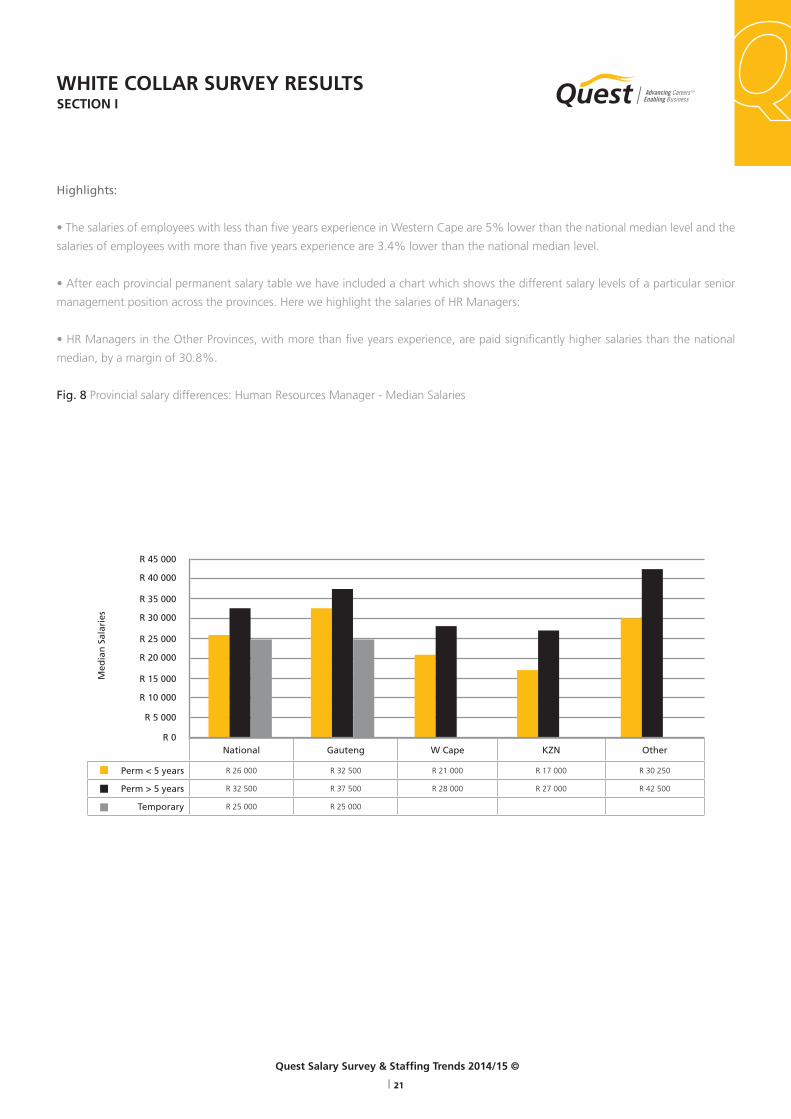
• After each provincial permanent salary table we have included a chart which shows the different salary levels of a particular senior
management position across the provinces. Here we highlight the salaries of HR Managers:
• HR Managers in the Other Provinces, with more than five years experience, are paid significantly higher salaries than the national
median, by a margin of 30.8%.
Fig. 8 Provincial salary differences: Human Resources Manager - Median Salaries
WHITE COLLAR SURVEY RESULTSSECTION I
R 0
R 5 000
R 10 000
R 15 000
R 20 000
R 25 000
R 30 000
R 35 000
Med
ian
Sal
arie
s
National Gauteng W Cape KZN Other
Perm < 5 years R 26 000 R 32 500 R 21 000 R 17 000 R 30 250
Perm > 5 years R 32 500 R 37 500 R 28 000 R 27 000 R 42 500
Temporary R 25 000 R 25 000
R 40 000
R 45 000

Quest Salary Survey & Staffing Trends 2014/15 ©
| 22
TM
Temporary or contract staff via recruiter Average Monthly Commission - Perm & Temp
Job Description n Median Min (10%) Max (90%) n Median Min (10%) Max (90%)
FINANCE
Accounts Clerk 14 17 000 11 000 29 000 5 9 000 3 000 15 000
Bookkeeper 20 19 000 7 000 30 750 6 5 000 3 000 29 000
Bookkeeper: Balance Sheet 17 19 000 7 000 27 000
Chartered Accountant 13 42 500 15 000 57 500
Credit Controller 15 17 000 9 000 27 000 7 5 000 3 000 32 500
Creditors Clerk 19 15 000 7 000 32 500 6 5 000 3 000 29 000
Debtors Clerk 16 12 000 7 000 25 000 8 7 000 3 000 32 500
Financial Manager 19 32 500 3 000 62 500
Payroll Administrator 15 13 000 9 000 21 000 6 7 000 3 000 19 000
HUMAN RESOURCES
HR Assistant 11 15 000 9 000 21 000
HR Manager 17 25 000 9 000 42 500
Trainer 14 17 000 9 000 29 000
Training Manager 12 27 000 11 000 42 500
MARKETING & SALES
Brand Manager 8 27 000 11 000 92 500
CSR/Enquiries Clerk 19 7 000 5 000 32 500 5 7 000 3 000 32 500
Key Accounts Manager 10 27 000 6 000 70 000 11 13 000 5 000 42 500
Marketing Manager 11 27 000 13 000 47 500
Marketing Support Staff 22 8 000 3 000 25 000
PR/Communications Mgr. 11 27 000 15 000 77 500
Sales Manager 8 27 000 7 000 97 500 24 13 000 5 000 57 500
Sales Representative 20 14 000 3 000 35 000 34 9 000 5 000 25 000
Telesales Representative 11 15 000 9 000 19 000 17 5 000 3 000 21 000
IT & SUPPORT
Data Capturer 30 7 000 5 000 17 000 4
Database Administrator 13 17 000 7 000 29 000 5 11 000 3 000 42 500
Infrastructure Manager 9 27 000 3 000 97 500
IT Manager 10 28 000 6 000 67 500
IT Support 22 18 000 7 000 25 000
Network Administrator 10 17 000 10 000 45 000 5 5 000 3 000 57 500
OTHER
Admin/Office Manager 15 32 500 11 000 67 500 6 7 000 3 000 37 500
Branch Manager 8 23 000 7 000 97 500 9 9 000 3 000 15 000
Business Analyst 16 22 000 13 000 37 500
Cleaner/Tea Lady 26 4 000 3 000 7 000
Clerical Assistant 34 9 000 7 000 13 000
Driver 16 6 000 3 000 17 000 9 5 000 3 000 9 000
Executive Secretary / PA 19 13 000 7 000 29 000
Procurement Manager 10 29 750 11 000 47 500 5 21 000 5 000 42 500
Receptionist 34 7 000 5 000 17 000
Typist 11 9 000 5 000 19 000
1.2.4 KwaZulu-Natal
Table. 9 – KwaZulu-Natal: Permanent Salaries
WHITE COLLAR SURVEY RESULTSSECTION I

Quest Salary Survey & Staffing Trends 2014/15 ©
| 23
TM
Highlights:
• The salaries of employees with less than five years experience in KwaZulu-Natal are 15.6% lower than the national median level while
the salaries of employees with more than five years experience are 21% lower than the national median level.
• After each provincial permanent salary table we have included a chart which shows the different salary levels of a particular senior
management position across the provinces. Here we highlight the salaries of Marketing Managers:
• Marketing Managers with five or more years experience are paid substantially more in Gauteng and the Other Provinces, above the
national median by 13.3% and 20% respectively.
Fig. 9 Provincial salary differences: Marketing Manager - Median Salaries
WHITE COLLAR SURVEY RESULTSSECTION I
R 0
R 5 0000
R 10 000
R 15 000
R 20 000
R 25 000
R 30 000
R 35 000
Med
ian
Sal
arie
s
National Gauteng W Cape KZN Other
Perm < 5 years R 29 000 R 29 000 R 26 750 R 29 000 R 31 250
Perm > 5 years R 37 500 R 42 500 R 37 500 R 28 750 R 45 000
Temporary R 28 000 R 27 000
R 40 000
R 45 000
R 50 000
Quest Salary Survey & Staffing Trends 2014/15 ©
| 24
TM
Permanent with 0 - 5 years experience Permanent with 5 or more years experience
Job Description n Median Min (10%) Max (90%) n Median Min (10%) Max (90%)
FINANCE
Accounts Clerk 8 7 000 3 000 17 000 6 10 000 3 000 21 000
Bookkeeper 10 8 000 3 000 25 000 8 18 000 11 000 32 500
Bookkeeper: Balance Sheet 5 11 000 3 000 25 000 4
Chartered Accountant 8 32 500 3 000 97 500 6 45 000 32 500 97 500
Credit Controller 4 7 13 000 7 000 37 500
Creditors Clerk 7 9 000 3 000 17 000 8 11 000 7 000 21 000
Debtors Clerk 5 9 000 3 000 17 000 8 11 000 5 000 21 000
Financial Manager 13 17 000 3 000 42 500 14 37 500 5 000 57 500
Payroll Administrator 9 9 000 3 000 32 500 10 14 000 6 000 24 000
HUMAN RESOURCES
HR Assistant 14 10 000 5 000 23 000 9 11 000 7 000 32 500
HR Manager 10 30 250 4 000 50 000 11 42 500 21 000 52 500
Trainer 8 8 000 3 000 37 500 5 32 500 7 000 37 500
Training Manager 8 37 500 3 000 52 500 6 37 500 11 000 57 500
MARKETING & SALES
Brand Manager 5 42 500 3 000 52 500 3
CSR/Enquiries Clerk 2 1
Key Accounts Manager 3 2
Marketing Manager 8 31 250 3 000 52 500 6 45 000 13 000 62 500
Marketing Support Staff 8 5 000 3 000 37 500 3
PR/Communications Mgr. 6 33 250 3 000 47 500 4
Sales Manager 8 14 000 3 000 47 500 10 35 000 17 000 77 500
Sales Representative 4 5 25 000 9 000 42 500
Telesales Representative 2 3
IT & SUPPORT
Data Capturer 7 9 000 3 000 27 000 6 12 000 3 000 37 500
Database Administrator 5 15 000 3 000 42 500 6 20 000 7 000 52 500
Infrastructure Manager 4 3
IT Manager 6 35 750 3 000 52 500 9 32 500 15 000 62 500
IT Support 6 13 000 3 000 42 500 5 23 000 7 000 52 500
Network Administrator 4 3
OTHER
Admin/Office Manager 12 9 000 3 000 32 500 10 18 000 6 000 42 500
Branch Manager 6 25 750 3 000 52 500 6 45 000 17 000 67 500
Business Analyst 4 5 25 000 15 000 57 500
Cleaner/Tea Lady 17 3 000 3 000 5 000 11 3 000 3 000 7 000
Clerical Assistant 7 7 000 3 000 23 000 6 12 000 5 000 27 000
Driver 12 5 000 3 000 9 000 9 7 000 5 000 19 000
Executive Secretary / PA 9 11 000 3 000 29 000 8 14 000 9 000 32 500
Procurement Manager 8 24 750 3 000 52 500 8 40 000 11 000 62 500
Receptionist 13 5 000 3 000 15 000 12 10 000 3 000 17 000
Typist 5 3 000 3 000 23 000 3
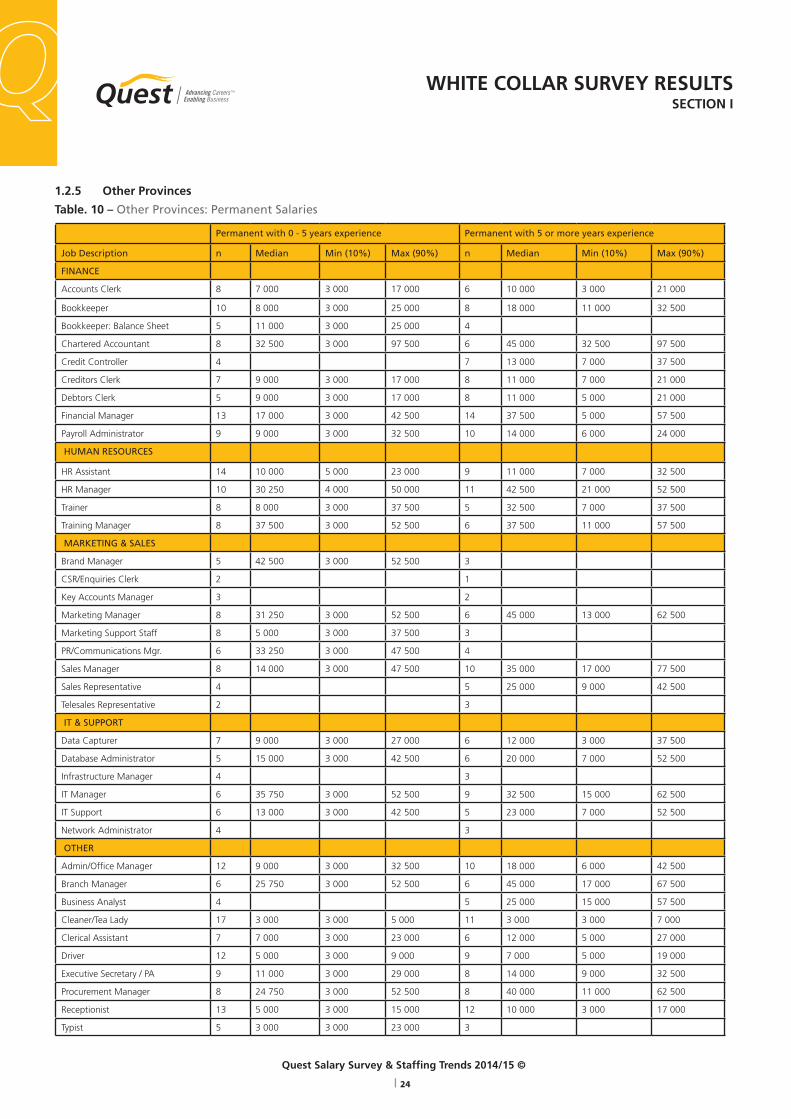
1.2.5 Other Provinces
Table. 10 – Other Provinces: Permanent Salaries
WHITE COLLAR SURVEY RESULTSSECTION I
Quest Salary Survey & Staffing Trends 2014/15 ©
| 25
TM
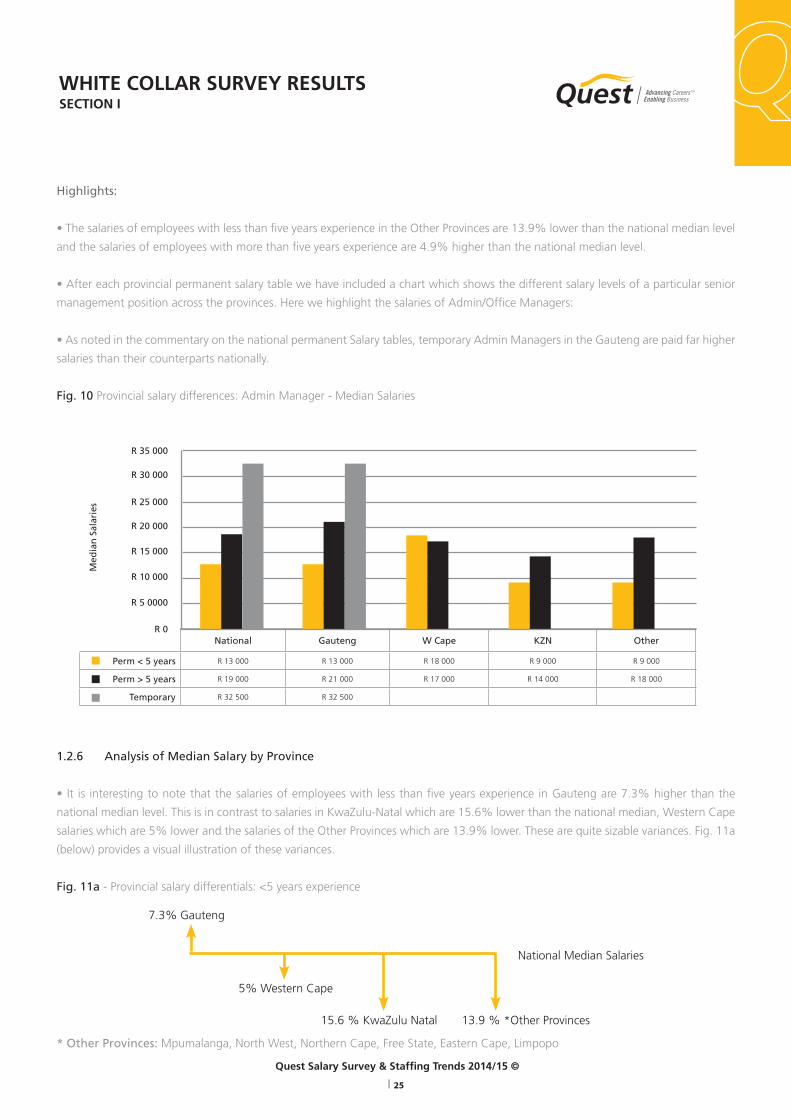
Highlights:
• The salaries of employees with less than five years experience in the Other Provinces are 13.9% lower than the national median level
and the salaries of employees with more than five years experience are 4.9% higher than the national median level.
• After each provincial permanent salary table we have included a chart which shows the different salary levels of a particular senior
management position across the provinces. Here we highlight the salaries of Admin/Office Managers:
• As noted in the commentary on the national permanent Salary tables, temporary Admin Managers in the Gauteng are paid far higher
salaries than their counterparts nationally.
Fig. 10 Provincial salary differences: Admin Manager - Median Salaries
1.2.6 Analysis of Median Salary by Province
• It is interesting to note that the salaries of employees with less than five years experience in Gauteng are 7.3% higher than the
national median level. This is in contrast to salaries in KwaZulu-Natal which are 15.6% lower than the national median, Western Cape
salaries which are 5% lower and the salaries of the Other Provinces which are 13.9% lower. These are quite sizable variances. Fig. 11a
(below) provides a visual illustration of these variances.
Fig. 11a - Provincial salary differentials: <5 years experience
National Median Salaries
7.3% Gauteng
5% Western Cape
15.6 % KwaZulu Natal 13.9 % *Other Provinces
* Other Provinces: Mpumalanga, North West, Northern Cape, Free State, Eastern Cape, Limpopo
WHITE COLLAR SURVEY RESULTSSECTION I
R 0
R 5 0000
R 10 000
R 15 000
R 20 000
R 25 000
R 30 000
R 35 000
Med
ian
Sal
arie
s
National Gauteng W Cape KZN Other
Perm < 5 years R 13 000 R 13 000 R 18 000 R 9 000 R 9 000
Perm > 5 years R 19 000 R 21 000 R 17 000 R 14 000 R 18 000
Temporary R 32 500 R 32 500
Quest Salary Survey & Staffing Trends 2014/15 ©
| 26
TM
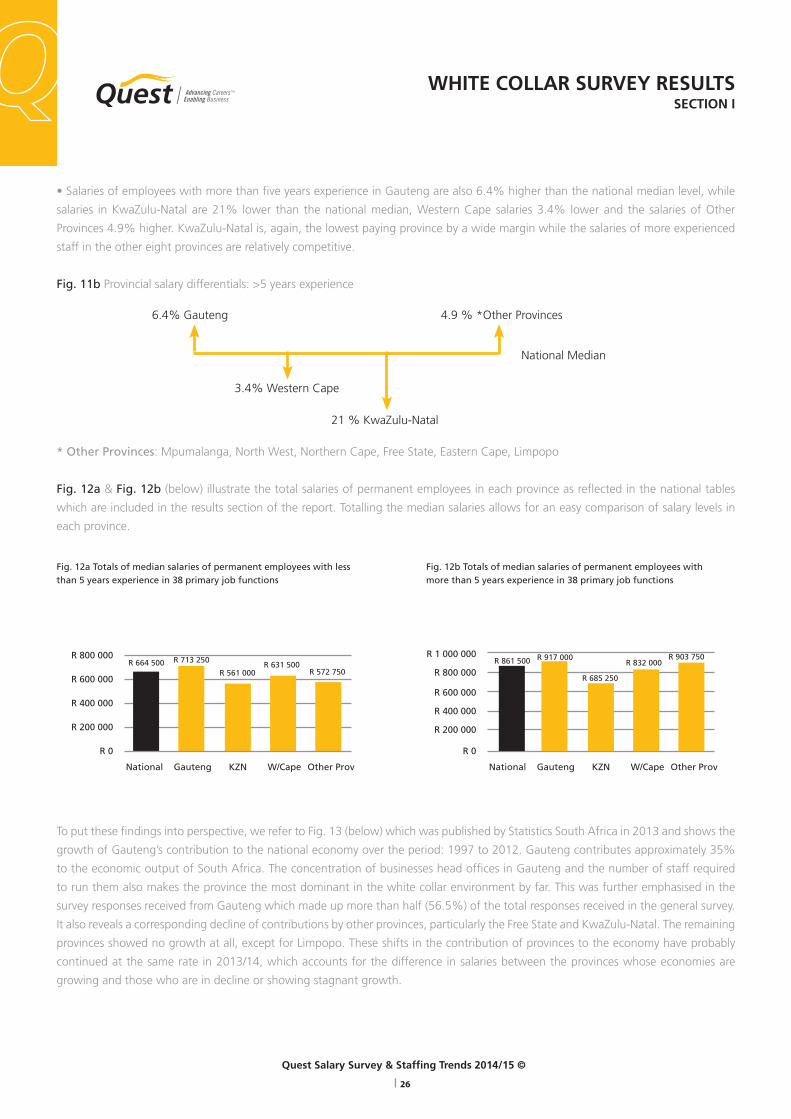
• Salaries of employees with more than five years experience in Gauteng are also 6.4% higher than the national median level, while
salaries in KwaZulu-Natal are 21% lower than the national median, Western Cape salaries 3.4% lower and the salaries of Other
Provinces 4.9% higher. KwaZulu-Natal is, again, the lowest paying province by a wide margin while the salaries of more experienced
staff in the other eight provinces are relatively competitive.
Fig. 11b Provincial salary differentials: >5 years experience
* Other Provinces: Mpumalanga, North West, Northern Cape, Free State, Eastern Cape, Limpopo
Fig. 12a & Fig. 12b (below) illustrate the total salaries of permanent employees in each province as reflected in the national tables
which are included in the results section of the report. Totalling the median salaries allows for an easy comparison of salary levels in
each province.
To put these findings into perspective, we refer to Fig. 13 (below) which was published by Statistics South Africa in 2013 and shows the
growth of Gauteng’s contribution to the national economy over the period: 1997 to 2012. Gauteng contributes approximately 35%
to the economic output of South Africa. The concentration of businesses head offices in Gauteng and the number of staff required
to run them also makes the province the most dominant in the white collar environment by far. This was further emphasised in the
survey responses received from Gauteng which made up more than half (56.5%) of the total responses received in the general survey.
It also reveals a corresponding decline of contributions by other provinces, particularly the Free State and KwaZulu-Natal. The remaining
provinces showed no growth at all, except for Limpopo. These shifts in the contribution of provinces to the economy have probably
continued at the same rate in 2013/14, which accounts for the difference in salaries between the provinces whose economies are
growing and those who are in decline or showing stagnant growth.
WHITE COLLAR SURVEY RESULTSSECTION I
National Median
6.4% Gauteng
3.4% Western Cape
21 % KwaZulu-Natal
4.9 % *Other Provinces
Fig. 12a Totals of median salaries of permanent employees with less than 5 years experience in 38 primary job functions
Fig. 12b Totals of median salaries of permanent employees with more than 5 years experience in 38 primary job functions
National Gauteng KZN W/Cape Other Prov
R 0
R 200 000
R 400 000
R 600 000
R 800 000R 664 500 R 713 250
R 561 000R 631 500
R 572 750
National Gauteng KZN W/Cape Other Prov
R 0
R 200 000
R 400 000
R 600 000
R 800 000R 861 500 R 917 000
R 685 250
R 832 000R 903 750R 1 000 000

Quest Salary Survey & Staffing Trends 2014/15 ©
| 27
TMWHITE COLLAR SURVEY RESULTSSECTION I
Fig. 13 Provincial Contributions to the South African Economy 1997, 2007, 2012
0
5
10
15
20
25
30
35
40
Western Cape Eastern Cape Northen Cape Free State KZN North West Gauteng Mpumalanga Limpopo
1997 14,4 8,2 2,1 5,9 16,7 6,2 33,7 6,9 5,8
2007 14,5 7,5 2,3 5,4 16,1 6,5 34 6,9 6,8
2012 14 7,5 2,2 5,2 15,8 6,4 34,7 7,1 7,1
Source: Regional Economic Growth by Gerhard BouwerStatistics South Africa (www.statssa.gov.za/articles)
Quest Salary Survey & Staffing Trends 2014/15 ©
| 28
TM
Permanent with 0 - 5 years experience Permanent with 5 or more years experience
Job Description n Median Min (10%) Max (90%) n Median Min (10%) Max (90%)
FINANCE
Accounts Clerk 5 13 000 3 000 25 000 8 12 000 7 000 15 000
Bookkeeper 7 13 000 3 000 57 500 11 23 000 9 000 37 500
Bookkeeper: Balance Sheet 4 4
Chartered Accountant 4 4
Credit Controller 4 8 26 000 5 000 52 500
Creditors Clerk 5 13 000 3 000 57 500 10 13 000 7 000 21 000
Debtors Clerk 4 7 15 000 5 000 21 000
Financial Manager 11 21 000 11 000 42 500 23 42 500 17 000 72 500
Payroll Administrator 5 9 000 3 000 57 500 10 20 000 11 000 50 000
HUMAN RESOURCES
HR Assistant 5 7 000 3 000 25 000 8 15 000 3 000 27 000
HR Manager 6 14 000 3 000 32 500 13 32 500 11 000 77 500
Trainer 4 4
Training Manager 1 6 37 500 5 000 57 500
MARKETING & SALES
Brand Manager 1 2
CSR/Enquiries Clerk 2 1
Key Accounts Manager 2 3
Marketing Manager 5 13 000 3 000 62 500 9 42 500 5 000 72 500
Marketing Support Staff 2 3
PR/Communications Mgr. 2 2
Sales Manager 5 11 000 3 000 67 500 7 52 500 5 000 97 500
Sales Representative 7 11 000 3 000 32 500 4
Telesales Representative 1 2
IT & SUPPORT
Data Capturer 5 9 000 3 000 19 000 5 9 000 5 000 29 000
Database Administrator 3 2
Infrastructure Manager 2 5 47 500 5 000 92 500
IT Manager 2 9 47 500 5 000 97 500
IT Support 3 7 15 000 5 000 57 500
Network Administrator 4 3
OTHER
Admin/Office Manager 8 8 000 3 000 15 000 12 17 000 5 000 37 500
Branch Manager 4 5 32 500 5 000 52 500
Business Analyst 2 1
Cleaner/Tea Lady 13 3 000 3 000 7 000 15 5 000 3 000 9 000
Clerical Assistant 8 6 000 3 000 11 000 6 9 000 5 000 13 000
Driver 9 5 000 3 000 11 000 13 9 000 5 000 15 000
Executive Secretary / PA 7 11 000 3 000 29 000 14 20 000 11 000 37 500
Procurement Manager 4 7 52 500 5 000 67 500
Receptionist 13 9 000 3 000 15 000 17 9 000 5 000 17 000
Typist 3 4
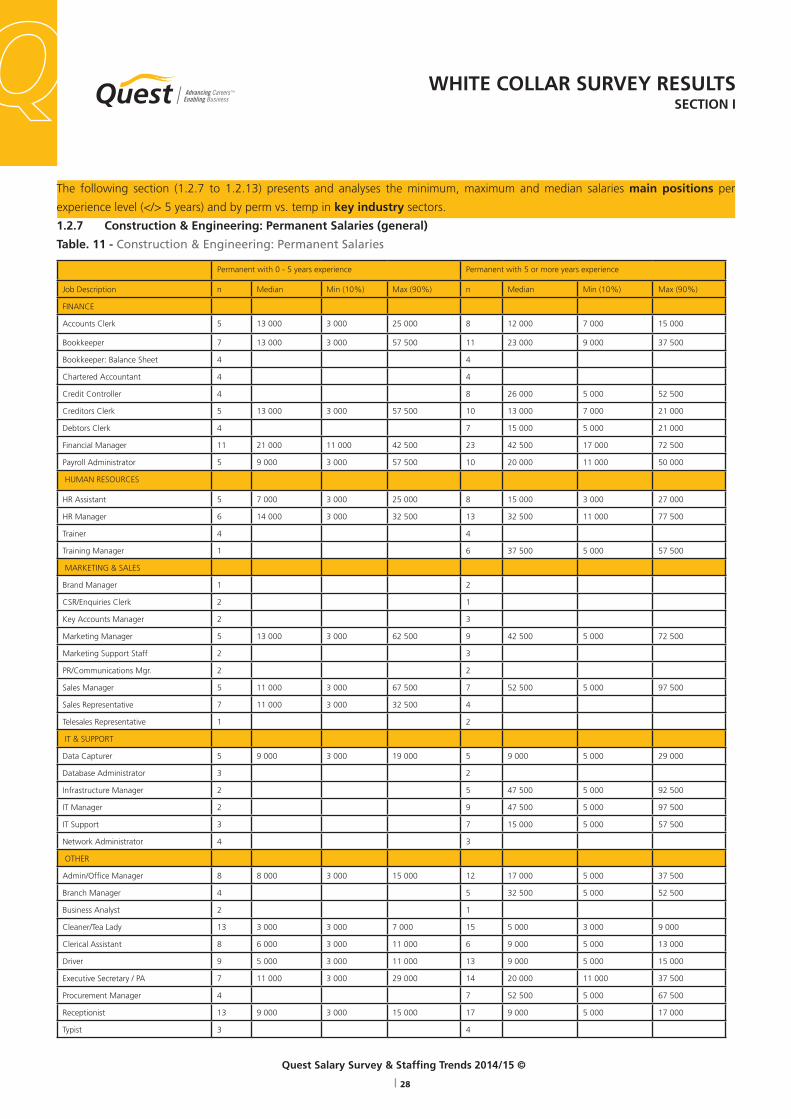
The following section (1.2.7 to 1.2.13) presents and analyses the minimum, maximum and median salaries main positions per
experience level (</> 5 years) and by perm vs. temp in key industry sectors.
1.2.7 Construction & Engineering: Permanent Salaries (general)
Table. 11 - Construction & Engineering: Permanent Salaries
WHITE COLLAR SURVEY RESULTSSECTION I
Quest Salary Survey & Staffing Trends 2014/15 ©
| 29
TM
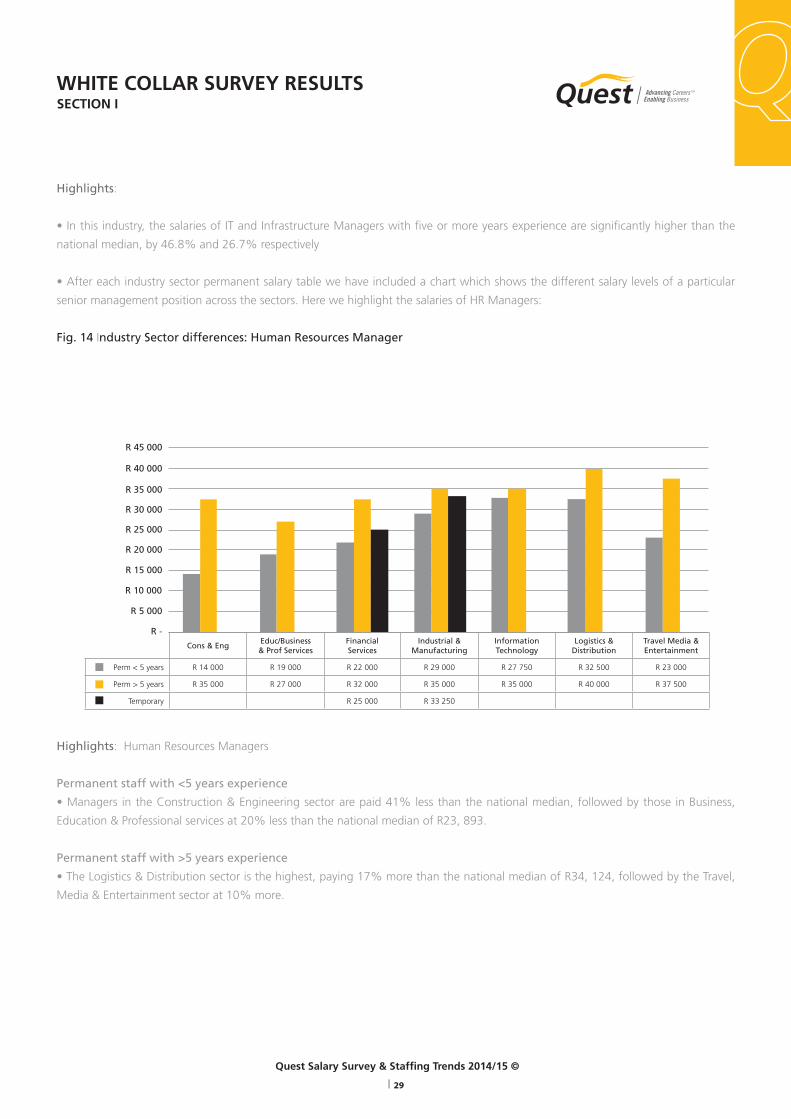
Highlights:
• In this industry, the salaries of IT and Infrastructure Managers with five or more years experience are significantly higher than the
national median, by 46.8% and 26.7% respectively
• After each industry sector permanent salary table we have included a chart which shows the different salary levels of a particular
senior management position across the sectors. Here we highlight the salaries of HR Managers:
Fig. 14 Industry Sector differences: Human Resources Manager
Highlights: Human Resources Managers
Permanent staff with <5 years experience
• Managers in the Construction & Engineering sector are paid 41% less than the national median, followed by those in Business,
Education & Professional services at 20% less than the national median of R23, 893.
Permanent staff with >5 years experience
• The Logistics & Distribution sector is the highest, paying 17% more than the national median of R34, 124, followed by the Travel,
Media & Entertainment sector at 10% more.
WHITE COLLAR SURVEY RESULTSSECTION I
Cons & EngEduc/Business & Prof Services
FinancialServices
Industrial &Manufacturing
InformationTechnology
Logistics & Distribution
Travel Media & Entertainment
Perm < 5 years R 14 000 R 19 000 R 22 000 R 29 000 R 27 750 R 32 500 R 23 000
Perm > 5 years R 35 000 R 27 000 R 32 000 R 35 000 R 35 000 R 40 000 R 37 500
Temporary R 25 000 R 33 250
R -
R 5 000
R 10 000
R 15 000
R 20 000
R 25 000
R 30 000
R 35 000
R 40 000
R 45 000

Quest Salary Survey & Staffing Trends 2014/15 ©
| 30
TM
Permanent with 0 - 5 years experience Permanent with 5 or more years experience
Job Description n Median Min (10%) Max (90%) n Median Min (10%) Max (90%)
FINANCE
Accounts Clerk 6 8 000 5 000 13 000 8 10 000 9 000 13 000
Bookkeeper 14 15 000 9 000 25 000 19 19 000 11 000 23 000
Bookkeeper: Balance Sheet 4 7 19 000 11 000 32 500
Chartered Accountant 6 35 000 21 000 67 500 8 57 500 32 500 77 500
Credit Controller 5 7 000 7 000 15 000 7 11 000 9 000 17 000
Creditors Clerk 5 11 000 7 000 13 000 5 11 000 9 000 11 000
Debtors Clerk 7 9 000 3 000 11 000 11 11 000 7 000 13 000
Financial Manager 11 23 000 15 000 42 500 29 32 500 15 000 57 500
Payroll Administrator 5 11 000 7 000 17 000 12 13 000 9 000 23 000
HUMAN RESOURCES
HR Assistant 13 9 000 5 000 19 000 7 15 000 5 000 25 000
HR Manager 9 19 000 7 000 47 500 20 27 000 18 000 50 000
Trainer 8 17 000 5 000 57 500 11 15 000 9 000 47 500
Training Manager 5 37 500 7 000 42 500 11 32 500 19 000 52 500
MARKETING & SALES
Brand Manager 1 2
CSR/Enquiries Clerk 0 1
Key Accounts Manager 3 7 42 500 29 000 97 500
Marketing Manager 7 21 000 7 000 37 500 17 37 500 17 000 67 500
Marketing Support Staff 5 5 000 3 000 13 000 7 15 000 7 000 29 000
PR/Communications Mgr. 3 3
Sales Manager 4 12 30 750 19 000 52 500
Sales Representative 11 15 000 7 000 17 000 15 21 000 9 000 29 000
Telesales Representative 4 6 7 000 5 000 17 000
IT & SUPPORT
Data Capturer 4 8 7 000 5 000 32 500
Database Administrator 3 10 13 000 7 000 24 000
Infrastructure Manager 0 1
IT Manager 2 9 32 500 15 000 57 500
IT Support 5 5 000 5 000 9 000 6 14 000 7 000 19 000
Network Administrator 2 3
OTHER
Admin/Office Manager 14 12 000 7 000 19 000 17 17 000 9 000 23 000
Branch Manager 6 20 000 7 000 52 500 10 35 000 15 000 37 500
Business Analyst 2 2
Cleaner/Tea Lady 20 3 000 3 000 4 000 26 3 000 3 000 5 000
Clerical Assistant 5 7 000 3 000 7 000 8 8 000 5 000 13 000
Driver 6 5 000 3 000 5 000 11 5 000 5 000 7 000
Executive Secretary / PA 10 9 000 6 000 15 000 20 13 000 11 000 24 000
Procurement Manager 2 4
Receptionist 25 5 000 3 000 11 000 24 9 000 5 000 13 000
Typist 5 5 000 3 000 17 000 4
1.2.8 Education & Business/Professional Services (general)
Table. 12 - Education & Business/Professional Services: Permanent Salaries
WHITE COLLAR SURVEY RESULTSSECTION I

Quest Salary Survey & Staffing Trends 2014/15 ©
| 31
TM
Highlights:
• In this sector, the salaries of Key Accounts Managers with five or more years experience are higher than the national median by
30.8%. This highlights the important role of sales and client management in the competitive world of business and professional
services.
• After each industry sector permanent salary table we have included a chart which shows the different salary levels of a particular
senior management position across the sectors. Here we highlight the salaries of Marketing Managers:
Fig. 15 Industry Sector differences: Marketing Manager
Highlights: Marketing Manager
Permanent staff with <5 years experience
• The Industrial & Manufacturing sector salaries are the highest, paying 42% higher than the national median of R22, 917, followed
by the Travel, Media & Entertainment at 27% more.
• The Construction & Engineering sector pays the lowest, with salaries 43% lower than the national median.
Permanent staff with >5 years experience
• The Financial Services and Industrial & Manufacturing sector salaries are the highest, paying 12% and 24% higher than the national
median of R42, 500 respectively.
WHITE COLLAR SURVEY RESULTSSECTION I
Cons & EngEduc/Business & Prof Services
FinancialServices
Industrial &Manufacturing
InformationTechnology
Logistics & Distribution
Travel Media & Entertainment
Perm < 5 years R 13 000 R 21 000 R 23 000 R 32 500 R 19 000 R 29 000
Perm > 5 years R 42 500 R 37 500 R 52 500 R 47 500 R 35 500 R 42 500 R 42 500
Temporary R 42 500
R -
R 10 000
R 20 000
R 30 000
R 40 000
R 50 000
R 60 000
Quest Salary Survey & Staffing Trends 2014/15 ©
| 32
TM
Permanent with 0 - 5 years experience Permanent with 5 or more years experience
Job Description n Median Min (10%) Max (90%) n Median Min (10%) Max (90%)
FINANCE
Accounts Clerk 15 11 000 5 000 21 000 12 14 000 7 000 25 000
Bookkeeper 18 12 000 7 000 23 000 20 16 000 10 000 30 750
Bookkeeper: Balance Sheet 11 11 000 7 000 21 000 10 15 000 8 000 30 250
Chartered Accountant 17 32 500 15 000 67 500 17 37 500 15 000 92 500
Credit Controller 10 9 000 6 000 20 000 11 13 000 9 000 25 000
Creditors Clerk 11 9 000 7 000 21 000 12 11 000 9 000 25 000
Debtors Clerk 9 9 000 5 000 21 000 14 11 000 7 000 19 000
Financial Manager 17 42 500 19 000 57 500 23 47 500 21 000 67 500
Payroll Administrator 12 12 000 9 000 21 000 17 17 000 9 000 27 000
HUMAN RESOURCES
HR Assistant 11 11 000 9 000 19 000 15 15 000 9 000 21 000
HR Manager 12 22 000 13 000 37 500 17 32 500 15 000 47 500
Trainer 7 13 000 7 000 17 000 8 15 000 7 000 21 000
Training Manager 9 21 000 9 000 27 000 9 29 000 9 000 32 500
MARKETING & SALES
Brand Manager 6 22 000 7 000 52 500 7 32 500 11 000 67 500
CSR/Enquiries Clerk 7 11 000 7 000 11 000 9 13 000 5 000 15 000
Key Accounts Manager 7 17 000 9 000 47 500 10 37 500 16 000 70 000
Marketing Manager 6 23 000 13 000 52 500 15 37 500 11 000 67 500
Marketing Support Staff 6 11 000 7 000 13 000 7 15 000 7 000 27 000
PR/Communications Mgr. 7 19 000 7 000 42 500 7 32 500 7 000 52 500
Sales Manager 7 17 000 9 000 37 500 13 37 500 19 000 57 500
Sales Representative 10 14 000 7 000 23 000 12 19 000 7 000 29 000
Telesales Representative 9 7 000 5 000 21 000 9 9 000 5 000 25 000
IT & SUPPORT
Data Capturer 7 9 000 7 000 13 000 11 13 000 5 000 17 000
Database Administrator 8 14 000 9 000 21 000 12 19 000 11 000 42 500
Infrastructure Manager 5 23 000 7 000 29 000 7 29 000 7 000 67 500
IT Manager 9 19 000 9 000 37 500 16 35 000 13 000 62 500
IT Support 12 11 000 7 000 19 000 14 18 000 11 000 25 000
Network Administrator 5 13 000 11 000 15 000 8 16 000 9 000 25 000
OTHER
Admin/Office Manager 11 13 000 9 000 25 000 19 21 000 9 000 52 500
Branch Manager 8 18 000 9 000 37 500 12 35 000 11 000 52 500
Business Analyst 6 20 000 9 000 27 000 10 25 000 14 000 57 500
Cleaner/Tea Lady 17 3 000 3 000 7 000 22 5 000 3 000 7 000
Clerical Assistant 13 9 000 5 000 11 000 18 11 000 7 000 17 000
Driver 11 7 000 5 000 9 000 12 7 000 5 000 15 000
Executive Secretary / PA 12 11 000 5 000 25 000 22 18 000 7 000 37 500
Procurement Manager 7 29 000 13 000 32 500 8 37 500 11 000 57 500
Receptionist 18 8 000 5 000 11 000 19 11 000 7 000 17 000
Typist 6 9 000 3 000 13 000 6 11 000 7 000 15 000
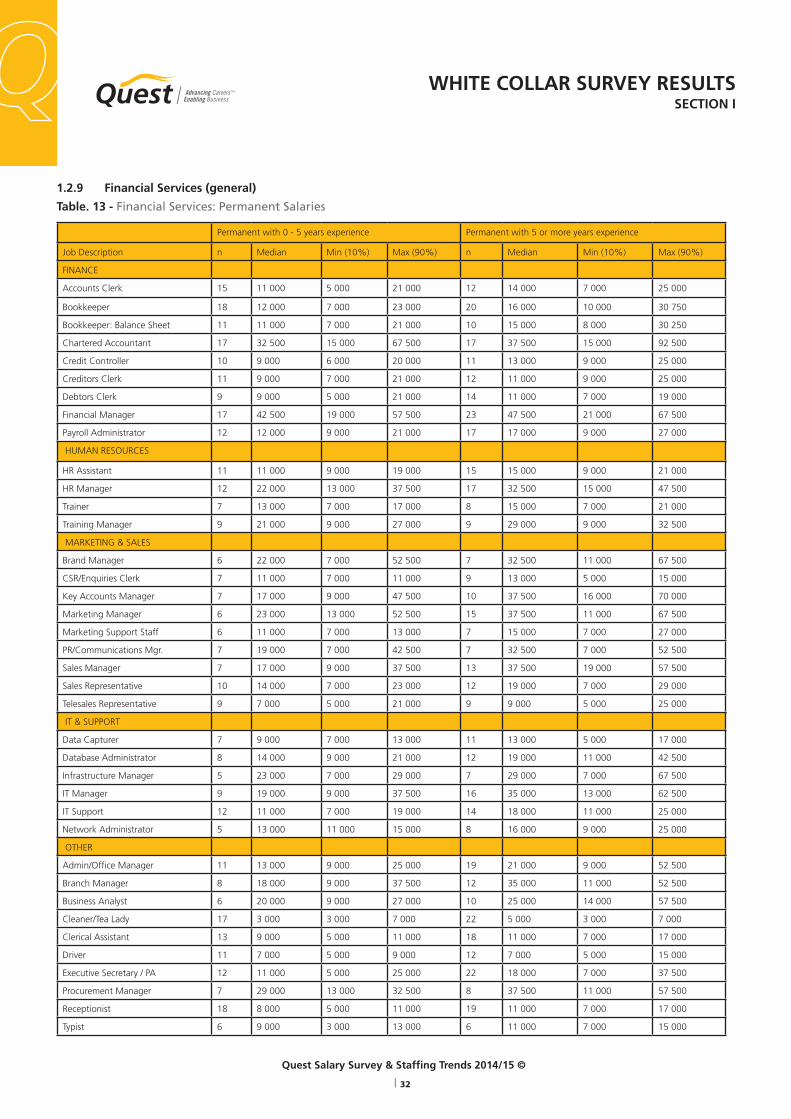
1.2.9 Financial Services (general)
Table. 13 - Financial Services: Permanent Salaries
WHITE COLLAR SURVEY RESULTSSECTION I
Quest Salary Survey & Staffing Trends 2014/15 ©
| 33
TM
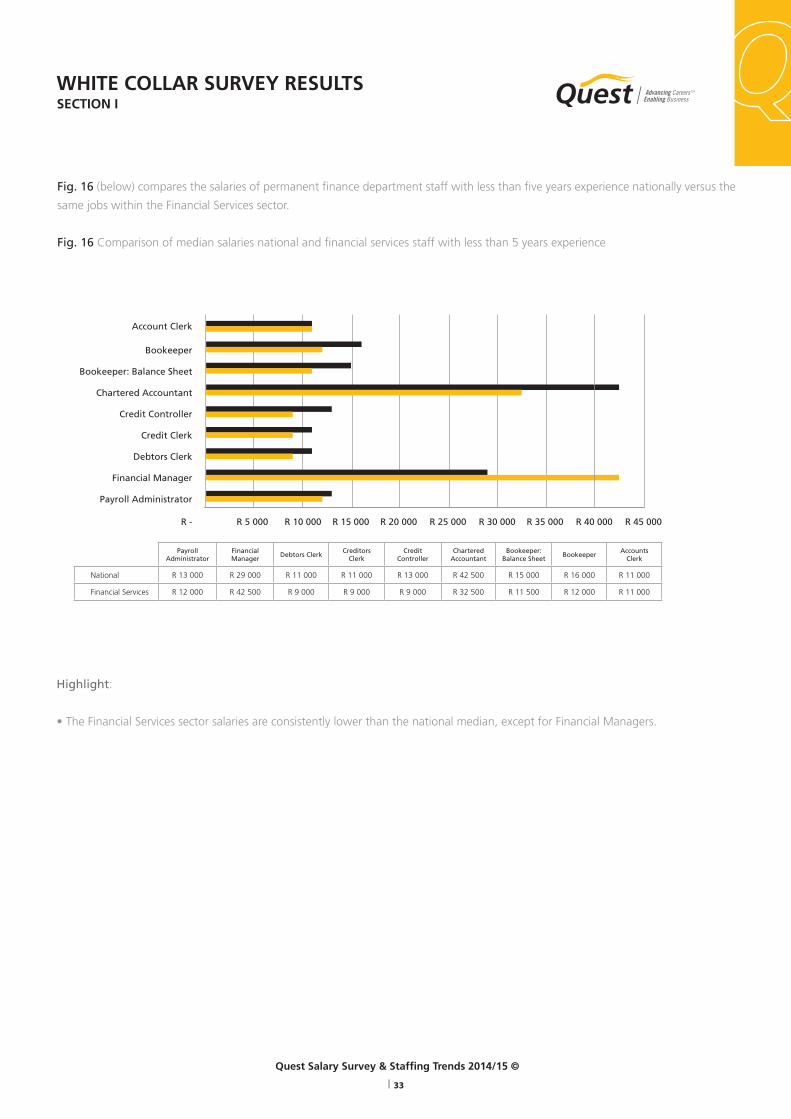
Fig. 16 (below) compares the salaries of permanent finance department staff with less than five years experience nationally versus the
same jobs within the Financial Services sector.
Fig. 16 Comparison of median salaries national and financial services staff with less than 5 years experience
Highlight:
• The Financial Services sector salaries are consistently lower than the national median, except for Financial Managers.
WHITE COLLAR SURVEY RESULTSSECTION I
PayrollAdministrator
Financial Manager
Debtors ClerkCreditors
ClerkCredit
ControllerChartered
AccountantBookeeper:
Balance SheetBookeeper
Accounts Clerk
National R 13 000 R 29 000 R 11 000 R 11 000 R 13 000 R 42 500 R 15 000 R 16 000 R 11 000
Financial Services R 12 000 R 42 500 R 9 000 R 9 000 R 9 000 R 32 500 R 11 500 R 12 000 R 11 000
Account Clerk
Bookeeper
Bookeeper: Balance Sheet
Chartered Accountant
Credit Controller
Credit Clerk
Debtors Clerk
Financial Manager
Payroll Administrator
R - R 5 000 R 10 000 R 15 000 R 20 000 R 25 000 R 30 000 R 35 000 R 40 000 R 45 000
Quest Salary Survey & Staffing Trends 2014/15 ©
| 34
TM
Temporary or contract staff via recruiter Average Monthly Commission – Perm & Temp
Job Description n Median Min (10%) Max (90%) n Median Min (10%) Max (90%)
FINANCE
Accounts Clerk 5 19 000 9 000 32 500 2
Bookkeeper 6 15 000 7 000 27 000 1
Bookkeeper: Balance Sheet 7 17 000 7 000 25 000 1
Chartered Accountant 6 29 250 15 000 42 500 2
Credit Controller 5 11 000 9 000 25 000 3
Creditors Clerk 5 11 000 9 000 23 000 2
Debtors Clerk 5 9 000 7 000 17 000 2
Financial Manager 5 32 500 7 000 37 500 2
Payroll Administrator 4 2
HUMAN RESOURCES
HR Assistant 5 13 000 9 000 17 000 2
HR Manager 5 25 000 11 000 42 500 2
Trainer 4 2
Training Manager 4 2
MARKETING & SALES
Brand Manager 4 2
CSR/Enquiries Clerk 13 7 000 5 000 13 000 2
Key Accounts Manager 4 2
Marketing Manager 4 3
Marketing Support Staff 9 11 000 3 000 15 000 2
PR/Communications Mgr. 4 2
Sales Manager 4 4
Sales Representative 10 15 000 6 000 32 500 5 5 000 3 000 42 500
Telesales Representative 4 5 5 000 3 000 5 000
IT & SUPPORT
Data Capturer 11 7 000 5 000 11 000 2
Database Administrator 4 2
Infrastructure Manager 3 2
IT Manager 3 2
IT Support 4 2
Network Administrator 4 2
OTHER
Admin/Office Manager 5 15 000 9 000 21 000 3
Branch Manager 4 2
Business Analyst 5 15 000 13 000 29 000 2
Cleaner/Tea Lady 9 3 000 3 000 15 000 0
Clerical Assistant 13 7 000 7 000 9 000 2
Driver 5 5 000 3 000 17 000 2
Executive Secretary / PA 7 13 000 7 000 21 000 2
Procurement Manager 4 2
Receptionist 14 7 000 5 000 11 000 2
Typist 4 2
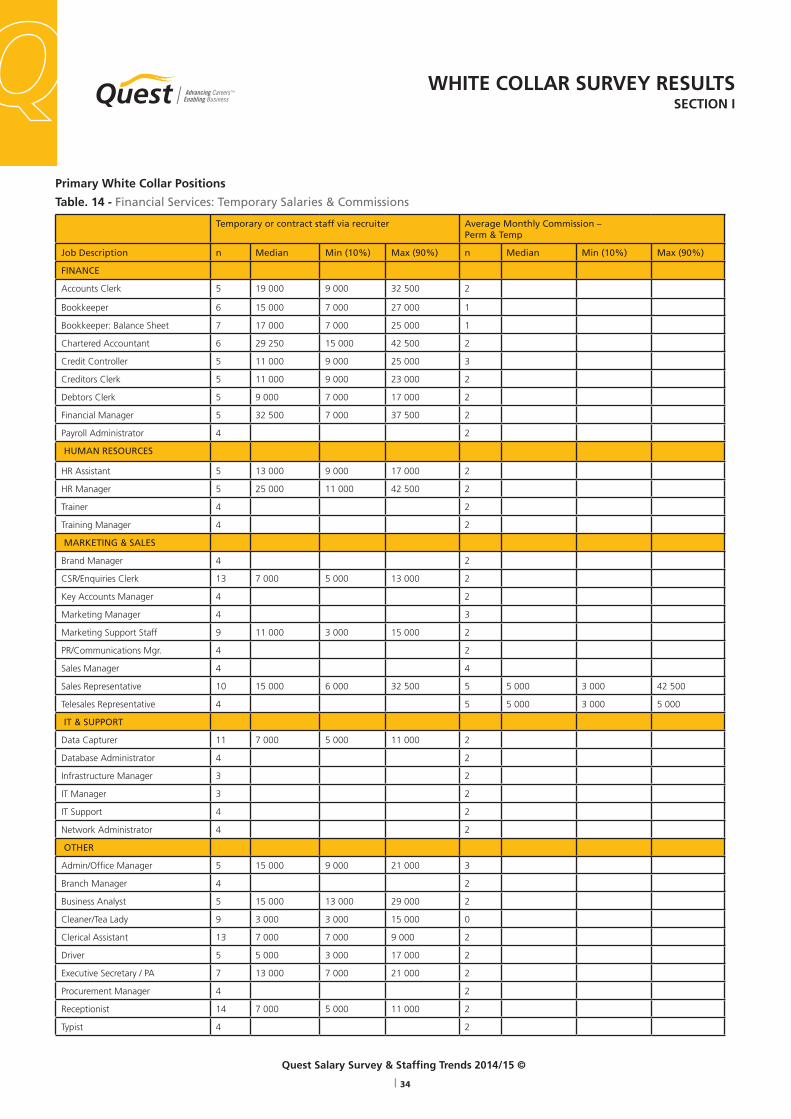
Primary White Collar Positions
Table. 14 - Financial Services: Temporary Salaries & Commissions
WHITE COLLAR SURVEY RESULTSSECTION I

Quest Salary Survey & Staffing Trends 2014/15 ©
| 35
TM
Highlights:
• The five temporary job functions used most frequently by
the Financial Services sector are: CSR/Enquiries Clerks, Sales
Representatives, Data Capturers, Clerical Assistants and
Receptionists. These temporary staff are all paid competitive
salaries closely matching the national median.
Temporary or contract staff via recruiter Average Monthly Commission – Perm & Temp
Job Description n Median Min (10%) Max (90%) n Median Min (10%) Max (90%)
FINANCE
Accounts Clerk 5 19 000 9 000 32 500 2
Bookkeeper 6 15 000 7 000 27 000 1
Bookkeeper: Balance Sheet 7 17 000 7 000 25 000 1
Chartered Accountant 6 29 250 15 000 42 500 2
Credit Controller 5 11 000 9 000 25 000 3
Creditors Clerk 5 11 000 9 000 23 000 2
Debtors Clerk 5 9 000 7 000 17 000 2
Financial Manager 5 32 500 7 000 37 500 2
Payroll Administrator 4 2
HUMAN RESOURCES
HR Assistant 5 13 000 9 000 17 000 2
HR Manager 5 25 000 11 000 42 500 2
Trainer 4 2
Training Manager 4 2
MARKETING & SALES
Brand Manager 4 2
CSR/Enquiries Clerk 13 7 000 5 000 13 000 2
Key Accounts Manager 4 2
Marketing Manager 4 3
Marketing Support Staff 9 11 000 3 000 15 000 2
PR/Communications Mgr. 4 2
Sales Manager 4 4
Sales Representative 10 15 000 6 000 32 500 5 5 000 3 000 42 500
Telesales Representative 4 5 5 000 3 000 5 000
IT & SUPPORT
Data Capturer 11 7 000 5 000 11 000 2
Database Administrator 4 2
Infrastructure Manager 3 2
IT Manager 3 2
IT Support 4 2
Network Administrator 4 2
OTHER
Admin/Office Manager 5 15 000 9 000 21 000 3
Branch Manager 4 2
Business Analyst 5 15 000 13 000 29 000 2
Cleaner/Tea Lady 9 3 000 3 000 15 000 0
Clerical Assistant 13 7 000 7 000 9 000 2
Driver 5 5 000 3 000 17 000 2
Executive Secretary / PA 7 13 000 7 000 21 000 2
Procurement Manager 4 2
Receptionist 14 7 000 5 000 11 000 2
Typist 4 2
Primary White Collar Positions
Table. 14 - Financial Services: Temporary Salaries & Commissions
WHITE COLLAR SURVEY RESULTSSECTION I

Quest Salary Survey & Staffing Trends 2014/15 ©
| 36
TM
Permanent with 0 - 5 years experience Permanent with 5 or more years experience
Job Description n Median Min (10%) Max (90%) n Median Min (10%) Max (90%)
FINANCE
Accounts Clerk 15 13 000 7 000 17 000 26 12 000 7 000 21 000
Bookkeeper 21 17 000 9 000 29 000 36 23 000 15 000 32 500
Bookkeeper: Balance Sheet 9 21 000 11 000 32 500 19 23 000 13 000 32 500
Chartered Accountant 12 47 500 29 000 97 500 18 47 500 32 500 97 500
Credit Controller 15 19 000 11 000 27 000 29 17 000 11 000 27 000
Creditors Clerk 22 11 000 9 000 17 000 27 15 000 9 000 27 000
Debtors Clerk 19 11 000 7 000 21 000 32 15 000 11 000 21 000
Financial Manager 23 32 500 17 000 72 500 50 50 000 27 000 95 000
Payroll Administrator 17 13 000 7 000 23 000 27 17 000 9 000 23 000
HUMAN RESOURCES
HR Assistant 18 12 000 5 000 27 000 21 19 000 9 000 29 000
HR Manager 18 29 000 17 000 92 500 34 35 000 17 000 57 500
Trainer 10 20 000 11 000 33 250 11 23 000 17 000 32 500
Training Manager 13 37 500 19 000 87 500 15 37 500 13 000 92 500
MARKETING & SALES
Brand Manager 5 42 500 5 000 92 500 8 52 500 32 500 92 500
CSR/Enquiries Clerk 4 6 13 000 9 000 32 500
Key Accounts Manager 4 15 42 500 27 000 97 500
Marketing Manager 13 32 500 15 000 52 500 23 47 500 29 000 72 500
Marketing Support Staff 10 18 000 6 000 35 000 14 18 000 11 000 37 500
PR/Communications Mgr. 7 37 500 3 000 92 500 7 37 500 21 000 92 500
Sales Manager 13 32 500 9 000 47 500 33 42 500 27 000 77 500
Sales Representative 16 15 000 7 000 37 500 31 23 000 15 000 37 500
Telesales Representative 7 9 000 7 000 17 000 15 13 000 11 000 21 000
IT & SUPPORT
Data Capturer 8 11 000 3 000 27 000 11 11 000 7 000 23 000
Database Administrator 7 21 000 13 000 42 500 9 23 000 3 000 52 500
Infrastructure Manager 6 42 500 11 000 97 500 10 52 500 22 750 95 000
IT Manager 9 32 500 15 000 97 500 18 52 500 17 000 97 500
IT Support 13 19 000 9 000 37 500 13 21 000 17 000 37 500
Network Administrator 10 15 000 6 000 37 500 10 21 000 10 000 40 000
OTHER
Admin/Office Manager 10 23 000 8 000 45 000 19 29 750 13 000 47 500
Branch Manager 10 40 000 14 000 92 500 18 40 000 27 000 92 500
Business Analyst 9 21 000 3 000 42 500 9 25 000 19 000 57 500
Cleaner/Tea Lady 21 5 000 3 000 5 000 33 5 000 3 000 7 000
Clerical Assistant 11 9 000 7 000 15 000 17 9 000 7 000 17 000
Driver 25 7 000 3 000 11 000 35 9 000 5 000 11 000
Executive Secretary / PA 15 15 000 9 000 29 000 24 19 000 11 000 29 000
Procurement Manager 12 32 500 11 000 47 500 31 29 000 15 000 52 500
Receptionist 20 9 000 5 000 19 000 42 10 000 7 000 17 000
Typist 4 5 13 000 5 000 27 000
1.2.10 Industrial/Manufacturing (general)
Table. 15 - Industrial/Manufacturing: Permanent Salaries
WHITE COLLAR SURVEY RESULTSSECTION I

Quest Salary Survey & Staffing Trends 2014/15 ©
| 37
TM
Highlights:
• If a comparison is made between the salaries of staff with less than five years experience - (shown in the table above) - and the
national salaries of the equivalent job functions (simply totalling them is the truest comparison), you will find that the Industrial/
Manufacturing sector pays 28.3% more than the national median. The sector pays 12.2% more for staff with more than five years
experience.
• After each industry sector permanent salary table we have included a chart which shows the different salary levels of a particular
senior management position across the sectors. Here we highlight the salaries of IT Managers:
Fig. 17 Industry Sector differences: IT Manager - Median Salaries
Highlights: IT Manager
Permanent staff with < 5 years experience
• The Industrial & Manufacturing sector salaries are the highest, more than 36% higher than the national median salary of R23, 875.
Salaries in the other industrial sectors all fall below the national median salary.
Permanent staff with >5 years experience
• The Logistics & Distribution and the Industrial & Manufacturing sectors are the highest paying, with their salaries both 22% higher
than the national median salary of R42, 917. The Construction & Engineering sector also pays above the national median by 10%.
WHITE COLLAR SURVEY RESULTSSECTION I
R 10 000
R 30 000
R 40 000
R 50 000
Cons & EngEduc/Business & Prof Services
FinancialServices
Industrial &Manufacturing
InformationTechnology
Logistics & Distribution
Travel Media & Entertainment
Perm < 5 years R 19 000 R 32 500 R 23 000 R 21 000
Perm > 5 years R 47 500 R 32 500 R 37 500 R 52 500 R 35 500 R 52 500
Temporary
R -
R 20 000
R 60 000
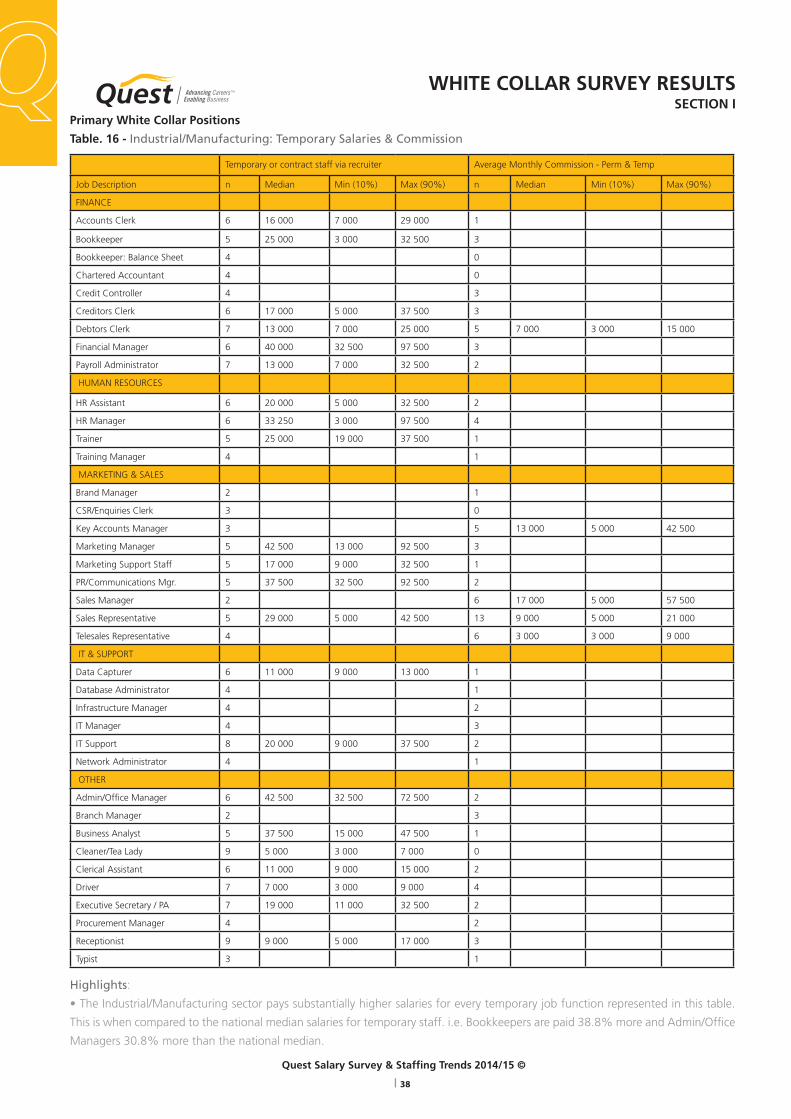
Quest Salary Survey & Staffing Trends 2014/15 ©
| 38
TM
Temporary or contract staff via recruiter Average Monthly Commission - Perm & Temp
Job Description n Median Min (10%) Max (90%) n Median Min (10%) Max (90%)
FINANCE
Accounts Clerk 6 16 000 7 000 29 000 1
Bookkeeper 5 25 000 3 000 32 500 3
Bookkeeper: Balance Sheet 4 0
Chartered Accountant 4 0
Credit Controller 4 3
Creditors Clerk 6 17 000 5 000 37 500 3
Debtors Clerk 7 13 000 7 000 25 000 5 7 000 3 000 15 000
Financial Manager 6 40 000 32 500 97 500 3
Payroll Administrator 7 13 000 7 000 32 500 2
HUMAN RESOURCES
HR Assistant 6 20 000 5 000 32 500 2
HR Manager 6 33 250 3 000 97 500 4
Trainer 5 25 000 19 000 37 500 1
Training Manager 4 1
MARKETING & SALES
Brand Manager 2 1
CSR/Enquiries Clerk 3 0
Key Accounts Manager 3 5 13 000 5 000 42 500
Marketing Manager 5 42 500 13 000 92 500 3
Marketing Support Staff 5 17 000 9 000 32 500 1
PR/Communications Mgr. 5 37 500 32 500 92 500 2
Sales Manager 2 6 17 000 5 000 57 500
Sales Representative 5 29 000 5 000 42 500 13 9 000 5 000 21 000
Telesales Representative 4 6 3 000 3 000 9 000
IT & SUPPORT
Data Capturer 6 11 000 9 000 13 000 1
Database Administrator 4 1
Infrastructure Manager 4 2
IT Manager 4 3
IT Support 8 20 000 9 000 37 500 2
Network Administrator 4 1
OTHER
Admin/Office Manager 6 42 500 32 500 72 500 2
Branch Manager 2 3
Business Analyst 5 37 500 15 000 47 500 1
Cleaner/Tea Lady 9 5 000 3 000 7 000 0
Clerical Assistant 6 11 000 9 000 15 000 2
Driver 7 7 000 3 000 9 000 4
Executive Secretary / PA 7 19 000 11 000 32 500 2
Procurement Manager 4 2
Receptionist 9 9 000 5 000 17 000 3
Typist 3 1
Primary White Collar Positions
Table. 16 - Industrial/Manufacturing: Temporary Salaries & Commission
Highlights:
• The Industrial/Manufacturing sector pays substantially higher salaries for every temporary job function represented in this table.
This is when compared to the national median salaries for temporary staff. i.e. Bookkeepers are paid 38.8% more and Admin/Office
Managers 30.8% more than the national median.
WHITE COLLAR SURVEY RESULTSSECTION I

Quest Salary Survey & Staffing Trends 2014/15 ©
| 39
TM
Permanent with 0 - 5 years experience Permanent with 5 or more years experience
Job Description n Median Min (10%) Max (90%) n Median Min (10%) Max (90%)
FINANCE
Accounts Clerk 6 10 000 5 000 15 000 4
Bookkeeper 10 15 000 10 000 77 500 7 17 000 9 000 97 500
Bookkeeper: Balance Sheet 1 3
Chartered Accountant 2 6 72 500 21 000 97 500
Credit Controller 3 4
Creditors Clerk 4 3
Debtors Clerk 3 3
Financial Manager 11 32 500 11 000 62 500 12 47 500 25 000 62 500
Payroll Administrator 5 13 000 11 000 19 000 6 21 000 9 000 32 500
HUMAN RESOURCES
HR Assistant 6 11 000 7 000 32 500 6 17 000 9 000 17 000
HR Manager 6 27 750 9 000 37 500 10 35 000 16 000 65 000
Trainer 3 3
Training Manager 0 2
MARKETING & SALES
Brand Manager 1 1
CSR/Enquiries Clerk 2 3
Key Accounts Manager 5 32 500 15 000 57 500 9 52 500 17 000 77 500
Marketing Manager 3 5 32 500 13 000 57 500
Marketing Support Staff 6 11 000 5 000 19 000 4
PR/Communications Mgr. 1 4
Sales Manager 5 27 000 9 000 92 500 13 37 500 11 000 72 500
Sales Representative 9 13 000 3 000 52 500 6 19 000 3 000 67 500
Telesales Representative 2 5 15 000 7 000 37 500
IT & SUPPORT
Data Capturer 4 3
Database Administrator 2 5 13 000 5 000 17 000
Infrastructure Manager 2 4
IT Manager 6 23 000 9 000 32 500 14 35 000 19 000 77 500
IT Support 8 10 000 5 000 17 000 6 14 000 7 000 25 000
Network Administrator 2 3
OTHER
Admin/Office Manager 6 10 000 7 000 21 000 8 14 000 3 000 25 000
Branch Manager 3 6 42 500 13 000 77 500
Business Analyst 5 17 000 9 000 25 000 9 37 500 11 000 62 500
Cleaner/Tea Lady 11 5 000 3 000 5 000 13 5 000 3 000 9 000
Clerical Assistant 7 5 000 3 000 21 000 1
Driver 7 5 000 3 000 9 000 7 7 000 3 000 72 500
Executive Secretary / PA 6 13 000 7 000 72 500 9 21 000 11 000 32 500
Procurement Manager 4 6 35 750 7 000 47 500
Receptionist 12 7 000 5 000 19 000 8 11 000 3 000 19 000
Typist 0 0
1.2.11 Information Technology & Telecommunications (general)
Table. 17 - Information Technology & Telecommunications: Permanent Salaries
WHITE COLLAR SURVEY RESULTSSECTION I

Quest Salary Survey & Staffing Trends 2014/15 ©
| 40
TM
Highlights:
• This sector pays significantly higher salaries than the national median for all the key managers with more than five years experience
in each job group. i.e. Chartered Accountants receive 38% higher salaries and Key Accounts Managers receive 61% higher salaries
than the national median salary.
• After each industry sector permanent salary table we have included a chart which shows the different salary levels of a particular
senior management position across the sectors. Here we highlight the salaries of Admin Managers:
Fig. 18 Industry Sector differences: Admin Manager - Median Salaries
Highlights: Admin Manager
Permanent staff with <5 years experience
• The Industrial & Manufacturing sector is the highest paying, with salaries 86% higher than the national median salary of R12, 667.
This suggests that Admin Managers are rated at a much higher management level in this industry. The rest of the industrial sectors fall
either in-line or slightly below the national median salary level.
Permanent staff with >5 years experience
The Industrial & Manufacturing sector is the highest paying, 46% higher than the national median salary of R20, 292. The Logistics &
Distribution sector also pays above the national median by 13%.
WHITE COLLAR SURVEY RESULTSSECTION I
Cons & EngEduc/Business & Prof Services
FinancialServices
Industrial &Manufacturing
InformationTechnology
Logistics & Distribution
Travel Media & Entertainment
Perm < 5 years R 8 000 R 12 000 R 13 000 R 23 000 R 10 000 R 10 000
Perm > 5 years R 17 000 R 17 000 R 21 000 R 29 750 R 14 000 R 23 000
Temporary R 15 000 R 42 500
R -
R 5 000
R 10 000
R 15 000
R 20 000
R 25 000
R 30 000
R 35 000
R 40 000
R 45 000

Quest Salary Survey & Staffing Trends 2014/15 ©
| 41
TM
Permanent with 0 - 5 years experience Permanent with 5 or more years experience
Job Description n Median Min (10%) Max (90%) n Median Min (10%) Max (90%)
FINANCE
Accounts Clerk 8 9 000 3 000 13 000 4
Bookkeeper 10 17 000 3 000 23 000 12 20 000 15 000 25 000
Bookkeeper: Balance Sheet 8 15 000 3 000 21 000 6 20 000 15 000 32 500
Chartered Accountant 5 42 500 3 000 87 500 4
Credit Controller 10 11 000 6 000 31 750 12 16 000 11 000 25 000
Creditors Clerk 8 11 000 3 000 17 000 11 13 000 9 000 17 000
Debtors Clerk 10 12 000 4 000 14 000 7 13 000 5 000 17 000
Financial Manager 11 29 000 3 000 47 500 16 40 000 19 000 62 500
Payroll Administrator 9 13 000 3 000 97 500 9 15 000 9 000 32 500
HUMAN RESOURCES
HR Assistant 5 13 000 3 000 21 000 4
HR Manager 11 32 500 5 000 37 500 10 40 000 19 000 60 000
Trainer 5 11 000 3 000 17 000 7 19 000 7 000 32 500
Training Manager 5 21 000 3 000 29 000 7 25 000 13 000 62 500
MARKETING & SALES
Brand Manager 3 3
CSR/Enquiries Clerk 3 3
Key Accounts Manager 5 27 000 3 000 37 500 5 32 500 15 000 97 500
Marketing Manager 6 19 000 3 000 29 000 6 42 500 13 000 67 500
Marketing Support Staff 4 4
PR/Communications Mgr. 2 0
Sales Manager 8 26 750 3 000 47 500 8 45 000 21 000 97 500
Sales Representative 6 21 000 3 000 32 500 11 17 000 13 000 67 500
Telesales Representative 3 5 11 000 7 000 13 000
IT & SUPPORT
Data Capturer 4 6 10 000 5 000 13 000
Database Administrator 2 2
Infrastructure Manager 5 25 000 3 000 37 500 4
IT Manager 5 21 000 3 000 52 500 10 27 000 13 000 67 500
IT Support 5 15 000 3 000 19 000 5
Network Administrator 3 4
OTHER
Admin/Office Manager 8 10 000 3 000 32 500 6 23 000 9 000 57 500
Branch Manager 6 30 750 3 000 52 500 11 37 500 19 000 62 500
Business Analyst 4 2
Cleaner/Tea Lady 7 3 000 3 000 9 000 14 5 000 3 000 9 000
Clerical Assistant 5 5 000 3 000 13 000 5 9 000 7 000 17 000
Driver 10 7 000 3 000 13 000 14 7 000 5 000 13 000
Executive Secretary / PA 6 15 000 3 000 32 500 7 15 000 9 000 67 500
Procurement Manager 3 4
Receptionist 8 6 000 3 000 21 000 12 7 000 5 000 11 000
Typist 3 2
1.2.12 Logistics & Distribution (general)
Table. 18 - Logistics & Distribution: Permanent Salaries
WHITE COLLAR SURVEY RESULTSSECTION I
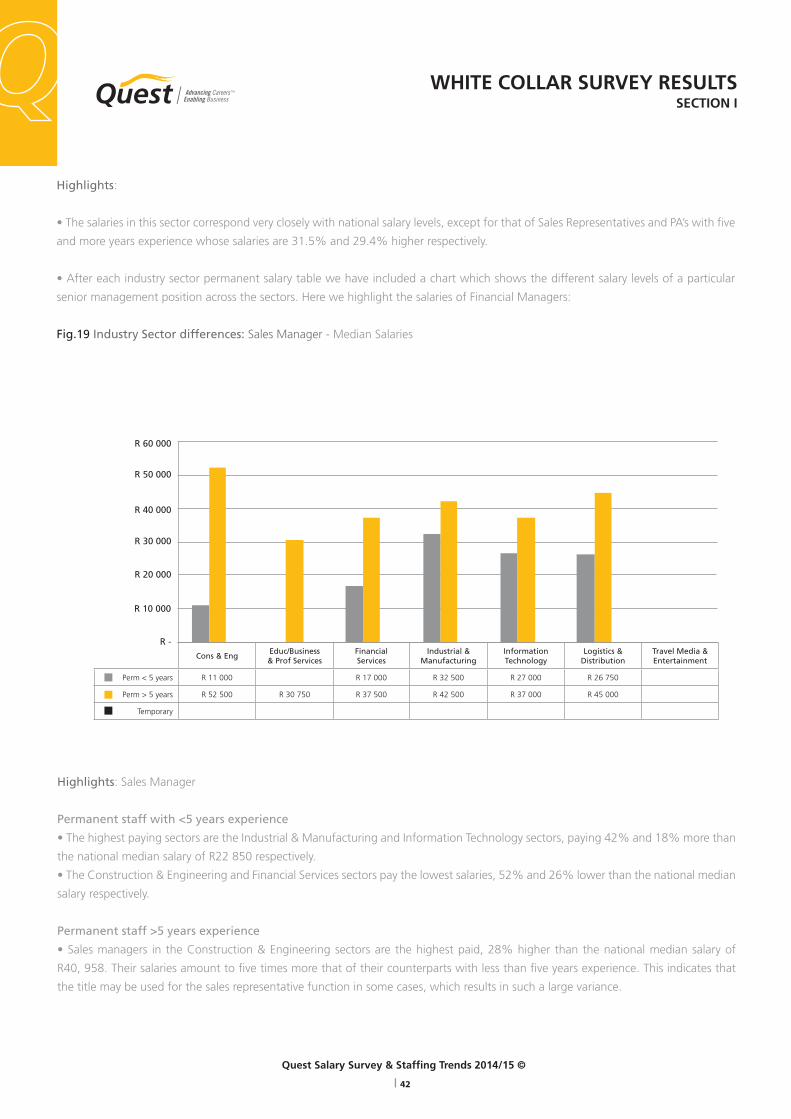
Quest Salary Survey & Staffing Trends 2014/15 ©
| 42
TM
Highlights:
• The salaries in this sector correspond very closely with national salary levels, except for that of Sales Representatives and PA’s with five
and more years experience whose salaries are 31.5% and 29.4% higher respectively.
• After each industry sector permanent salary table we have included a chart which shows the different salary levels of a particular
senior management position across the sectors. Here we highlight the salaries of Financial Managers:
Fig.19 Industry Sector differences: Sales Manager - Median Salaries
Highlights: Sales Manager
Permanent staff with <5 years experience
• The highest paying sectors are the Industrial & Manufacturing and Information Technology sectors, paying 42% and 18% more than
the national median salary of R22 850 respectively.
• The Construction & Engineering and Financial Services sectors pay the lowest salaries, 52% and 26% lower than the national median
salary respectively.
Permanent staff >5 years experience
• Sales managers in the Construction & Engineering sectors are the highest paid, 28% higher than the national median salary of
R40, 958. Their salaries amount to five times more that of their counterparts with less than five years experience. This indicates that
the title may be used for the sales representative function in some cases, which results in such a large variance.
WHITE COLLAR SURVEY RESULTSSECTION I
Cons & EngEduc/Business & Prof Services
FinancialServices
Industrial &Manufacturing
InformationTechnology
Logistics & Distribution
Travel Media & Entertainment
Perm < 5 years R 11 000 R 17 000 R 32 500 R 27 000 R 26 750
Perm > 5 years R 52 500 R 30 750 R 37 500 R 42 500 R 37 000 R 45 000
Temporary
R -
R 10 000
R 20 000
R 30 000
R 40 000
R 50 000
R 60 000

Quest Salary Survey & Staffing Trends 2014/15 ©
| 43
TM
Permanent with 0 - 5 years experience Permanent with 5 or more years experience
Job Description n Median Min (10%) Max (90%) n Median Min (10%) Max (90%)
FINANCE
Accounts Clerk 6 12 000 7 000 17 000 10 15 000 7 000 23 000
Bookkeeper 7 17 000 11 000 27 000 12 21 000 15 000 25 000
Bookkeeper: Balance Sheet 4 4
Chartered Accountant 4 7 42 500 21 000 97 500
Credit Controller 6 15 000 9 000 19 000 7 21 000 13 000 29 000
Creditors Clerk 6 11 000 9 000 17 000 6 16 000 11 000 21 000
Debtors Clerk 7 9 000 7 000 17 000 9 13 000 7 000 25 000
Financial Manager 5 25 000 15 000 37 500 15 37 500 21 000 67 500
Payroll Administrator 5 15 000 5 000 15 000 7 17 000 7 000 29 000
HUMAN RESOURCES
HR Assistant 4 6 18 000 7 000 19 000
HR Manager 6 23 000 17 000 32 500 11 37 500 23 000 42 500
Trainer 5 19 000 5 000 23 000 4
Training Manager 5 19 000 9 000 37 500 4
MARKETING & SALES
Brand Manager 2 2
CSR/Enquiries Clerk 2 3
Key Accounts Manager 7 17 000 13 000 27 000 9 25 000 13 000 67 500
Marketing Manager 5 29 000 11 000 62 500 10 42 500 16 000 72 500
Marketing Support Staff 9 15 000 3 000 19 000 8 16 000 7 000 29 000
PR/Communications Mgr. 5 25 000 7 000 27 000 8 27 000 9 000 32 500
Sales Manager 4 11 29 000 15 000 47 500
Sales Representative 10 9 000 5 000 28 750 14 25 000 11 000 37 500
Telesales Representative 4 3
IT & SUPPORT
Data Capturer 4 5 9 000 7 000 17 000
Database Administrator 2 3
Infrastructure Manager 2 4
IT Manager 4 9 32 500 19 000 52 500
IT Support 5 21 000 5 000 27 000 8 23 000 7 000 29 000
Network Administrator 3 5 23 000 7 000 42 500
OTHER
Admin/Office Manager 4 11 19 000 11 000 32 500
Branch Manager 4 2
Business Analyst 3 4
Cleaner/Tea Lady 12 3 000 3 000 7 000 14 5 000 3 000 9 000
Clerical Assistant 6 10 000 3 000 17 000 3
Driver 9 7 000 3 000 13 000 10 9 000 6 000 19 000
Executive Secretary / PA 4 6 22 000 15 000 29 000
Procurement Manager 4 4
Receptionist 13 7 000 3 000 15 000 11 9 000 7 000 17 000
Typist 2 3
1.2.13 Travel, Media & Entertainment (general)
Table. 19 - Travel, Media & Entertainment: Permanent Positions
WHITE COLLAR SURVEY RESULTSSECTION I
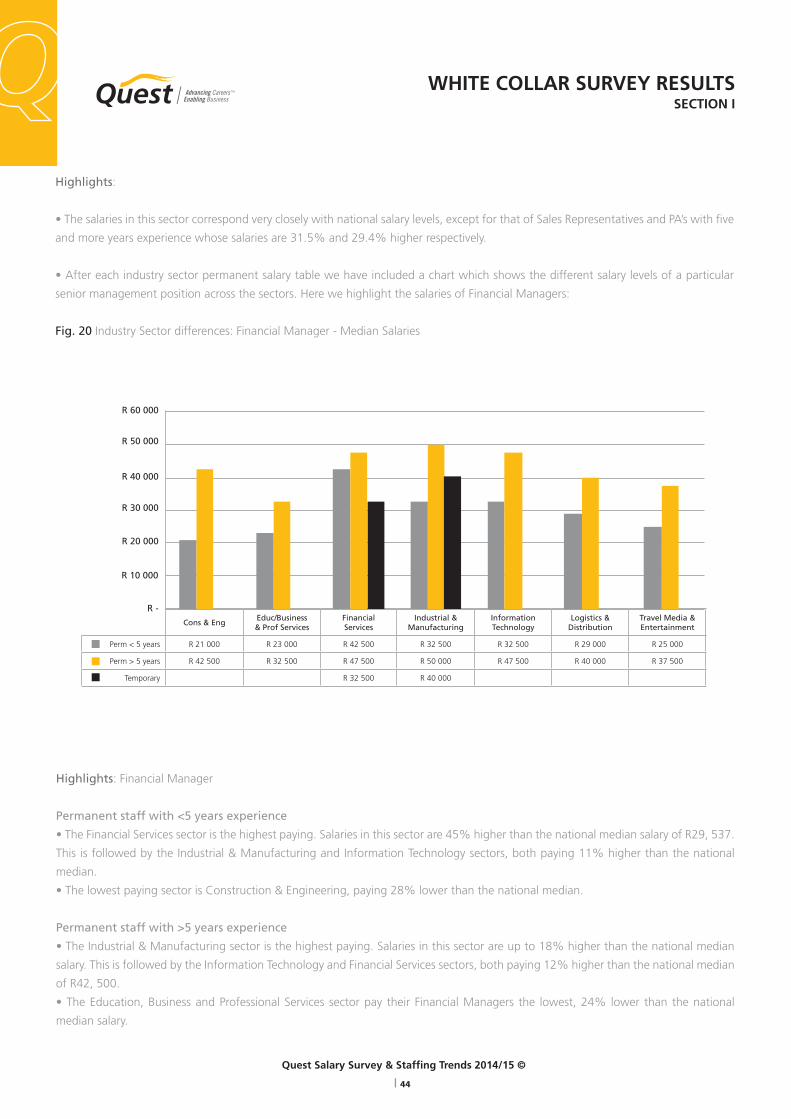
Quest Salary Survey & Staffing Trends 2014/15 ©
| 44
TM
Highlights:
• The salaries in this sector correspond very closely with national salary levels, except for that of Sales Representatives and PA’s with five
and more years experience whose salaries are 31.5% and 29.4% higher respectively.
• After each industry sector permanent salary table we have included a chart which shows the different salary levels of a particular
senior management position across the sectors. Here we highlight the salaries of Financial Managers:
Fig. 20 Industry Sector differences: Financial Manager - Median Salaries
Highlights: Financial Manager
Permanent staff with <5 years experience
• The Financial Services sector is the highest paying. Salaries in this sector are 45% higher than the national median salary of R29, 537.
This is followed by the Industrial & Manufacturing and Information Technology sectors, both paying 11% higher than the national
median.
• The lowest paying sector is Construction & Engineering, paying 28% lower than the national median.
Permanent staff with >5 years experience
• The Industrial & Manufacturing sector is the highest paying. Salaries in this sector are up to 18% higher than the national median
salary. This is followed by the Information Technology and Financial Services sectors, both paying 12% higher than the national median
of R42, 500.
• The Education, Business and Professional Services sector pay their Financial Managers the lowest, 24% lower than the national
median salary.
WHITE COLLAR SURVEY RESULTSSECTION I
Cons & EngEduc/Business & Prof Services
FinancialServices
Industrial &Manufacturing
InformationTechnology
Logistics & Distribution
Travel Media & Entertainment
Perm < 5 years R 21 000 R 23 000 R 42 500 R 32 500 R 32 500 R 29 000 R 25 000
Perm > 5 years R 42 500 R 32 500 R 47 500 R 50 000 R 47 500 R 40 000 R 37 500
Temporary R 32 500 R 40 000
R -
R 10 000
R 20 000
R 30 000
R 40 000
R 50 000
R 60 000

Quest Salary Survey & Staffing Trends 2014/15 ©
| 45
TM
The following section (1.3.1 to 1.3.5) presents and analyses the minimum, maximum and median salaries of key positions per
experience level (</> 5 years) and by perm vs. temp within a specific industry.
1.3 Industry-Specific White Collar Positions1.3.1 Financial Services
Table. 20 - Financial Services: Permanent Positions
Permanent with 0 - 5 years experience Permanent with 5 or more years experience
Job Description n Median Min (10%) Max (90%) n Median Min (10%) Max (90%)
ATM Consultant 6 11 000 3 000 17 000 6 13 000 9 000 19 000
Customer Consultant 6 11 000 7 000 17 000 6 16 000 9 000 19 000
Customer Liaison Officer 5 9 000 9 000 15 000 9 15 000 7 000 52 500
Foreign Exchange Clerk 5 11 000 11 000 13 000 6 14 000 9 000 17 000
Home Loans Consultant 5 13 000 9 000 17 000 5 17 000 7 000 21 000
Runner / Floor Walker 5 11 000 9 000 13 000 5 13 000 7 000 17 000
Service Centre Assistant 5 9 000 7 000 13 000 4
Service Consultant 5 11 000 9 000 13 000 6 15 000 7 000 29 000
Teller - Bulk Cash 5 9 000 9 000 11 000 6 12 000 7 000 13 000
Teller - Frontline 5 11 000 9 000 11 000 5 13 000 7 000 13 000
Teller - Trainee 4 5 9 000 5 000 13 000
Temporary or contract staff via recruiter
Job Description n Median Min (10%) Max (90%)
ATM Consultant 10 6 000 5 000 13 000
Customer Consultant 13 7 000 5 000 13 000
Customer Liaison Officer 12 7 000 7 000 11 000
Foreign Exchange Clerk 8 9 000 7 000 17 000
Home Loans Consultant 4
Runner / Floor Walker 5 7 000 3 000 15 000
Service Centre Assistant 11 7 000 7 000 13 000
Service Consultant 11 7 000 7 000 11 000
Teller - Bulk Cash 13 5 000 3 000 11 000
Teller - Frontline 13 5 000 5 000 11 000
Teller - Trainee 7 5 000 3 000 9 000
Table. 21 - Financial Services: Temporary Positions
Highlights:
• In Fig. 21 (below), the differences in salary levels between
permanent and temporary staff in the Financial Services
sector can clearly be seen with temporary staff paid 37% less
than their permanent counterparts with the job titles in the
table above.
Fig. 21 Within Industry differences: Financial Services
WHITE COLLAR SURVEY RESULTSSECTION I
R 0
R 20 000 000
R 40 000 000
R 60 000 000
R 80 000 00037%
R 100 000 000
R 120 000 000
Perm < 5 years Perm > 5 years Temporary
Total Mean salaries R84 000,00 R 111 000,00 R 53 000,00
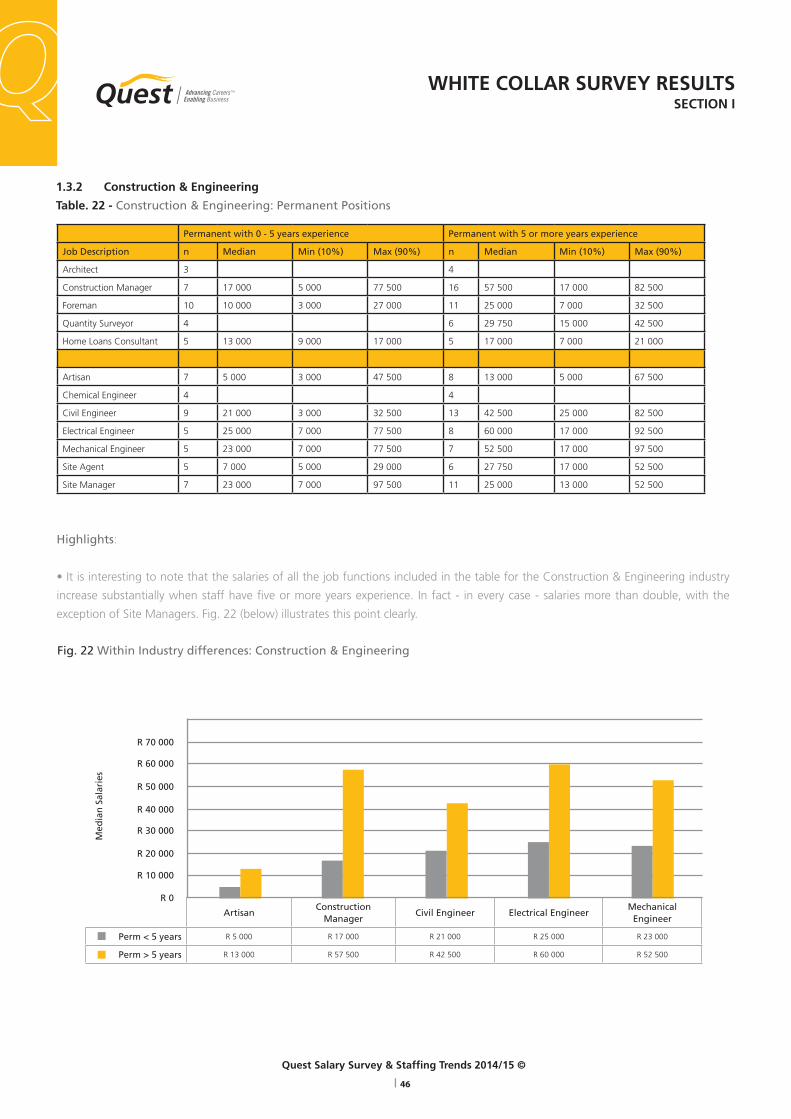
Quest Salary Survey & Staffing Trends 2014/15 ©
| 46
TM
1.3.2 Construction & Engineering
Table. 22 - Construction & Engineering: Permanent Positions
Permanent with 0 - 5 years experience Permanent with 5 or more years experience
Job Description n Median Min (10%) Max (90%) n Median Min (10%) Max (90%)
Architect 3 4
Construction Manager 7 17 000 5 000 77 500 16 57 500 17 000 82 500
Foreman 10 10 000 3 000 27 000 11 25 000 7 000 32 500
Quantity Surveyor 4 6 29 750 15 000 42 500
Home Loans Consultant 5 13 000 9 000 17 000 5 17 000 7 000 21 000
Artisan 7 5 000 3 000 47 500 8 13 000 5 000 67 500
Chemical Engineer 4 4
Civil Engineer 9 21 000 3 000 32 500 13 42 500 25 000 82 500
Electrical Engineer 5 25 000 7 000 77 500 8 60 000 17 000 92 500
Mechanical Engineer 5 23 000 7 000 77 500 7 52 500 17 000 97 500
Site Agent 5 7 000 5 000 29 000 6 27 750 17 000 52 500
Site Manager 7 23 000 7 000 97 500 11 25 000 13 000 52 500
Highlights:
• It is interesting to note that the salaries of all the job functions included in the table for the Construction & Engineering industry
increase substantially when staff have five or more years experience. In fact - in every case - salaries more than double, with the
exception of Site Managers. Fig. 22 (below) illustrates this point clearly.
Fig. 22 Within Industry differences: Construction & Engineering
WHITE COLLAR SURVEY RESULTSSECTION I
R 0
R 10 000
R 20 000
R 30 000
R 40 000
R 50 000
R 60 000
R 70 000
Med
ian
Sal
arie
s
ArtisanConstruction
ManagerCivil Engineer Electrical Engineer
MechanicalEngineer
Perm < 5 years R 5 000 R 17 000 R 21 000 R 25 000 R 23 000
Perm > 5 years R 13 000 R 57 500 R 42 500 R 60 000 R 52 500

Quest Salary Survey & Staffing Trends 2014/15 ©
| 47
TM
1.3.3 Industrial/Manufacturing
Table. 23 - Industrial/Manufacturing: Permanent Positions
Permanent with 0 - 5 years experience Permanent with 5 or more years experience
Job Description n Median Min (10%) Max (90%) n Median Min (10%) Max (90%)
Despatch Manager 9 13 000 7 000 57 500 29 17 000 7 000 32 500
Industrial Engineer 10 25 000 12 000 47 500 11 37 500 17 000 47 500
Lab Assistant 11 15 000 9 000 19 000 17 11 000 7 000 25 000
Materials Manager 8 25 000 5 000 87 500 12 21 000 7 000 32 500
Packer 22 5 000 3 000 7 000 23 5 000 3 000 9 000
Product Tester 5 11 000 9 000 29 000 6 11 000 7 000 27 000
Quality Assurance Asst 11 13 000 7 000 25 000 26 12 000 7 000 25 000
Quality Assurance Manager 11 25 000 17 000 37 500 29 32 500 13 000 57 500
Temporary or contract staff via recruiter
Job Description n Median Min (10%) Max (90%)
Despatch Manager 1
Industrial Engineer 5 15 000 5 000 32 500
Lab Assistant 5 11 000 7 000 21 000
Materials Manager 2
Packer 9 5 000 3 000 29 000
Product Tester 3
Quality Assurance Assistant 3
Quality Assurance Manager 5 27 000 13 000 32 500
Table. 24 - Financial Services: Temporary Positions
Permanent with 0 - 5 years experience Permanent with 5 or more years experience
Job Description n Median Min (10%) Max (90%) n Median Min (10%) Max (90%)
Despatch Manager 9 13 000 7 000 57 500 29 17 000 7 000 32 500
Industrial Engineer 10 25 000 12 000 47 500 11 37 500 17 000 47 500
Lab Assistant 11 15 000 9 000 19 000 17 11 000 7 000 25 000
Materials Manager 8 25 000 5 000 87 500 12 21 000 7 000 32 500
1.3.4 Logistics & Distribution
Table. 25 - Logistics & Distribution: Permanent Positions
Permanent with 0 - 5 years experience Permanent with 5 or more years experience
Job Description n Median Min (10%) Max (90%) n Median Min (10%) Max (90%)
Analyst - Junior 6 18 000 13 000 42 500 6 18 000 13 000 62 500
Analyst - Senior 4 8 52 500 19 000 77 500
Telecoms Manager 6 14 000 11 000 23 000 5 17 000 3 000 29 000
Web Developer 6 13 000 9 000 92 500 8 25 000 7 000 97 500
1.3.5 Information Technology & Telecommunications
Table. 26 - Information Technology & Telecommunications: Permanent Positions
WHITE COLLAR SURVEY RESULTSSECTION I
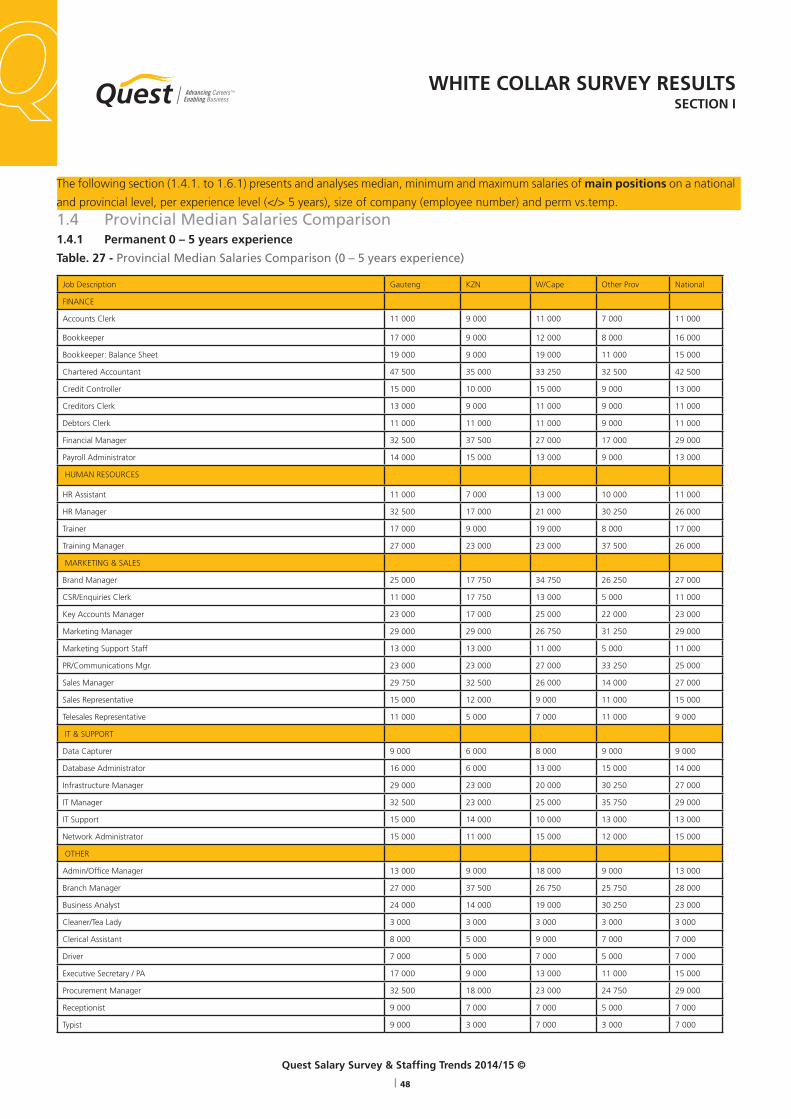
Quest Salary Survey & Staffing Trends 2014/15 ©
| 48
TM
Job Description Gauteng KZN W/Cape Other Prov National
FINANCE
Accounts Clerk 11 000 9 000 11 000 7 000 11 000
Bookkeeper 17 000 9 000 12 000 8 000 16 000
Bookkeeper: Balance Sheet 19 000 9 000 19 000 11 000 15 000
Chartered Accountant 47 500 35 000 33 250 32 500 42 500
Credit Controller 15 000 10 000 15 000 9 000 13 000
Creditors Clerk 13 000 9 000 11 000 9 000 11 000
Debtors Clerk 11 000 11 000 11 000 9 000 11 000
Financial Manager 32 500 37 500 27 000 17 000 29 000
Payroll Administrator 14 000 15 000 13 000 9 000 13 000
HUMAN RESOURCES
HR Assistant 11 000 7 000 13 000 10 000 11 000
HR Manager 32 500 17 000 21 000 30 250 26 000
Trainer 17 000 9 000 19 000 8 000 17 000
Training Manager 27 000 23 000 23 000 37 500 26 000
MARKETING & SALES
Brand Manager 25 000 17 750 34 750 26 250 27 000
CSR/Enquiries Clerk 11 000 17 750 13 000 5 000 11 000
Key Accounts Manager 23 000 17 000 25 000 22 000 23 000
Marketing Manager 29 000 29 000 26 750 31 250 29 000
Marketing Support Staff 13 000 13 000 11 000 5 000 11 000
PR/Communications Mgr. 23 000 23 000 27 000 33 250 25 000
Sales Manager 29 750 32 500 26 000 14 000 27 000
Sales Representative 15 000 12 000 9 000 11 000 15 000
Telesales Representative 11 000 5 000 7 000 11 000 9 000
IT & SUPPORT
Data Capturer 9 000 6 000 8 000 9 000 9 000
Database Administrator 16 000 6 000 13 000 15 000 14 000
Infrastructure Manager 29 000 23 000 20 000 30 250 27 000
IT Manager 32 500 23 000 25 000 35 750 29 000
IT Support 15 000 14 000 10 000 13 000 13 000
Network Administrator 15 000 11 000 15 000 12 000 15 000
OTHER
Admin/Office Manager 13 000 9 000 18 000 9 000 13 000
Branch Manager 27 000 37 500 26 750 25 750 28 000
Business Analyst 24 000 14 000 19 000 30 250 23 000
Cleaner/Tea Lady 3 000 3 000 3 000 3 000 3 000
Clerical Assistant 8 000 5 000 9 000 7 000 7 000
Driver 7 000 5 000 7 000 5 000 7 000
Executive Secretary / PA 17 000 9 000 13 000 11 000 15 000
Procurement Manager 32 500 18 000 23 000 24 750 29 000
Receptionist 9 000 7 000 7 000 5 000 7 000
Typist 9 000 3 000 7 000 3 000 7 000
The following section (1.4.1. to 1.6.1) presents and analyses median, minimum and maximum salaries of main positions on a national
and provincial level, per experience level (</> 5 years), size of company (employee number) and perm vs.temp.
1.4 Provincial Median Salaries Comparison1.4.1 Permanent 0 – 5 years experience
Table. 27 - Provincial Median Salaries Comparison (0 – 5 years experience)
WHITE COLLAR SURVEY RESULTSSECTION I
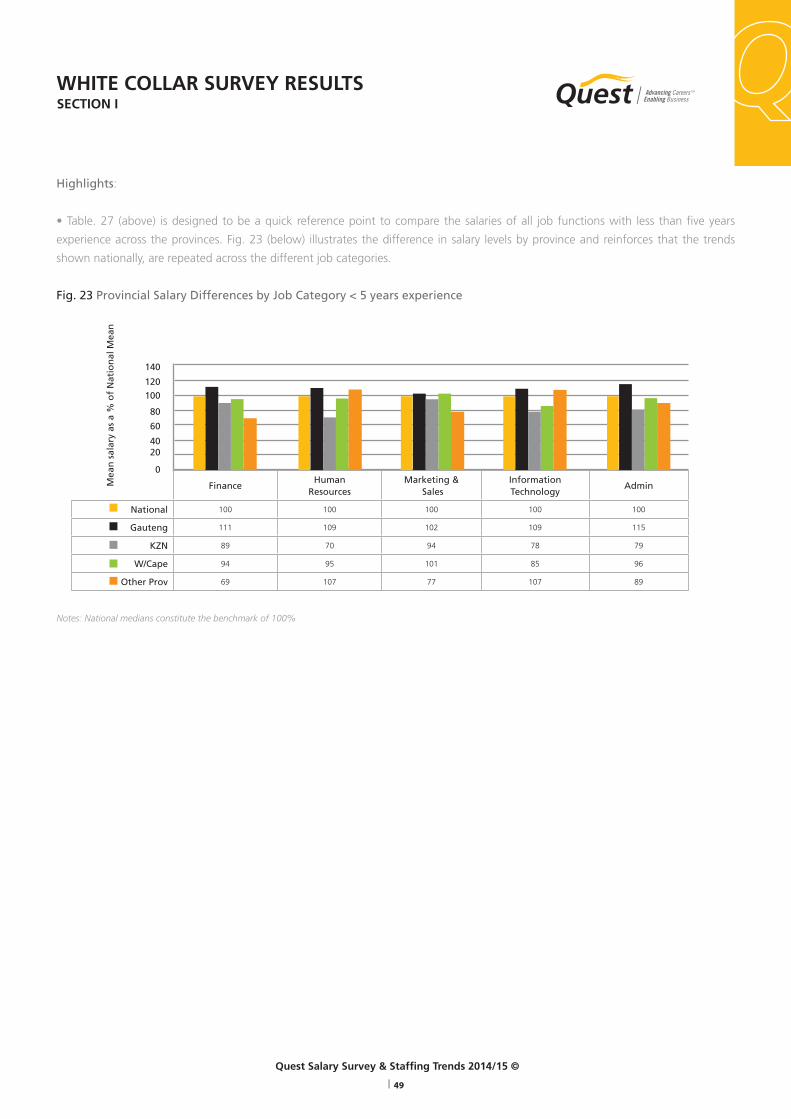
Quest Salary Survey & Staffing Trends 2014/15 ©
| 49
TM
Highlights:
• Table. 27 (above) is designed to be a quick reference point to compare the salaries of all job functions with less than five years
experience across the provinces. Fig. 23 (below) illustrates the difference in salary levels by province and reinforces that the trends
shown nationally, are repeated across the different job categories.
Fig. 23 Provincial Salary Differences by Job Category < 5 years experience
Notes: National medians constitute the benchmark of 100%
WHITE COLLAR SURVEY RESULTSSECTION I
0
2040
60
80
100
120
140
Mea
n s
alar
y as
a %
of
Nat
ion
al M
ean
FinanceHuman
ResourcesMarketing &
SalesInformationTechnology
Admin
National 100 100 100 100 100
Gauteng 111 109 102 109 115
KZN 89 70 94 78 79
W/Cape 94 95 101 85 96
Other Prov 69 107 77 107 89

Quest Salary Survey & Staffing Trends 2014/15 ©
| 50
TM
Job Description Gauteng KZN W/Cape Other Prov National
FINANCE
Accounts Clerk 13 000 9 000 13 000 10 000 13 000
Bookkeeper 22 000 17 000 17 000 18 000 19 000
Bookkeeper: Balance Sheet 23 000 12 000 20 000 24 750 20 000
Chartered Accountant 60 000 37 500 45 000 45 000 52 500
Credit Controller 19 000 11 000 19 000 13 000 17 000
Creditors Clerk 15 000 11 000 11 000 11 000 13 000
Debtors Clerk 15 000 11 000 13 000 11 000 13 000
Financial Manager 47 500 37 500 42 500 37 500 42 500
Payroll Administrator 19 000 15 000 17 000 14 000 17 000
HUMAN RESOURCES
HR Assistant 17 000 14 000 15 000 11 000 17 000
HR Manager 37 500 27 000 28 000 42 500 32 500
Trainer 21 000 14 000 19 000 32 500 21 000
Training Manager 32 500 25 000 32 500 37 500 32 500
MARKETING & SALES
Brand Manager 32 500 21 250 35 750 38 500 37 500
CSR/Enquiries Clerk 13 000 9 000 19 000 9 000 12 000
Key Accounts Manager 32 500 37 500 32 500 35 500 32 500
Marketing Manager 42 500 28 750 37 500 45 000 37 500
Marketing Support Staff 15 000 11 000 15 000 25 000 15 000
PR/Communications Mgr. 32 500 25 000 29 750 40 000 32 500
Sales Manager 42 500 37 500 42 500 35 000 42 500
Sales Representative 22 000 13 000 19 000 25 000 19 000
Telesales Representative 13 000 9 000 12 000 11 000 13 000
IT & SUPPORT
Data Capturer 11 000 8 000 7 000 12 000 9 000
Database Administrator 17 000 7 000 19 000 20 000 17 000
Infrastructure Manager 37 500 27 000 42 500 42 500 37 500
IT Manager 37 500 29 750 32 500 32 500 32 500
IT Support 19 000 17 000 17 000 23 000 17 000
Network Administrator 18 000 19 000 14 000 19 000 19 000
OTHER
Admin/Office Manager 21 000 14 000 17 000 18 000 19 000
Branch Manager 35 000 42 500 32 500 45 000 35 000
Business Analyst 32 500 13 000 32 500 25 000 32 500
Cleaner/Tea Lady 5 000 5 000 5 000 3 000 5 000
Clerical Assistant 11 000 9 000 10 000 12 000 11 000
Driver 7 000 7 000 7 000 7 000 7 000
Executive Secretary / PA 21 000 13 000 17 000 14 000 17 000
Procurement Manager 37 500 26 000 26 000 40 000 32 500
Receptionist 9 000 8 000 9 000 10 000 9 000
Typist 11 000 7 000 9 000 9 000 10 000
1.4.2 Permanent 5 or more years experience
Table. 28 - Provincial Median Salaries Comparison
WHITE COLLAR SURVEY RESULTSSECTION I

Quest Salary Survey & Staffing Trends 2014/15 ©
| 51
TM
Highlights:
• Table. 28 (above) is designed to be a quick reference point to compare the salaries of all job functions with five or more years
experience across the provinces. Fig. 24 (below) illustrates the difference in salary levels by province and reinforces that the trends
shown nationally are repeated across the different job categories.
Fig. 24 Provincial Salary Differences by Job category > 5 years experience
Notes: National medians constitute the benchmark of 100%
1.4.3 Analysis of Median Salary by years of experience
An analysis of the broad job categories of Finance, Human
Resources, Marketing & Sales, Information Technology and
Administration showed interesting variances across the provinces
as well as by level of experience.
• Finance
<5 years experience: In Gauteng, people employed in this
category earn 10% more than the national median salary for this
job category. In contrast, those employed in the Other Provinces
(Mpumalanga, Limpopo, North West, Free State, Northern Cape
& Eastern Cape), earn 31% less - a considerable difference.
>5 years experience: In Gauteng, salaries are 13% higher than
the national median salary for this job category while those in
KwaZulu-Natal are the lowest at 22% less than the median salary
level.
• Human resources
<5 years experience: In Gauteng, salaries are 9% higher than
the national median salary for this job category while salaries in
the Other Provinces are 7% higher than the national median.
KwaZulu-Natal is again the lowest paying province with salaries
30% lower than the national median.
>5 years experience: The Other Provinces are the highest paying
in this category with salaries 20% higher than the national median
salary level for the job category. This is followed by Gauteng,
which is 5% higher. KwaZulu-Natal pays 22% lower than the
national median for this job category.
• Marketing & Sales
<5 years experience: Salaries paid across all the provinces are
more or less in line with the national median salaries for the job
category with Gauteng and the Western Cape slightly higher at
2% and 1% more than the national median level respectively. The
WHITE COLLAR SURVEY RESULTSSECTION I
0
2040
60
80
100
120
140
Mea
n s
alar
y as
a %
of
Nat
ion
al M
ean
FinanceHuman
ResourcesMarketing &
SalesInformationTechnology
Admin
National 100 100 100 100 100
Gauteng 113 105 102 106 107
KZN 78 78 80 82 81
W/Cape 95 92 101 100 93
Other Prov 89 120 109 133 103
Quest Salary Survey & Staffing Trends 2014/15 ©
| 52
TM
Other Provinces are the least paying, 23% less than the national
median level.
>5 years experience: The Other Provinces are the highest
paying, 9% higher than the national median salary level for this
job category. This is followed by Gauteng at 2% higher. The
lowest paying province is KwaZulu-Natal with salaries 20% lower
than the national median.
• Information Technology
<5 years experience: In this job category Gauteng and the
Other Provinces are the highest paying, 9% and 7% higher than
the national median for the job category respectively. The lowest
paying province is KwaZulu-Natal at 22% less than the national
median.
>5 years experience: For the more experienced IT professionals,
salaries are much higher in the Other Provinces, 13% more than
the national median for the job category. Gauteng comes in
second at 6% higher than the national median level. The lowest
paying province for this job category is KwaZulu-Natal with
salaries 18% lower than the national median.
• Administration
<5 years experience: The highest paying province for
administrative positions, for those with less than five years
experience, is Gauteng where salaries are 15% higher than
the national median level for this job category. The rest of the
provinces pay below the national median salary level, with the
lowest paying province, KwaZulu-Natal, paying at less than 21%
of the national median salary level.
>5 years experience: In the greater than five years experience
category Gauteng maintains its position as top remunerator,
paying 7% higher than the national median for the job category,
though this is a 50% drop from the level of those with less than
five years experience. The Other Provinces pay 3% more than the
national median salary level in this category.
WHITE COLLAR SURVEY RESULTSSECTION I

Quest Salary Survey & Staffing Trends 2014/15 ©
| 53
TM
1.5 Size of company median salaries comparison (permanent)1.5.1 1 to 50 employees (National)
Table. 29 - Permanent Salaries in Companies with 1 to 50 employees
1 - 50 Employees Permanent with 0 - 5 years experience Permanent with 5 or more years experience
Job Description n Median Min (10%) Max (90%) n Median Min (10%) Max (90%)
FINANCE
Accounts Clerk 35 9 000 3 000 17 000 36 11 000 5 000 19 000
Bookkeeper 55 15 000 5 000 27 000 64 19 000 13 000 32 500
Bookkeeper: Balance Sheet 20 13 000 4 000 26 000 28 19 000 11 000 32 500
Chartered Accountant 21 37 500 15 000 67 500 31 52 500 21 000 97 500
Credit Controller 21 11 000 3 000 21 000 38 14 000 7 000 29 000
Creditors Clerk 24 11 000 3 000 15 000 27 13 000 7 000 19 000
Debtors Clerk 20 11 000 3 000 17 000 35 11 000 5 000 19 000
Financial Manager 49 25 000 3 000 52 500 105 37 500 17 000 67 500
Payroll Administrator 28 11 000 3 000 21 000 36 13 000 7 000 19 000
HUMAN RESOURCES
HR Assistant 23 9 000 3 000 23 000 27 15 000 7 000 21 000
HR Manager 33 19 000 5 000 37 500 56 27 000 15 000 47 500
Trainer 21 11 000 3 000 37 500 18 18 000 7 000 47 500
Training Manager 18 19 000 3 000 42 500 24 26 000 13 000 52 500
MARKETING & SALES
Brand Manager 9 15 000 3 000 52 500 11 42 500 9 000 67 500
CSR/Enquiries Clerk 9 7 000 3 000 29 000 14 9 000 5 000 13 000
Key Accounts Manager 19 17 000 3 000 57 500 28 30 750 15 000 67 500
Marketing Manager 25 21 000 5 000 62 500 43 37 500 15 000 67 500
Marketing Support Staff 24 7 000 3 000 19 000 22 15 000 7 000 21 000
PR/Communications Mgr. 13 17 000 3 000 37 500 11 25 000 9 000 52 500
Sales Manager 28 22 000 3 000 57 500 61 37 500 15 000 62 500
Sales Representative 47 15 000 5 000 29 000 63 19 000 9 000 32 500
Telesales Representative 14 7 000 3 000 19 000 21 13 000 5 000 25 000
IT & SUPPORT
Data Capturer 13 5 000 3 000 9 000 19 7 000 5 000 29 000
Database Administrator 8 7 000 3 000 21 000 12 15 000 5 000 23 000
Infrastructure Manager 7 21 000 3 000 37 500 9 29 000 5 000 92 500
IT Manager 15 23 000 3 000 32 500 35 32 500 17 000 62 500
IT Support 22 9 000 5 000 17 000 17 15 000 7 000 25 000
Network Administrator 11 11 000 3 000 21 000 9 13 000 5 000 42 500
OTHER
Admin/Office Manager 48 9 000 5 000 25 000 59 17 000 7 000 32 500
Branch Manager 21 21 000 5 000 47 500 28 32 500 11 000 57 500
Business Analyst 13 15 000 3 000 52 500 15 32 500 11 000 57 500
Cleaner/Tea Lady 66 3 000 3 000 5 000 89 5 000 3 000 7 000
Clerical Assistant 32 6 000 3 000 11 000 26 11 000 5 000 17 000
Driver 42 5 000 3 000 9 000 53 7 000 5 000 13 000
Executive Secretary / PA 31 11 000 5 000 27 000 48 17 000 9 000 25 000
Procurement Manager 16 16 000 3 000 42 500 29 23 000 11 000 57 500
Receptionist 72 7 000 3 000 13 000 73 9 000 5 000 17 000
Typist 9 3 000 3 000 17 000 6 7 000 5 000 9 000
WHITE COLLAR SURVEY RESULTSSECTION I

Quest Salary Survey & Staffing Trends 2014/15 ©
| 54
TM
Highlights:
Fig. 25 (below) compares the salaries of 10 low to medium level job functions across the four company size sectors – referring to
permanent staff with less than five years experience. These particular job functions all received high levels of response in the survey
and therefore serve as good examples.
• There is a strong trend that shows up quite clearly, that larger companies pay significantly more for this level of staff, particularly
companies with 500 or more employees. An example in this regard are HR Assistants, who are paid 88% more than their counterparts
in companies with 100 or less employees.
Fig. 25 Comparison of the salaries of 10 job functions with high response levels across the four company size segments - Permanent
staff with less than 5 years experience
WHITE COLLAR SURVEY RESULTSSECTION I
Admin / Office Manager
Bookeeper
Creditors Clerk
Driver
Executive Secretary / PA
HR Assistant
IT Support
Marketing Support Staff
Payroll Administrator
R - R 5 000 R 10 000 R 15 000 R 20 000 R 25 000 R 30 000
Sales Representative
500+
100 - 500
50 - 100
1 - 50
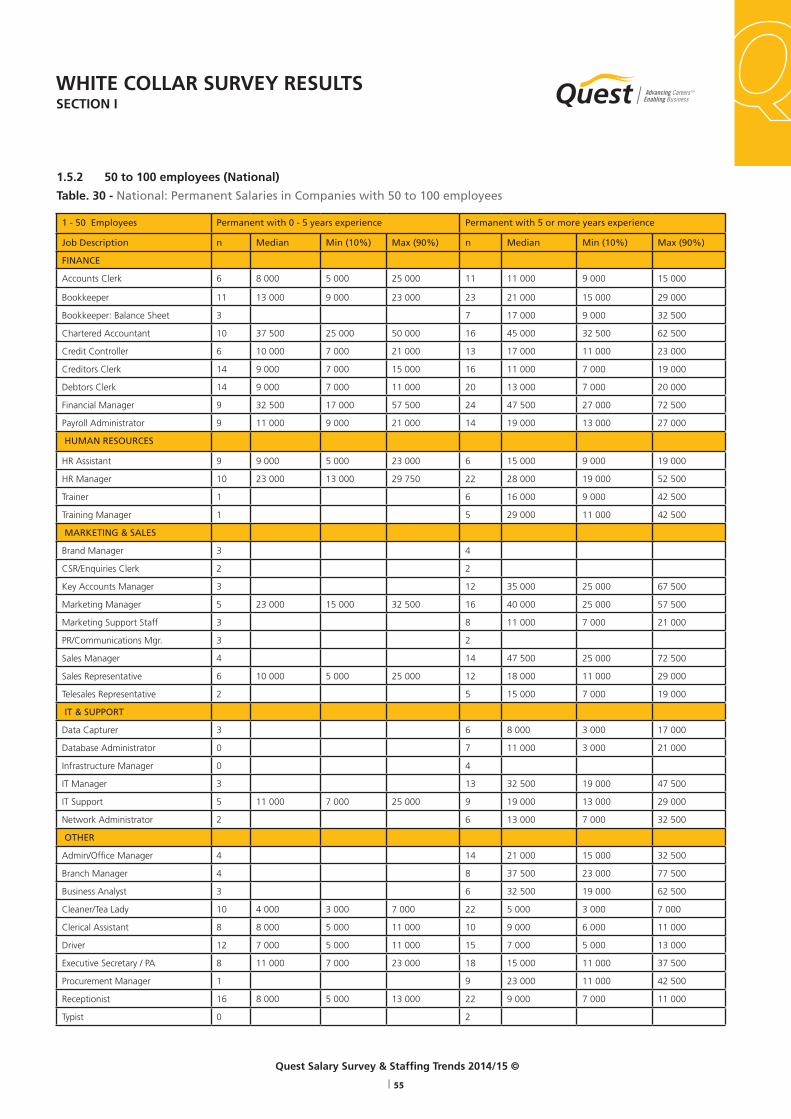
Quest Salary Survey & Staffing Trends 2014/15 ©
| 55
TM
1.5.2 50 to 100 employees (National)
Table. 30 - National: Permanent Salaries in Companies with 50 to 100 employees
1 - 50 Employees Permanent with 0 - 5 years experience Permanent with 5 or more years experience
Job Description n Median Min (10%) Max (90%) n Median Min (10%) Max (90%)
FINANCE
Accounts Clerk 6 8 000 5 000 25 000 11 11 000 9 000 15 000
Bookkeeper 11 13 000 9 000 23 000 23 21 000 15 000 29 000
Bookkeeper: Balance Sheet 3 7 17 000 9 000 32 500
Chartered Accountant 10 37 500 25 000 50 000 16 45 000 32 500 62 500
Credit Controller 6 10 000 7 000 21 000 13 17 000 11 000 23 000
Creditors Clerk 14 9 000 7 000 15 000 16 11 000 7 000 19 000
Debtors Clerk 14 9 000 7 000 11 000 20 13 000 7 000 20 000
Financial Manager 9 32 500 17 000 57 500 24 47 500 27 000 72 500
Payroll Administrator 9 11 000 9 000 21 000 14 19 000 13 000 27 000
HUMAN RESOURCES
HR Assistant 9 9 000 5 000 23 000 6 15 000 9 000 19 000
HR Manager 10 23 000 13 000 29 750 22 28 000 19 000 52 500
Trainer 1 6 16 000 9 000 42 500
Training Manager 1 5 29 000 11 000 42 500
MARKETING & SALES
Brand Manager 3 4
CSR/Enquiries Clerk 2 2
Key Accounts Manager 3 12 35 000 25 000 67 500
Marketing Manager 5 23 000 15 000 32 500 16 40 000 25 000 57 500
Marketing Support Staff 3 8 11 000 7 000 21 000
PR/Communications Mgr. 3 2
Sales Manager 4 14 47 500 25 000 72 500
Sales Representative 6 10 000 5 000 25 000 12 18 000 11 000 29 000
Telesales Representative 2 5 15 000 7 000 19 000
IT & SUPPORT
Data Capturer 3 6 8 000 3 000 17 000
Database Administrator 0 7 11 000 3 000 21 000
Infrastructure Manager 0 4
IT Manager 3 13 32 500 19 000 47 500
IT Support 5 11 000 7 000 25 000 9 19 000 13 000 29 000
Network Administrator 2 6 13 000 7 000 32 500
OTHER
Admin/Office Manager 4 14 21 000 15 000 32 500
Branch Manager 4 8 37 500 23 000 77 500
Business Analyst 3 6 32 500 19 000 62 500
Cleaner/Tea Lady 10 4 000 3 000 7 000 22 5 000 3 000 7 000
Clerical Assistant 8 8 000 5 000 11 000 10 9 000 6 000 11 000
Driver 12 7 000 5 000 11 000 15 7 000 5 000 13 000
Executive Secretary / PA 8 11 000 7 000 23 000 18 15 000 11 000 37 500
Procurement Manager 1 9 23 000 11 000 42 500
Receptionist 16 8 000 5 000 13 000 22 9 000 7 000 11 000
Typist 0 2
WHITE COLLAR SURVEY RESULTSSECTION I

Quest Salary Survey & Staffing Trends 2014/15 ©
| 56
TM
Highlights:
Fig. 26 (below) compares the salaries of 10 low to medium level job functions across the four company size sectors, this time comparing
the salaries of permanent staff with more than five years experience.
• The differential between what very large companies pay versus what smaller companies pay is less marked with staff that have more
experience. However, there are still some high variances – i.e. Executive Secretaries/PA’s in companies with 500 or more employees are
paid 47% more than their counterparts in companies with 100 or less employees.
Fig. 26 Comparison of the salaries of 10 job functions with high response levels across the four company size segments -
Permanent staff with more than 5 years experience
Notes: National medians constitute the benchmark of 100%
WHITE COLLAR SURVEY RESULTSSECTION I
Admin / Office Manager
Bookeeper
Creditors Clerk
Driver
Executive Secretary / PA
HR Assistant
IT Support
Marketing Support Staff
Payroll Administrator
R - R 5 000 R 10 000 R 15 000 R 20 000 R 25 000 R 30 000
Sales Representative
500+
100 - 500
50 - 100
1 - 50
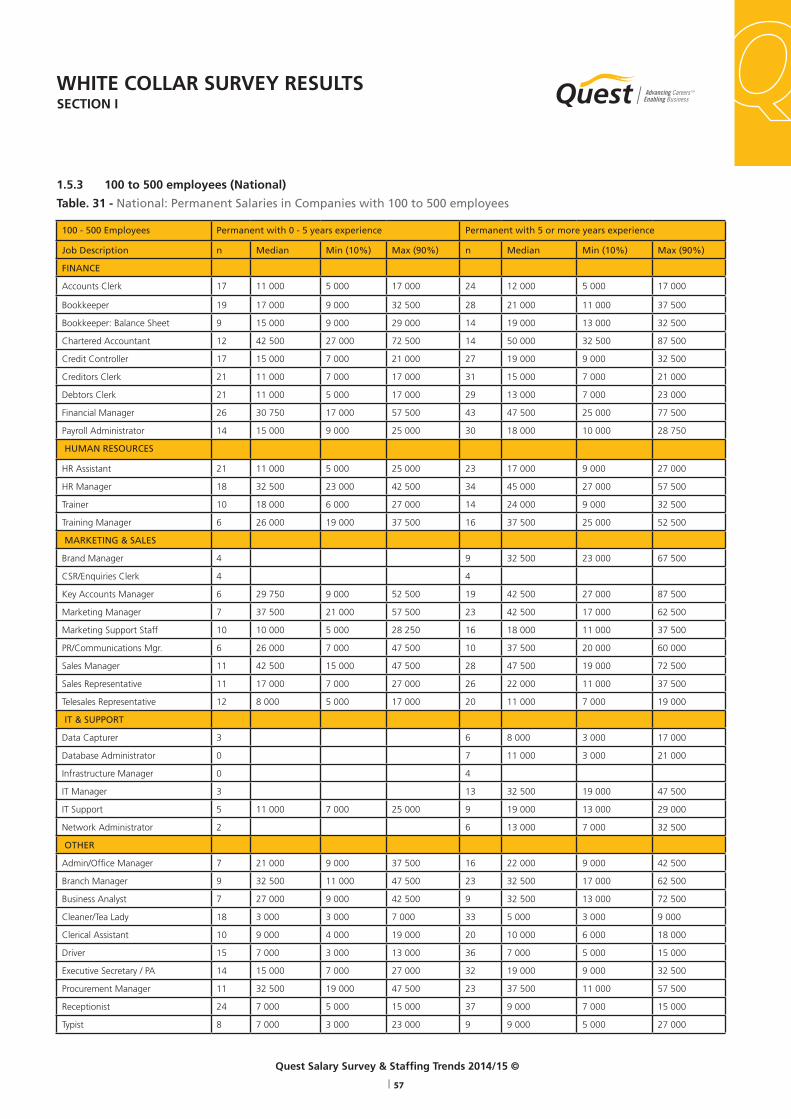
Quest Salary Survey & Staffing Trends 2014/15 ©
| 57
TM
1.5.3 100 to 500 employees (National)
Table. 31 - National: Permanent Salaries in Companies with 100 to 500 employees
100 - 500 Employees Permanent with 0 - 5 years experience Permanent with 5 or more years experience
Job Description n Median Min (10%) Max (90%) n Median Min (10%) Max (90%)
FINANCE
Accounts Clerk 17 11 000 5 000 17 000 24 12 000 5 000 17 000
Bookkeeper 19 17 000 9 000 32 500 28 21 000 11 000 37 500
Bookkeeper: Balance Sheet 9 15 000 9 000 29 000 14 19 000 13 000 32 500
Chartered Accountant 12 42 500 27 000 72 500 14 50 000 32 500 87 500
Credit Controller 17 15 000 7 000 21 000 27 19 000 9 000 32 500
Creditors Clerk 21 11 000 7 000 17 000 31 15 000 7 000 21 000
Debtors Clerk 21 11 000 5 000 17 000 29 13 000 7 000 23 000
Financial Manager 26 30 750 17 000 57 500 43 47 500 25 000 77 500
Payroll Administrator 14 15 000 9 000 25 000 30 18 000 10 000 28 750
HUMAN RESOURCES
HR Assistant 21 11 000 5 000 25 000 23 17 000 9 000 27 000
HR Manager 18 32 500 23 000 42 500 34 45 000 27 000 57 500
Trainer 10 18 000 6 000 27 000 14 24 000 9 000 32 500
Training Manager 6 26 000 19 000 37 500 16 37 500 25 000 52 500
MARKETING & SALES
Brand Manager 4 9 32 500 23 000 67 500
CSR/Enquiries Clerk 4 4
Key Accounts Manager 6 29 750 9 000 52 500 19 42 500 27 000 87 500
Marketing Manager 7 37 500 21 000 57 500 23 42 500 17 000 62 500
Marketing Support Staff 10 10 000 5 000 28 250 16 18 000 11 000 37 500
PR/Communications Mgr. 6 26 000 7 000 47 500 10 37 500 20 000 60 000
Sales Manager 11 42 500 15 000 47 500 28 47 500 19 000 72 500
Sales Representative 11 17 000 7 000 27 000 26 22 000 11 000 37 500
Telesales Representative 12 8 000 5 000 17 000 20 11 000 7 000 19 000
IT & SUPPORT
Data Capturer 3 6 8 000 3 000 17 000
Database Administrator 0 7 11 000 3 000 21 000
Infrastructure Manager 0 4
IT Manager 3 13 32 500 19 000 47 500
IT Support 5 11 000 7 000 25 000 9 19 000 13 000 29 000
Network Administrator 2 6 13 000 7 000 32 500
OTHER
Admin/Office Manager 7 21 000 9 000 37 500 16 22 000 9 000 42 500
Branch Manager 9 32 500 11 000 47 500 23 32 500 17 000 62 500
Business Analyst 7 27 000 9 000 42 500 9 32 500 13 000 72 500
Cleaner/Tea Lady 18 3 000 3 000 7 000 33 5 000 3 000 9 000
Clerical Assistant 10 9 000 4 000 19 000 20 10 000 6 000 18 000
Driver 15 7 000 3 000 13 000 36 7 000 5 000 15 000
Executive Secretary / PA 14 15 000 7 000 27 000 32 19 000 9 000 32 500
Procurement Manager 11 32 500 19 000 47 500 23 37 500 11 000 57 500
Receptionist 24 7 000 5 000 15 000 37 9 000 7 000 15 000
Typist 8 7 000 3 000 23 000 9 9 000 5 000 27 000
WHITE COLLAR SURVEY RESULTSSECTION I

Quest Salary Survey & Staffing Trends 2014/15 ©
| 58
TM
1.5.4 500+ employees (National)
Table. 32 - National: Permanent Salaries in Companies with 500+ employees
500+ Employees Permanent with 0 - 5 years experience Permanent with 5 or more years experience
Job Description n Median Min (10%) Max (90%) n Median Min (10%) Max (90%)
FINANCE
Accounts Clerk 17 13 000 9 000 29 000 15 17 000 11 000 29 000
Bookkeeper 17 21 000 11 000 29 000 17 23 000 15 000 32 500
Bookkeeper: Balance Sheet 15 21 000 9 000 29 000 13 25 000 11 000 37 500
Chartered Accountant 18 47 500 15 000 97 500 18 60 000 15 000 97 500
Credit Controller 19 19 000 9 000 52 500 19 21 000 11 000 57 500
Creditors Clerk 18 14 000 7 000 32 500 18 19 000 9 000 37 500
Debtors Clerk 18 13 000 7 000 47 500 16 18 000 11 000 47 500
Financial Manager 21 37 500 15 000 92 500 26 52 500 19 000 97 500
Payroll Administrator 22 17 000 9 000 32 500 25 19 000 13 000 32 500
HUMAN RESOURCES
HR Assistant 22 17 000 9 000 29 000 19 19 000 9 000 32 500
HR Manager 19 37 500 21 000 97 500 24 42 500 23 000 97 500
Trainer 20 19 000 11 000 29 000 17 19 000 13 000 42 500
Training Manager 21 32 500 21 000 87 500 20 35 000 25 000 80 000
MARKETING & SALES
Brand Manager 9 32 500 13 000 97 500 9 37 500 11 000 97 500
CSR/Enquiries Clerk 12 11 000 9 000 52 500 10 13 000 8 000 52 500
Key Accounts Manager 9 37 500 11 000 97 500 10 35 000 18 000 97 500
Marketing Manager 15 29 000 17 000 92 500 15 37 500 19 000 67 500
Marketing Support Staff 14 15 000 11 000 32 500 11 17 000 13 000 32 500
PR/Communications Mgr. 13 32 500 15 000 92 500 13 32 500 23 000 47 500
Sales Manager 12 32 500 13 000 97 500 12 37 500 19 000 97 500
Sales Representative 13 19 000 5 000 42 500 11 23 000 7 000 42 500
Telesales Representative 9 13 000 7 000 32 500 9 17 000 5 000 37 500
IT & SUPPORT
Data Capturer 19 11 000 9 000 42 500 14 15 000 7 000 21 000
Database Administrator 17 17 000 13 000 29 000 13 21 000 15 000 29 000
Infrastructure Manager 12 30 750 23 000 97 500 15 42 500 23 000 97 500
IT Manager 16 35 000 25 000 97 500 18 37 500 13 000 97 500
IT Support 17 19 000 9 000 37 500 18 23 000 9 000 42 500
Network Administrator 17 19 000 11 000 47 500 14 21 000 15 000 37 500
OTHER
Admin/Office Manager 15 25 000 11 000 52 500 17 25 000 11 000 57 500
Branch Manager 14 30 750 7 000 87 500 13 37 500 7 000 92 500
Business Analyst 15 27 000 17 000 67 500 14 35 000 21 000 52 500
Cleaner/Tea Lady 19 5 000 3 000 9 000 17 7 000 3 000 11 000
Clerical Assistant 17 9 000 7 000 23 000 13 13 000 7 000 15 000
Driver 19 9 000 3 000 19 000 16 9 000 5 000 17 000
Executive Secretary / PA 21 21 000 11 000 32 500 23 25 000 15 000 47 500
Procurement Manager 17 32 500 15 000 97 500 20 37 500 20 000 65 000
Receptionist 22 12 000 5 000 21 000 19 13 000 7 000 19 000
Typist 13 9 000 7 000 19 000 11 11 000 7 000 17 000
WHITE COLLAR SURVEY RESULTSSECTION I

Quest Salary Survey & Staffing Trends 2014/15 ©
| 59
TM
Highlights:
• Fig. 27 (below) compares the salaries of permanent staff with more and less than five years experience against the salaries of
temporary staff in companies with 500 or more employees. The salaries paid within each job group (Finance, HR, Marketing, IT and
Admin) have been totalled to get a direct comparison between permanent and temporary salaries per job group. There is no intention
to compare the groups with each other.
• As seen before, when analysing the provincial breakdowns, there is a clear correlation between the salaries paid to temporary
staff and the salaries of permanent staff with less than five years experience. It is interesting to note that very large companies make
extensive use of temporary staff supplied by agencies across all the job functions.
Fig. 27 Comparison of Permanent versus Temporary salaries in companies with 500+ employees
WHITE COLLAR SURVEY RESULTSSECTION I
R 0
R 50 000
R 100 000
R 150 000
R 200 000
R 300 000
R 250 000
Med
ian
Sal
arie
s
Finance Human Resources Marketing IT & Support Other / Admin
Perm < 5 years
Perm > 5 years
Temporary

Quest Salary Survey & Staffing Trends 2014/15 ©
| 60
TM
500+ Employees Permanent with 0 - 5 years experience Permanent with 5 or more years experience
Job Description n Median Min (10%) Max (90%) n Median Min (10%) Max (90%)
FINANCE
Accounts Clerk 9 17 000 9 000 29 000 4
Bookkeeper 10 25 000 9 000 32 500 2
Bookkeeper: Balance Sheet 9 25 000 7 000 29 000 2
Chartered Accountant 9 42 500 15 000 97 500 4
Credit Controller 10 21 000 11 000 29 750 3
Creditors Clerk 10 17 000 10 000 35 000 4
Debtors Clerk 9 15 000 7 000 42 500 4
Financial Manager 9 32 500 13 000 97 500 3
Payroll Administrator 10 18 000 11 000 26 750 5
HUMAN RESOURCES
HR Assistant 11 15 000 9 000 23 000 5
HR Manager 9 32 500 11 000 97 500 5
Trainer 10 18 000 8 000 30 750 5
Training Manager 9 37 500 11 000 92 500 5
MARKETING & SALES
Brand Manager 7 27 000 11 000 92 500 4
CSR/Enquiries Clerk 9 13 000 5 000 97 500 5
Key Accounts Manager 8 30 750 9 000 97 500 6 20 750 3 000 57 500
Marketing Manager 8 34 750 11 000 92 500 4
Marketing Support Staff 8 17 000 7 000 32 500 4
PR/Communications Mgr. 9 32 500 7 000 92 500 5
Sales Manager 7 29 000 7 000 97 500 7 7 000 3 000 57 500
Sales Representative 7 21 000 7 000 42 500 8 8 000 3 000 57 500
Telesales Representative 6 17 000 5 000 32 500 6 5 000 3 000 23 000
IT & SUPPORT
Data Capturer 9 11 000 7 000 32 500 4
Database Administrator 9 19 000 11 000 29 000 4
Infrastructure Manager 8 29 000 7 000 97 500 4
IT Manager 9 32 500 9 000 97 500 5
IT Support 10 19 000 9 000 32 250 4
Network Administrator 10 17 000 11 000 45 000 5
OTHER
Admin/Office Manager 9 32 500 9 000 52 500 4
Branch Manager 6 28 250 7 000 97 500 5
Business Analyst 10 33 250 11 000 42 500 4
Cleaner/Tea Lady 11 5 000 3 000 7 000 0
Clerical Assistant 9 9 000 7 000 17 000 4
Driver 9 9 000 3 000 17 000 4
Executive Secretary / PA 9 19 000 7 000 32 500 5
Procurement Manager 8 35 000 11 000 62 500 4
Receptionist 12 12 000 7 000 17 000 5
Typist 7 9 000 7 000 19 000 4
WHITE COLLAR SURVEY RESULTSSECTION I
1.6 Size of company median salaries comparison (temporary)1.6.1 500+ employees
Table. 33 - National: Permanent Salaries in Companies with 1 to 50 employees
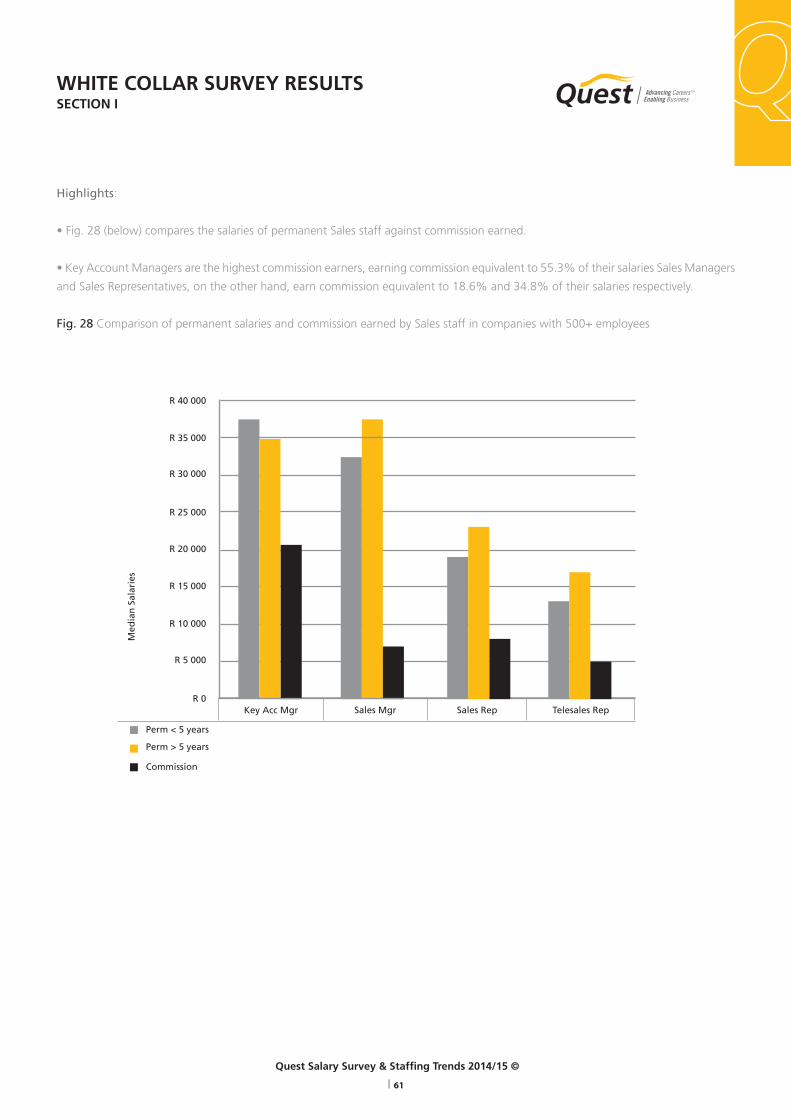
Quest Salary Survey & Staffing Trends 2014/15 ©
| 61
TM
Highlights:
• Fig. 28 (below) compares the salaries of permanent Sales staff against commission earned.
• Key Account Managers are the highest commission earners, earning commission equivalent to 55.3% of their salaries Sales Managers
and Sales Representatives, on the other hand, earn commission equivalent to 18.6% and 34.8% of their salaries respectively.
Fig. 28 Comparison of permanent salaries and commission earned by Sales staff in companies with 500+ employees
WHITE COLLAR SURVEY RESULTSSECTION I
R 0
R 5 000
R 10 000
R 15 000
R 20 000
R 30 000
R 25 000
Med
ian
Sal
arie
s
Key Acc Mgr Sales Mgr Sales Rep Telesales Rep
R 35 000
R 40 000
Perm < 5 years
Perm > 5 years
Commission

Quest Salary Survey & Staffing Trends 2014/15 ©
| 62
TM
2 CONTACT CENTRE SALARY SURVEY RESULTS
TM
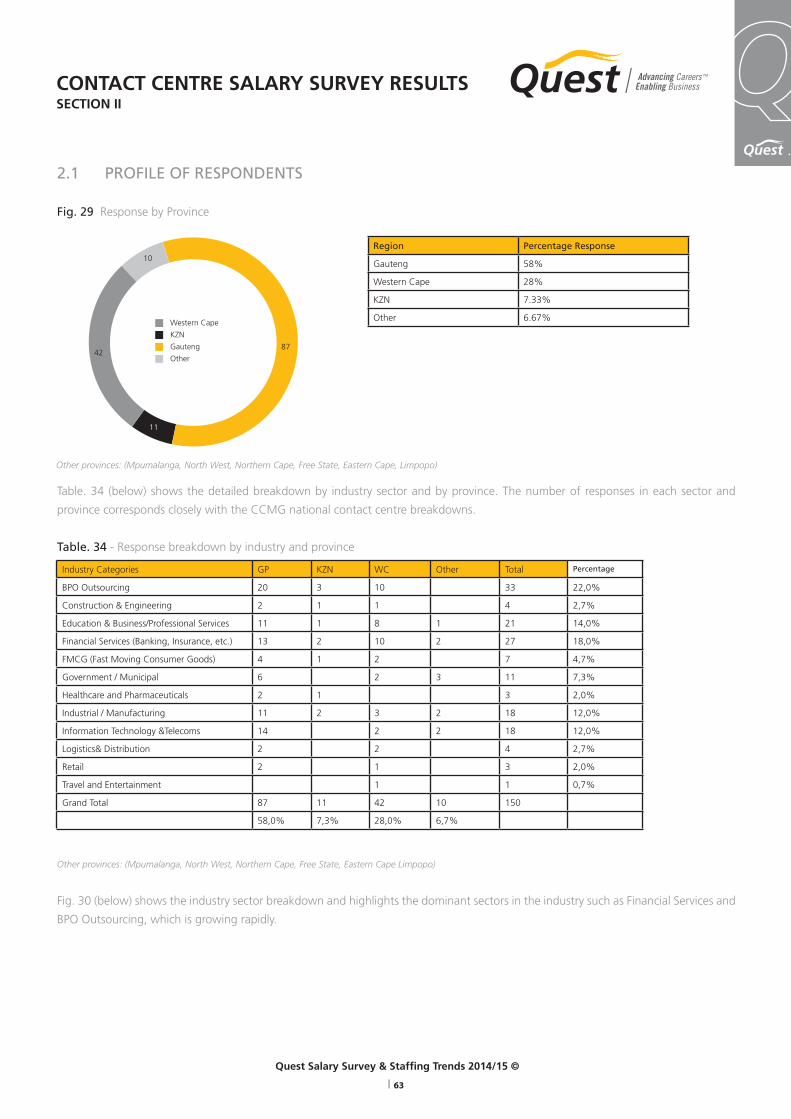
TM
Quest Salary Survey & Staffing Trends 2014/15 ©
| 63
CONTACT CENTRE SALARY SURVEY RESULTSSECTION II
2.1 PROFILE OF RESPONDENTS
Fig. 29 Response by Province
Table. 34 (below) shows the detailed breakdown by industry sector and by province. The number of responses in each sector and
province corresponds closely with the CCMG national contact centre breakdowns.
Table. 34 - Response breakdown by industry and province
Other provinces: (Mpumalanga, North West, Northern Cape, Free State, Eastern Cape Limpopo)
Fig. 30 (below) shows the industry sector breakdown and highlights the dominant sectors in the industry such as Financial Services and
BPO Outsourcing, which is growing rapidly.
Other provinces: (Mpumalanga, North West, Northern Cape, Free State, Eastern Cape, Limpopo)
Region Percentage Response
Gauteng 58%
Western Cape 28%
KZN 7.33%
Other 6.67%Western Cape
KZN
Gauteng
Other
11
8742
10
Industry Categories GP KZN WC Other Total Percentage
BPO Outsourcing 20 3 10 33 22,0%
Construction & Engineering 2 1 1 4 2,7%
Education & Business/Professional Services 11 1 8 1 21 14,0%
Financial Services (Banking, Insurance, etc.) 13 2 10 2 27 18,0%
FMCG (Fast Moving Consumer Goods) 4 1 2 7 4,7%
Government / Municipal 6 2 3 11 7,3%
Healthcare and Pharmaceuticals 2 1 3 2,0%
Industrial / Manufacturing 11 2 3 2 18 12,0%
Information Technology &Telecoms 14 2 2 18 12,0%
Logistics& Distribution 2 2 4 2,7%
Retail 2 1 3 2,0%
Travel and Entertainment 1 1 0,7%
Grand Total 87 11 42 10 150
58,0% 7,3% 28,0% 6,7%
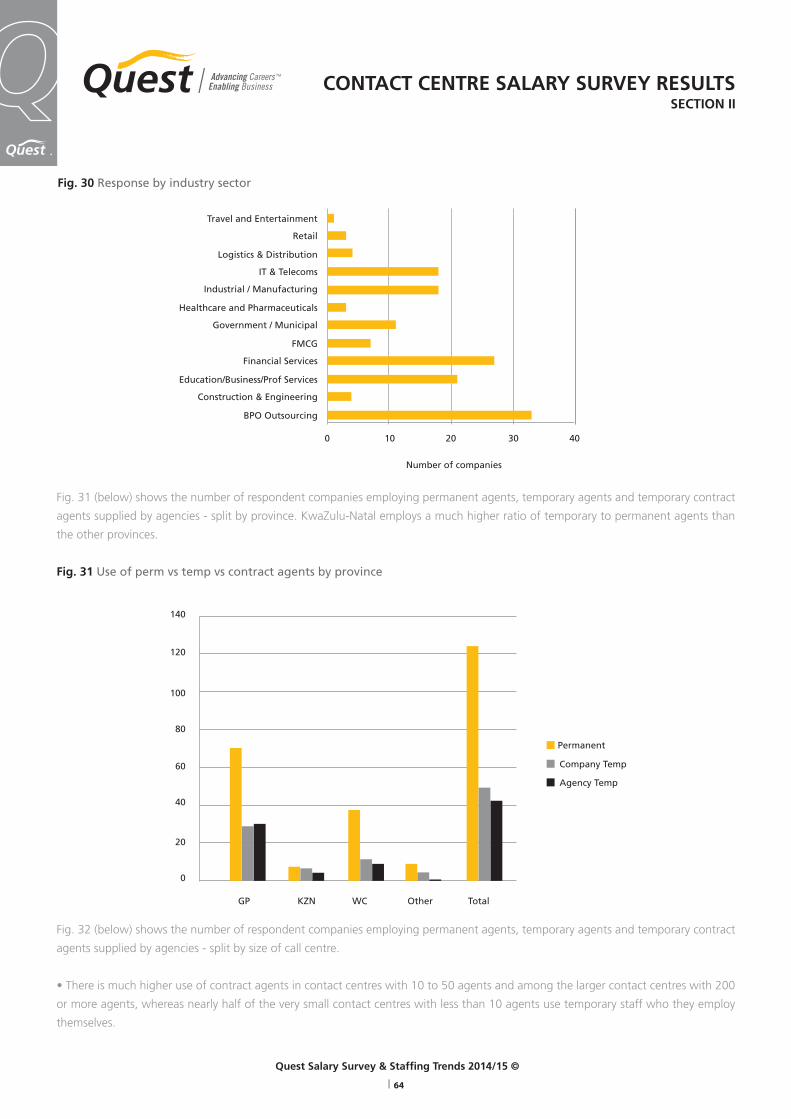
Quest Salary Survey & Staffing Trends 2014/15 ©
| 64
TM
Fig. 32 (below) shows the number of respondent companies employing permanent agents, temporary agents and temporary contract
agents supplied by agencies - split by size of call centre.
• There is much higher use of contract agents in contact centres with 10 to 50 agents and among the larger contact centres with 200
or more agents, whereas nearly half of the very small contact centres with less than 10 agents use temporary staff who they employ
themselves.
CONTACT CENTRE SALARY SURVEY RESULTSSECTION II
Fig. 30 Response by industry sector
Fig. 31 (below) shows the number of respondent companies employing permanent agents, temporary agents and temporary contract
agents supplied by agencies - split by province. KwaZulu-Natal employs a much higher ratio of temporary to permanent agents than
the other provinces.
Fig. 31 Use of perm vs temp vs contract agents by province
Travel and Entertainment
Retail
Logistics & Distribution
IT & Telecoms
Industrial / Manufacturing
Healthcare and Pharmaceuticals
Government / Municipal
FMCG
Financial Services
Education/Business/Prof Services
Construction & Engineering
BPO Outsourcing
140
120
100
80
60
40
20
0
0 10 20 30 40
Number of companies
GP KZN WC Other Total
Permanent
Company Temp
Agency Temp

TM
Quest Salary Survey & Staffing Trends 2014/15 ©
| 65
The following section (2.2.1 - 2.2.4) presents and analyses median, minimum and maximum salaries of Agents on national and
provincial level, by level of experience (</> 5 years), as well as temp vs. temp in the contact Centre industry in general.
2.2 Contact Centre Agent Salaries 2.2.1 NationalTable. 35 - National Permanent and Temporary agents employed by company salaries
Permanent Temporary employed by company
Job Description n Median Min (10%) Max (90%) n Median Min (10%) Max (90%)
Customer Service Inbound 0-1 yr 75 7 000 5 000 15 000 29 7 000 3 000 13 000
Customer Service Inbound 1+ yrs 82 9 000 5 000 15 000 28 7 000 5 000 15 000
Customer Service Outbound 0-1 yr 45 7 000 3 000 13 000 14 7 000 3 000 15 000
Customer Service Outbound 1+ yrs 46 9 000 5 000 13 000 14 7 000 3 000 11 000
Sales Inbound 0-1 year 29 9 000 3 000 13 000 12 5 000 3 000 9 000
Sales Inbound 1+ years 34 9 000 5 000 15 000 10 5 000 3 000 12 000
Sales Outbound 0-1 year 38 5 000 3 000 13 000 15 5 000 3 000 9 000
Sales Outbound 1+ years 39 5 000 3 000 15 000 17 5 000 3 000 9 000
Collections 0-1 year 26 5 000 3 000 15 000 12 4 000 3 000 11 000
Collections 1+ years 26 7 000 3 000 15 000 11 7 000 3 000 11 000
IT Helpdesk 0-1 year 36 9 000 5 000 15 000 15 9 000 5 000 13 000
IT Helpdesk 1+ years 45 11 000 7 000 15 000 16 10 000 5 000 15 000
CONTACT CENTRE SALARY SURVEY RESULTSSECTION II
Fig. 32 Use of perm vs temp vs contract agents by size of call centre
60
50
40
30
20
10
0
Permanent
Company Temp
Agency Temp
Size of companies (Employee Count)
Nu
mb
er o
f co
mp
anie
s
10 - 50 50 - 100 100 - 200 200 - 500 500+1 - 10

Quest Salary Survey & Staffing Trends 2014/15 ©
| 66
TM
Table. 36 - National Temporary agents employed by agencies salaries & commission (all agents)
Temporary employed by agency Average Monthly Commission
Job Description n Median Min (10%) Max (90%) n Median Min (10%) Max (90%)
Customer Service Inbound 0-1 yr 29 7 000 3 000 13 000 22 1 000 1 000 3 000
Customer Service Inbound 1+ yrs 30 9 000 4 000 14 000 22 1 000 1 000 7 000
Customer Service Outbound 0-1 yr 23 7 000 3 000 11 000 19 1 000 1 000 9 000
Customer Service Outbound 1+ yrs 24 7 000 5 000 11 000 19 3 000 1 000 7 000
Sales Inbound 0-1 year 15 5 000 3 000 9 000 18 1 000 1 000 5 000
Sales Inbound 1+ years 17 7 000 3 000 9 000 18 3 000 1 000 9 000
Sales Outbound 0-1 year 18 3 000 3 000 9 000 29 1 000 1 000 5 000
Sales Outbound 1+ years 20 5 000 4 000 9 000 30 3 000 1 000 9 000
Collections 0-1 year 9 9 000 3 000 15 000 14 1 000 1 000 3 000
Collections 1+ years 9 9 000 3 000 15 000 14 3 000 1 000 3 000
IT Helpdesk 0-1 year 15 9 000 5 000 13 000 8 1 000 1 000 9 000
IT Helpdesk 1+ years 16 9 000 5 000 15 000 9 3 000 1 000 21 000
Highlights:
• In Fig. 33 (below) it is interesting to note that in the Collections sector significantly higher salaries are paid to temporary agents
employed by agencies. In the case of Collections agents with less than one year’s experience, the difference can be up to 80% more.
• The salaries for other agent types are aligned with each other, except for Permanent Inbound Sales agents who are paid substantially
more than temporary agents. Perhaps this is to make up for the possibility that the permanent agents are often paid less commission
than their Outbound Sales colleagues.
Fig. 33 National comparison of agent salaries by employment type
CONTACT CENTRE SALARY SURVEY RESULTSSECTION II
IT Helpdesk 1 + year
0 - 5 000 10 000 15 000
Agency Temp
Company Temp
Permanent
IT Helpdesk 0-1 year
Collections 1 + years
Collections 0-1 year
Sales Outbound 1 + years
Sales Outbound 0-1 year
Sales Inbound 1 + years
Sales Inbound 0-1 year
Customer Service Outbound 1 + years
Customer Service Outbound 0-1 year
Customer Service Inbound 1 + yearsCustomer Service Inbound 0-1 year

TM
Quest Salary Survey & Staffing Trends 2014/15 ©
| 67
2.2.2 GautengTable. 37 - Gauteng permanent and temporary agents employed by company salaries
Permanent Temporary employed by company
Job Description n Median Min (10%) Max (90%) n Median Min (10%) Max (90%)
Customer Service Inbound 0-1 yr 47 9 000 5 000 15 000 21 5 000 3 000 13 000
Customer Service Inbound 1+ yrs 47 11 000 5 000 15 000 18 8 000 5 000 15 000
Customer Service Outbound 0-1 yr 27 9 000 3 000 15 000 9 9 000 3 000 15 000
Customer Service Outbound 1+ yrs 29 9 000 3 000 15 000 9 7 000 3 000 15 000
Sales Inbound 0-1 year 18 9 000 3 000 15 000 9 5 000 3 000 15 000
Sales Inbound 1+ years 20 7 000 4 000 14 000 7 5 000 5 000 15 000
Sales Outbound 0-1 year 19 5 000 3 000 15 000 9 5 000 3 000 15 000
Sales Outbound 1+ years 19 7 000 3 000 15 000 10 5 000 4 000 12 000
Collections 0-1 year 17 5 000 3 000 15 000 8 6 000 3 000 15 000
Collections 1+ years 17 7 000 3 000 15 000 8 7 000 3 000 15 000
IT Helpdesk 0-1 year 25 11 000 5 000 15 000 9 9 000 3 000 15 000
IT Helpdesk 1+ years 29 13 000 7 000 15 000 10 10 000 5 000 15 000
Table. 38 - Gauteng temporary agents employed by agencies salaries & commission (all agents)
Temporary employed by agency Average Monthly Commission
Job Description n Median Min (10%) Max (90%) n Median Min (10%) Max (90%)
Customer Service Inbound 0-1 yr 24 7 000 3 000 13 000 13 1 000 1 000 7 000
Customer Service Inbound 1+ yrs 25 9 000 3 000 15 000 12 3 000 1 000 7 000
Customer Service Outbound 0-1 yr 18 7 000 3 000 15 000 11 1 000 1 000 7 000
Customer Service Outbound 1+ yrs 20 7 000 4 000 12 000 11 3 000 1 000 5 000
Sales Inbound 0-1 year 14 5 000 3 000 9 000 11 1 000 1 000 5 000
Sales Inbound 1+ years 16 7 000 3 000 9 000 11 3 000 1 000 5 000
Sales Outbound 0-1 year 14 3 000 3 000 9 000 13 1 000 1 000 5 000
Sales Outbound 1+ years 15 5 000 5 000 9 000 13 3 000 1 000 5 000
Collections 0-1 year 8 7 000 3 000 15 000 7 3 000 1 000 5 000
Collections 1+ years 8 7 000 3 000 15 000 7 3 000 1 000 5 000
IT Helpdesk 0-1 year 12 9 000 5 000 13 000 5 1 000 1 000 7 000
IT Helpdesk 1+ years 13 9 000 5 000 15 000 6 3 000 1 000 21 000
Highlights:
In Fig. 34 (below), we compare Gauteng’s median salaries of permanent agents against the national median.
• Gauteng’s salaries are either equal to or higher than the national median salary, except for Inbound Sales agents with one or more
years experience who are paid 28.6% less.
CONTACT CENTRE SALARY SURVEY RESULTSSECTION II
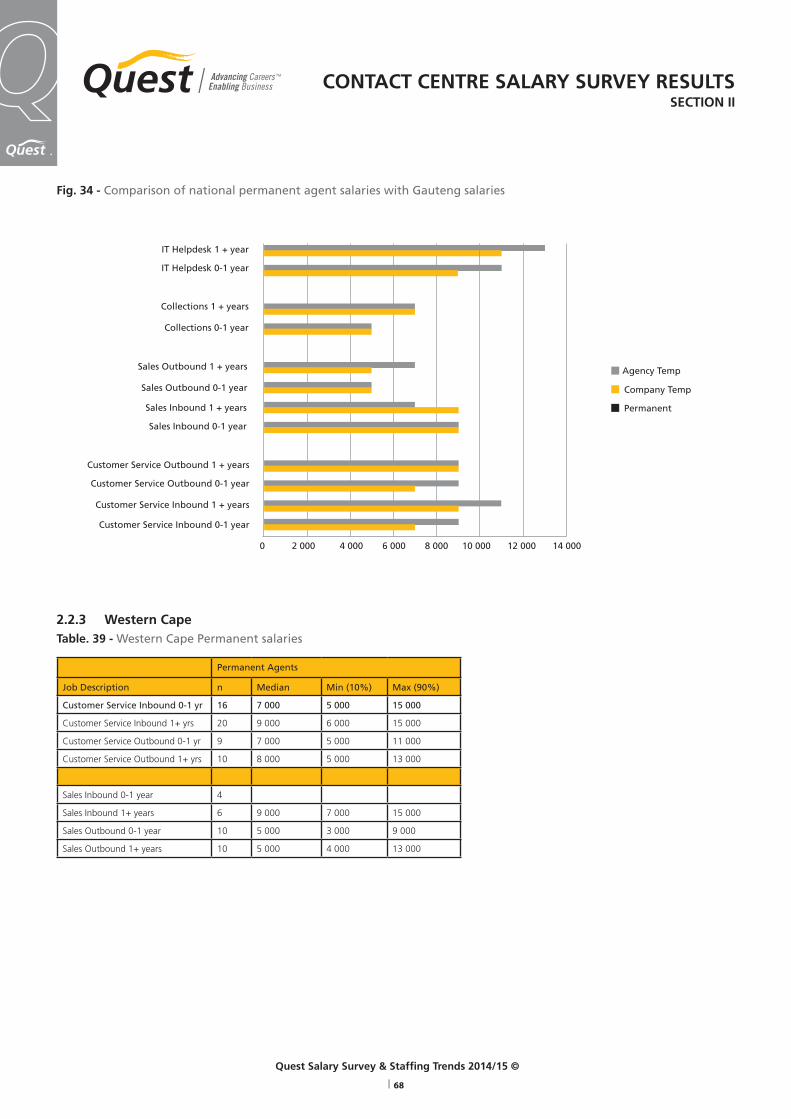
Quest Salary Survey & Staffing Trends 2014/15 ©
| 68
TM
Fig. 34 - Comparison of national permanent agent salaries with Gauteng salaries
2.2.3 Western Cape Table. 39 - Western Cape Permanent salaries
Permanent Agents
Job Description n Median Min (10%) Max (90%)
Customer Service Inbound 0-1 yr 16 7 000 5 000 15 000
Customer Service Inbound 1+ yrs 20 9 000 6 000 15 000
Customer Service Outbound 0-1 yr 9 7 000 5 000 11 000
Customer Service Outbound 1+ yrs 10 8 000 5 000 13 000
Sales Inbound 0-1 year 4
Sales Inbound 1+ years 6 9 000 7 000 15 000
Sales Outbound 0-1 year 10 5 000 3 000 9 000
Sales Outbound 1+ years 10 5 000 4 000 13 000
CONTACT CENTRE SALARY SURVEY RESULTSSECTION II
IT Helpdesk 1 + year
IT Helpdesk 0-1 year
Collections 1 + years
Collections 0-1 year
Sales Outbound 1 + years
Sales Outbound 0-1 year
Sales Inbound 1 + years
Sales Inbound 0-1 year
Customer Service Outbound 1 + years
Customer Service Outbound 0-1 year
Agency Temp
Company Temp
Permanent
Customer Service Inbound 0-1 year
Customer Service Inbound 1 + years
0 2 000 4 000 6 000 8 000 10 000 12 000 14 000

TM
Quest Salary Survey & Staffing Trends 2014/15 ©
| 69
2.2.4 KwaZulu Natal Table. 40 - KwaZulu-Natal Permanent salaries
Permanent Agents
Job Description n Median Min (10%) Max (90%)
Customer Service Inbound 0-1 yr 5 5 000 3 000 7 000
Customer Service Inbound 1+ yrs 6 7 000 3 000 11 000
Customer Service Outbound 0-1 yr 3
Customer Service Outbound 1+ yrs 3
Sales Inbound 0-1 year 3
Sales Inbound 1+ years 3
Sales Outbound 0-1 year 5 5 000 3 000 11 000
Sales Outbound 1+ years 6 5 000 3 000 11 000
Highlights:
In Fig. 35 (below), we compare Western Cape and KwaZulu-Natal permanent agent salaries against the national median.
• The provincial salaries are closely aligned to national median salaries, except for that of Customer Service Inbound salaries in
KwaZulu-Natal which are lower than national and Western Cape salaries by up to 40%.
• Looking at the source data, which is slightly below our validity level, we see that salaries for KwaZulu-Natal Customer Service
Outbound agents with one or more years experience are lower by 28%.
Fig. 35 - Comparison of national agent salaries with Western Cape and KwaZulu-Natal salaries
CONTACT CENTRE SALARY SURVEY RESULTSSECTION II
Sales Inbound 1 + years
Sales Inbound 0-1 year
Customer Service Outbound 1 + years
Customer Service Outbound 0-1 year
KZN
W/Cape
National
Customer Service Inbound 1 + years
Customer Service Inbound 0-1 year
Sales Outbound 1 + years
Sales Outbound 0-1 year
0 - 2 000 4 000 6 000 8 000 10 000

Quest Salary Survey & Staffing Trends 2014/15 ©
| 70
TM
This section (2.2.5 – 2.2.6) presents, analyses and compares Agent Salaries in two specific sectors being the Financial and the
BPO Outsourcing Sectors.
2.2.5 Financial ServicesTable. 41 - Financial Services: Permanent & Temporary agents employed by company salaries
Permanent Temporary employed by company
Job Description n Median Min (10%) Max (90%) n Median Min (10%) Max (90%)
Customer Service Inbound 0-1 yr 19 7 000 5 000 15 000 6 6 000 5 000 9 000
Customer Service Inbound 1+ yrs 19 9 000 5 000 15 000 5 7 000 5 000 11 000
Customer Service Outbound 0-1 yr 14 7 000 5 000 9 000 5 9 000 5 000 9 000
Customer Service Outbound 1+ yrs 14 9 000 5 000 13 000 5 9 000 5 000 11 000
Sales Inbound 0-1 year 11 9 000 5 000 11 000 4
Sales Inbound 1+ years 12 9 000 5 000 13 000 3
Sales Outbound 0-1 year 17 7 000 3 000 13 000 6 5 000 3 000 9 000
Sales Outbound 1+ years 16 7 000 5 000 15 000 6 5 000 5 000 9 000
Collections 0-1 year 8 5 000 3 000 11 000 5 5 000 3 000 11 000
Collections 1+ years 8 6 000 3 000 11 000 5 5 000 3 000 9 000
IT Helpdesk 0-1 year 7 7 000 5 000 11 000 3
IT Helpdesk 1+ years 8 7 000 7 000 13 000 3
Table. 42 - Financial Services: Temporary agents employed by agency salaries & commission (all agents)
Temporary employed by agency Average Monthly Commission
Job Description n Median Min (10%) Max (90%) n Median Min (10%) Max (90%)
Customer Service Inbound 0-1 yr 4 7 1 000 1 000 7 000
Customer Service Inbound 1+ yrs 4 7 1 000 1 000 7 000
Customer Service Outbound 0-1 yr 6 7 000 3 000 9 000 7 1 000 1 000 9 000
Customer Service Outbound 1+ yrs 6 7 000 3 000 9 000 7 1 000 1 000 9 000
Sales Inbound 0-1 year 4 6 3 000 1 000 9 000
Sales Inbound 1+ years 4 6 4 000 1 000 9 000
Sales Outbound 0-1 year 6 4 000 3 000 9 000 11 3 000 1 000 5 000
Sales Outbound 1+ years 6 5 000 3 000 9 000 11 5 000 1 000 9 000
Collections 0-1 year 4 5 3 000 1 000 5 000
Collections 1+ years 4 5 3 000 3 000 5 000
IT Helpdesk 0-1 year 4 2
IT Helpdesk 1+ years 4 2
Highlights:
Fig. 36 (below) compares the salaries of agents in several categories of the Financial Services sector.
• In the majority of cases, permanent agents are paid better than temporary agents and temporary agents employed by a company are
marginally better paid than agents supplied by an agency.
• The exception is with Customer Service Outbound agents who have less than one year’s experience. In this category temporary
agents employed by the company are paid 28.6% more.
CONTACT CENTRE SALARY SURVEY RESULTSSECTION II
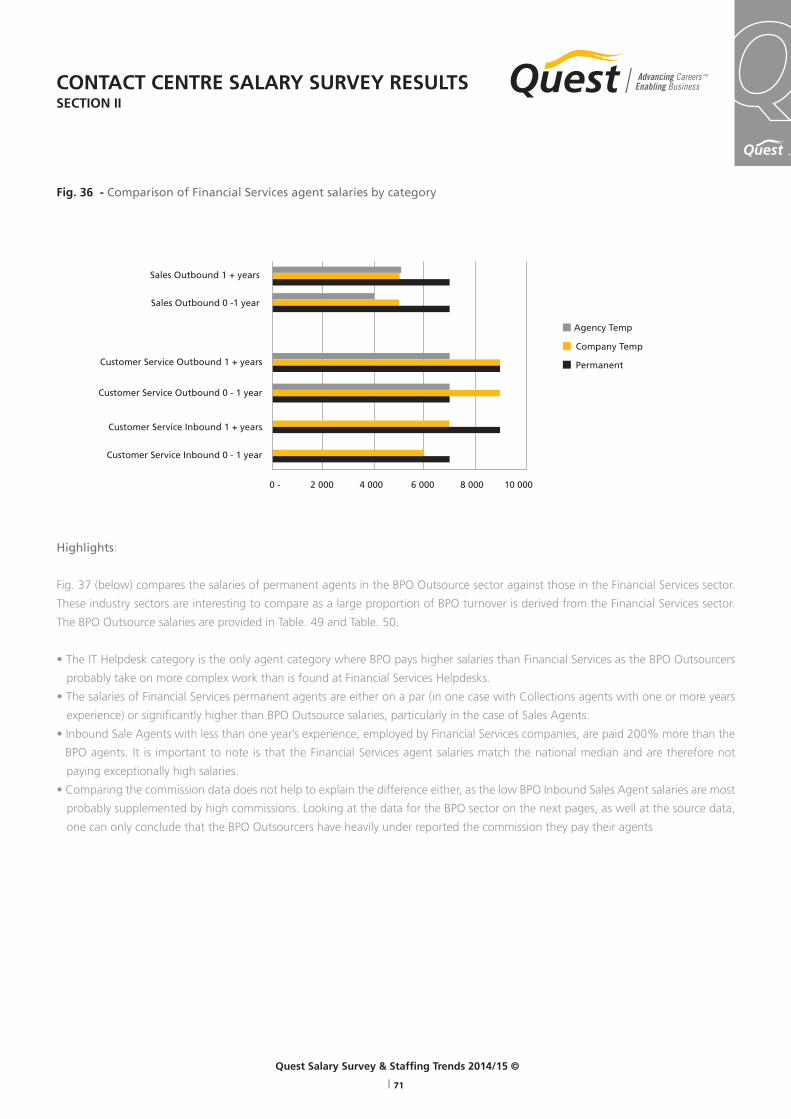
TM
Quest Salary Survey & Staffing Trends 2014/15 ©
| 71
Highlights:
Fig. 37 (below) compares the salaries of permanent agents in the BPO Outsource sector against those in the Financial Services sector.
These industry sectors are interesting to compare as a large proportion of BPO turnover is derived from the Financial Services sector.
The BPO Outsource salaries are provided in Table. 49 and Table. 50.
• The IT Helpdesk category is the only agent category where BPO pays higher salaries than Financial Services as the BPO Outsourcers
probably take on more complex work than is found at Financial Services Helpdesks.
• The salaries of Financial Services permanent agents are either on a par (in one case with Collections agents with one or more years
experience) or significantly higher than BPO Outsource salaries, particularly in the case of Sales Agents.
• Inbound Sale Agents with less than one year’s experience, employed by Financial Services companies, are paid 200% more than the
BPO agents. It is important to note is that the Financial Services agent salaries match the national median and are therefore not
paying exceptionally high salaries.
• Comparing the commission data does not help to explain the difference either, as the low BPO Inbound Sales Agent salaries are most
probably supplemented by high commissions. Looking at the data for the BPO sector on the next pages, as well at the source data,
one can only conclude that the BPO Outsourcers have heavily under reported the commission they pay their agents
Fig. 36 - Comparison of Financial Services agent salaries by category
CONTACT CENTRE SALARY SURVEY RESULTSSECTION II
Sales Outbound 1 + years
Sales Outbound 0 -1 year
Customer Service Outbound 1 + years
Customer Service Outbound 0 - 1 year
Customer Service Inbound 1 + years
Customer Service Inbound 0 - 1 year
Agency Temp
Company Temp
Permanent
0 - 2 000 4 000 6 000 8 000 10 000
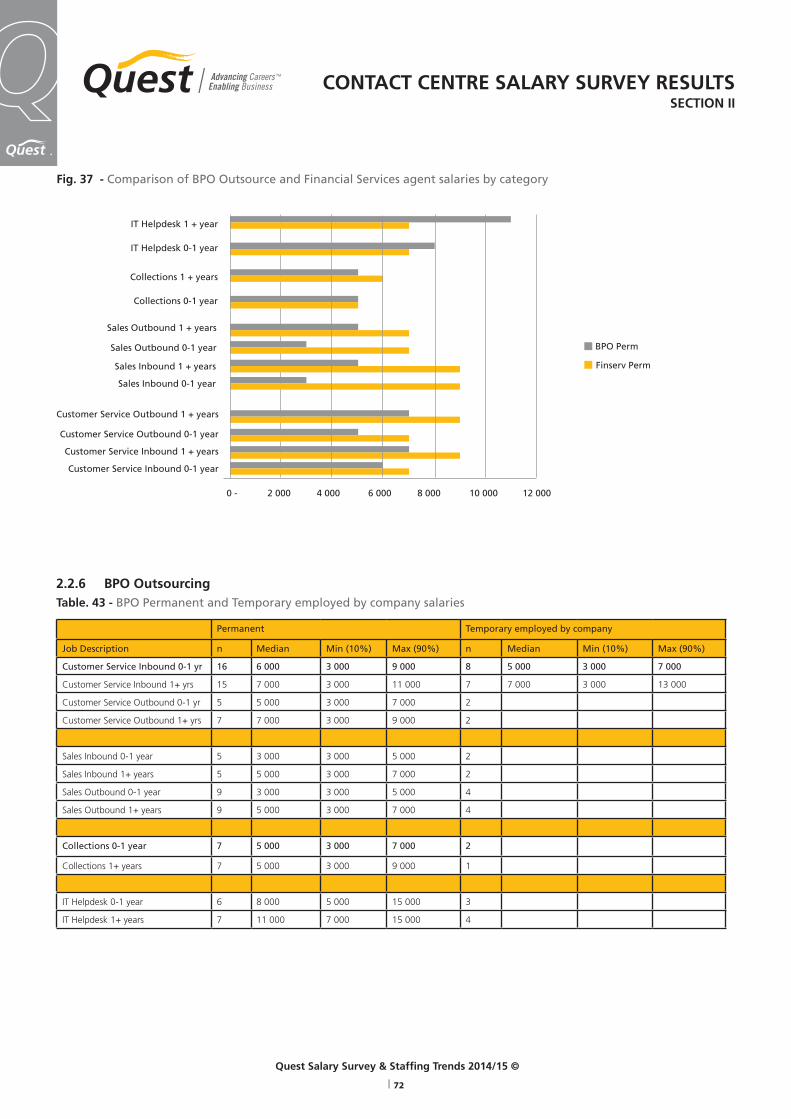
Quest Salary Survey & Staffing Trends 2014/15 ©
| 72
TM
Fig. 37 - Comparison of BPO Outsource and Financial Services agent salaries by category
2.2.6 BPO OutsourcingTable. 43 - BPO Permanent and Temporary employed by company salaries
Permanent Temporary employed by company
Job Description n Median Min (10%) Max (90%) n Median Min (10%) Max (90%)
Customer Service Inbound 0-1 yr 16 6 000 3 000 9 000 8 5 000 3 000 7 000
Customer Service Inbound 1+ yrs 15 7 000 3 000 11 000 7 7 000 3 000 13 000
Customer Service Outbound 0-1 yr 5 5 000 3 000 7 000 2
Customer Service Outbound 1+ yrs 7 7 000 3 000 9 000 2
Sales Inbound 0-1 year 5 3 000 3 000 5 000 2
Sales Inbound 1+ years 5 5 000 3 000 7 000 2
Sales Outbound 0-1 year 9 3 000 3 000 5 000 4
Sales Outbound 1+ years 9 5 000 3 000 7 000 4
Collections 0-1 year 7 5 000 3 000 7 000 2
Collections 1+ years 7 5 000 3 000 9 000 1
IT Helpdesk 0-1 year 6 8 000 5 000 15 000 3
IT Helpdesk 1+ years 7 11 000 7 000 15 000 4
CONTACT CENTRE SALARY SURVEY RESULTSSECTION II
IT Helpdesk 1 + year
IT Helpdesk 0-1 year
Collections 1 + years
Collections 0-1 year
Sales Outbound 1 + years
Sales Outbound 0-1 year
Sales Inbound 1 + years
Sales Inbound 0-1 year
Customer Service Outbound 1 + years
Customer Service Outbound 0-1 year
Customer Service Inbound 1 + years
Customer Service Inbound 0-1 year
BPO Perm
Finserv Perm
0 - 2 000 4 000 6 000 8 000 10 000 12 000

TM
Quest Salary Survey & Staffing Trends 2014/15 ©
| 73
Table. 44 - Financial Services: Temporary agents employed by agency salaries & commission (all agents)
Temporary employed by agency Average Monthly Commission
Job Description n Median Min (10%) Max (90%) n Median Min (10%) Max (90%)
Customer Service Inbound 0-1 yr 13 5 000 3 000 7 000 8 1 000 1 000 3 000
Customer Service Inbound 1+ yrs 14 7 000 5 000 13 000 7 1 000 1 000 5 000
Customer Service Outbound 0-1 yr 9 5 000 3 000 7 000 5 3 000 1 000 7 000
Customer Service Outbound 1+ yrs 10 6 000 5 000 8 000 5 3 000 3 000 7 000
Sales Inbound 0-1 year 5 5 000 3 000 7 000 4
Sales Inbound 1+ years 6 7 000 5 000 9 000 4
Sales Outbound 0-1 year 6 3 000 3 000 7 000 9 1 000 1 000 5 000
Sales Outbound 1+ years 7 5 000 3 000 9 000 9 3 000 3 000 5 000
Collections 0-1 year 0 6 1 000 1 000 3 000
Collections 1+ years 0 6 3 000 1 000 3 000
IT Helpdesk 0-1 year 2 0
IT Helpdesk 1+ years 2 0
Highlights:
Fig. 38 (below) compares salary levels of permanent and temporary agents in the BPO Outsource sector.
o Salaries of both types of Outbound Sales agents are exactly in line.
o Permanent Inbound Sales Agents salaries are less than those of temporary agents by up to 66%.
o Customer Service agent salaries are matched in two job categories and permanent agents are paid slightly more in the other two
categories.
Fig. 38 - Comparison of BPO Outsource agent salaries by category
CONTACT CENTRE SALARY SURVEY RESULTSSECTION II
Sales Outbound 1 + years
Sales Outbound 0-1 year
Sales Inbound 1 + years
Sales Inbound 0-1 year
Customer Service Outbound 1 + years
Customer Service Outbound 0-1 year
Agency Temp
Company Temp
Permanent
0 - 2 000 4 000 6 000 8 000
Customer Service Inbound 1 + years
Customer Service Inbound 0-1 year

Quest Salary Survey & Staffing Trends 2014/15 ©
| 74
TM
The following section (2.3.1-2.3.3) presents and analyses median, minimum and maximum salaries of Supervisor/Manager salaries
nationally and for the Gauteng Province, by level of experience (</> 5 years), as well as temp vs. temp in the BPO Outsourcing industry.
2.3 Contact Centre Supervisor/Manager Salaries2.3.1 NationalTable. 45 - National Permanent and Temporary agents employed by company salaries
Permanent Temporary employed by company
Job Description n Median Min (10%) Max (90%) n Median Min (10%) Max (90%)
Supervisor/Team Leader 0-5 yrs 82 13 000 9 000 19 000 15 13 000 7 000 19 000
Supervisor/Team Leader 5+ yrs 74 15 000 9 000 19 000 11 15 000 9 000 19 000
Manager 0-5 years 75 21 000 13 000 33 000 11 17 000 13 000 29 000
Manager 5+ years 89 29 000 15 000 37 000 11 19 000 15 000 29 000
Temporary employed by agency Average Monthly Commission
Job Description n Median Min (10%) Max (90%) n Median Min (10%) Max (90%)
Supervisor/Team Leader 0-5 yrs 15 13 000 7 000 19 000 25 3 000 1 000 7 000
Supervisor/Team Leader 5+ yrs 15 15 000 7 000 19 000 23 3 000 1 000 7 000
Manager 0-5 years 9 15 000 13 000 29 000 18 5 000 1 000 17 000
Manager 5+ years 10 17 000 13 000 29 000 17 5 000 1 000 19 000
Table. 46 - National Temporary employed by agency salaries and commission (all staff)
Highlights:
Fig. 39 (below) compares the national Manager/Supervisor salaries by the three employment types.
• It is interesting to note that Supervisors/Team Leaders are paid exactly the same salaries at each experience level - whether they are
permanent, temporary hired by company or temporary hired by an agency.
• When it comes to Managers, there are quite wide variances by employment type with only permanently employed Managers with
five or more years experience rising to the expected level above other positions.
Fig. 39 - Comparison of National Manager/Supervisor salaries by employment types
CONTACT CENTRE SALARY SURVEY RESULTSSECTION II
R 0
R 50 000
R 10 000
R 15 000
R 20 000
R 30 000
R 25 000
Med
ian
Sal
arie
s
Supervisor0-5 years
Supervisor5 + years
Manager0-5 years
Manager5 + years
R 35 000
Agency Temp
Company Temp
Permanent

TM
Quest Salary Survey & Staffing Trends 2014/15 ©
| 75
2.3.2 GautengTable. 47 - Gauteng Permanent and Temporary employed by company salaries
Permanent Temporary employed by company
Job Description n Median Min (10%) Max (90%) n Median Min (10%) Max (90%)
Supervisor/Team Leader 0-5 yrs 50 13 000 9 000 19 000 10 12 000 7 000 19 000
Supervisor/Team Leader 5+ yrs 45 17 000 11 000 19 000 7 11 000 7 000 19 000
Manager 0-5 years 43 27 000 13 000 23 000 6 16 000 13 000 33 000
Manager 5+ years 48 31 000 15 000 29 000 6 17 000 13 000 33 000
Temporary employed by agency Average Monthly Commission
Job Description n Median Min (10%) Max (90%) n Median Min (10%) Max (90%)
Supervisor/Team Leader 0-5 yrs 13 13 000 7 000 19 000 11 3 000 3 000 7 000
Supervisor/Team Leader 5+ yrs 13 15 000 7 000 19 000 9 3 000 3 000 7 000
Manager 0-5 years 6 17 000 13 000 29 000 7 5 000 3 000 17 000
Manager 5+ years 7 17 000 13 000 29 000 7 5 000 3 000 19 000
Table. 48 - Gauteng Temporary employed by agency salaries and commission (all staff)
Highlights:
In Fig. 40 (below), we compare national, Gauteng and BPO Outsource permanent salaries for Supervisors and Managers. The BPO
Outsource salaries are in Table. 49 and Table. 50.
• The BPO Outsource Supervisor and Manager salaries are slightly lower than or equal to the national median. However, the salaries
of Gauteng Managers are higher than the national median. The salaries of Gauteng managers with less than five years experience are
higher by 47.6%.
Fig. 40 - Comparison of Permanent Supervisor/Manager salaries nationally, in Gauteng and in the BPO Outsource sector
CONTACT CENTRE SALARY SURVEY RESULTSSECTION II
R 0
R 5 000
R 10 000
R 15 000
R 20 000
R 30 000
R 25 000
Med
ian
Sal
arie
s
Supervisor0-5 years
Supervisor5 + years
Manager0-5 years
Manager5 + years
R 35 000
Perm National
Perm Gauteng
Perm BPO
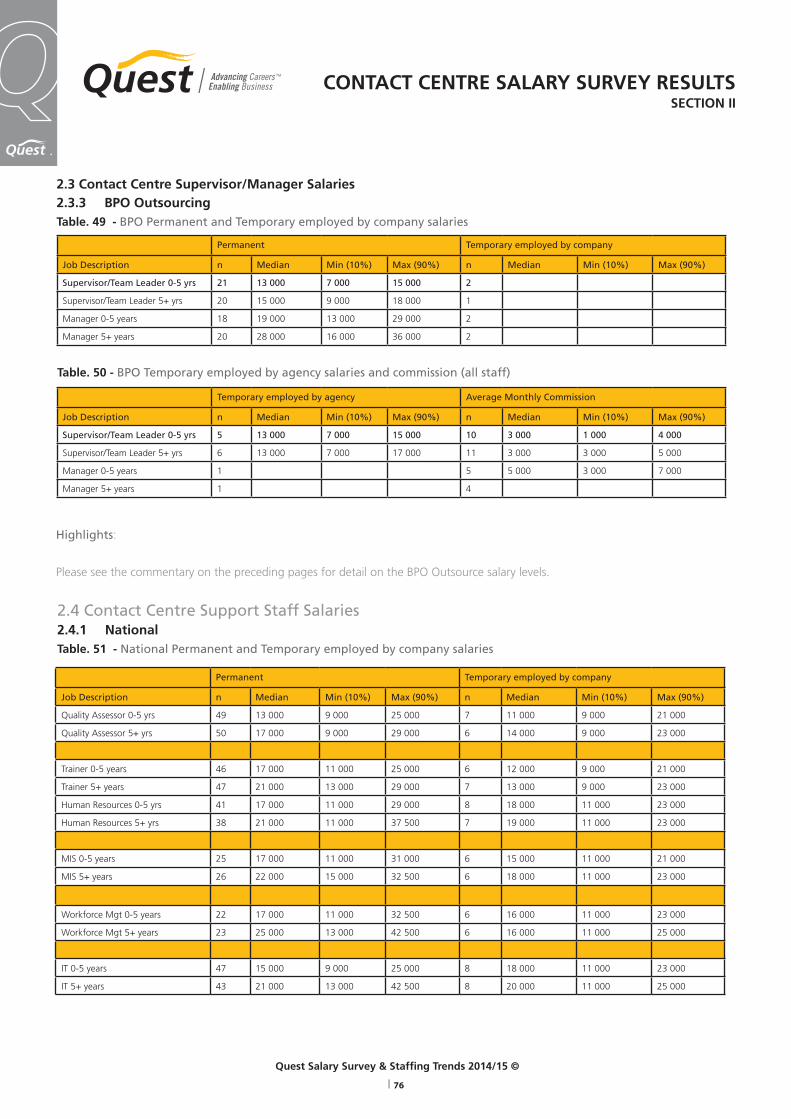
Quest Salary Survey & Staffing Trends 2014/15 ©
| 76
TM
2.3 Contact Centre Supervisor/Manager Salaries2.3.3 BPO OutsourcingTable. 49 - BPO Permanent and Temporary employed by company salaries
Permanent Temporary employed by company
Job Description n Median Min (10%) Max (90%) n Median Min (10%) Max (90%)
Supervisor/Team Leader 0-5 yrs 21 13 000 7 000 15 000 2
Supervisor/Team Leader 5+ yrs 20 15 000 9 000 18 000 1
Manager 0-5 years 18 19 000 13 000 29 000 2
Manager 5+ years 20 28 000 16 000 36 000 2
Temporary employed by agency Average Monthly Commission
Job Description n Median Min (10%) Max (90%) n Median Min (10%) Max (90%)
Supervisor/Team Leader 0-5 yrs 5 13 000 7 000 15 000 10 3 000 1 000 4 000
Supervisor/Team Leader 5+ yrs 6 13 000 7 000 17 000 11 3 000 3 000 5 000
Manager 0-5 years 1 5 5 000 3 000 7 000
Manager 5+ years 1 4
Highlights:
Please see the commentary on the preceding pages for detail on the BPO Outsource salary levels.
Table. 50 - BPO Temporary employed by agency salaries and commission (all staff)
2.4 Contact Centre Support Staff Salaries2.4.1 NationalTable. 51 - National Permanent and Temporary employed by company salaries
Permanent Temporary employed by company
Job Description n Median Min (10%) Max (90%) n Median Min (10%) Max (90%)
Quality Assessor 0-5 yrs 49 13 000 9 000 25 000 7 11 000 9 000 21 000
Quality Assessor 5+ yrs 50 17 000 9 000 29 000 6 14 000 9 000 23 000
Trainer 0-5 years 46 17 000 11 000 25 000 6 12 000 9 000 21 000
Trainer 5+ years 47 21 000 13 000 29 000 7 13 000 9 000 23 000
Human Resources 0-5 yrs 41 17 000 11 000 29 000 8 18 000 11 000 23 000
Human Resources 5+ yrs 38 21 000 11 000 37 500 7 19 000 11 000 23 000
MIS 0-5 years 25 17 000 11 000 31 000 6 15 000 11 000 21 000
MIS 5+ years 26 22 000 15 000 32 500 6 18 000 11 000 23 000
Workforce Mgt 0-5 years 22 17 000 11 000 32 500 6 16 000 11 000 23 000
Workforce Mgt 5+ years 23 25 000 13 000 42 500 6 16 000 11 000 25 000
IT 0-5 years 47 15 000 9 000 25 000 8 18 000 11 000 23 000
IT 5+ years 43 21 000 13 000 42 500 8 20 000 11 000 25 000
CONTACT CENTRE SALARY SURVEY RESULTSSECTION II
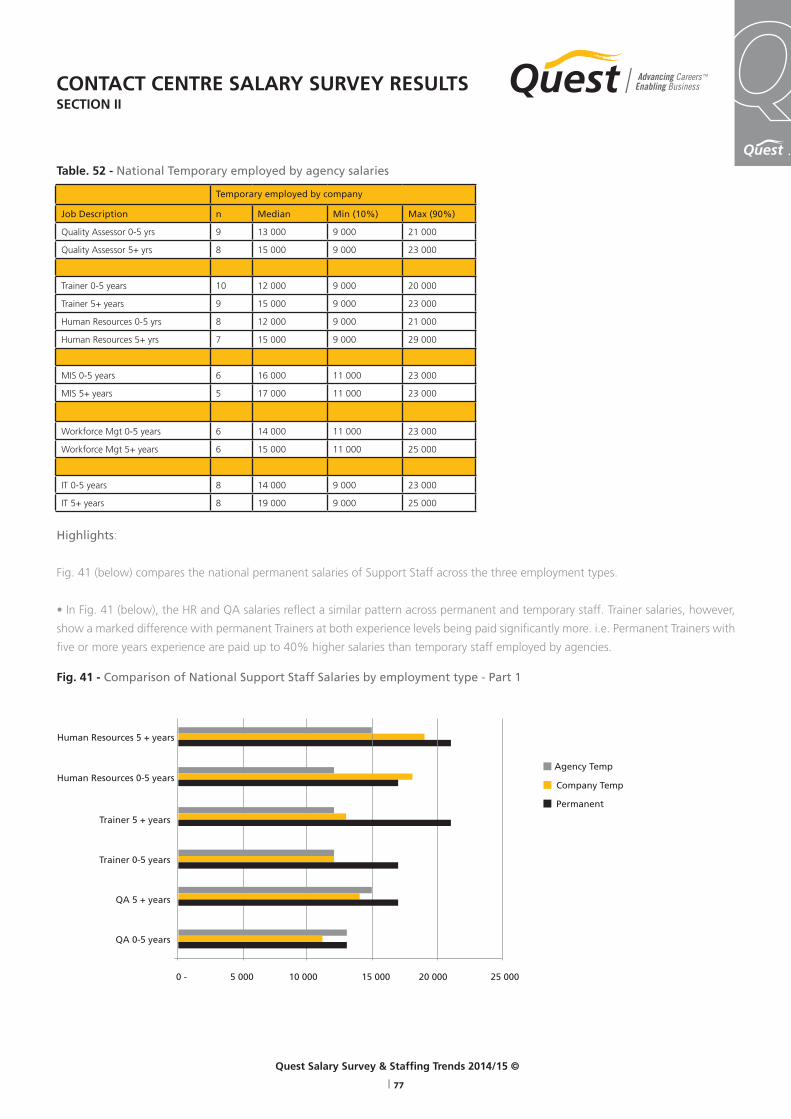
TM
Quest Salary Survey & Staffing Trends 2014/15 ©
| 77
Temporary employed by company
Job Description n Median Min (10%) Max (90%)
Quality Assessor 0-5 yrs 9 13 000 9 000 21 000
Quality Assessor 5+ yrs 8 15 000 9 000 23 000
Trainer 0-5 years 10 12 000 9 000 20 000
Trainer 5+ years 9 15 000 9 000 23 000
Human Resources 0-5 yrs 8 12 000 9 000 21 000
Human Resources 5+ yrs 7 15 000 9 000 29 000
MIS 0-5 years 6 16 000 11 000 23 000
MIS 5+ years 5 17 000 11 000 23 000
Workforce Mgt 0-5 years 6 14 000 11 000 23 000
Workforce Mgt 5+ years 6 15 000 11 000 25 000
IT 0-5 years 8 14 000 9 000 23 000
IT 5+ years 8 19 000 9 000 25 000
Table. 52 - National Temporary employed by agency salaries
Highlights:
Fig. 41 (below) compares the national permanent salaries of Support Staff across the three employment types.
• In Fig. 41 (below), the HR and QA salaries reflect a similar pattern across permanent and temporary staff. Trainer salaries, however,
show a marked difference with permanent Trainers at both experience levels being paid significantly more. i.e. Permanent Trainers with
five or more years experience are paid up to 40% higher salaries than temporary staff employed by agencies.
Fig. 41 - Comparison of National Support Staff Salaries by employment type - Part 1
CONTACT CENTRE SALARY SURVEY RESULTSSECTION II
Human Resources 5 + years
Human Resources 0-5 years
Trainer 5 + years
Trainer 0-5 years
QA 5 + years
QA 0-5 years
Agency Temp
Company Temp
Permanent
0 - 5 000 10 000 15 000 20 000 25 000
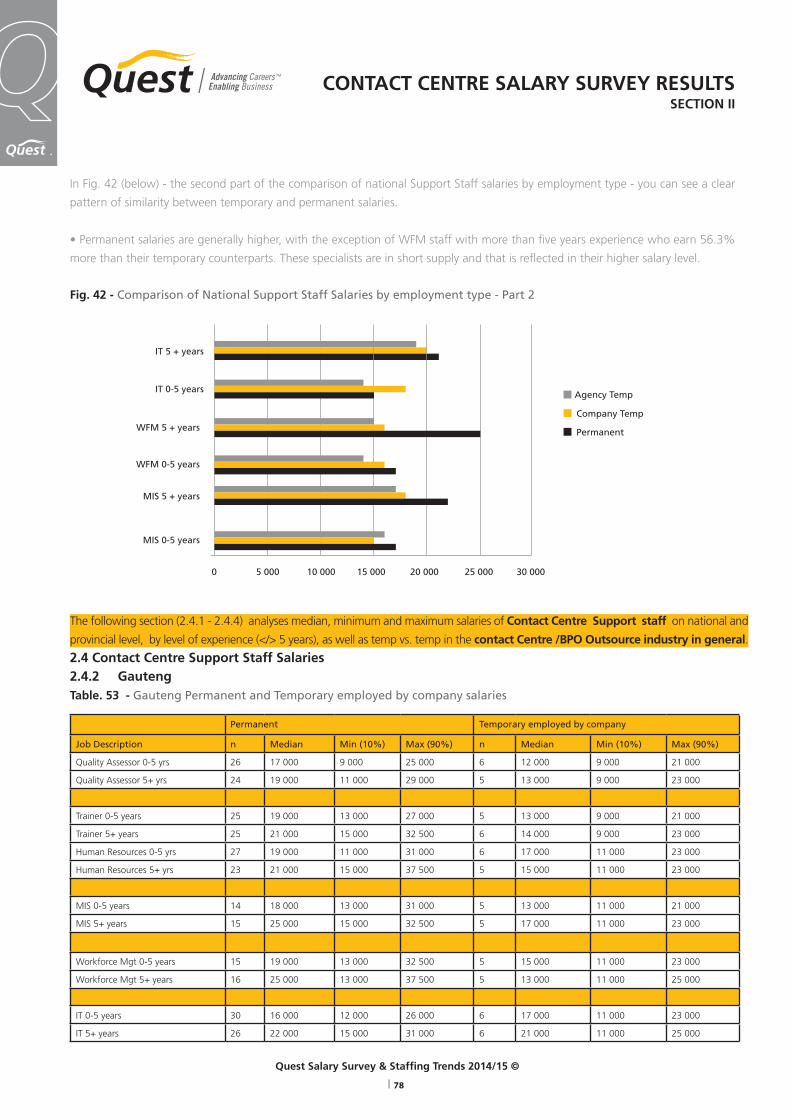
Quest Salary Survey & Staffing Trends 2014/15 ©
| 78
TM
In Fig. 42 (below) - the second part of the comparison of national Support Staff salaries by employment type - you can see a clear
pattern of similarity between temporary and permanent salaries.
• Permanent salaries are generally higher, with the exception of WFM staff with more than five years experience who earn 56.3%
more than their temporary counterparts. These specialists are in short supply and that is reflected in their higher salary level.
Fig. 42 - Comparison of National Support Staff Salaries by employment type - Part 2
The following section (2.4.1 - 2.4.4) analyses median, minimum and maximum salaries of Contact Centre Support staff on national and
provincial level, by level of experience (</> 5 years), as well as temp vs. temp in the contact Centre /BPO Outsource industry in general.
2.4 Contact Centre Support Staff Salaries2.4.2 GautengTable. 53 - Gauteng Permanent and Temporary employed by company salaries
Permanent Temporary employed by company
Job Description n Median Min (10%) Max (90%) n Median Min (10%) Max (90%)
Quality Assessor 0-5 yrs 26 17 000 9 000 25 000 6 12 000 9 000 21 000
Quality Assessor 5+ yrs 24 19 000 11 000 29 000 5 13 000 9 000 23 000
Trainer 0-5 years 25 19 000 13 000 27 000 5 13 000 9 000 21 000
Trainer 5+ years 25 21 000 15 000 32 500 6 14 000 9 000 23 000
Human Resources 0-5 yrs 27 19 000 11 000 31 000 6 17 000 11 000 23 000
Human Resources 5+ yrs 23 21 000 15 000 37 500 5 15 000 11 000 23 000
MIS 0-5 years 14 18 000 13 000 31 000 5 13 000 11 000 21 000
MIS 5+ years 15 25 000 15 000 32 500 5 17 000 11 000 23 000
Workforce Mgt 0-5 years 15 19 000 13 000 32 500 5 15 000 11 000 23 000
Workforce Mgt 5+ years 16 25 000 13 000 37 500 5 13 000 11 000 25 000
IT 0-5 years 30 16 000 12 000 26 000 6 17 000 11 000 23 000
IT 5+ years 26 22 000 15 000 31 000 6 21 000 11 000 25 000
CONTACT CENTRE SALARY SURVEY RESULTSSECTION II
IT 5 + years
IT 0-5 years
WFM 5 + years
WFM 0-5 years
MIS 5 + years
MIS 0-5 years
Agency Temp
Company Temp
Permanent
0 5 000 10 000 15 000 20 000 25 000 30 000
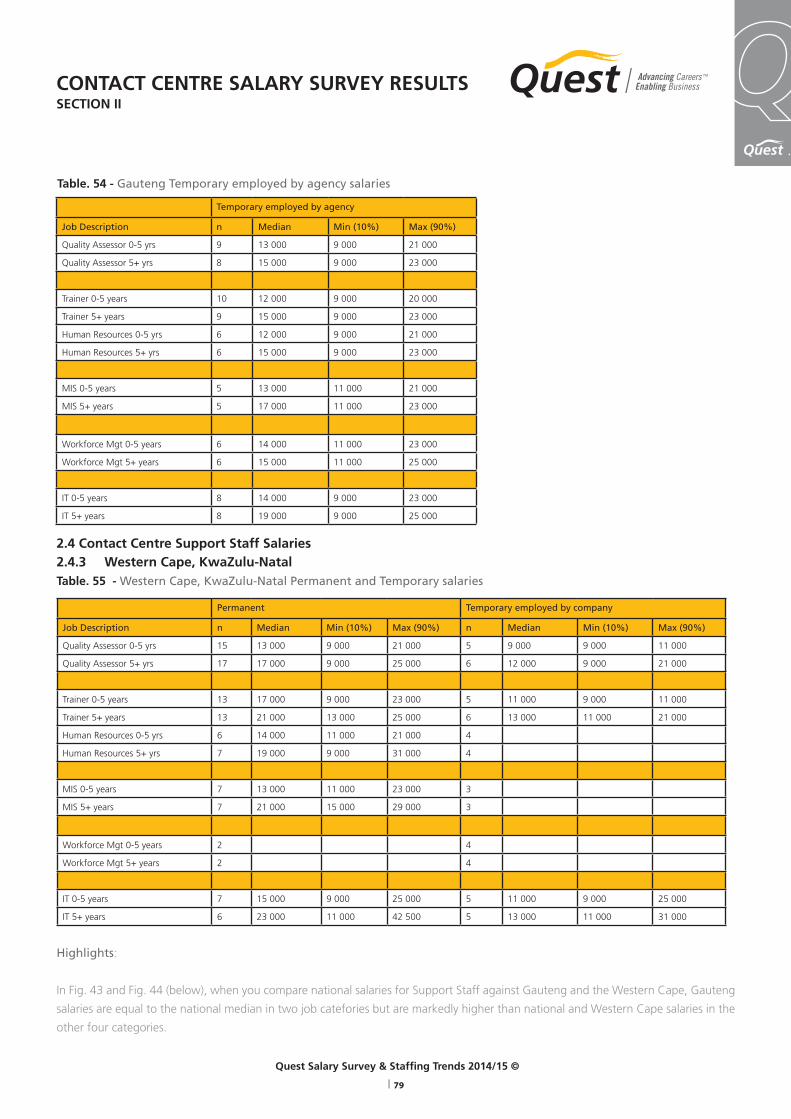
TM
Quest Salary Survey & Staffing Trends 2014/15 ©
| 79
Temporary employed by agency
Job Description n Median Min (10%) Max (90%)
Quality Assessor 0-5 yrs 9 13 000 9 000 21 000
Quality Assessor 5+ yrs 8 15 000 9 000 23 000
Trainer 0-5 years 10 12 000 9 000 20 000
Trainer 5+ years 9 15 000 9 000 23 000
Human Resources 0-5 yrs 6 12 000 9 000 21 000
Human Resources 5+ yrs 6 15 000 9 000 23 000
MIS 0-5 years 5 13 000 11 000 21 000
MIS 5+ years 5 17 000 11 000 23 000
Workforce Mgt 0-5 years 6 14 000 11 000 23 000
Workforce Mgt 5+ years 6 15 000 11 000 25 000
IT 0-5 years 8 14 000 9 000 23 000
IT 5+ years 8 19 000 9 000 25 000
Table. 54 - Gauteng Temporary employed by agency salaries
2.4 Contact Centre Support Staff Salaries2.4.3 Western Cape, KwaZulu-NatalTable. 55 - Western Cape, KwaZulu-Natal Permanent and Temporary salaries
Permanent Temporary employed by company
Job Description n Median Min (10%) Max (90%) n Median Min (10%) Max (90%)
Quality Assessor 0-5 yrs 15 13 000 9 000 21 000 5 9 000 9 000 11 000
Quality Assessor 5+ yrs 17 17 000 9 000 25 000 6 12 000 9 000 21 000
Trainer 0-5 years 13 17 000 9 000 23 000 5 11 000 9 000 11 000
Trainer 5+ years 13 21 000 13 000 25 000 6 13 000 11 000 21 000
Human Resources 0-5 yrs 6 14 000 11 000 21 000 4
Human Resources 5+ yrs 7 19 000 9 000 31 000 4
MIS 0-5 years 7 13 000 11 000 23 000 3
MIS 5+ years 7 21 000 15 000 29 000 3
Workforce Mgt 0-5 years 2 4
Workforce Mgt 5+ years 2 4
IT 0-5 years 7 15 000 9 000 25 000 5 11 000 9 000 25 000
IT 5+ years 6 23 000 11 000 42 500 5 13 000 11 000 31 000
Highlights:
In Fig. 43 and Fig. 44 (below), when you compare national salaries for Support Staff against Gauteng and the Western Cape, Gauteng
salaries are equal to the national median in two job catefories but are markedly higher than national and Western Cape salaries in the
other four categories.
CONTACT CENTRE SALARY SURVEY RESULTSSECTION II
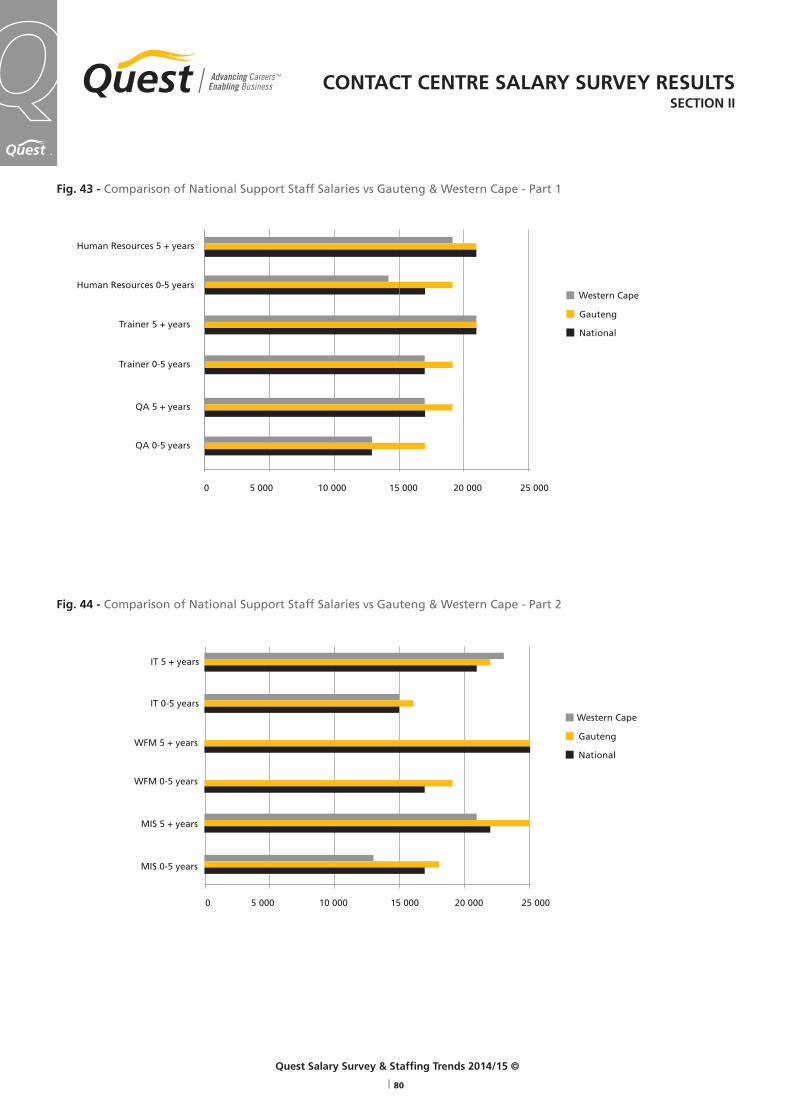
Quest Salary Survey & Staffing Trends 2014/15 ©
| 80
TM
Fig. 43 - Comparison of National Support Staff Salaries vs Gauteng & Western Cape - Part 1
Fig. 44 - Comparison of National Support Staff Salaries vs Gauteng & Western Cape - Part 2
CONTACT CENTRE SALARY SURVEY RESULTSSECTION II
Human Resources 5 + years
Human Resources 0-5 years
Trainer 5 + years
Trainer 0-5 years
QA 5 + years
QA 0-5 years
Western Cape
Gauteng
National
0 5 000 10 000 15 000 20 000 25 000
IT 5 + years
IT 0-5 years
WFM 5 + years
WFM 0-5 years
MIS 5 + years
MIS 0-5 years
Western Cape
Gauteng
National
0 5 000 10 000 15 000 20 000 25 000
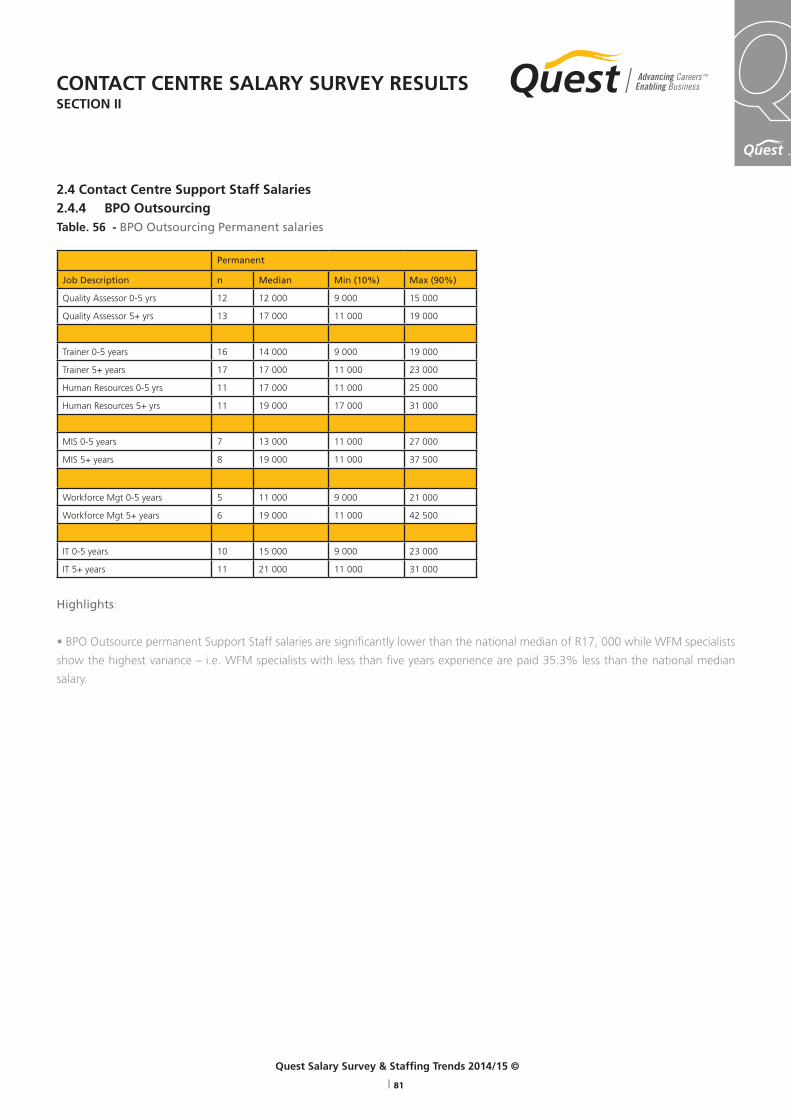
TM
Quest Salary Survey & Staffing Trends 2014/15 ©
| 81
2.4 Contact Centre Support Staff Salaries2.4.4 BPO OutsourcingTable. 56 - BPO Outsourcing Permanent salaries
Permanent
Job Description n Median Min (10%) Max (90%)
Quality Assessor 0-5 yrs 12 12 000 9 000 15 000
Quality Assessor 5+ yrs 13 17 000 11 000 19 000
Trainer 0-5 years 16 14 000 9 000 19 000
Trainer 5+ years 17 17 000 11 000 23 000
Human Resources 0-5 yrs 11 17 000 11 000 25 000
Human Resources 5+ yrs 11 19 000 17 000 31 000
MIS 0-5 years 7 13 000 11 000 27 000
MIS 5+ years 8 19 000 11 000 37 500
Workforce Mgt 0-5 years 5 11 000 9 000 21 000
Workforce Mgt 5+ years 6 19 000 11 000 42 500
IT 0-5 years 10 15 000 9 000 23 000
IT 5+ years 11 21 000 11 000 31 000
Highlights:
• BPO Outsource permanent Support Staff salaries are significantly lower than the national median of R17, 000 while WFM specialists
show the highest variance – i.e. WFM specialists with less than five years experience are paid 35.3% less than the national median
salary.
CONTACT CENTRE SALARY SURVEY RESULTSSECTION II

Quest Salary Survey & Staffing Trends 2014/15 ©
| 82
TM
3 AN OUTLOOK ON SERVICES OFFERED BY RECRUITMENT AGENCIES
TM
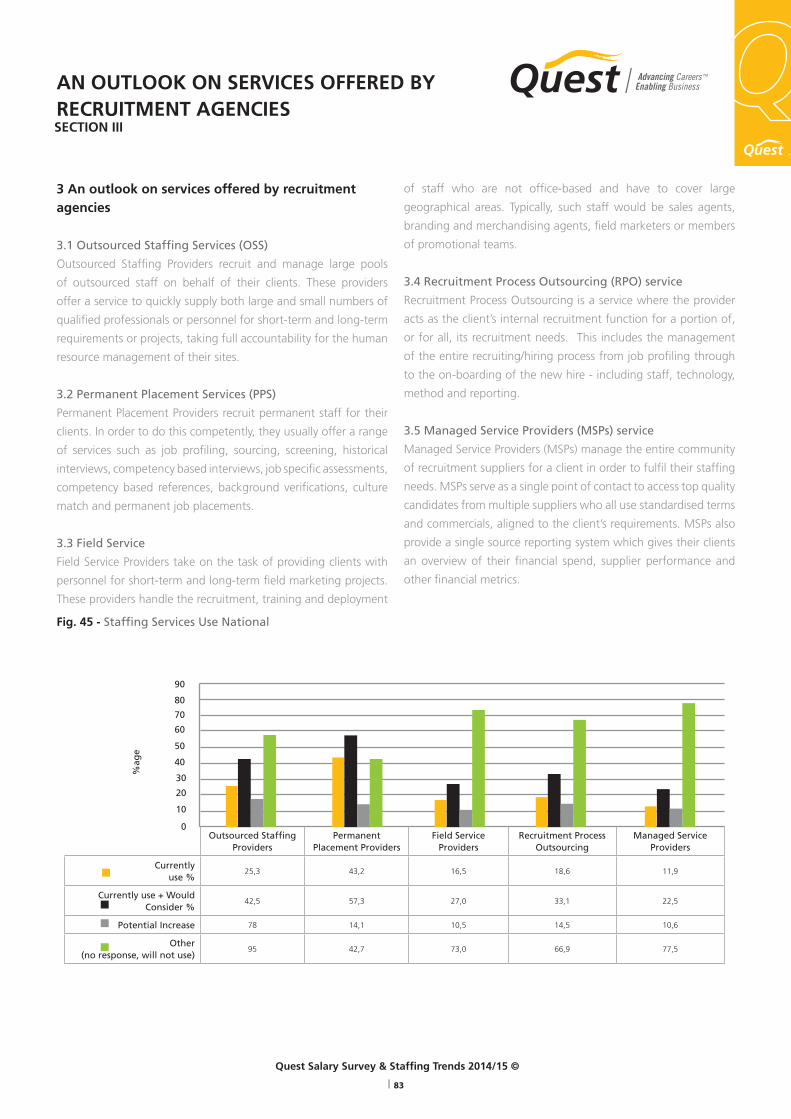
TM
Quest Salary Survey & Staffing Trends 2014/15 ©
| 83
AN OUTLOOK ON SERVICES OFFERED BY RECRUITMENT AGENCIESSECTION III
3 An outlook on services offered by recruitment agencies
3.1 Outsourced Staffing Services (OSS)
Outsourced Staffing Providers recruit and manage large pools
of outsourced staff on behalf of their clients. These providers
offer a service to quickly supply both large and small numbers of
qualified professionals or personnel for short-term and long-term
requirements or projects, taking full accountability for the human
resource management of their sites.
3.2 Permanent Placement Services (PPS)
Permanent Placement Providers recruit permanent staff for their
clients. In order to do this competently, they usually offer a range
of services such as job profiling, sourcing, screening, historical
interviews, competency based interviews, job specific assessments,
competency based references, background verifications, culture
match and permanent job placements.
3.3 Field Service
Field Service Providers take on the task of providing clients with
personnel for short-term and long-term field marketing projects.
These providers handle the recruitment, training and deployment
of staff who are not office-based and have to cover large
geographical areas. Typically, such staff would be sales agents,
branding and merchandising agents, field marketers or members
of promotional teams.
3.4 Recruitment Process Outsourcing (RPO) service
Recruitment Process Outsourcing is a service where the provider
acts as the client’s internal recruitment function for a portion of,
or for all, its recruitment needs. This includes the management
of the entire recruiting/hiring process from job profiling through
to the on-boarding of the new hire - including staff, technology,
method and reporting.
3.5 Managed Service Providers (MSPs) service
Managed Service Providers (MSPs) manage the entire community
of recruitment suppliers for a client in order to fulfil their staffing
needs. MSPs serve as a single point of contact to access top quality
candidates from multiple suppliers who all use standardised terms
and commercials, aligned to the client’s requirements. MSPs also
provide a single source reporting system which gives their clients
an overview of their financial spend, supplier performance and
other financial metrics.
Fig. 45 - Staffing Services Use National
0
10
20
30
40
50
60
70
%ag
e
Outsourced Staffing Providers
Permanent Placement Providers
Field Service Providers
Recruitment ProcessOutsourcing
Managed ServiceProviders
Currently use %
25,3 43,2 16,5 18,6 11,9
Currently use + Would Consider %
42,5 57,3 27,0 33,1 22,5
Potential Increase 78 14,1 10,5 14,5 10,6
Other (no response, will not use)
95 42,7 73,0 66,9 77,5
80
90
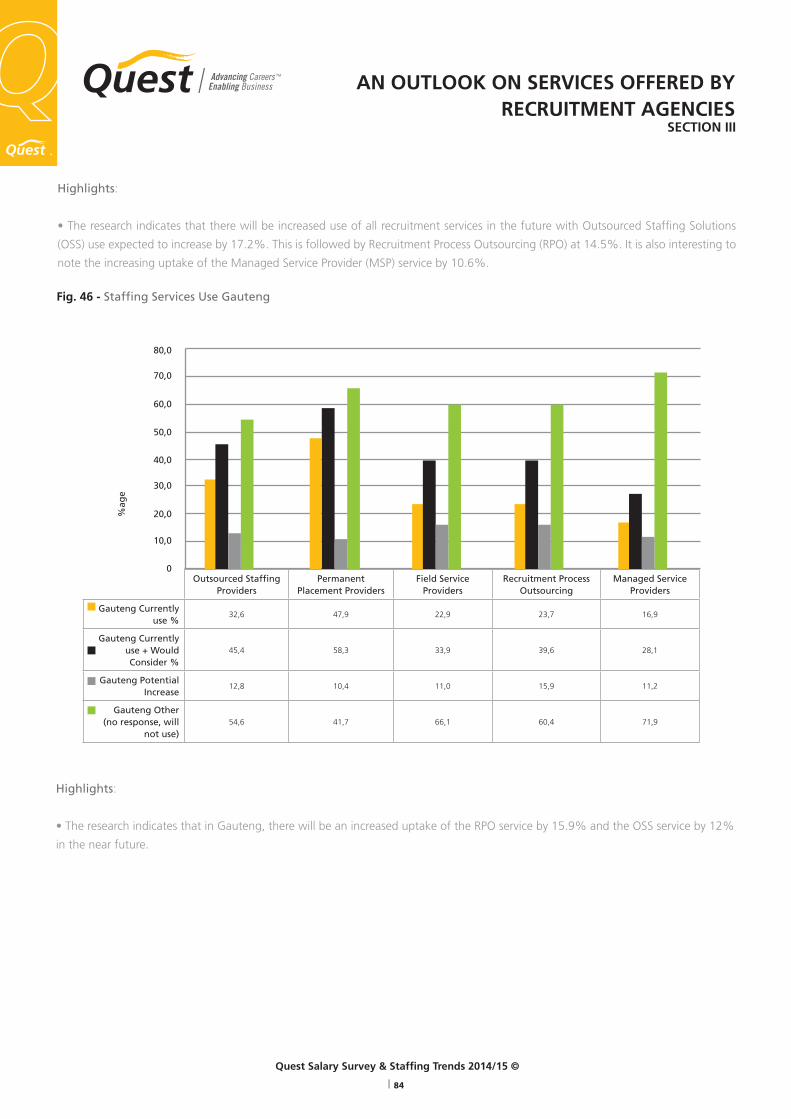
Quest Salary Survey & Staffing Trends 2014/15 ©
| 84
TM
AN OUTLOOK ON SERVICES OFFERED BY RECRUITMENT AGENCIES
SECTION III
Highlights:
• The research indicates that there will be increased use of all recruitment services in the future with Outsourced Staffing Solutions
(OSS) use expected to increase by 17.2%. This is followed by Recruitment Process Outsourcing (RPO) at 14.5%. It is also interesting to
note the increasing uptake of the Managed Service Provider (MSP) service by 10.6%.
Fig. 46 - Staffing Services Use Gauteng
Highlights:
• The research indicates that in Gauteng, there will be an increased uptake of the RPO service by 15.9% and the OSS service by 12%
in the near future.
0
10,0
30,0
40,0
50,0
60,0
70,0
80,0
%ag
e
Outsourced Staffing Providers
Permanent Placement Providers
Field Service Providers
Recruitment ProcessOutsourcing
Managed ServiceProviders
Gauteng Currently use %
32,6 47,9 22,9 23,7 16,9
Gauteng Currently use + Would Consider %
45,4 58,3 33,9 39,6 28,1
Gauteng Potential Increase
12,8 10,4 11,0 15,9 11,2
Gauteng Other (no response, will
not use)54,6 41,7 66,1 60,4 71,9
20,0
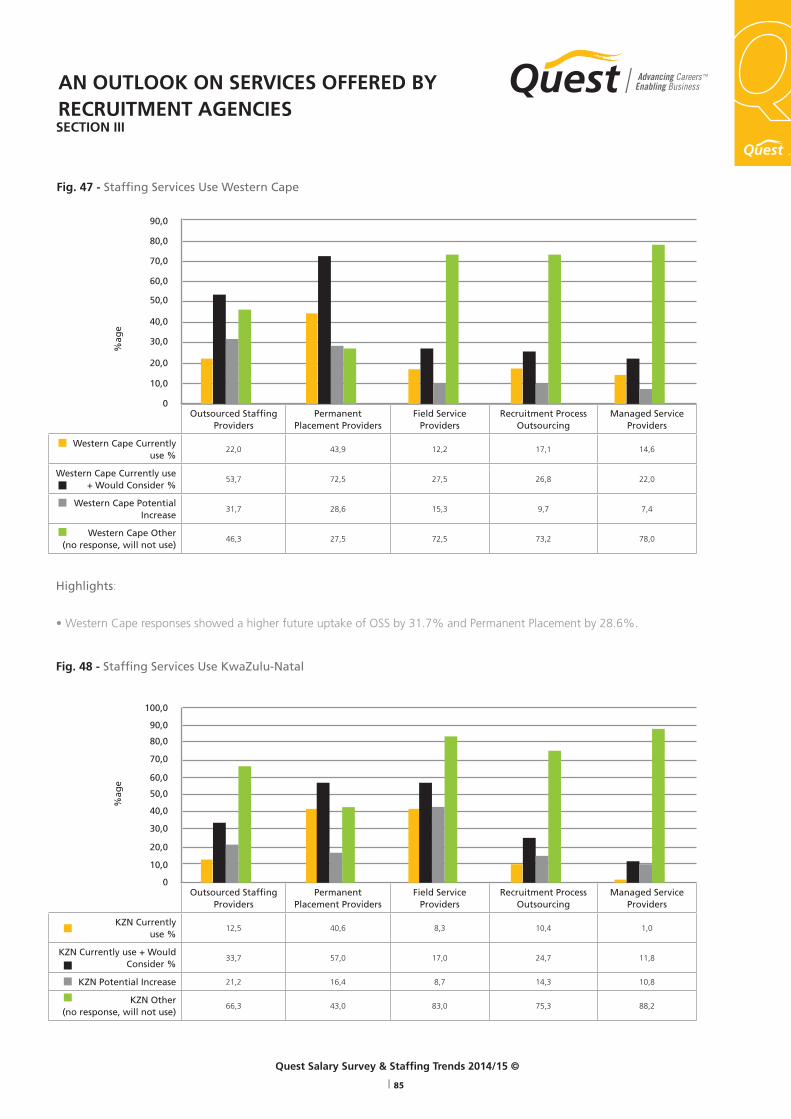
TM
Quest Salary Survey & Staffing Trends 2014/15 ©
| 85
Fig. 47 - Staffing Services Use Western Cape
Highlights:
• Western Cape responses showed a higher future uptake of OSS by 31.7% and Permanent Placement by 28.6%.
Fig. 48 - Staffing Services Use KwaZulu-Natal
AN OUTLOOK ON SERVICES OFFERED BY RECRUITMENT AGENCIESSECTION III
0
10,0
20,0
30,0
40,0
50,0
60,0
90,0
%ag
e
Outsourced Staffing Providers
Permanent Placement Providers
Field Service Providers
Recruitment ProcessOutsourcing
Managed ServiceProviders
Western Cape Currently use %
22,0 43,9 12,2 17,1 14,6
Western Cape Currently use + Would Consider %
53,7 72,5 27,5 26,8 22,0
Western Cape Potential Increase
31,7 28,6 15,3 9,7 7,4
Western Cape Other (no response, will not use)
46,3 27,5 72,5 73,2 78,0
0
10,0
30,0
40,0
50,0
70,0
80,0
100,0
%ag
e
Outsourced Staffing Providers
Permanent Placement Providers
Field Service Providers
Recruitment ProcessOutsourcing
Managed ServiceProviders
KZN Currently use %
12,5 40,6 8,3 10,4 1,0
KZN Currently use + Would Consider %
33,7 57,0 17,0 24,7 11,8
KZN Potential Increase 21,2 16,4 8,7 14,3 10,8
KZN Other (no response, will not use)
66,3 43,0 83,0 75,3 88,2
80,0
70,0
90,0
60,0
20,0
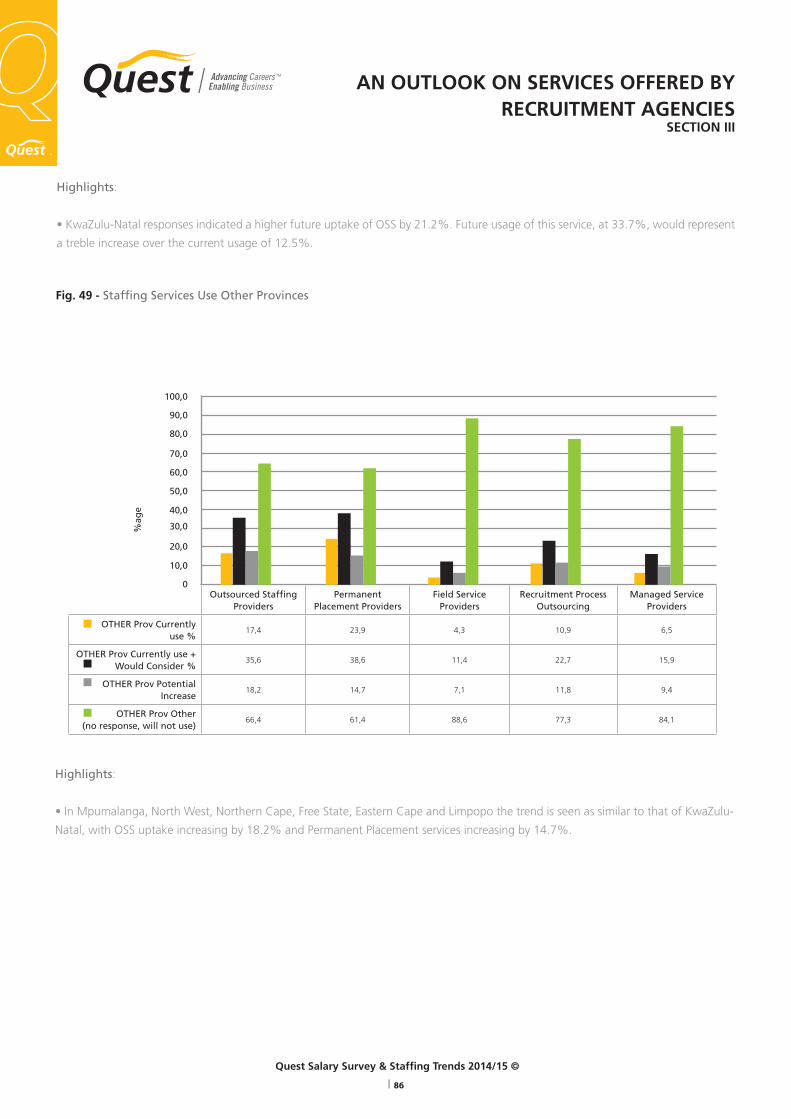
Quest Salary Survey & Staffing Trends 2014/15 ©
| 86
TM
Highlights:
• KwaZulu-Natal responses indicated a higher future uptake of OSS by 21.2%. Future usage of this service, at 33.7%, would represent
a treble increase over the current usage of 12.5%.
Fig. 49 - Staffing Services Use Other Provinces
Highlights:
• In Mpumalanga, North West, Northern Cape, Free State, Eastern Cape and Limpopo the trend is seen as similar to that of KwaZulu-
Natal, with OSS uptake increasing by 18.2% and Permanent Placement services increasing by 14.7%.
AN OUTLOOK ON SERVICES OFFERED BY RECRUITMENT AGENCIES
SECTION III
0
10,0
20,0
30,0
40,0
50,0
100,0
%ag
e
Outsourced Staffing Providers
Permanent Placement Providers
Field Service Providers
Recruitment ProcessOutsourcing
Managed ServiceProviders
OTHER Prov Currently use %
17,4 23,9 4,3 10,9 6,5
OTHER Prov Currently use + Would Consider %
35,6 38,6 11,4 22,7 15,9
OTHER Prov Potential Increase
18,2 14,7 7,1 11,8 9,4
OTHER Prov Other (no response, will not use)
66,4 61,4 88,6 77,3 84,1
90,0
80,0
70,0
60,0

TM
Quest Salary Survey & Staffing Trends 2014/15 ©
| 87
4 QUEST’S PICK OF THE KEY STAFFING AND RECRUITMENT TRENDS FOR 2014/15
TM
Quest Salary Survey & Staffing Trends 2014/15 ©
| 88
TM
4.1 EMPLOYER TRENDSSkills shortages, new individualised working arrangements, the
increasing importance of social media and the employment
brand of a company have had an impact on talent access and
acquisition worldwide. In order to compete for the very best
talent in a particular industry, companies are upping the ante and
incorporating innovation, social media, marketing and adopting
global approaches to their recruiting strategy. Now, more than
ever, employers need to keep up-to-date with a continuously
growing number of recruitment trends to remain competitive.
1. Increasing uptake of Recruitment Process Outsourcing
(RPO)
In South Africa, Recruitment Process Outsourcing (RPO) is
fast becoming a popular staffing model with organisations
outsourcing part - or all - of their recruitment process. This trend
comes as a result of the need for companies to focus on their
core business practices and generating revenue while sparing
them the hassles resulting from a lack of resources, time and the
operational costs associated with in-house recruiting. Because
recruitment professionals have more experience in the field and
talent market, outsourcing this responsibility not only translates
into cost and time savings but also into higher quality hires.
2. Managed Service Provider (MSP) and Vendor Management
System (VMS) use on the rise in South Africa
Given the reality of companies - often large corporates - using
multiple service providers, the use of Managed Service Providers
(MSPs) has become a growing trend. MSPs are experienced
staffing firms who take on the primary responsibility of managing
clients’ outsourced workforce programmes and their many service
providers. MSPs are responsible for programme management,
reporting and tracking, supplier selection and management, order
distribution and consolidated billing - all of which are enabled
through a Vendor Management System (VMS). Companies that
make use of MSP services experience increased efficiencies and
a significant return on investment arising from simplified staffing
requisition with a centralised point of contact.
3. Statement of Work (SOW) for well-defined projects
A statement of work (SOW) is a formal document which lists
the detailed requirements, pricing and standard regulatory and
governance terms and conditions which a vendor needs to
abide by for a client specified project. SOW contracting provides
companies with greater opportunities for cost containment and
shifting cost risks away from employers, it is therefore likely to
grow in popularity.
4. Using a blend of staffing models
Companies are increasingly using a blend of staffing models -
which include full time employees, contractors, telecommuters
and freelancers - in order to ensure the most cost and time
effective result. However, the growth of this trend increases the
complexity of management and therefore translates into a need
for companies to learn how to manage hiring in a consistent and
focused manner. A solution to this is the use of the Managed
Service Provider (MSP) model.
5. A temporary workforce becoming a permanent corporate
strategy
Temporary recruitment has reached an all time high in terms
of penetrating the labour market and staffing providers are
increasingly providing staffing models which align with their
clients’ needs in this regard. According to research conducted
by Adcorp in 2014, 3.9 million workers representing 29% of
total employment in South Africa are temporary in nature. The
increasing popularity of this trend is likely to continue into 2015.
6. Bring You Own Device (BYOD)
The emerging trend of ‘bring your own device’ (BYOD) is an
IT policy whereby employees are allowed or encouraged to
use their personal mobile devices and notebook PCs to access
company data and systems. According to a global survey of Chief
Information Officers (CIOs) by USA based Gartner Inc, 38% of
companies expect to discontinue providing devices to workers
by 2016. Countries and industries which have adopted BYOD
have reported an increase in productivity, innovation, employee
satisfaction and potential cost savings. This is because employees
are more comfortable with their personal devices.
7. Made-to-order employment relationships
An increase in the adoption of remote working has resulted in
the emerging trend of ‘made-to-order’ employment relationships,
personified by individualised arrangements such as flexi-hours or
telecommuting - where employees work from home for an agreed
number of days or hours per week. The uptake of this trend, in all
its individualised forms, has resulted in a motivated and engaged
workforce as employees find these arrangements less stressful.
QUEST’S PICK OF THE KEY STAFFING AND RECRUITMENT TRENDS FOR 2014/15
SECTION IV

TM
Quest Salary Survey & Staffing Trends 2014/15 ©
| 89
8. Use of an ‘in the same box’ workforce
Innovative providers of contingent staffing are increasingly
finding creative ways to source affordable labour with niche
knowledge and/or specialised skills. An example of this ‘in the
same box’ workforce is Miramar Arise Virtual Solutions in the US,
which selected independent contractor call centre representatives
partially on the basis of their health status. Miramar CEO, John
Meyer, reports having independent agents with diabetes working
as contractors in their network of call centres to sell to diabetics.
9. Increasing focus on candidate experience
Improving the ‘candidate experience’ is increasingly becoming a
significant factor in the recruitment process. The trend of providing
positive candidate experiences is partially motivated by the increase
in social spaces and mobile platforms for recruitment. A positive
candidate experience allows recruiters the opportunity to forge
relationships which may be useful for future talent pipelines. On
the other hand, a weak candidate experience can easily damage
a recruiter’s reputation. Recruiters can attempt to ensure great
candidate experiences through efforts in personalising processes
and making them accessible and enjoyable to more than 70%
of candidates they are in contact with. Now – more than ever –
recruiters will shift toward using tools like “manage the candidate
experience” to measure and continuously improve the recruiting
and interview process.
10. Mobile recruiting
Despite the lack of access to communication technology in
terms of desktop and mobile computers in South Africa, almost
everyone has a cellular phone and as a result, mobile recruitment
has become an emerging trend with many job portals having
already embraced the mobile recruitment space. Mobile
platforms enable direct and instant application for jobs from
mobile phones. According to the Deloitte Global Human Capital
Trends Report 2014, nearly 45% of job candidates now apply for
jobs on mobile devices and by 2018, 50% of the workforce will
be millennials aged 24 to 34 who are engaged with social and
mobile technology.
11. Online assessments in the selection of candidates
Advances in technology and the decreasing cost of technical
knowledge and skill assessment options have resulted in the
development of new and innovative assessment methods. An
example of such a method includes the increasingly popular online
assessment. Online assessments reduce unnecessary interviews
and can dramatically improve the quality of hire. Employers
can also cross-check applications against online information for
candidates under consideration for interview. Many recruiters
have begun viewing potential candidates’ Facebook, Twitter and
other social media profiles before they even think of interviewing
or hiring them. This growing trend of online assessments means
that candidates need to be more actively engaged so as not to
miss opportunities. A rounded LinkedIn profile, an insightful blog
and an active Twitter presence all add strongly to a candidate’s
chances of reaching the interview stage.
12. Social media recruiting
The social media space has opened up a new platform for
sourcing candidates via the internet and is a trend which is likely
to increase in popularity. Proactive companies have therefore
already begun seeking the assistance of specialist firms to help
them create an online presence that enables them to attract
both candidates and clients. The amount of information given
by candidates on social platforms enables recruiters to market
to potential candidates who are right for the job instead of
receiving thousands of CV’s – ultimately saving what is often a
massive amount of time. Employers are increasingly considering
candidates’ ‘digital footprints’ in their hiring decisions.
13. Increasing social integration
The use of the social media has led to an increase in social
integration and an emerging trend of job seekers applying
for positions at companies recommended by their peers.
Recommendations from friends are increasingly carrying weight
online and in real life. The emergence of this trend has resulted
in the need for companies to join the conversation and create
a Facebook page and Twitter profile. As with individuals, there
is also a need for companies to maintain a clean online digital
footprint projecting a positive, professional and fun image on
their websites and social media profiles.
14. Video interviewing
The traditional interview is still one of the major selection
methods for recruitment but recruiters are fast adopting a new
outlook on this method both in terms of the medium through
which interviews are conducted and the manner in which they are
conducted. The trend of video interviewing/virtual interviewing
has been adopted across the globe but is, to a large extent, still in
QUEST’S PICK OF THE KEY STAFFING AND RECRUITMENT TRENDS FOR 2014/15SECTION IV

Quest Salary Survey & Staffing Trends 2014/15 ©
| 90
TM
its infancy in South Africa. According to US based Hogan (2014),
video job descriptions, video interviewing and ‘day-in-the-life’
videos are utilised by 60% of companies and video interviewing
has grown by 49% in the last two years.
15. Personal branding gets you the job
The personal branding of candidates is likely to play a bigger
role in employers’ decisions in terms of which candidate gets the
job. Every individual can be seen as their own personal brand
ambassador and when combined with a clean digital footprint, is
increasingly becoming a deciding factor considered by employers
when hiring candidates. When candidates put a lot of effort
into building their personal brand, they stand out from the rest.
Personal branding communicates that a candidate has both
dedication and passion for what they do.
16. Employee off-boarding is increasingly critical for
maintaining a company’s brand
A well off-boarded employee is unlikely to say anything negative
about the company and its brand and therefore helps maintain the
company’s attractiveness in the market. To reduce risk exposure,
the off-boarding process should be applied consistently to all
types of employee separations and has, to a large extent, become
possible through the use of off-boarding technology. Going
forward, there is likely to be increased focus on how employees
are transitioned out of a company instead of primarily on how
they are hired. This may also have implications for future hires.
17. Big Data for predictive metrics, better hiring and
branding decisions
Organisations have begun identifying hundreds of top performers
in various industries who are not currently looking for a job (the
so-called ‘passives’) using external ‘Big Data’. These advanced
metric developments are a result of the established trend of
shifting recruiting toward a data-supported decision model.
Predictive metrics and the use of Big Data have therefore moved
from being interesting to essential in driving real decision making.
Companies which sell data, tools and analytics services have also
emerged to help companies assess, analyse and improve the
recruiting process.
18. Hiring candidates without degrees or standard
credentials
An emerging trend for the future appears to be one where
employers value experience over academic excellence. Although
a top-end qualification always counts, it is no longer the be-
all and end-all in the selection and hiring of candidates. While
some positions absolutely require a degree, there are others for
which the merits of a specialised degree are debatable. Major
international companies like Google and Facebook have already
had notable success with hiring individuals regardless of their
degree status.
19. Employers are looking for heart, brain and brawn
An emerging trend of the future is towards recognising a
prospective employees’ passion for their chosen profession. As a
result of this shift towards a need for a candidate’s ‘heart to be in
it’, strengths-based interviews are taking over from competency-
based interviews. The reasoning behind this is that strengths are
judged to engage enthusiasm which typically leads to higher
performance than that flowing purely from competencies.
In essence, companies of the future will focus on building the
perfect employee instead of waiting for one.
20. A barrage of new assessment science
The science of human assessment will never stand still. The Myer-
Briggs and hundreds of other personality and skills assessments
have been around for decades. Today, driven largely by the power
of ‘the cloud’, there seem to be an explosion of new assessment
tools and the market is growing with new providers who not only
provide validated tests but also collect employee performance
data to provide real-time feedback on the tests themselves.
21. Building an end-to-end talent brand
A company’s real employment brand walks out the door every
evening, talking with their friends, posting information on
Facebook and possibly complaining about your company – this
employment brand starts and ends with a company’s employees.
In order to recruit the right employees for a company, recruiters
are increasingly working directly with the Senior Vice President
of Marketing to create a research-based, authentic employment
brand and promote it on the front page of the company website.
A modern talent brand is highly specific, authentic and narrow
and therefore attracts only the right people who can identify with
a company in relation to this.
22. Competitive analysis is still not standard practice
Although recruiting is a competition of who can get the best
candidate in a particular industry, most recruiting is almost 100%
internally focused. The recruiting function will eventually have
QUEST’S PICK OF THE KEY STAFFING AND RECRUITMENT TRENDS FOR 2014/15
SECTION IV

TM
Quest Salary Survey & Staffing Trends 2014/15 ©
| 91
to develop ways of tracking and countering competitors’ major
recruiting and employer branding moves. Firms will therefore
eventually begin to “map” their future talent pipeline. More firms
will also eventually learn to use professional learning communities
as talent pools, while others will use pre-need employee referrals to
develop this talent pipeline based on employee recommendations.
4.2 EMPLOYEE TRENDS Recruitment is ultimately a competition to find and recruit the
best talent in a particular industry. To attract top candidates, it is
crucial for employers to understand which attributes motivate and
inspire potential employees to invest their talent in a company.
Although people are attracted to a company for different reasons,
here are some of the common attributes candidates look for in a
new employer:
1. Company reputation and brand
The most popular companies to work for – like Google (number
one in Fortune: 100 Best companies to work for 2014) - have
strong brand recognition and a reputation for excellence in the
market and this makes them attractive to young, ambitious job
seekers. However, candidates may not rely solely on what the
company has to say about itself and its journey and choose to
dig deeper to gain insight on what it is really like to work for the
company. The most cost effective method of employer branding,
by far, is word-of-mouth and the most powerful word-of-mouth
testimonials come from a company’s current workforce. Whether
a company’s employees are brand ambassadors or critics could
therefore mean the difference between a company recruiting top
talent, or not.
2. Positive working environment and being part of a team
For current and potential employees alike, feeling as though they
are (or will be) part of a team and contribute to the ‘bigger picture’
creates a sense of pride in their work and in the organisation as a
whole. Creating a positive work environment, in which a candidate
wants to work and be a part of ‘the team’, relies on a variety
of factors. These include: the look and feel of the company; the
morale of current employees; inclusion of employees in decision
making; and the company’s efforts in organising team building
and staff networking get-togethers to motivate staff or celebrate
accomplishments.
What makes a company an attractive place to work? A poll
conducted by Bayt.com found that 90% of respondents were
attracted to companies that offer supportive and great work
environments. 70% of respondents also noted that they would
only work for a company they were proud of.
3. Strong and effective leadership
For some, a leadership role is the route to power or a means to
intimidate critics and indulge supporters. However, this is not the
leadership style that attracts candidates who want to grow their
careers. These candidates want to work for leaders - not managers
- who are successful and have built a name for themselves in
their industry. Because success breeds success, candidates want
to work for successful people who recognise their potential to
grow and follow the same path.
Leaders who take the time to mentor their employees, encourage
them and make partners out of them are likely to see their
company benefit in terms of the calibre of talent it attracts.
Business advisory company, McKinsey and Co, asked top
candidates what they look for when deciding which company to
join and stay with. The answer: a great company and a great job.
The candidates added that they would choose to leave if they
got bored - mentoring can provide growth challenges and retain
talented employees.
QUEST’S PICK OF THE KEY STAFFING AND RECRUITMENT TRENDS FOR 2014/15SECTION IV
Quest Salary Survey & Staffing Trends 2014/15 ©
| 92
TM
4. Responsibility
When employees take ownership of their work they not only
hold themselves accountable for delivering on time but also take
pride in completing each task to the best of their ability. Control
of their work inspires motivation to impact decisions; set clear
and measurable goals; and accept recognition for achievement or
discipline for failure.
Young, ambitious job seekers are eager to prove their capabilities
and allowing them the responsibility to be accountable for their
own tasks not only attracts top talent but produces high quality
results for a company’s bottom line.
5. Fair pay
Fair pay is the cornerstone of a successful company that recruits
and retains committed workers. Without a fair living wage,
a company is at risk of losing its best current and potential
employees to a better-paying employer.
Recent research from Watson Wyatt Worldwide in The Human
Capital Edge: 21 People Management Practices Your Company
Must Implement (or Avoid) to Maximize Shareholder Value,
highlights that for a company to attract the best employees, it
needs to pay more than its average-paying counterparts in the
marketplace. Money talks and ultimately provides basic motivation
for candidates to choose a company over its competitors.
The latest Global Workforce Study by consultancy Towers
Watson, which surveyed 32 000 employees, found that only 42%
of respondents believe they are paid fairly.
6. Employee benefits
Whether a company subsidises its employees medical aid or
retirement plan, distributes company shares amongst employees,
offers them a company car or gives them a monthly petrol
allowance – much like fair pay - can mean the difference between
top candidates choosing to join a company over its competitors.
While going without benefits may boost a company’s bottom line
in the short-term, this philosophy may work against a company
in the long run. A company who gives its employees the benefits
they value will notice positive results - the most important of
which is the growth of a satisfied and committed workforce who
miss fewer workdays and are less likely to quit.
7. Well communicated prospect of career growth – internally
For high achieving and ambitious candidates, the opportunity to
develop both personally and professionally within an organisation
is a crucial factor for job satisfaction. These candidates want to
invest their talent in a company that can help them further their
career and expand their existing skill-set.
For many candidates, career opportunities are just as important
as the money they make. In a study by Linkage Inc. more than
40% of respondents said they would consider leaving their
present employer for another job with the same benefits if that
job provided better career development and greater challenges.
To lower the risk of losing current and potential employees to
competitors, companies should ensure that every position has an
individual development plan relating to the organisation’s over-all
succession plan.
8. Skills development and training
Just as the prospect of career growth is important for candidates
looking to join an organisation, the opportunity for growth and
development through further education and training is a major
pull factor for ambitious candidates who want to grow their
careers.
Companies who offer their employees the opportunity to further
their education and keep up-to-date on industry developments
through continuous training and ‘refresher’ courses are therefore
set apart from their competitors.
9. Flexible work hours
Having a choice of where and/or when an employee works makes
a huge difference to his/her overall happiness and wellbeing.
Flexible working arrangements helps cut down on the stress of
a long commute, allows the silence to concentrate, frees up time
to cook and care for a family or simply helps get employees home
earlier.
According to research by global workspace provider Regus,
49% of respondents believe that offering flexible working
arrangements gives organisations a recruitment advantage,
with 68% citing that it is increasingly demanded by prospective
employees. Furthermore, 90% of respondents said that offering
QUEST’S PICK OF THE KEY STAFFING AND RECRUITMENT TRENDS FOR 2014/15
SECTION IV
TM
Quest Salary Survey & Staffing Trends 2014/15 ©
| 93
flexible working arrangements is an effective way of improving
employee morale and helping staff to achieve a better work-life
balance.
According to a report by WorldatWork: Survey on Workplace
Flexibility 2013, in addition to the growing prevalence of a
flexibility culture within organisations, the survey found that
the degree of workplace flexibility culture in place at a company
correlates to employee motivation, engagement, satisfaction and
turnover.
10. Individualisation
Each and every candidate and employee has their own specific
strengths, weaknesses, likes, dislikes and things that motivate
them to perform to the best of their ability. They do not want to
feel like they are ‘just a number’ within an organisation.
Companies who instinctively observe each person’s style, each
person’s motivation, how each person thinks and how they build
relationships stand out as companies who take the time to not
only get to know employees but use this understanding in day-
to-day engagement.
In addition, company management who keenly observe the
strengths of their employees (current and potential) can draw out
the best in each person and helps build productive teams.
QUEST’S PICK OF THE KEY STAFFING AND RECRUITMENT TRENDS FOR 2014/15SECTION IV

Quest Salary Survey & Staffing Trends 2014/15 ©
| 94
TM
5 ABOUT QUEST
TM
Quest Salary Survey & Staffing Trends 2014/15 ©
| 95
TM
5.1 ABOUT QUEST
Quest Staffing Solutions (Pty) Ltd is South Africa’s leading staffing solutions company within the white-collar recruitment industry. Our Full Circle Staffing Solutions Company (FCS² ™) model has been defined and redefined for more than 40 years and is today, the most comprehesive in the industry. Our services offering include, Field Marketing, Managed Services Provider (MSP), Outsourced Staffing Solutions (OSS), Permanent Placement Solutions (PPS), Recruitment Process Outsourcing (RPO) and Specialised Staffing Projects services.
Established in 1974, we have provided clients with our 360º (holistic and strategic) approach to staffing solutions. We at Quest have proved our capabilities in the South African staffing industry through the successful attraction, selection, deployment and management of thousands of candidates in the market.
As part of Adcorp Holdings Limited, South Africa’s leading provider of staffing, human capital management and business process outsourcing services, Quest has access to financial resources, leading IT and information systems and sound corporate governance. A Level 2 BBBEE contributor company with 64.87% black ownership and 30.42% black female ownership. Quest has a vision to be the undisputed African leader in strategic staffing solutions.
Call us for all your staffing solutions: www.quest.co.za
Contact information: [email protected]
SECTION V
Quest Salary Survey & Staffing Trends 2014/15 ©
| 96
TM5.2 QUEST SERVICES OFFERING
SECTION V

NOTES

BRANCHES
Bloemfontein: +27 51 447 7618Cape Town: +27 21 413 4700Durban: +27 31 279 9000East London: +27 43 726 2523Johannesburg (HO): +27 11 628 0300Mbombela: +27 13 752 2819Polokwane: +27 15 291 1794Port Elizabeth: +27 41 373 1183Pretoria: +27 12 423 6600Strings: +27 11 815 3196
www.quest.co.za