THE QUALITY AND ACCURACY OF DISASTER DATA · Today, data on disaster occurrence, their effect upon...
18
THE QUALITY AND ACCURACY OF DISASTER DATA A COMPARATIVE ANALYSES OF THREE GLOBAL DATA SETS Debarati Guha-Sapir Regina Below WHO Centre for Research on the Epidemiology of Disasters University of Louvain School of Medicine Brussels, Belgium for The ProVention Consortium The Disaster Management Facility, The World Bank
Transcript of THE QUALITY AND ACCURACY OF DISASTER DATA · Today, data on disaster occurrence, their effect upon...

THE QUALITY AND ACCURACY OF DISASTER DATA
A COMPARATIVE ANALYSES OF THREE GLOBAL DATA SETS
Debarati Guha-Sapir
Regina Below
WHO Centre for Research on the Epidemiology of Disasters
University of Louvain School of Medicine
Brussels, Belgium
for
The ProVention Consortium
The Disaster Management Facility, The World Bank

- 2 -
PREFACE As part of its effort to promote disaster prevention and mitigation as an integral part of
development activities, the World Bank’s Disaster Management Facility (DMF), under the umbrella
of the ProVention Consortium, has undertaken a study of the quality and accuracy of disaster data.
This research was funded by the United Kingdom’s Department for International Development
(DFID). The principal researchers were Debarati Guha-Sapir and Regina Below of the WHO
Centre for Research on the Epidemiology of Disasters at the University of Louvain School of
Medicine.
The authors gratefully acknowledge detailed comments and inputs received from Dr. D. Shaw,
University of Edinb urgh, Scotland and Dr. M. Dilley, Columbia University, New York. Thanks are
also due to Mr. T. Loster (Munich Re) and Mr. P. Hausmann (Swiss Re) who have provided the data
for this analysis and commented on the text. The errors, views and conclusions, remain the
responsibility of the authors alone. Queries can be addressed to [email protected] or through
www.cred.be. Finally, this paper would not have been possible without the support and
encouragement of Dr. Alcira Kreimer.
- 3 -
1. INTRODUCTION
The need for systematic data for disaster mitigation and prevention has been an increasing concern
of both development and response agencies. Until recently the needs were addressed on an ad hoc
basis, collecting the information at the time of the emergency. As a result, data were incomplete,
outdated or unusable for a variety of reasons. The time pressure to respond quickly for fund raising
or relief planning was usually paramount and the quality and availability of information suffered.
Public sector agencies did not seriously commit themselves to preparedness and prevention.
Calculations of risks, assessments of vulnerability were essentially of lower priority than response.
The general approach to disaster management remained reactive in nature, focussing on relief and
then rehabilitation, reconstruction. Prevention planning or community preparedness was rarely
funded and was not a policy priority either with national governments or with international UN and
other development institutions.
With the increase in the scope of disaster impacts, mostly in the poorer developing countries,
concern has been mounting regarding the poor state of preparedness and prevention. Natural
disasters engender serious setbacks to the develo pment process - devastatingly highlighted at the end
of the last decade by Hurricane Mitch in Central America, the Yangtze river floods in China and
earthquakes in Turkey and India. All of these events have necessitated the diversion of development
funds towards reconstruction.
The result of these events has been that the demand for data on disasters, their impact, their
frequency from policy makers and development planners has increased. Requests for accurate data,
which are comparable across countries and consistent over time, are required for priority setting
between competing demands for national and international budget allocations.
Disaster data: the current picture
Today, data on disaster occurrence, their effect upon people and their cost to co untries remains
patchy. No single institution has taken on the role of prime providers of verified data. No
internationally standardized method for assessing damage has been put forward for global use.
Thus, the main weakness with disaster data is the lack of standardized methodologies and
definitions. Problems exist over such loose categories as people ‘affected’ by disaster. Much of the

- 4 -
data are culled from a variety of public sources: newspapers, insurance reports, aid agencies, etc. The
original information is not specifically gathered for statistical purposes and so, inevitably, even where
the compiling organization applies strict definitions for disaster events and parameters, the original
suppliers of the information may not.
Information systems have improved vastly in the last 25 years and statistical data are now more
easily available. However, the lack of systematic and standardised data collection from disasters in
the past is now revealing itself as a major weakness for any long -term planning. Despite efforts to
verify and review data, the quality of disaster databases can only be as good as the reporting system.
Fortunately, due to increased pressures for accountability from various sources, many donor and
development agencies have started placing priority on data collection and its methodologies, but this
has yet to result in any recognised and acceptable international system for disaster-data gathering,
verification and storage.
Collecting disaster data is a complex and tedious task. Basic maintenance work like updating
national boundaries (e.g. the break-up of the Soviet Union and Yugoslavia, and the unification of
Germany) can be time consuming and confusing when calculating trends.
Inconsistencies, data gaps and ambiguity of terminology make comparisons and use of the different
data sets difficult. This leads to a fair amount of confusion in the evaluation of a disaster situation
and poses severe obstacles for prevention planning and preparedness.
Recognising the need for better quality data to support disaster preparedness and mitigation, the
ProVention Consortium of the World Bank Disaster Management Facility, initiated a consolidated
effort to evaluate the quality, accuracy and completeness of three global disaster data sets. These
were NatCat maintained by Munich Reinsurance Company (Munich ); Sigma maintained by Swiss
Reinsurance Company (Zürich) and EM-DAT maintained by the Centre for Research on the
Epidemiology of Disasters (CRED, Université Catholique de Louvain, Brussels).
The rest of this document sets out the objectives, methods and materials, results, conclusions and
recommendations of this exercise.

- 5 -
2. OBJECTIVES, METHODS AND MATERIALS
2.1 Objectives
The aim of this paper is to assess the comparative strengths and weaknesses in EM-DAT, NatCat
and Sigma and recommend concrete ways in which they can be improved to respond to needs of
policy and program development.
The ultimate goal of this comparative exercise is to identify the ways in which EM-DAT can be
strengthened as a reliable and consistent source of disaster data for development programming and
humanitarian aid. As part of this, the paper also aims:
i) to assist each disaster data group to identify main gaps in their databases and decide
thereafter whether to address them according to needs and priorities;
ii) to establish the profiles of each data set in order to guide users in identifying which
data source is most appropriate for their purpose.
2.2 Methods
The analysis is based on four countries, Vietnam, India, Honduras and Mozambique selected from
four disaster prone regions of the developing world. The countries were selected as those with a
high vulnerability and exposure to natural hazards and were in various stages of their development.
The potential for future market in insurance coverage in these countries was also a factor of choice
for the reinsurance companies.
All records on natural disasters over a period of 15 years (1985 – 1999) was extracted from the three
databases. The records were tabulated in a 26 by 462 cell matrix (Annex) where the disaster entries
from each source could be cross-referenced by each variable of interest. The variables included for
comparison were: date, disaster type, killed, homeless, injured, affected and damage.
The analysis was conducted in three ways. The first is an overall, global summary of the similarities
and differences between EM-DAT, NatCat and Sigma for the selected countries. The second is an
analysis of the presence or absence of disaster events for the four countries across the three
databases. The third is a comparison of the contents of common fields (e.g. number of persons

- 6 -
killed, affected and economic losses) for entries that were present in more than one database. The
report ends with conclusions and recommendations for action based on the results of the analysis.
2.3 Materials
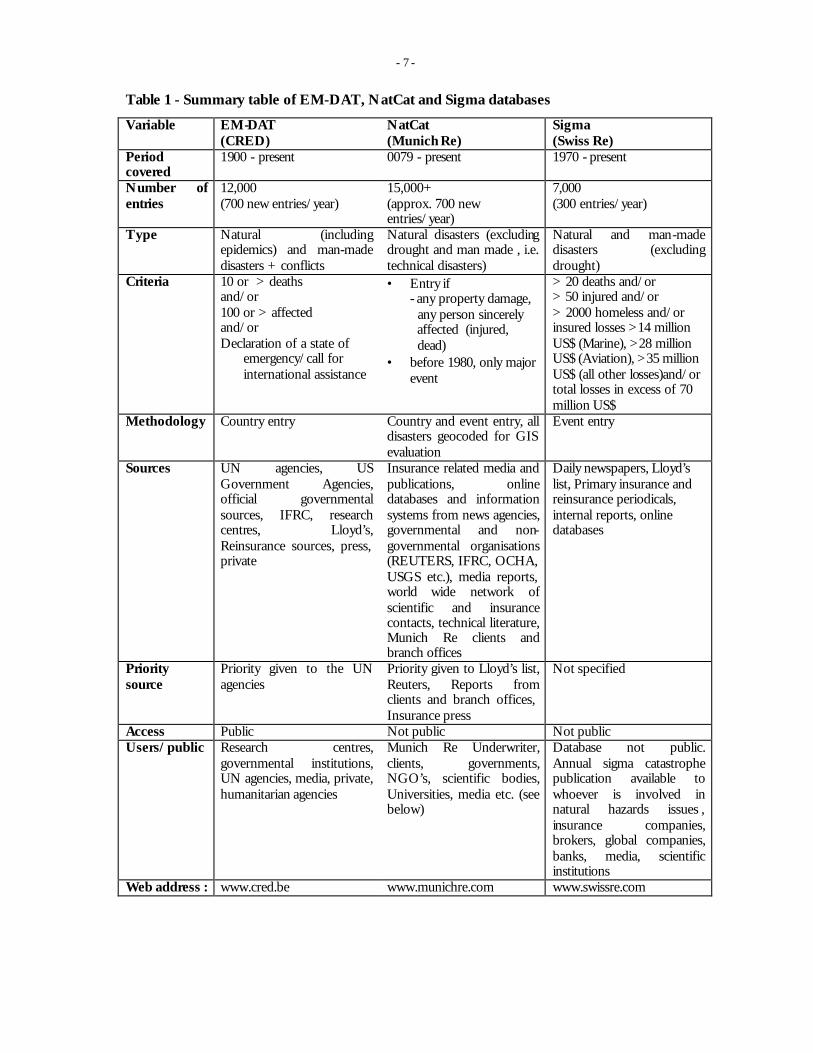
Table 1 presents a summary of the main characteristics of each database. While the overall
structures are similar, these are independently maintained by their respective organisations. The
analysis is limited by the fact that there is no “gold standard” against which to compare the results.
- 7 -
Table 1 - Summary table of EM-DAT, NatCat and Sigma databases
Variable EM-DAT (CRED)
NatCat (Munich Re)
Sigma (Swiss Re)
Period covered
1900 - present 0079 - present 1970 - present
Number of entries
12,000 (700 new entries/year)
15,000+ (approx. 700 new entries/year)
7,000 (300 entries/year)
Type Natural (including epidemics) and man-made disasters + conflicts
Natural disasters (excluding drought and man made , i.e. technical disasters)
Natural and man-made disasters (excluding drought)
Criteria 10 or > deaths and/or 100 or > affected and/or Declaration of a state of
emergency/call for international assistance
• Entry if - any property damage, any person sincerely affected (injured, dead)
• before 1980, only major event
> 20 deaths and/or > 50 injured and/or > 2000 homeless and/or insured losses >14 million US$ (Marine), >28 million US$ (Aviation), >35 million US$ (all other losses)and/or total losses in excess of 70 million US$
Methodology Country entry Country and event entry, all disasters geocoded for GIS evaluation
Event entry
Sources UN agencies, US Government Agencies, official governmental sources, IFRC, research centres, Lloyd’s, Reinsurance sources, press, private
Insurance related media and publications, online databases and information systems from news agencies, governmental and non-governmental organisations (REUTERS, IFRC, OCHA, USGS etc.), media reports, world wide network of scientific and insurance contacts, technical literature, Munich Re clients and branch offices
Daily newspapers, Lloyd’s list, Primary insurance and reinsurance periodicals, internal reports, online databases
Priority source
Priority given to the UN agencies
Priority given to Lloyd’s list, Reuters, Reports from clients and branch offices, Insurance press
Not specified
Access Public Not public Not public Users/public Research centres,
governmental institutions, UN agencies, media, private, humanitarian agencies
Munich Re Underwriter, clients, governments, NGO’s, scientific bodies, Universities, media etc. (see below)
Database not public. Annual sigma catastrophe publication available to whoever is involved in natural hazards issues , insurance companies, brokers, global companies, banks, media, scientific institutions
Web address : www.cred.be www.munichre.com www.swissre.com

- 8 -
Accurate accounting for disaster impacts is a critical aspect of improving disaster risk management.
Historical data allow analysts to track disaster trends and causal factors both over time and
geographically. EM-DAT, the only one of the three databases that is publicly available, has been
used in a wide variety of applied and researches contexts. The reinsurance databases are used for
advising clients on risks in particular areas based on historical loss patterns, combined with other
analytical inputs.
3.0 RESULTS
3.1. Global Overview
The study is based on a comparison of natural disasters in four countries (Honduras, India,
Mozambique and Vietnam) from 1985 to 1999. A crude cumulative total of records of 786 entries in
all three databases were extracted for study. Epidemic outbreaks (e.g. Ebola) have been excluded
from the study because this category is included only in EM-DAT and not NatCat and Sigma.
Some general observations can be made based on this overview table.
First, NatCat has the largest number of entries, followed by EM-DAT and Sigma. Some specific
reasons are presented in a later section. But in general, this is due to the fact that NatCat has no
exclusion criteria and therefore enters all events that have incurred any property or human losses.
Sigma has significantly fewer records. Apart from a higher threshold of inclusion, Sigma uses
the event (which may include multiple countries) as the basis for each entry while EM-DAT and
NatCat contain individual entries for each country affected.
- 9 -
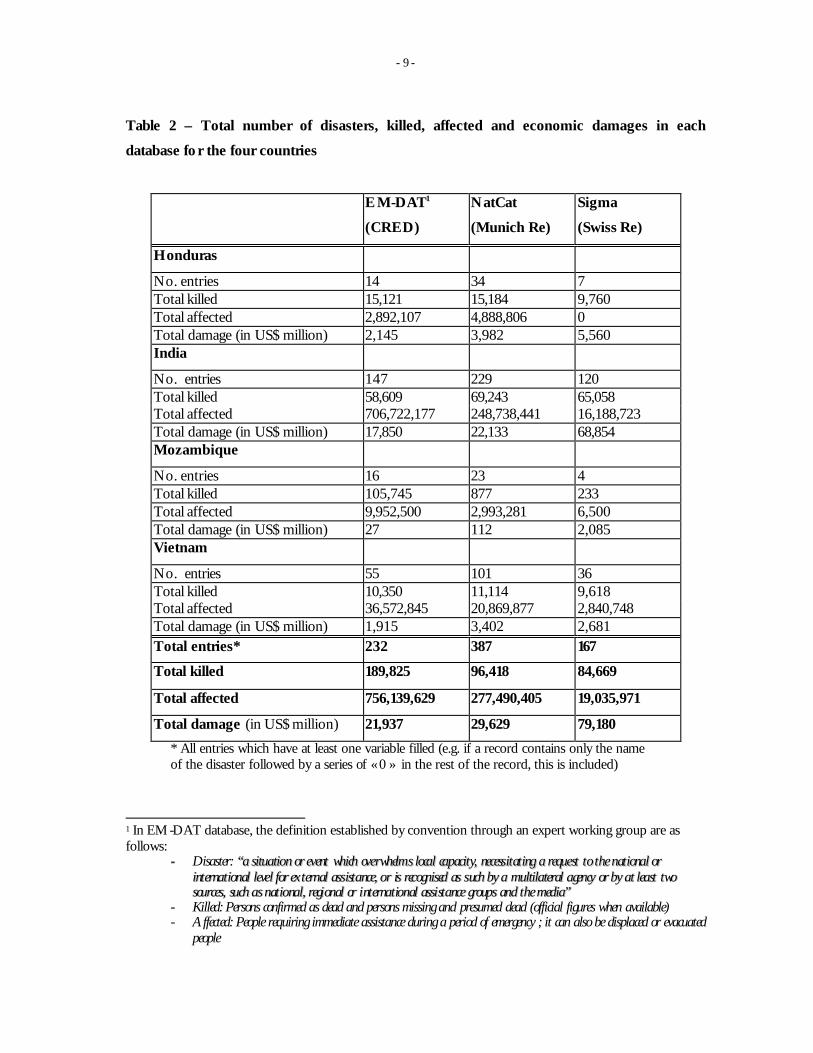
Table 2 – Total number of disasters, killed, affected and economic damages in each
database fo r the four countries
EM-DAT1
(CRED)
NatCat
(Munich Re)
Sigma
(Swiss Re)
Honduras
No. entries 14 34 7 Total killed 15,121 15,184 9,760 Total affected 2,892,107 4,888,806 0 Total damage (in US$ million) 2,145 3,982 5,560 India
No. entries 147 229 120 Total killed 58,609 69,243 65,058 Total affected 706,722,177 248,738,441 16,188,723 Total damage (in US$ million) 17,850 22,133 68,854 Mozambique
No. entries 16 23 4 Total killed 105,745 877 233 Total affected 9,952,500 2,993,281 6,500 Total damage (in US$ million) 27 112 2,085 Vietnam
No. entries 55 101 36 Total killed 10,350 11,114 9,618 Total affected 36,572,845 20,869,877 2,840,748 Total damage (in US$ million) 1,915 3,402 2,681 Total entries* 232 387 167
Total killed 189,825 96,418 84,669
Total affected 756,139,629 277,490,405 19,035,971
Total damage (in US$ million) 21,937 29,629 79,180
* All entries which have at least one variable filled (e.g. if a record contains only the name of the disaster followed by a series of « 0 » in the rest of the record, this is included)
1 In EM -DAT database, the definition established by convention through an expert working group are as follows:
-- Disaster: ““aa ssiittuuaattiioo nn oorr eevveenntt wwhhiicchh oovvee rrwwhheellmm ss llooccaa ll ccaappaacc iittyy,, nneecceessss iitt aatt iinngg aa rreeqquuee sstt tt oo tt hhee nnaatt iioonnaall oorr iinntt eerrnnaatt iioonnaall lleevvee ll ffoorr eexxtteerrnnaall aassss iisstt aannccee,, oo rr iiss rreecc ooggnniisseedd aass ss uucchh bbyy aa mmuullttiillaa tteerraall aaggeennccyy oorr bbyy aatt lleeaasstt ttwwoo ssoouurrcceess,, ssuucchh aass nnaatt iioo nnaall,, rreeggii oonnaall oorr ii nntt eerrnnaattiioo nnaall aassssii sstt aannccee ggrroouuppss aanndd tt hhee mmeeddiiaa””
- Killed: Persons confirmed as dead and persons missing and presumed dead (official figures when available) - Affected: People requiring immediate assistance during a period of emergency ; it can also be displaced or evacuated
people
- 10 -
Regarding the number killed, the totals for Vietnam, Honduras and India are quite similar between
NatCat and EM-DAT. The total killed for Mozambique however differs widely. On analyses of
individual records, we noted that two major events in Mozambique (a famine and an acute food
shortage) accounted for 100,000 and 5,200 dead respectively in EM-DAT. Neither of these events
was recorded in the other two databases, reducing their total significantly.
In general, EM-DAT reports the highest total figures for affected for the same period and for the
same countries (756 million compared to 277 and 19 in NatCat and Sigma respectively). As EM-
DAT draws its data mainly from humanitarian agencies and development organisations, the
information related to human impact may be better reported and complete.On the other hand, when
Sigma records damage, it clearly reports insured and uninsured damage, giving an important value
added to this data set. This aspect is a very important contribution of Sigma and could be even
more useful if they expanded their coverage of events for which they provide this information,
which at this time is limited.
It is important to note as well that the accuracy of the numbers provided by any given secondary
source upon which EM-DAT entries are based depends on accuracy of the methods used by original
organization that provided the data. As inclusion criteria and sources appear to have important
effects on the data, CRED has adopted the practice of specifying both on the Web site where EM-
DAT can be downloaded. This is not the case for NatCat and Sigma.
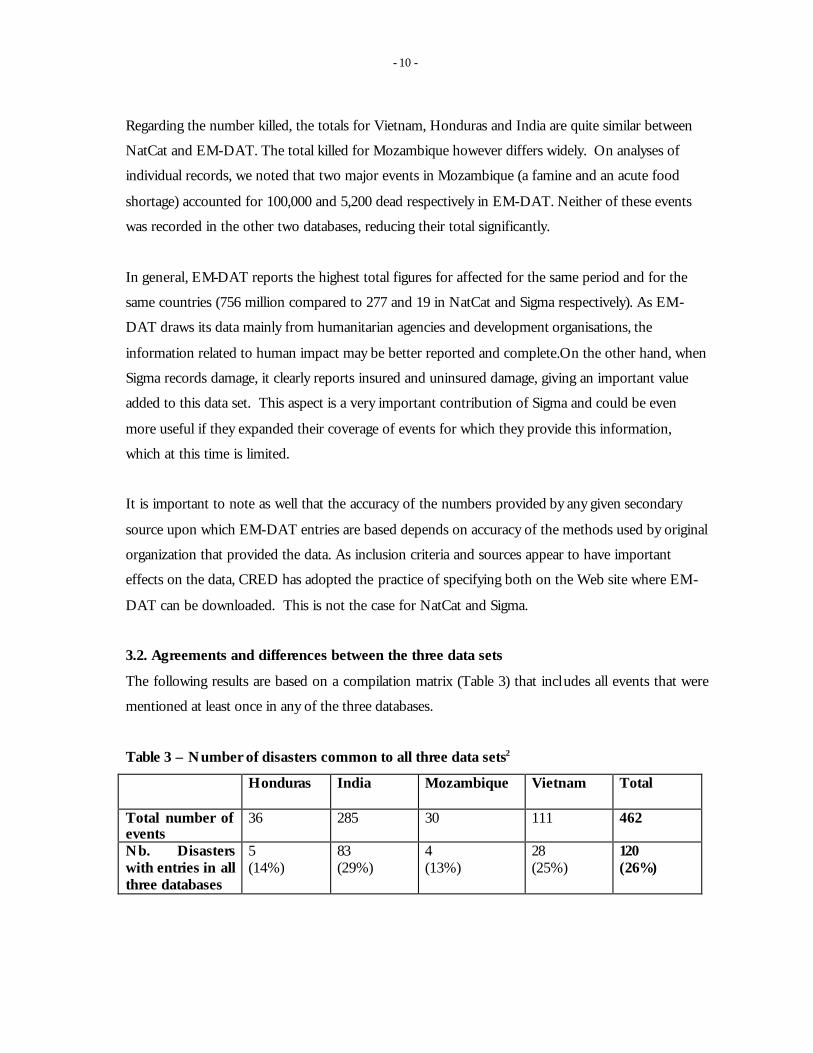
3.2. Agreements and differences between the three data sets
The following results are based on a compilation matrix (Table 3) that incl udes all events that were
mentioned at least once in any of the three databases.
Table 3 – Number of disasters common to all three data sets2
Honduras India Mozambique Vietnam Total
Total number of events
36 285 30 111 462
Nb. Disasters with entries in all three databases
5 (14%)
83 (29%)
4 (13%)
28 (25%)
120 (26%)

- 11 -
Of the total number of events, 120 or about a quarter were common to all three on the basis of the
occurrence of the event. Most of these records, however, differed from EM-DAT in one or more of
the 19 comparable fields. Different “gate-keeping” practices that explain the majority of these
differences are described below with examples.
Differences in recording the date of occurrence
An event could be reported at different dates, especially disasters like a flood which start in June and
end one or two months later. In that specific case, the event has to be verified with the location to
know whether or not it is the same event. In addition, NatCat and Sigma usually record a period for
the disaster (start/end) while EM-DAT records the day it was declared as an humanitarian
emergency by one of the priority sources. Furthermore, the criteria by which the end date is set by
either Sigma and NatCat is unknown. Therefore, dates of international appeals can be after the
NatCat end-date. 3
Differences in classifying the type of disaster
Disasters may also be classified as different types by different databases. This occurs particularly
frequently for associated disasters or secondary disast ers.4 For example, a flood, which was a
consequence of a windstorm, may be recorded as one or the other. Verification that two different
disaster types occurring in the same country on the same day are indeed, the same event is only
possible by checking the exact location. This could not be done as the electronic data provided by
NatCat did not include sub-national location. 5
Not being an exact science, legitimate discrepancies creep into the process of typing a particular
event.
2 Double entries have been taken in account but they were very few (1 in EM -DAT, 2 in NatCat and 6 in Sigma). 3 For example, 1996 Vietnam floods were variously reported in September by EM-DAT, 8 November by NatCat, 14 November by Sigma. 4 Examples include the winter storm of 1985 in India registered by EM -DAT was registered as cold/frost by Sigma. Similarly a heat wave in India, 1988 in EM -DAT was recorded as drought/bush fires in Sigma. 5 For example, NatCat reported a flood in India in October 1985 with 557 killed, EM-DAT reported a cyclone with 531 killed in the same period. Or: NatCat reports a tropical cyclone (Bonita) in Mozambique in 1996 with 11 killed, EM-Dat reports a flood with 0 killed in the same period.

- 12 -
Differences due to multiple entry of a single disaster event
A disaster could be registered as multiple events, if they occurred in different provinces of a country
in successive months (e.g. spreading floods). The same event could be recorded in another data set
as a consolidated single event with the total dead and affected for all the provinces. 6
3.3. Completeness of data fields in a record
Each data set was examined to evaluate the completeness of records as a useful indicator of quality.
The mere recording of the occur rence of a disaster with no other information on it makes the
record essentially unusable for analyses.
The proportions of “0” or missing data7 in the records of each data set were calculated. This was
done first for each data set separately and also for the records that were common to all three data
sets. Four human impact variables - killed”, “injured” “affected” and one economic variable
“damages” were examined. The independent analyses of each data set (NatCat=387, EM-
DAT=232, Sigma=167) are presented in Table 4.
Table 4 – Comparative analysis of completeness of records by database and variable
Variables EM-DAT
(CRED)
232 entries
% NatCat
(Munich Re)
387 entries
% Sigma
(Swiss Re)
167 entries
%
Deaths unreported
19 8 82 21 6 4
Injured unreported
36 16 310 80 146 87
Homeless unreported
36 16 318 82 132 79
Affected unreported
6 3 327 84 167 * 100*
Damage unreported
158 68 276 71 112 67
* Sigma does not report affected (only homeless)
6 For example, there were 4 separate floods in June 1994 in India recorded by NatCat , each event having more than 10 dead. Thus meeting EMDAT criteria for entry. Upon examination, EMDAT did not reveal any flood record in June in India but registered one in July with 150 dead. This record could presumed to be a cumulative report of the 4 records in NatCat but cannot be certifiably so. Similarly India – 1991 – on October, NatCat reported one earthquake with 2000 killed and a landslide with 600 killed in India 1991 while EM-DAT and Sigma reported only one earthquake with respectively 1,500 and 1,600 killed.

- 13 -
For deaths, Sigma had only 4% of its total that did not record information for deaths, followed by
EM-DAT who had 8%. NatCat had nearly over a fifth of its records that did not have any
information on deaths.
The majority of the records (around 80%) in both NatCat and Sigma did not have information for
“injured”, “homeless” and “affected”. Around 80 percent were missing information for each
variable. EM-DAT lacked information on these in 16% of its records.
Data on “damage” were missing in almost equal proportions for all three, strongly indicating an
urgent need to improve this section.
A possible explanation for having more than three-quarters of the records missing information on
all three variables have included specifically in the NatCat and Sigma database, could be the lack of a
lower threshold. This could mean that 80 percent of the events truly did not have any homeless,
injured or affected. In which case, it underlines the need for NatCat and Sigma databases to define
what constitutes a disaster for their database8. Finally, some of the discrepancies are simply inherent
in the reliance on a variety of secondary sources for data.
Table 5 – Completeness of records common to all three databases (n=120)
Variables EM-DAT
(CRED)
% NatCat
(Munich Re)
% Sigma
(Swiss Re)
%
Deaths unreported
4 3 3 3 4 3
Injured unreported
79 65 84 70 101 84
Homeless unreported
89 74 79 66 103 86
Affected unreported
55 46 97 81 120* 100*
Damage unreported
74 62 69 58 79 66
* Sigma does not report affected (only homeless)
Table 5 below compares the completeness of records for only those events that were common to all
three data sets (N=120). A very small percentage of the records were missing a value for the “killed” 7 In none of the three, a difference was made between “0” and missing

- 14 -
variable. Economic damages remains the category where the least number of records have data
entered. Munich Re (personal communication, June 2002) estimates for every single event for
internal use only, using a methodology, also developed and used internally.
Table 6 – Concordance between the disaster events common to three databases
(n=120)
Exact
Matches
% Approximate
matches9
% Wide
Differences10
%
Deaths 35 29 40 33 45 37
Affected 35 29 6 5 79 66
Damage 71 59 7 6 42 35
Table 6 shows the concordance between the three data sets on certain specific variables. The match
for deaths accounted for two-thirds of the records, which is more than satisfactory given the manner
in which data is collected on the ground and different sources between the data sets (press reports
or UNDP officer or Red Cross).
Not surprisingly, there was a much lower proportion of agreement in “affected” since definition of
“affected” varies enormously from disaster to disaster and from reporting source to reporting
source.
Damages had the greatest agreement (a total of 65 per cent of exact and approximate of which the
majority was exact). Possibly because the sources are the same for all three. As opposed to “dead”
and “affected”, very few sources report damages and when they do all three data sets clearly pick
them up.
4.0 CONCLUSIONS
Faced with catastrophic economic and human losses accumulating in each passing decade,
development policy makers are demanding credible and complete data on disasters. In the last 8 A classification from 0 – 6 is applied by the Munich Re where Category 0 is defined as “a very small event” and category 6 “a great natural disaster” (Personal communication, June 2002). Since this description is subjective and non-comparable across time and space, we have considered this as “undefined”. 9 +/- 20%

- 15 -
decade, disasters in India, Mozambique, Turkey and China have set back development processes
sufficiently to warrant serious attention from donor countries towards disaster preparedness and
prevention. This is where high quality historical data is required to justify resource allocation,
establish risk and vulnerability and undertake comparative analyses between regions.
The comparison undertaken here is indicative and is intended to clarify directions in which
improvements can be made, in particular in EM-DAT, which is a public service database with a
development agenda. First, we present the broad conclusions of this evaluation followed by more
specific ones.
In general, all three databases were maintained with scientific rigour and each generated products
that serves a broad community of users. Munich Re, Swiss Re and CRED, all furnish the world
community with acceptable levels of data on disasters. All three institutions are committed to
improving data quality and all are aware of the difficulties associated with collecting data on
phenomena that is scientifically and politically complex.
It is clear that private firms such as Munich Re and Swiss Re undertake useful analyses for their
clients regarding risk and trends based on their own databases. Availability of adequate financial and
human resources as part of one of the most profitable industries allows both of these groups to
produce high quality analyses and publications on a regular basis.
Two overarching conclusions may be drawn from these analyses.
First, we note that the difference in databases reduced significantly with time. Records that
date from the 1980’s had greater discrepancies than those from the 1990’s. This could indicate
increasing commonality of data sources between the databases. While examining the records, we
also noted that press sources are least reliable and are subject to vary significantly from institutional
sources.
Second, comparisons of this nature are difficult and can be misleading because the two
Reinsurance data sets and EM-DAT were conceived for entirely different purposes and for
different clients.
10 More than 20%

- 16 -
Sigma and NatCat a re essentially designed to serve internal commercial policy and to service their
client insurance companies. Consequently, their analytical products are designed with their clients in
mind. The analytical products are excellent and well marketed to a global public (e.g. Sigma Reports,
Munich Topics). The methodologies, definitions, inclusion criteria and some variables (e.g.
economic estimates of loss from Munich Re) are possibly established for both Sigma and NatCat
but are not available to the public .
EM-DAT is conceived for scientific research and development community. Therefore great effort
was made from the start to develop clear and objective methods and definitions, which are available
to users. This allows the consumer to evaluate the quality, coverage and accuracy of the EM-DAT
data and employ it appropriately. Serving the development community, EM-DAT also focused on
ensuring completeness of human impact data.
In general, the three data sets are complementary to each other and should specialize in their areas
of competence and need. All are at the service of the public. NatCat and Sigma, like EM-DAT
responds to specific requests and produce very solid analytical reports available to the public at cost.
EM-DAT has chosen to invest in improving public access to data at the cost of developing
analytical products due to resource limitations.
With regard to standardization of methods and definitions, it is clearly the key issue to be addressed
for improvement of data quality. This can only be achieved if international efforts are made to
develop these tools and make them available for national level use. So far little has been done in this
regard.
At more detailed levels, the following conclusions of interest may be drawn.
i. Most of the differences were due to differences in typology, differences in record splits (for
multiple events) or differences in dates. These cannot necessarily be “corrected” to match
exactly since events like floods (where most of the discrepancies occur and not in
earthquakes), there is in fact no “correct” date of event. Taxonomy is also difficult to
standardize since perfectly credible sources will differ as to whether it was a
landslide/mudslide/flood and whether they occurred simultaneously or sequentially and
where.

- 17 -
ii. None of the three have adequate data on socio-economic impact and the little that exists by
way of homeless, affected, dead and injured is unsatisfactorily defined and often incomplete.
This is, in part due to lack of field methods to capture social and eco nomic costs. But
reinforced effort to compile even those that exist has not received much attention even by
EM-DAT, which responds to the development and humanitarian agenda.
iii. Sigma has the best data on insured and uninsured damage loss figures. Although the
methods by which these are computed are not stated, the availability of the figures can be
very useful. The weakness remains in the fact that Sigma has low event and there are no loss
estimates for a large proportion of important disasters.
iv. Clarity and standardization of methods would improve the credibility of all the databases
significantly. On the other hand, the lack of any standard definitions by the data producing
sources, such as UNDP/OCHA national offices, national disaster co -ordination bodies, Red
Cross does a great disservice to improvement and global standardization of disaster data.
Finally, EM-DAT has, so far , used a passive approach to data capture and maintained EM-DAT as
an single research centre initiative. The Provention Consortium Workshop held in 2001 in
Washington DC, exposed the significant values in building a public-private partnership with the
Reinsurance companies. The mutual interest and value added for all parties were underlined.
However, it was clear EM-DAT would need to be established as a global referral database for
disasters underwritten by concerned international and national bodies to allow institutional
collaboration between the Re-insurance companies and the EM-DAT project.
5.0. RECOMMENDATIONS
Based on the conclusions above, we propose 4 recommendations aimed at making progress in
improving global quality of disaster data. Most of these are technically feasible but requires initiative
from inter-governmental institutions that are the main clients of this product.
- Active participation of the Reinsurance companies in data sharing and exchange would be
much facilitated if EMDAT were to be recognised as an international referral database
sponsored by multi-lateral organisations. This would provide an excellent opp ortunity for a
successful private-public partnership where higher quality products can be produced for all
- 18 -
partners. One option for achieving this would be to involve the UN and UNDP Statistics
responsible for collating data for the Human Development Report to report disaster statistics as
a standard table element and use EMDAT for that purpose.
- Standard methods to report social and economic costs of disasters could be initiated by the
ProVention Consortium to be adopted by UNDP/OCHA/ OFDA/ECHO as internationally
accepted methods. The methods should be as simple as possible, possibly at some cost to
accuracy in the final figures.
- Strengthening the EM-DAT data on social and economic variables will serve global and
national programmes of prevention and preparedness goals more effectively by allowing better
estimates of costs;
- A “market survey” of needs and requirements of development programmers (World Bank,
UNDP, EU and bilateral) will make these data bases more “client oriented” than it has been in
the past. Pro-active measures should be taken to stimulate its use in planning and response
exercises.
At the end of the day, increased investment in data quality and coverage, (typically a low visibility,
background activity), can be obtained only if users can be made to feel its benefits in concrete
forms. In this case, the key users are development programmers who need to justify priority given to
disaster prevention and preparedness. The absence of hard data and its analyses compromises
disaster prevention programmes all over the world.