Bangor Area School District agreement with ex-Superintendent Patricia Mulroy
Upload
kelly-rileyCategory
view
216download
2
The Pursuit of Sustainable & Reliable
Water Supplies in the Desert
The Las Vegas Story
Pat MulroySouthern Nevada Water Authority
August 2008

Las Vegas, Nevada

Southern Nevada
1

“The Rush is Only Just Commencing.”Las Vegas Age, May 1905

1950 – 47,000
1960 – 116,0001970 – 270,000
1980 – 444,000
1990 – 800,000
Population
Development History
2000 – 1.3 million
2008 – 2.0 million

1920 1950 1960 1970 1980 1990 2000 2008Pre-1905 1905
Early inhabitants came to Las Vegas because of its abundant water supplies.
Las Vegas – Early Settlement

1920 1950 1960 1970 1980 1990 2000 2008Pre-1905 1905
Las Vegas – Early Settlement
Even early settlers recognized the value of conservation.
Photo courtesy of UNLV Special Collections.

1920 1950 1960 1970 1980 1990 2000 2008Pre-1905
A railroad resulted in the formation of the privately owned Las Vegas Land and Water Company.
1905
Las Vegas - 1905
1920 1950 1960 1970 1980 1990 2000 2008Pre-1905
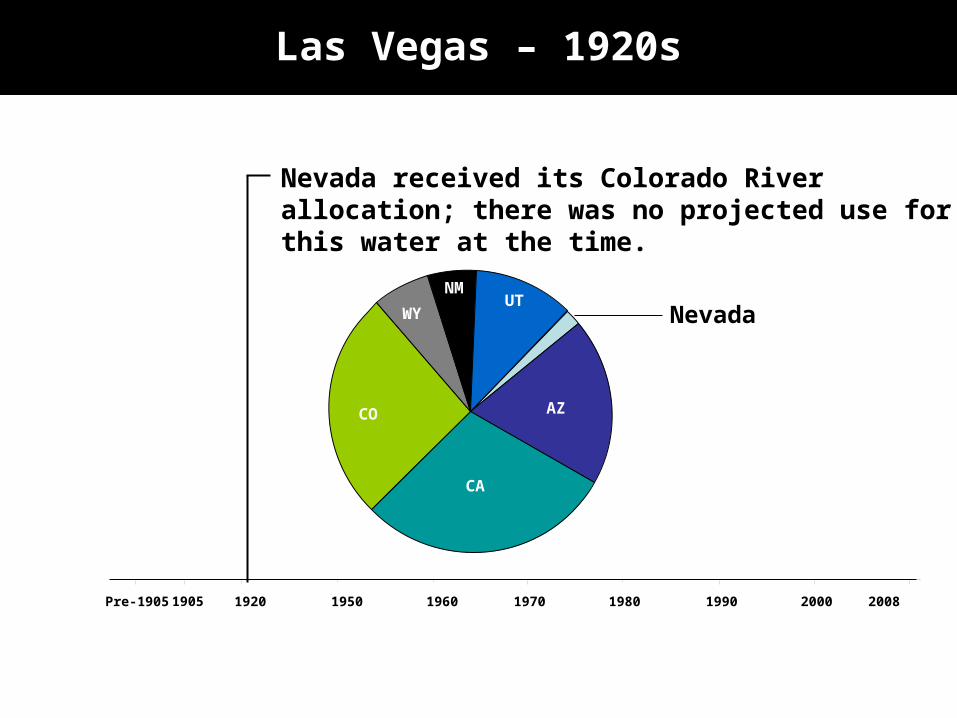
Nevada received its Colorado River allocation; there was no projected use for this water at the time.
1905
Nevada
AZ
CA
CO
WY
NMUT
Las Vegas – 1920s

1920 1950 1960 1970 1980 1990 2000 2008Pre-1905 1905
Las Vegas gained popularity as a tourist destination.
Las Vegas – 1950s
90 % of all water comes from local groundwater supplies.

1920 1950 1960 1970 1980 1990 2000 2008Pre-1905 1905
Colorado River water delivery facilities became operational.
The Colorado River is expected to provide Las Vegas an ample water supply until the middle of the 21st century.
Las Vegas – 1970s

1920 1950 1960 1970 1980 1990 2000 2008Pre-1905 1905
The Colorado River was estimated to be fully used by the early 2000s.
Las Vegas – 1990s

“Water ignites simmering feud between city and county.”
Las Vegas Review Journal, March 1991

1920 1950 1960 1970 1980 1990 2000 2008Pre-1905 1905
0
0.02
0.04
0.6
0.8
1.0
1.2
1.4
1.6
1.8
2.0
Po
pu
lati
on
(in
Mill
ion
s)
Major Issues
• Competition for Colorado River water
• No coordinated conservation plan
Las Vegas – 1990s

“Super water agency taking shape.”Las Vegas Sun, May 1991

The Southern Nevada Water Authority (SNWA) was formed by cooperative agreement (NRS 277)
in 1991 to address Southern Nevada’s unique water needs on a regional basis
Regional Coordination
Regional Facilities
Water Conservation
Las Vegas – 1990s
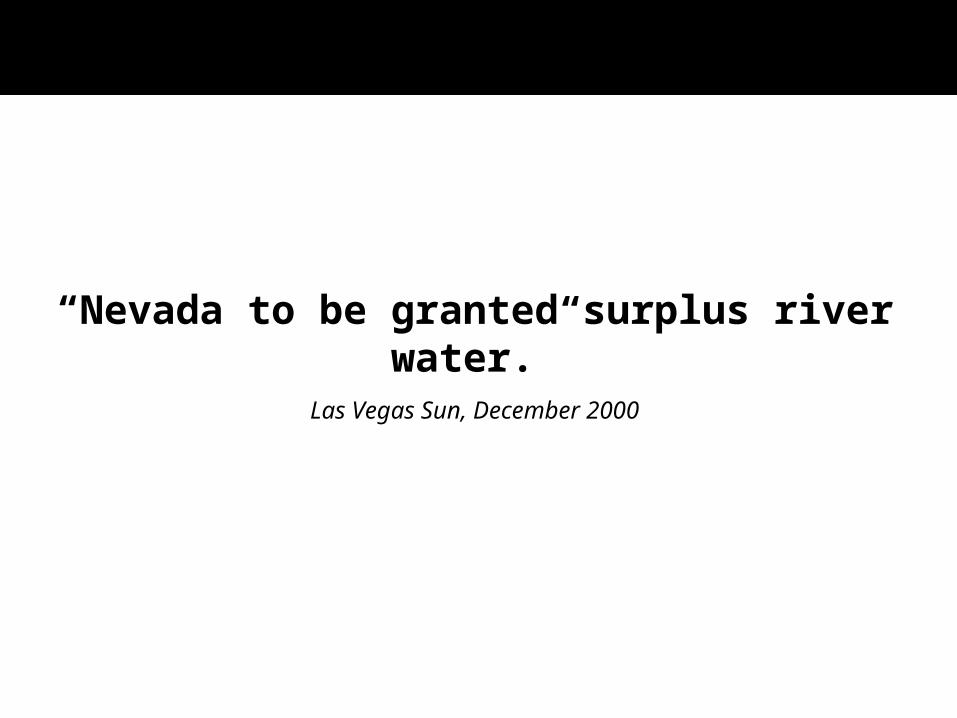
“Nevada to be granted surplus river water.”Las Vegas Sun, December 2000
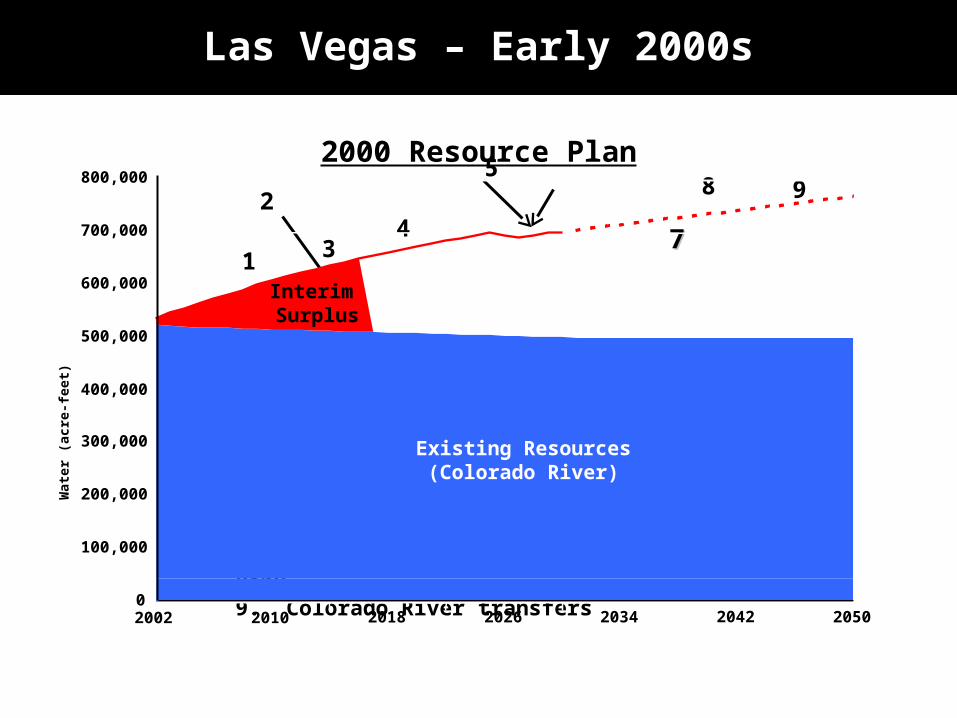
1. Interim surplus (through 2016)2. Clark County groundwater 3. Arizona Demonstration Project4. Arizona Groundwater Bank5. Las Vegas Valley shallow aquifer6. Muddy River7. Virgin River8. Southern Nevada Groundwater Bank9. Colorado River transfers
1
2
34 77
85
9
0
100,000
200,000
300,000
400,000
500,000
600,000
700,000
800,000
2002 2010 2018 2026 2034 2042 2050
Interim Surplus
Existing Resources(Colorado River)
2000 Resource Plan
Wat
er (
acre
-fee
t)Las Vegas – Early 2000s

• Intended as a bridge until other long-term resources could be developed.
• Surplus volumes available based on Lake Mead water levels.
• Meanwhile, SNWA aggressively pursues other resources:
- Conservation
- Water banking
- Exchanges with other states
- Desalination
Interim Surplus
Las Vegas – Early 2000s

Drought takes hold on the Colorado River…
Las Vegas – Early 2000s

Las Vegas – Early 2000s
Interim Surplus availability becomes uncertain…
1. Interim surplus (through 2016)2. Clark County groundwater 3. Arizona Demonstration Project4. Arizona Groundwater Bank5. Las Vegas Valley shallow aquifer6. Muddy River7. Virgin River8. Southern Nevada Groundwater Bank9. Colorado River transfers
0
100,000
200,000
300,000
400,000
500,000
600,000
700,000
800,000
2002 2010 2018 2026 2034 2042 2050
Interim Surplus?
Existing Resources(Colorado River)W
ater
(ac
re-f
eet)

1,080
1,120
1,160
1,200
1,240
1999 2000 2001 2002
Las Vegas – Early 2000s
Lake Mead water level plunges…

“Officials to draft drought plan for valley.”Las Vegas Review Journal, October 2002

EDUCATIONWATERPRICING
REGULATION INCENTIVES
17
Drought Plan
Las Vegas – Early 2000s

Year-round watering schedules
Turf limitations
Golf course water budgets
Water waste enforcement
Conservation rates
Education and outreach
18
Conservation Policies and Programs
Las Vegas – Early 2000s

“Authority takes aim at turf.”Las Vegas Review Journal, March 2006

• Provides rebates to customers that replace turf with water-smart landscaping
• Nearly 112 million square-feet (10 million square meters) converted since program inception
• Over 4.3 billion gallons (23.4 billion liters) saved annually
Las Vegas – Early 2000s
Conservation Policies and Programs

“Storm fails to make dent in drought.”Las Vegas Review Journal, June 2003

Las Vegas – Current
Historical 8-Year Average Inflow: 62% of normal
Normal
Lake Powell Annual Inflows
4
62% 59%
25%
53% 51%
73% 68%
105%
0%
20%
40%
60%
80%
100%
120%
2000 2001 2002 2003 2004 2005 2006 2007 2008
105%
(Projected)

Historical and Forecast Lake Mead Elevation
Source: Bureau of Reclamation, December 2007 and July 2008
Shortage Historical
Forecast Jul-081,025
1,075
1,125
1,175
1,225
Jan-00 Jan-02 Jan-04 Jan-06 Jan-08 Jan-10
En
d o
f M
on
th E
lev
atio
n (
fee
t)
Top of Spillway
Las Vegas – Current

20081983
Hoover Dam/Lake Mead
Las Vegas – Current

Colorado River at Lake Mead
Las Vegas – Current
90% of regional water supplies come from the Colorado River.

… ‘future droughts will recur and may exceed the severity of droughts of historical experience, such as the drought of
the late 1990s and early 2000s.’
NATIONAL RESEARCH COUNCIL
Colorado River Basin Management:
Evaluating and Adjusting to Hydroclimatic Variability

Priorities
SNWA’s future depends on:
Conservation
Diversification of Resources
Regional Partnerships
Current Priorities

Conservation
In 2007, the SNWA served more than 400,000 new residents and nearly 40 million annual visitors with approximately 15 billion
gallons (56.8 billion liters) less water than five years ago.
270,000 265,000 265,000 265,000
325,000
279,000
2002 2003 2004 2005 2006 2007
Wa
ter
Us
e (
Ac
re-f
ee
t)
31
Current Priorities

Cave Valley
Dry Lake Valley
Delamar Valley
Spring Valley
Snake Valley
Coyote Spring Valley
Resource Diversification
Current Priorities

Resource Diversification
200,000
400,000
600,000
800,000
1,000,000
1,200,000
1,400,000
2008 2012 2016 2020 2024 2028 2032 2036 2040 2044 2048 2052
Year
Acr
e-F
eet
Current Resources
Muddy/Virgin Rivers
Clark, Lincoln and White Pine Project, 164,000 af
CR Augmentation
Drop 2
Coyote Spring Three LakesArizona Bank
NV/CA BankTransfers & Exchanges
Arizona Bank
Chart assumes full consumption of all resources
Current Priorities

Regional Partnerships
Shortage sharing among states
Arizona water bank
California water bank
System conservation
Tri-state desalination projects
Bi-National resource management and desalination projects
Current Priorities

The face of the new Southwest…