The Pullback Strategy Guide for Binary Trading What is the ... · Stochastics When trading this...
17
The Pullback Strategy Guide for Binary Trading What is the Pullback Strategy?
Transcript of The Pullback Strategy Guide for Binary Trading What is the ... · Stochastics When trading this...

The Pullback Strategy Guide for Binary Trading
What is the Pullback Strategy?
The Pullback Strategy was created as a result of Ben’s Strategy. In the early days when we first
recommended using Ben’s Strategy, we had one member of the BD family (Rafael) who preferred to trade
in the opposite direction to the indicator arrows. For example, when he had a (green) buy signal, he saw
that as a sign to get into a sell trade. Though Rafael has now moved on and is no longer an active member
of the BD Group, the fundamentals of his strategy have remained.
This was when BD 5.0 was created using the Pullback method. After months of refining and tweaking of the
indicators, Jamie adapted the strategy so that traders are now able to get into a trade the moment the
price is reserved. We consider this a very powerful and effective strategy using Pullbacks with the trend.
We at BD and FxLearning strongly suggest that if you are new to trading binary that you first learn Ben’s
Strategy. The advantage being that the strategy gives a signal, two or three candles after the Pullback has
formed, importantly giving the trader time to enter the trade. The Pullback strategy however, gives a signal
the moment the Pullback has occurred. To a beginner this can be confusing as it takes experience to spot
Pullbacks quickly.
So let’s begin….
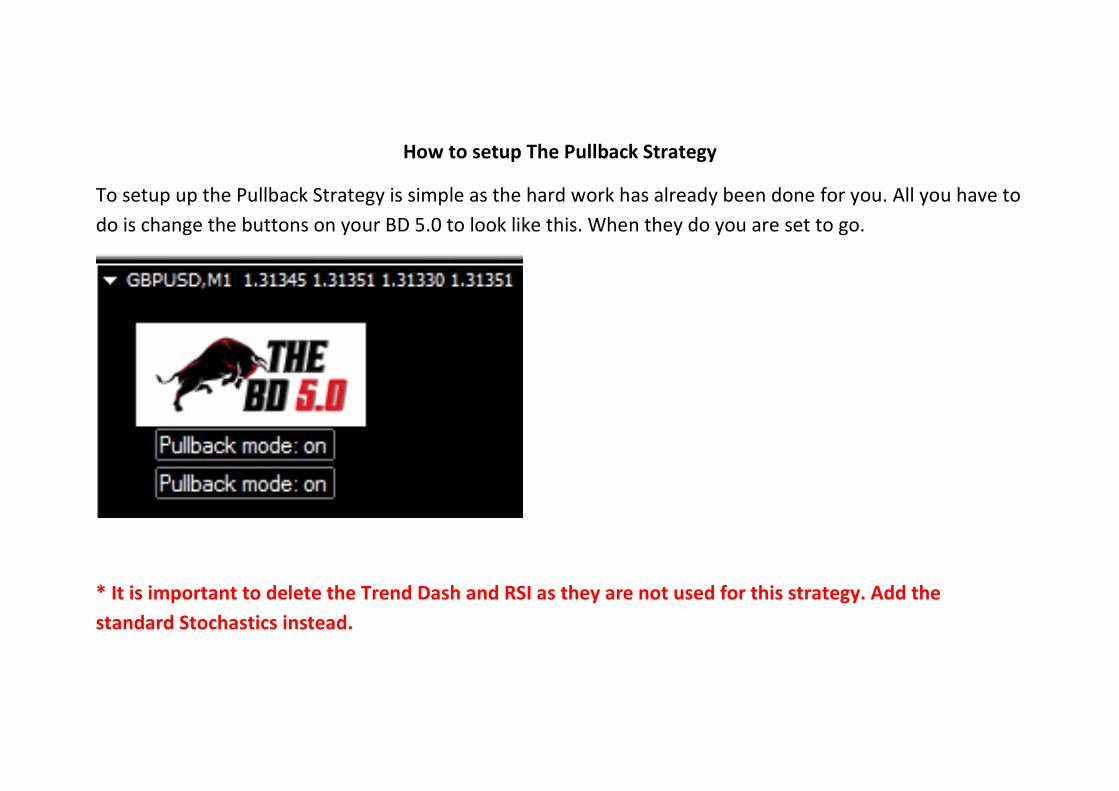
How to setup The Pullback Strategy
To setup up the Pullback Strategy is simple as the hard work has already been done for you. All you have to
do is change the buttons on your BD 5.0 to look like this. When they do you are set to go.
* It is important to delete the Trend Dash and RSI as they are not used for this strategy. Add the
standard Stochastics instead.
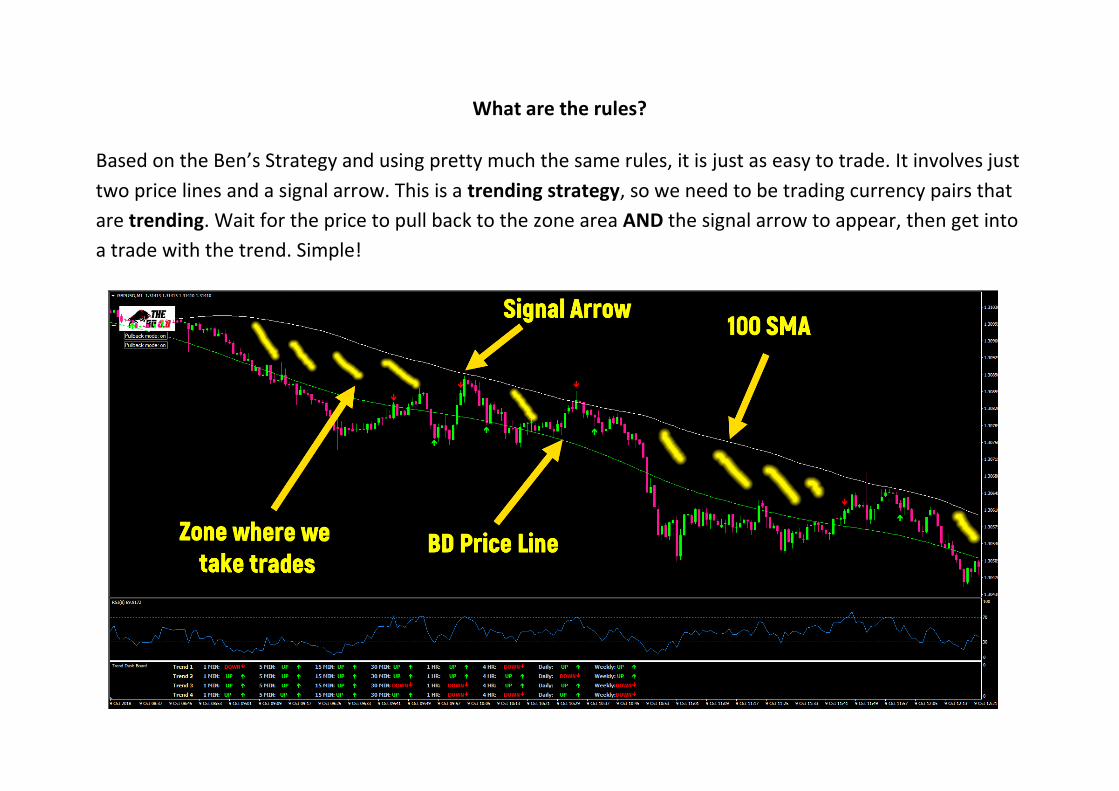
What are the rules? Based on the Ben’s Strategy and using pretty much the same rules, it is just as easy to trade. It involves just
two price lines and a signal arrow. This is a trending strategy, so we need to be trading currency pairs that
are trending. Wait for the price to pull back to the zone area AND the signal arrow to appear, then get into
a trade with the trend. Simple!
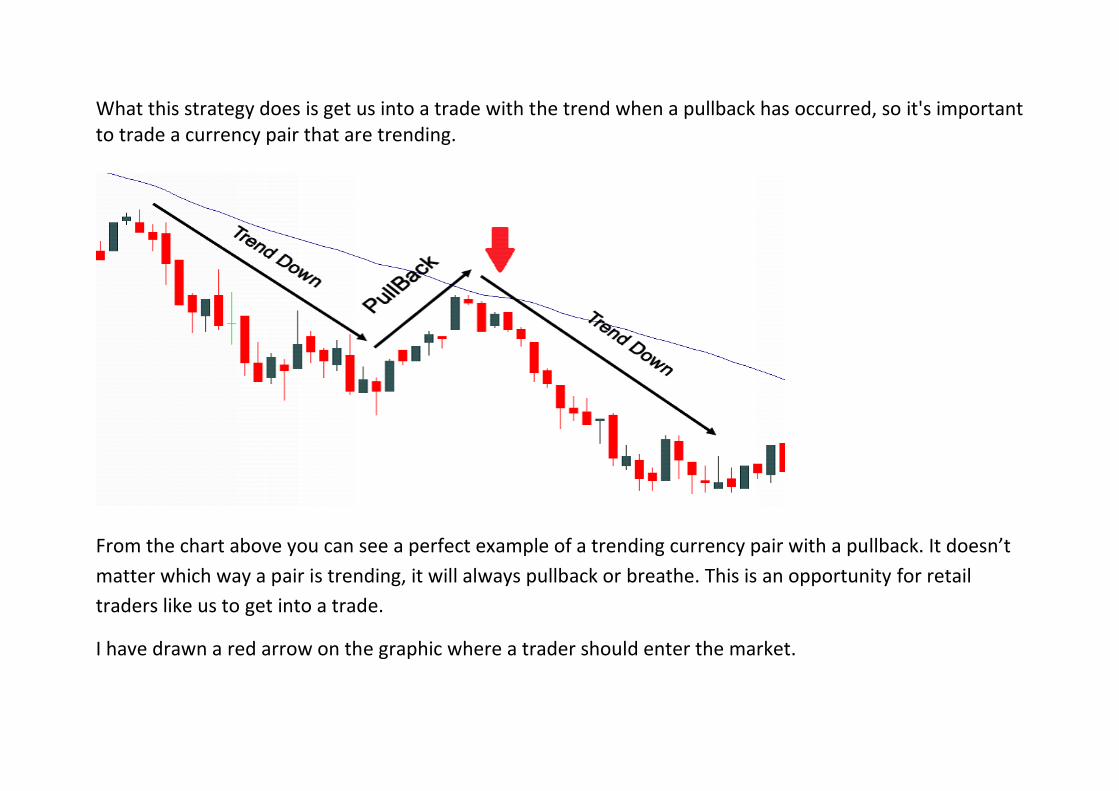
What this strategy does is get us into a trade with the trend when a pullback has occurred, so it's important to trade a currency pair that are trending.
From the chart above you can see a perfect example of a trending currency pair with a pullback. It doesn’t
matter which way a pair is trending, it will always pullback or breathe. This is an opportunity for retail
traders like us to get into a trade.
I have drawn a red arrow on the graphic where a trader should enter the market.
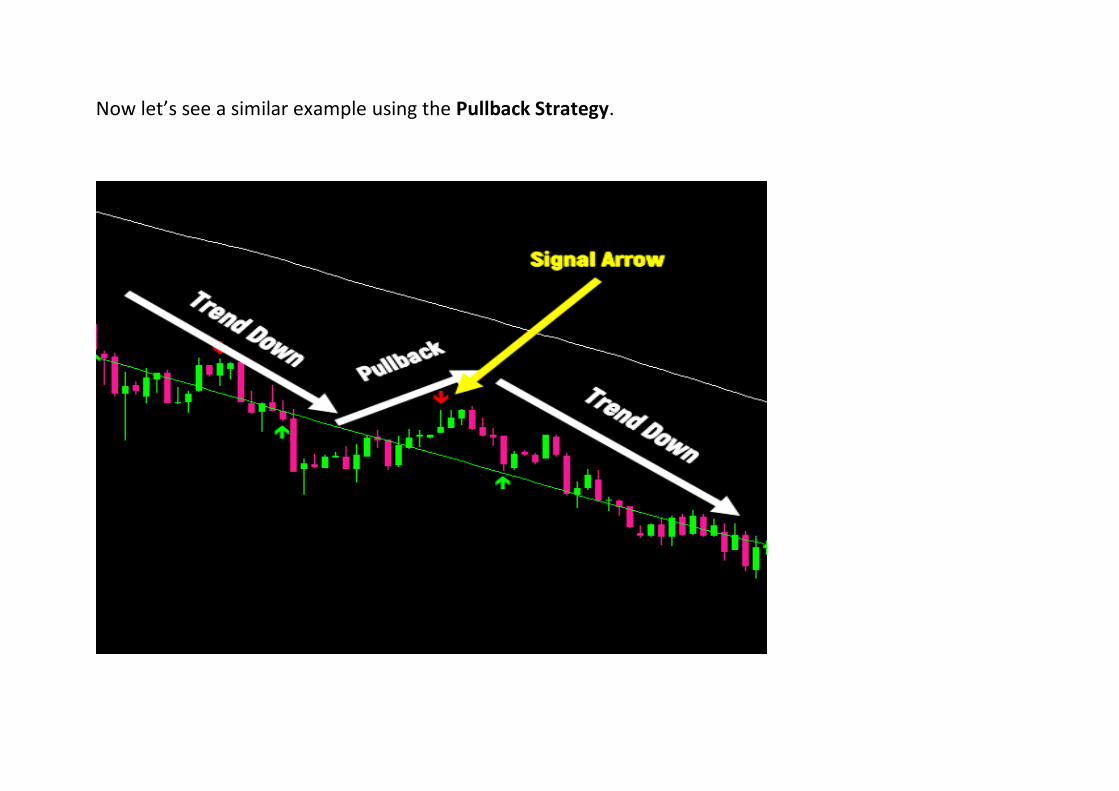
Now let’s see a similar example using the Pullback Strategy.

In this example, you can see the currency pair is trending down. It doesn’t matter if the currency is
trending up or down, it will always pullback at some point. Though this is a perfect example of the Pullback
Strategy, we understand that situations like this won’t be that easy to spot on a live chart.
Can you see how the Binary Destroyer gave a red signal arrow to confirm the price is heading down? This would be our confirmation to get into a trade with the trend. When trading this strategy we can’t simply use the arrows to indicate a trade, we also need to wait for the signal candle to appear in-between the lines and also the Stochastics to be overbought or sold. Rules • Always trade a currency pair that is trending.
• Wait for a signal candle to be in-between the two moving averages.
• Stochastics must be over bought or sold.

Stochastics
When trading this strategy we need to delete the RSI and add the Stochastics instead. The Stochastic is a
great indicator to confirm trades when a currency pair is trending as it normally indicates when a Pullback
has finished. We always wait for the stochastic to be either over bought or oversold.
As you can see from the graph, using the Stochastics as an indicator to confirm our entry makes things
easy. When you combine this with The BD then it becomes a perfect recipe for success!

Perfect example
As you can see from our example, that this is a perfect setup
Stochastics over bought
Signal candle in-between the lines
Trending currency pair
* Remember that the signal candle, not the arrow has to be in-between the lines.
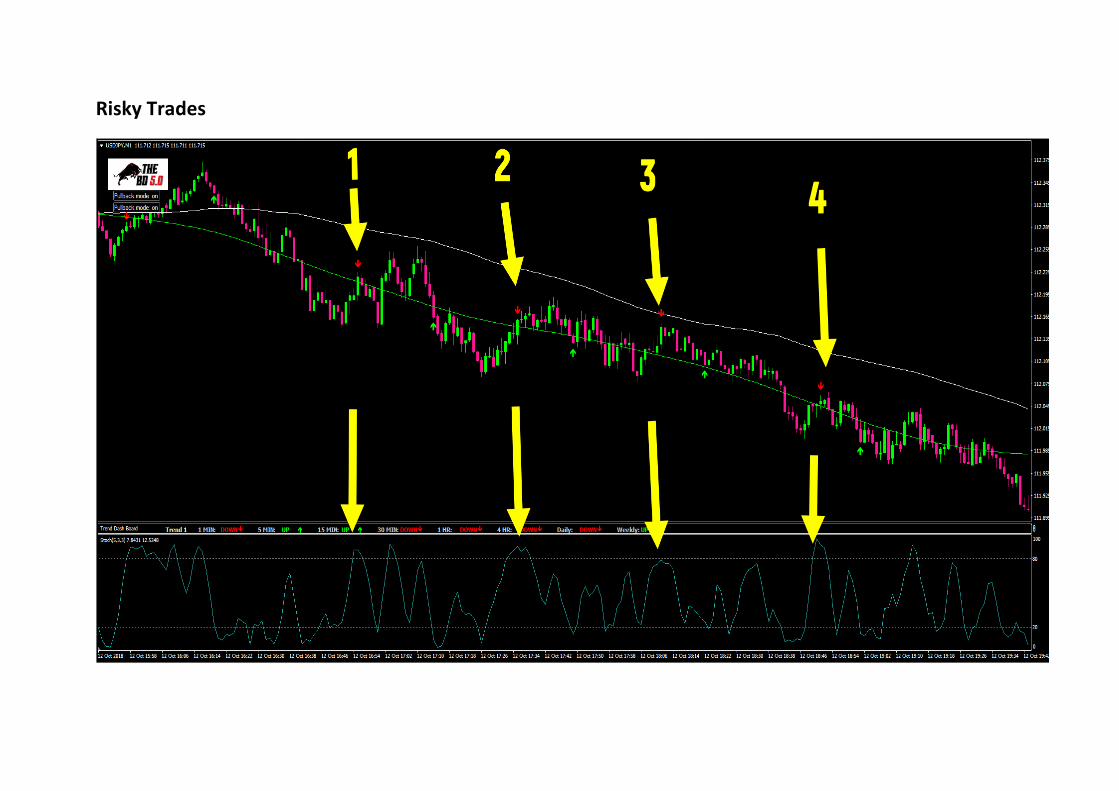
Risky Trades
As you can see from the example above that none of the four trades met the rules but they were all
winners.
Trade 1 – Stochastics over bought but the signal candle is not in-between the lines.
Trade 2 - Stochastics over bought but the signal candle is not in-between the lines.
Trade 3 – Stochastics not over bought but the signal candle is in-between the lines.
Trade 4 - Stochastics over bought but the signal candle is not in-between the lines.
These were all risky trades, yet still delivered wins. However, the odds are heavily stacked against us in
such situations and ideally we want to have a higher probability of winning. Patience is the key, always wait
for perfect setups and do not be rushed into any of the 4 scenarios described above.

Time Frames and expiry times The BD 5.0 was built around price action so you can use this strategy on any time frame. If you are trading Binary, we would recommend you use the 1 or 5 minute time frames. The 1 minute time frame can move very fast as each candle stick represents 1 minute, so if you find you are getting frustrated with fast pace trading, move over to the 5 minute charts. Expiry times can vary, differing traders will find some more successful than others. This is a table of what we recommend for each time frame, though some brokers may offer different options.
1 minute time frame 10-30 minute expiry
5 minute time frame 15 minute – 1 hour expiry
You will also notice some traders stacking trades with different expiry times. This is perfectly fine, but if you do, make a note of what works best for you. When trading Binary with this strategy (especially beginners) it’s important we stick to one time frame to stop confusion. In order to understand the markets I’m sure you will be aware of the need to check the other time frames. When trading Binary we either win or lose so it doesn’t matter whether it is by 1 pip or 100 pips, A WIN IS A WIN! You trade what you see and not what you think! Powerful words, and so true. As a beginner you need to keep trading as simple as possible. Stick to one time frame and trade what you see off that time frame.

Price Line and Zones. A top tip to find out which way the currency pair is trending is by looking at the white moving average.
By seeing where the white moving average is, we take that as a confirmation to which way the currency
pair is trending.
White line on bottom means uptrend – so we want to be taking call/buy trades.
White line on the top means downtrend – so we want to be taking put/sell trades.
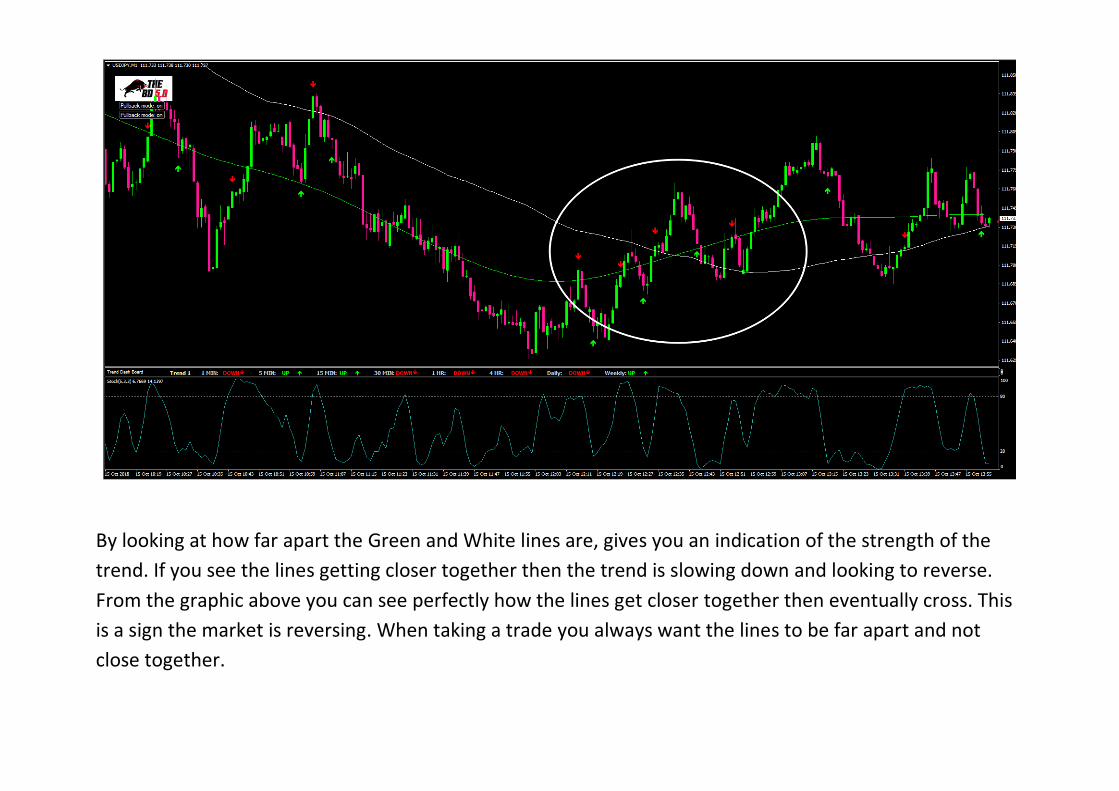
By looking at how far apart the Green and White lines are, gives you an indication of the strength of the
trend. If you see the lines getting closer together then the trend is slowing down and looking to reverse.
From the graphic above you can see perfectly how the lines get closer together then eventually cross. This
is a sign the market is reversing. When taking a trade you always want the lines to be far apart and not
close together.

Live Trading
We are trading the currency market so we have to accept that not all trades will win, as a trader all we
need to do is have an edge (win more than you lose), BD 5.0 and Pullback Strategy gives you that edge.
Remember that no strategy can guarantee 100% success, but you will certainly increase your chances of
losing if you deviate from the strategy. Patience is the key to success.
Now, let's see some live trading using this strategy and the difference between a good and bad trade.
Follow the link
https://vimeo.com/295212793/835c63780e
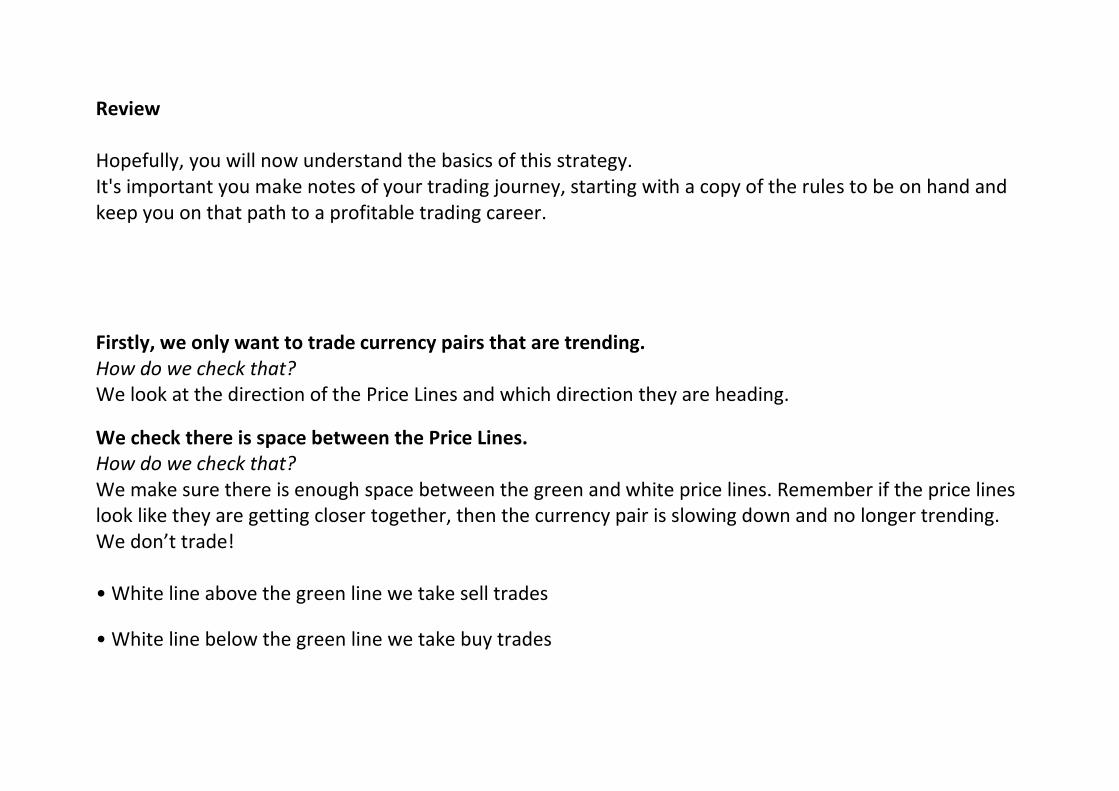
Review Hopefully, you will now understand the basics of this strategy. It's important you make notes of your trading journey, starting with a copy of the rules to be on hand and keep you on that path to a profitable trading career. Firstly, we only want to trade currency pairs that are trending. How do we check that? We look at the direction of the Price Lines and which direction they are heading.
We check there is space between the Price Lines. How do we check that? We make sure there is enough space between the green and white price lines. Remember if the price lines look like they are getting closer together, then the currency pair is slowing down and no longer trending. We don’t trade! • White line above the green line we take sell trades
• White line below the green line we take buy trades
Does the signal arrow meet our rules? When you think a trade has appeared, make sure the signal candle is in between the price lines. If it is touching the price lines or half in, half out, we don’t take the trade. I would recommend you follow our Demo plan for a month using this strategy before going live.
Patience and good luck!