The pueblo decomposition model: A method for quantifying ...tewabasin.oucreate.com/publications/Duwe...
12
The pueblo decomposition model: A method for quantifying architectural rubble to estimate population size Samuel Duwe a, * , B.Sunday Eiselt b , J.Andrew Darling c , Mark D. Willis d , Chester Walker e a Department of Anthropology, The University of Oklahoma, 455 West Lindsey, Norman, OK 73019, USA b Department of Anthropology, Southern Methodist University, PO Box 750336, Dallas, TX 75275, USA c Southwest Heritage Research, LLC, 9606 Highland View Drive, Dallas, TX 75238, USA d Blanton and Associates, Inc., 5 Lakeway Court, Suite 200, Austin, TX 78734, USA e Archaeo-Geophysical Associates,111 West Missouri Ave, Unit H, Phoenix, AZ 85013, USA article info Article history: Received 31 May 2015 Received in revised form 23 October 2015 Accepted 27 October 2015 Available online xxx Keywords: Population reconstruction Demographic archaeology Adobe architecture Ancestral pueblo American Southwest abstract While most archaeological measures of population rely on material proxies uncovered through exca- vation (rooms, hearths, etc.), we identify a technique to estimate population at unexcavated sites (the majority of the archaeological record). Our case study focuses on ancestral Tewa Pueblo villages in northern New Mexico. Uninhabited aerial vehicle (UAV) and instrument mapping enables us to quantify the volume of adobe architectural rubble and to construct a decomposition model that estimates numbers of rooms and roofed over space. The resulting metric is applied at ten Pueblo villages in the region to ‘rebuild’ architecture, and calculate maximum architectural capacity and the maximum extent of population size. While our focus is on population histories for large Classic period (A.D. 1350e1598) pueblos in the American Southwest, the model and method may be applied to a variety of archaeological contexts worldwide and is not limited to building material, site size, or construction technique. © 2015 Elsevier Ltd. All rights reserved. 1. Introduction Reconstructing momentary population, or population counts per unit of time, enables researchers to address a wide range of issues that include people's responses to ecological change, the evolution of social and political complexity, the emergence of new social collectives and identities, and population movement such as migration and coalescence. Momentary population estimates therefore are critical for archaeological interpretations, and yet can be difficult to obtain. Researchers must build bridging arguments to predict unknown populations that existed in the past based upon known archaeological materials that exist in the present. Estimates may vary depending upon three general factors (Hassan, 1978, 1981): 1) archaeological correlates and how these are translated into population estimates, 2) temporal chronology and control, and 3) the model that is constructed to apportion population growth or decline. This paper is concerned with the first factor e the archaeological correlates of population e and how archaeologists can estimate reasonable counts of the maximum number of people who may have lived at a site based on architectural capacity of roofed-over space. This step is essential, for if these figures are inaccurate, then no amount of chronological control or modeling finesse will correct the error. Archaeologists worldwide have used a variety of material proxies to estimate maximum population size. These include structure, room or hearth counts (Ammerman et al., 1976; Havilland, 1972; Warrick, 2008; Webster and Freter, 1990), roofed area (Casselberry, 1974; Naroll, 1962), volume of architectural rubble (Adler, 1992) and artifact accumulations (Santley, 1990; Varien and Ortman, 2005). These proxies are converted to numbers of individuals, often through ethnographic or historical indices for per person investment in architectural space. Although such indices are often debated, archaeological reconstructions of population size rely on the inherent strength of the archaeological measurement. While much attention has focused on the relationship between material proxies and number of individuals, we believe that an equally important problem is how these proxies, many which are only visible through excavation, are extrapolated from unexcavated contexts. Archaeologists rarely excavate one site completely, let alone test every site in a given region. To estimate regional * Corresponding author. E-mail addresses: [email protected] (S. Duwe), [email protected] (B.Sunday Eiselt), [email protected] (J.Andrew Darling), willis.arch@gmail. com (M.D. Willis), [email protected] (C. Walker). Contents lists available at ScienceDirect Journal of Archaeological Science journal homepage: http://www.elsevier.com/locate/jas http://dx.doi.org/10.1016/j.jas.2015.10.011 0305-4403/© 2015 Elsevier Ltd. All rights reserved. Journal of Archaeological Science 65 (2016) 20e31
Transcript of The pueblo decomposition model: A method for quantifying ...tewabasin.oucreate.com/publications/Duwe...
lable at ScienceDirect
Journal of Archaeological Science 65 (2016) 20e31
Contents lists avai
Journal of Archaeological Science
journal homepage: http: / /www.elsevier .com/locate/ jas
The pueblo decomposition model: A method for quantifyingarchitectural rubble to estimate population size
Samuel Duwe a, *, B.Sunday Eiselt b, J.Andrew Darling c, Mark D. Willis d, Chester Walker e
a Department of Anthropology, The University of Oklahoma, 455 West Lindsey, Norman, OK 73019, USAb Department of Anthropology, Southern Methodist University, PO Box 750336, Dallas, TX 75275, USAc Southwest Heritage Research, LLC, 9606 Highland View Drive, Dallas, TX 75238, USAd Blanton and Associates, Inc., 5 Lakeway Court, Suite 200, Austin, TX 78734, USAe Archaeo-Geophysical Associates, 111 West Missouri Ave, Unit H, Phoenix, AZ 85013, USA
a r t i c l e i n f o
Article history:Received 31 May 2015Received in revised form23 October 2015Accepted 27 October 2015Available online xxx
Keywords:Population reconstructionDemographic archaeologyAdobe architectureAncestral puebloAmerican Southwest
* Corresponding author.E-mail addresses: [email protected] (S. Du
(B.Sunday Eiselt), [email protected] (J.Andrewcom (M.D. Willis), [email protected] (C. Walker
http://dx.doi.org/10.1016/j.jas.2015.10.0110305-4403/© 2015 Elsevier Ltd. All rights reserved.
a b s t r a c t
While most archaeological measures of population rely on material proxies uncovered through exca-vation (rooms, hearths, etc.), we identify a technique to estimate population at unexcavated sites (themajority of the archaeological record). Our case study focuses on ancestral Tewa Pueblo villages innorthern New Mexico. Uninhabited aerial vehicle (UAV) and instrument mapping enables us to quantifythe volume of adobe architectural rubble and to construct a decomposition model that estimatesnumbers of rooms and roofed over space. The resulting metric is applied at ten Pueblo villages in theregion to ‘rebuild’ architecture, and calculate maximum architectural capacity and the maximum extentof population size. While our focus is on population histories for large Classic period (A.D. 1350e1598)pueblos in the American Southwest, the model and method may be applied to a variety of archaeologicalcontexts worldwide and is not limited to building material, site size, or construction technique.
© 2015 Elsevier Ltd. All rights reserved.
1. Introduction
Reconstructing momentary population, or population countsper unit of time, enables researchers to address a wide range ofissues that include people's responses to ecological change, theevolution of social and political complexity, the emergence of newsocial collectives and identities, and population movement such asmigration and coalescence. Momentary population estimatestherefore are critical for archaeological interpretations, and yet canbe difficult to obtain. Researchers must build bridging arguments topredict unknown populations that existed in the past based uponknown archaeological materials that exist in the present. Estimatesmay vary depending upon three general factors (Hassan, 1978,1981): 1) archaeological correlates and how these are translatedinto population estimates, 2) temporal chronology and control, and3) the model that is constructed to apportion population growth ordecline. This paper is concerned with the first factor e thearchaeological correlates of population e and how archaeologists
we), [email protected]), willis.arch@gmail.
).
can estimate reasonable counts of the maximum number of peoplewho may have lived at a site based on architectural capacity ofroofed-over space. This step is essential, for if these figures areinaccurate, then no amount of chronological control or modelingfinesse will correct the error.
Archaeologists worldwide have used a variety of materialproxies to estimate maximum population size. These includestructure, room or hearth counts (Ammerman et al., 1976;Havilland, 1972; Warrick, 2008; Webster and Freter, 1990), roofedarea (Casselberry, 1974; Naroll, 1962), volume of architecturalrubble (Adler, 1992) and artifact accumulations (Santley, 1990;Varien and Ortman, 2005). These proxies are converted tonumbers of individuals, often through ethnographic or historicalindices for per person investment in architectural space. Althoughsuch indices are often debated, archaeological reconstructions ofpopulation size rely on the inherent strength of the archaeologicalmeasurement.
While much attention has focused on the relationship betweenmaterial proxies and number of individuals, we believe that anequally important problem is how these proxies, many which areonly visible through excavation, are extrapolated from unexcavatedcontexts. Archaeologists rarely excavate one site completely,let alone test every site in a given region. To estimate regional

S. Duwe et al. / Journal of Archaeological Science 65 (2016) 20e31 21
population, researchers calculate the numbers of known proxies(such as hearths or rooms that are revealed through per unit vol-ume of excavation) and then apply this frequency to a similar perunit measure of unexcavated architecture such as site surface areaor number of structures (Warrick, 2008; Webster and Freter, 1990).Consequently, even large excavation projects must be concernedwith how subsurface findings are translated into measures ofoccupational intensity based upon surficial remains.
This paper addresses the problem by proposing a method toefficiently record observable surface architecture and to develop amodel for estimating the maximum number of rooms and roofed-over area for unexcavated contexts. Our case study focuses on tenancestral Tewa villages in the Rio Chama watershed in northernNew Mexico where multi-story adobe villages have collapsed anderoded to earthen mounds, and where there has been relativelylittle excavation in the region compared to the vast number of sites.Uninhabited aerial vehicle (UAV) and instrument mapping tech-nology enables us to quantify the volume of the collapsed housemounds. We then construct a decomposition model to estimatehow much architectural debris is created by the collapse of a givenamount of roofed-over living space. Finally, the output from themodel is applied to nine other sites in the region to ‘rebuild’ puebloarchitecture and quantify total roofed-over living area from thevolume of rubble, creating a proxy to calculate maximum archi-tectural capacity. We anticipate future research that combinesadditional lines of evidence such as dates for intra-site occupationsand models to apportion population growth for a more fullydeveloped population history of the region.
2. Case study: the Rio Chama watershed and the Tewa world
Archaeological data (Duwe, 2011; Duwe and Anschuetz, 2013;Ortman, 2012) and Tewa oral tradition (Ortiz, 1969; Parsons, 1929,1994) suggest that at least two generalized populationsconverged in the late thirteenth and early fourteenth centuriesTewa Basin, the aboriginal homeland of the Tewa Pueblos locatedbetween the modern cities of Santa Fe and Taos. These includeautochthonous villagers who had lived in the region for millenniaand migrant communities from the northern Southwest who weredisplaced by drought (Ortman, 2012). Over the next one hundredyears of coalescence, these populations negotiated and created thesociety and cultural traditions recognized today as ancestral Tewa(Anschuetz and Wilshusen, 2011; Duwe and Anschuetz, 2013).Regional population models are key to understanding this history(Boyer et al., 2010; Crown et al., 1996; Dean et al., 1994; Dickson,1979; Maxwell, 1994; Mera, 1934; Orcutt, 1999; Ortman, 2012).Such models, while diverse in approach, share a common weak-ness: imprecise archaeological measurements of population size atthe level of the site.
In the northern Rio Grande region and in the Southwest morebroadly, archaeologists rely on room counts to reconstruct popu-lation based upon estimated numbers of persons per room,allowing that some rooms housed whole families while storagerooms housed no one at all (Creamer,1993;Maxwell,1994; Ortman,2012). Researchers have taken two general approaches to extrap-olate room count estimates from collapsed adobe house mounds.The first and more traditional approach is to estimate subjectivelythe number of rooms based on previous excavation at analogoussites. The second is to measure the area of the mound andextrapolate room counts based on knowledge about the spatialextent of a room from either the site itself or comparable ancestralvillages (Fallon and Wening, 1987; Maxwell, 1994; Ortman, 2014;Wendorf, 1953). The latter method provides an empirical basis forthe estimate but can remain subjective when used to calculateroom counts from multi-storied structures. For example, Ortman
(2014) used mound height at Cuyumungue to determine if archi-tecture was one or two stories tall, and then adjusted his estimatesto account for upper story rooms. Yet mound heightmay be difficultto discern in many cases due to local factors such as vegetation,slope and soil composition that contribute to different erosionalprocesses and hence different room story estimates.
We propose an alternative method that relies on mound volume(rather than area or height) to estimate room counts and livingarea. This three-dimensional approach incorporates quantifiabledata for more accurate and objective estimations of the areal extentof rooms and also their height. Specifically, we use UAV and totalstation equipment to calculate the volume of house mounds at tenancestral Tewa sites in the Rio Chama watershed (Fig. 1). We usethis high-resolution data to create a model to extrapolate roomcounts and living area from the measured house mound volumeand estimate maximum population size at each site.
The ancestral Tewa villages of the Rio Chama watershed wereoccupied in the Rio Grande Classic period (A.D. 1350e1598) andconsist of some of the largest prehispanic sites in the AmericanSouthwest. As a consequence of a century of population coales-cence, these sites represent the places where disparate peoplecame together to forge a new identity and society. The populationhistory of ancestral Tewa villages in the Chama therefore is criticalto our understanding of Tewa origins and social persistence. Yet,before we can begin to explore these estimates we have to under-stand what a pueblo is comprised of, and why and how itdecomposes.
3. The life of a pueblo
Architecture, like all material culture, can be viewed as having alife of sorts (Appadurai, 1986). This includes a building's birth(construction), use, and eventual demise. To visualize this life his-tory Fig. 2 illustrates both occupied and maintained pueblo archi-tecture (from modern Taos Pueblo) and how similar structuresdecompose after four centuries of collapse, deflation, and erosion.While some material is certainly lost, we assume that when apueblo collapses the majority of its constituent parts (such as walls,floors, and roofs) will remain in a reconfigured, mounded state.
The principle element of Pueblo architecture is the room, usedprimarily for residence and storage. Rooms are organized intocontiguous, sometimes stacked clusters or roomblocks that main-tain shared walls, floors, and roofs. In northern New Mexico thesearchitectural elements are built primarily with earth, stone, andwood. Walls are constructed using ‘coursed adobe,’ in which localclay is mixed with water and applied in layers as the wall is builtupwards (Creamer, 1993:16; Jeançon, 1923:9; Wendorf, 1953:36).Wall interiors often display one or more layers of plaster (Stubbsand Stallings, 1953:29). Vigas, or logs of local timber, serve as themain support members for the roof. The vigas are overlaid withlatillas (poles of a smaller diameter), placed at right angles to thevigas, and finally covered with a layer of thatching and dry adobe(Creamer, 1993:20). Floors are nearly always comprised of a layer ofcompacted adobe and are sometimes finished with stone or clayslurry (Jeançon, 1923:14; Wendorf, 1953:43).
While the Pueblos hold claim to some of the oldest continuallyoccupied villages in the United States, the use life of an individualstructure can be surprisingly short. Elements in the environmentserve to weather earthen walls and roofs through wind, freeze andthaw cycles, precipitation, the absorption of groundwater, and in-sect infestations (Goodman-Elgar, 2008; Schiffer et al., 1987). Theseprocesses can be held at bay with regular maintenance and repair(Cameron, 1999a:29), but when people no longer inhabit a house,and the architecture is not maintained, roofs and walls quicklycollapse. This has the effect of removing structural height and
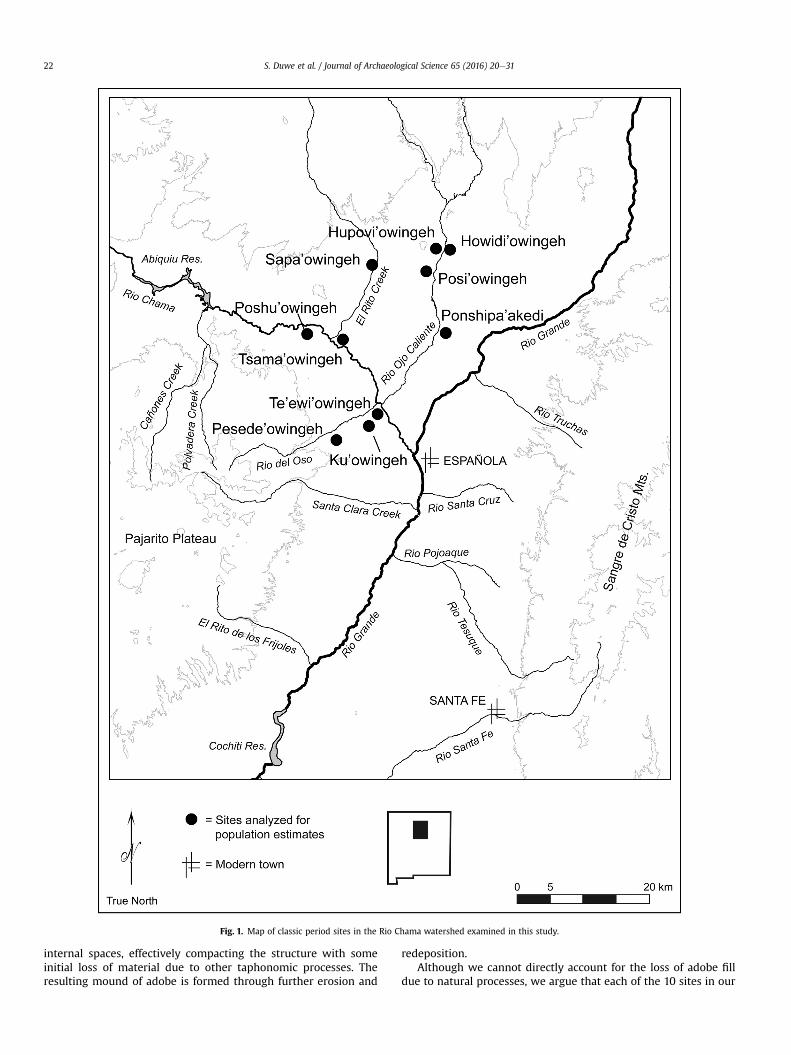
Fig. 1. Map of classic period sites in the Rio Chama watershed examined in this study.
S. Duwe et al. / Journal of Archaeological Science 65 (2016) 20e3122
internal spaces, effectively compacting the structure with someinitial loss of material due to other taphonomic processes. Theresulting mound of adobe is formed through further erosion and
redeposition.Although we cannot directly account for the loss of adobe fill
due to natural processes, we argue that each of the 10 sites in our

Fig. 2. A) The multi-story adobe architecture of modern Taos Pueblo, and B) the collapsed adobe house mounds of Hupovi'owingeh (foreground) and Howidi'owingeh (background).
Table 1Ancestral Tewa villages in the Rio Chama watershed examined in this project. Occupation dates were derived from a combination of dendrochronological and ceramic meandating.
Site name Site(LA) Dates of occupation Reference Cartographic method
Howidi'owingeh 71 A.D. 1377e1537 Duwe, 2011 UAV/Total stationTe'ewi'owingeh 252 A.D. 1365e1600 Duwe, 2011; Wendorf, 1953 UAVKu'owingeh 253 A.D. 1366e1500 Duwe, 2011 Total stationPoshu'owingeh 274 A.D. 1375e1500 Beal, 1987; Jeançon, 1923 UAVPonshipa'akedi'owingeh 297 A.D. 1312e1550 Duwe, 2011 UAV/Total stationPesede'owingeh 299 A.D. 1365e1600 Eiselt et al., 2013 Total stationSapa'owingeh 306 A.D. 1385e1526 Eiselt et al., 2013 UAVHupovi'owingeh 380 A.D. 1363e1550 Duwe, 2011 UAV/Total stationPosi'owingeh 632 A.D. 1344e1500 Duwe, 2011 Total stationTsama'owingeh II 908 A.D. 1324e1550 Duwe, 2011; Ortman, 2012 Total stationTsama'owingeh I 909 A.D. 1251e1500 Duwe, 2011; Ortman, 2012; Windes and McKenna, 2006 Total station
1 Federal Aviation Administration and National Environmental Policy Act regu-lations must be strictly adhered to prior to any implementation of UAV research onFederal (in this case Bureau of Land Management and National Forest) land.
S. Duwe et al. / Journal of Archaeological Science 65 (2016) 20e31 23
analysis share similar construction techniques and environmentalconditions driving erosion and redeposition. Therefore, while lossof materials is negligible, it is also likely proportional among thesites, making site comparisons appropriate. If we assume that themajority of adobe used to build an ancestral Tewa village is stillpresent at a site, albeit in a melted and collapsed form, then volumemeasurements of these house mounds should enable us toextrapolate the number of rooms and roofed-over living space ateach site.
4. Calculating architectural rubble volume
To quantify the volume of architectural rubble we producedthree-dimensional topographic models for each adobe housemound at the ten selected sites and calculated the total volume ofadobe in each site. Two methods were employed to create thesemodels: low-altitude aerial photography using a UAV and surveyinstrument mapping with a total station (Table 1). The twomethods were selected to map different sites based upon theavailability of pre-existing map data, labor, time, site-visibility, andsite accessibility. Subsequent volume figures were calculated usingArcGIS and Global Mapper.
4.1. Volumetric data and instrument mapping
The creation of a topographic surface map of large ancestralTewa sites using a total station required many points to capturechanges in elevation across the site. Six sites were previouslymapped with a total station: Howidi'owingeh, Ku'owingeh, Pon-shipa'akedi'owingeh, Hupovi'owingeh, Posi'owingeh, and
Tsama'owingeh (Duwe, 2011). Pesede'owingeh was also mappedwith a total station (as opposed to the UAV) because heavy vege-tation covered the site, making it difficult to see from the air.Mapping was performed using a Leica TC 307 Total Station that isaccurate to approximately 3 mm in favorable conditions. One ortwo arbitrary datums were established at the highest point on thelandscape. A Trimble GeoExplorer 2008 Series GeoXHGPSwas usedto record the UTM coordinates of these datums and all points shotwith the total station were georeferenced into a fixed, global co-ordinate system (NAD 83). Each sitewas gridded into 5� 10m unitsand points were taken at the corner of each unit. We also recordedpoints across architectural features, providing an average of1000e3000 points per site devoted to capturing subtle relief. Adigital elevationmodel (DEM)was constructed in ArcGIS 10.2 basedon the resulting three-dimensional point cloud.
4.2. Collecting volumetric data with a UAV
Low-altitude aerial photography is an emerging technology inarchaeological research that serves as a rapid and relatively inex-pensive technique for the large-scale mapping and spatial analysisof archaeological sites (e.g., Casana et al., 2014; Graves and Willis,2011; Liebmann et al., 2013; Lin et al., 2011; Verhoeven, 2009).1
Using this method we mapped three sites with no existing topo-graphic data (Te'ewi'owingeh, Poshu'owingeh, and Sapa'owingeh)

S. Duwe et al. / Journal of Archaeological Science 65 (2016) 20e3124
and three others (Howidi'owingeh, Hupovi'owingeh, and Pon-shipa'akedi'owingeh) to compare the data produced by the totalstation and UAV. We used a Swinglet CAM UAV outfitted with aCanon IXUS 220HS 12-megapixel digital camera to capture high-resolution photographs of each site. Multiple overlapping flyoversat different elevations were conducted. Twelve control pointsmarked with aerial photo targets established spatial controls acrosseach site prior to flight. After the flyovers were completed, a SokkiaRadian IS RTK unit was used to establish the precise UTM locationsof 12 targets. These coordinates served to georeference the digitalimages, establishing the precise location of the imagery to within10 cm under optimal conditions. The resulting output was pro-cessed using Structure from Motion software to derive a three-dimensional polygonal mesh of the ground surface. The softwareortho-rectified the series of images to establish a uniform scale,remove any distortion, and produce digital ortho-photos and a DEM(Fig. 3).
4.3. Calculating adobe house mound volume
To calculate the volume of the adobe house mounds in cubicmeters (m3) at each of the ten ancestral Tewa sites, we created amodel of the natural ground surface, representing how thetopography of the site would appear without architectural rubble.We then ‘subtracted’ this model from the original DEM (whichinclude the volume of architectural house mounds), resulting involume figures for each mound.
In order to construct a model of the natural ground surface wemeasured the ground elevation immediately surrounding eachhouse mound (based on the spatial extent of the mound) andsubstituted these elevations for the original elevation within themound boundaries. The extent of the mounds was determinedfrom previous detailed instrument mapping (Duwe, 2011). At siteswith no previous survey mapping (Te'ewi'owingeh, Posh-u'owingeh, and Sapa'owingeh), the extent of the adobe moundswere drawn based on the three-dimensional surface model pro-duced by the DEM.We then created a DEM of the estimated naturalground surface using these modified three-dimensional points.Using ArcGIS we clipped the original DEM (of the site surfaceincluding the mounded relief) based on the extent of each mound.The Measure Volume Between Surfaces tool in Global Mapper wasused to subtract the estimated natural ground surface model fromeach of these newly clipped mound models. This method providedthe volume of collapsed adobe for each house mound within a site.The total reconstructed volumes of surveyed sites are listed inTable 6.
4.4. Comparison of techniques
Although the method used to calculate mound volume is iden-tical across all ten sites, we employed two methods to producethree-dimensional point clouds and the resulting DEMS: low-altitude aerial photography and survey instrument mapping. Toensure that these data were accurate, we compared volume esti-mates of a single long linear mound from each of three sites thatwere mapped by both methods: Howidi'owingeh, Pon-shipa'akedi'owingeh, and Hupovi'owingeh. These particular areaswere chosen because of their relatively straightforward moundextent (as opposed to more complex rectangular roomblocks withopen central plazas). Table 2 presents the measurements anddescriptive statistics for individual roomblocks obtained by eachtechnique. A two-tailed student's t-test for independent meansdemonstrates no significant differences at the 0.01 level in themean values of mound volume estimates generated by the totalstation and by the UAV (t ¼ 0.0474, df ¼ 4, p ¼ .9645). The two
methods produce remarkably close results and neither appears toover or underestimate volume based on the comparison.
5. The pueblo decomposition model
The previous step calculated the volume of adobe architecturalrubble in each collapsed roomblock for the ten ancestral Tewa sites.Of course, at one time the adobe in the house mounds was recon-figured quite differently, comprising the walls, the floors, and theroofs of pueblo architecture. To extrapolate the number of roomsoriginally present at each site we needed to calculate the averageamount of fill per room that would be created through melting andcollapse and then divide this value into the measured mound vol-ume. To determine this ‘fill per room’ figure we built a pueblodecompositionmodel that incorporates known information about arepresentative site (the number of ground-floor rooms, wall length,and floor and roof area) to calculate a hypothetical total number ofrooms. The total number of rooms are then divided into themeasured volume to produce an average ‘fill per room’ figure acrossthe site.
The decomposition model requires both architectural data andmound volumes from the same site. Ideally, this could be achievedby recording the three dimensional topography of the site (andmeasuringmound volume) prior to excavation, where room counts,wall length, and floor/roof area could be measured and calculated.However, this information was not available and instead wedevised an alternative way to gather this architectural data at thesite of Ponshipa'akedi'owingeh.
In July 2012 recent monsoonal rains at Ponshipa'akedi'owingehencouraged the growth of extensive stands of Russian knapweed(Rhaponticum repens) that exposed the tops of adobe roomblockwalls on six of the site's seven house mounds, resulting in highlyvisible room outlines (Fig. 4). This afforded us the opportunity tomap the architectural corners of numerous walls with a total sta-tion. We georeferenced the points to the site's datum and enteredthese data into ArcGIS where we drew known walls and clearlydemarcated 490 rooms. Based on our knowledge of the dimensionsand orientations of these rooms, as well as the extent of themounded adobe, we inferred the location of hypothetical walls andcounted an additional 604 rooms. We estimate a total of 1094surface rooms at Ponshipa'akedi'owingeh (Fig. 5, Table 3). Usingthese data we then calculated the total wall lengths and floor/roofarea for each house mound.
With this information, in addition to the mound volumemeasured by the UAV, it was possible to build a decompositionmodel to estimate the total number of surface and multi-storyrooms at Ponshipa'akedi'owingeh and calculate the average valueof adobe volume per room. This room volume was applied to theother nine remaining Classic period Pueblo sites in the Rio Chamawatershed to estimate total room counts. The following sectionsdetail each step of the process.
5.1. One-story volume estimates
Through our mapping of the architecture at Pon-shipa'akedi'owingeh we propose that there were a minimum of1094 rooms represented by the volume of the adobe house mounds(Step 1 of Table 5). To estimate the volume that this known numberof rooms produced, we built a decomposition model that combinesboth the information recorded in site mapping (length of walls,area of floor/roofs) with assumed values from published reports ofregional pueblo architecture (Table 4). The model calculates thetotal volume of adobe required to build one-story of rooms basedon the volume of walls, roofs, and floors. This is achieved bycalculating the wall volume, roof volume, and floor volume for each

Fig. 3. An aerial image mosaic collected by the UAV overlaid with contours from the resulting DEM from the site of Ponshipa'akedi'owingeh (LA 297).
Table 2Comparison of volume estimates (m3) between the methods of survey instrumentmapping (total station) and low-altitude aerial photography (UAV) from large linearroomblocks at Howidi'owingeh, Ponshipa'akedi'owingeh, and Hupovi'owingeh.
LA# Site Roomblock Total station UAV
71 Howiri'owingeh RB 2 2141.8 1973297 Ponshipa'akedi'owingeh RB 5 2502.5 2746380 Hupovi'owingeh RB 1 1564.1 1559.3
Mean 2069.5 2092.8Standard deviation 473.4 602.3
S. Duwe et al. / Journal of Archaeological Science 65 (2016) 20e31 25
house mound using available data from Ponshipa'akedi'owingeh(total wall length and floor/roofed area, Step 2 of Table 5) and as-sumptions regarding architectural practices from excavated sites inthe region (Fig. 6). These individual calculations (Step 3 of Table 5)were then summed to produce a hypothetical one-story volumeestimate for each house mound (Step 4 of Table 5). We purposelycalculated floor space for the entire roofed area (including walls),even though there are typically no floors under walls. This was toaccount for wall foundations that are comprised of stone cobbles of
approximately the same depth (Jeançon, 1923; Wendorf, 1953).
5.2. Coefficient of unaccounted rooms and total rooms
The previous step calculated the hypothetical volume of fill foreach house mound at Ponshipa'akedi'owingeh assuming the sitewas one-story tall. Of course, archaeologists believe that manyancestral Tewa villages contained multi-story roomblocks,including the excavators at Ponshipa'akedi'owingeh (Bug�e, 1978,1979). To understand which roomblocks may have had multiplestories and additional rooms we divided the observed volume ofadobe (measured by the UAV) by the one-story hypothetical vol-ume calculated in Section 5.1 (Step 5 of Table 5). This produced acoefficient of how much adobe fill is unaccounted for by thedecomposition model.
For example, Roomblocks 1, 3, and 5 all have a coefficient of 1.1.This means that there is nearly a one-to-one relationship betweenthe hypothetical one-story volume and the observed mound vol-ume, suggesting that these were one-story structures. Conversely,Roomblock 4 has a coefficient of 2.0, suggesting that there is twice

Fig. 4. Defined walls of Ponshipa'akedi'owingeh (LA 297).
S. Duwe et al. / Journal of Archaeological Science 65 (2016) 20e3126
as much observed mounded adobe than predicted by the decom-position model for a hypothetical one-story volume. This room-block likely contains double its ground-floor rooms. The number ofstories in each roomblock is still difficult to determine, but it ispossible to differentiate between a single and multi-story structureusing this technique.
To calculate the total estimated number of rooms in eachroomblock of Ponshipa'akedi'owingeh (both ground floor and up-per story) we multiplied this coefficient by the total number ofground-floor rooms determined through wall mapping. This pro-vided an estimate of the total number of rooms represented by theadobe mound (Step 6 of Table 5).
5.3. Average volume of adobe fill per room
To determine the average volume of adobe fill per room wedivided the observed volume of adobe fill (measured by the UAV)by the total number of rooms calculated in Section 5.2 for eachhouse mound. This provided us with an average volume index offill/room (Step 7 of Table 5). We averaged this figure across the sixroomblocks and calculated an average adobe volume/room index of9.68 m3 (Step 8 of Table 5). This is a somewhat generalized figurebecause rooms share walls, but it nonetheless provides a moreaccurate estimate of room counts based on adobe mound volumefor the other nine Classic period sites.
5.4. Applying the model to other ancestral Tewa sites
Based on excavation data (Bug�e, 1978, 1979; Fallon and Wening,1987; Jeançon, 1923; Wendorf, 1953) construction technique,
architectural layout, and room function appear to be similar be-tween Classic period ancestral Tewa sites in the Rio Chama water-shed. Thereforewe found it reasonable to apply the averaged adobevolume/room index from Ponshipa'akedi'owingeh to contempora-neous sites in the Rio Chamawatershed. To estimate room counts atthe nine other sites we simply divided the volume/room index of9.68 m3 into the observed adobe fill volume of the house mound ateach site and rounded these values to the nearest whole roomnumber (Table 6). This approach was somewhat modified at Pon-shipa'akedi'owingeh where only Roomblock 7 was calculated thisway (the other roomblocks were calculated in the model) andHowidi'owingeh where only half the site was analyzed (roomcounts from the excavated eastern portionwere added from the sitereport; Fallon and Wening, 1987).
Our calculations were similar to earlier estimates by field ar-chaeologists with some noticeable differences (Table 6), includingMaxwell's (1988) estimate of low room counts at Posi'owingeh. Webelieve this discrepancy stems from Maxwell's use of mound areaand our examination of mound volume. Posi'owingeh has thehighest house mounds among sites in the Rio Chama watershed(Duwe, 2011), and by not accounting for the additional multi-storyrooms Maxwell's estimates were considerably less than ours. Webelieve that this demonstrates the applicability of our model toestimate multiple stories and additional rooms.
6. Estimation of maximum architectural capacity
Once room counts were calculated, we could convert thismeasurement to estimate the maximum number of individuals ateach site. While room counts are often used in Southwest

Fig. 5. Wall outlines, mound extent, and calculated room counts for each roomblock at Ponshipa'akedi'owingeh (LA 297).
S. Duwe et al. / Journal of Archaeological Science 65 (2016) 20e31 27
archaeology as a proxy for population, we follow a number of re-searchers in estimating population based on roofed-over space(Naroll, 1962). To convert room counts to roofed-over space wemultiplied the average size of rooms at comparable regional sites by
the number of rooms (Table 7). Published statistics for room areavary widely from 4.8 to 12.7 m2 at Te'ewi'owingeh (Wendorf, 1953)to 4.3e11.5m2 at Poshu'owingeh (Jeançon,1923).We used themostrecent excavation data available for the Rio Chama watershed, the

Table 3Mean (and standard deviation) in meters of the length, width, and area of rooms from six roomblocks at Ponshipa'akedi'owingeh (LA 297).
Roomblock Total (n ¼ 1094)
1 (n ¼ 63) 2 (n ¼ 216) 3 (n ¼ 182) 4 (n ¼ 105) 5 (n ¼ 274) 6 (n ¼ 254)
Length 4.96 (0.61) 4.27 (0.74) 3.72 (1) 3.31 (0.59) 4.06 (0.96) 4.39 (1.08) 4.1 (0.99)Width 2.09 (0.31) 2.43 (0.36) 2.49 (0.44) 2.49 (0.33) 2.46 (0.43) 2.47 (0.43) 2.44 (0.41)Area 9.73 (2.02) 9.61 (2.36) 8.5 (3.12) 7.51 (1.95) 9.15 (2.94) 9.87 (3.04) 9.18 (2.85)
Table 4Data from excavated pueblo sites in northern New Mexico used to establish assumed values in the decomposition model.
Features Value Reference
Wall width 0.32 m Average from LA 71 (Fallon and Wening, 1987), LA 252 (Wendorf, 1953), and LA 908 (Greenlee, 1933).Wall height 2.60 m Average viga height at Arroyo Hondo (Creamer, 1993) and Pindi Pueblo (Stubbs and Stallings, 1953), plus estimated roof coping (0.30 m,
Mindeleff, 1891:151).Roof thickness 0.30 m Range of 21e31 cm at Arroyo Hondo (Creamer, 1993); estimated on higher end due to larger values across the Southwest (0.55 m; Riggs,
2001:95).Floor thickness 0.10 m Average range of 3e10 cm at Arroyo Hondo (Creamer, 1993) and LA 71 (Wendorf, 1953). Fill was used to prepare floor leading to higher
estimate.
Table 5Data from Ponshipa'akedi'owingeh (LA 297) used to create the average volume of adobe fill/room metric.
Step Section described Value RB 1 RB 2 RB 3 RB 4 RB 5 RB 6
1 5.0 Ground floor rooms 63 216 182 105 274 2542 5.1 Wall length (m) 526.1 1616.7 1224.9 664.4 1925.9 1887.12 5.1 Roofed/floor area (m2) 608.6 2114.0 1585.9 791.7 2561.0 2546.43 5.1 Wall volume (m3) 437.7 1345.1 1019.1 552.8 1602.4 1570.13 5.1 Roof volume (m3) 182.6 634.2 475.8 237.5 768.3 763.93 5.1 Floor volume (m3) 60.9 211.4 158.6 79.2 256.1 254.64 5.1 Total hypothetical volume (m3) 681.1 2190.7 1653.5 869.4 2626.8 2588.6
4.3 Measured mound volume (m3) 726 3195 1791 1736 2746 43755 5.2 Coefficient of unaccounted rooms 1.1 1.5 1.1 2.0 1.1 1.76 5.2 Total rooms 67 315 197 210 286 4297 5.3 Volume/room index (m3) 10.8 10.1 9.1 8.3 9.6 10.28 5.3 Average volume/room index (m3) 9.68
S. Duwe et al. / Journal of Archaeological Science 65 (2016) 20e3128
site of Howidi'owingeh (Fallon and Wening, 1987), which reportedan average roofed-over living space of 9.76 m2.
To convert roofed-over space to numbers of individuals it wasnecessary to divide the figures for the roofed-over space by aconstant (the area of roofed-over area per person, Table 7). Popu-lation estimates were arrived at by dividing the total roofed overspace in square meters by one of four constants for per-capita in-vestment in architecture: 3 m2 (Clarke, 1971), 5.3 m2 (Hill, 1970),6 m2 (Casselberry 1974), and 10 m2 (Naroll, 1962).2 Researchersworking in the Chama watershed have used calculations that as-sume a 5.3 m2e6 m2 living requirement per individual (see forexample Anschuetz, 1998; Maxwell, 1994), or they assume oneperson per room if average room sizes are in the range of four to10 m squared in areal extent (Duwe, 2011; Ortman, 2012). Theseconstants yield estimates of between 12,975 and 43,250 peopleliving in the large Classic period villages of the Rio Chama
2 Casselberry (1974) uses worldwide ethnographic data to suggest a ratio of 1person per 6 m2 of floor space for groups living in multifamily dwellings. Clark(1971) and Hill (1970) offer ratios of 1 person per 3 m2 and 1 person per 5.3 m2
of floor space, respectively, based on their reviews of ethnohistorical Pueblo ar-chitecture and population. Naroll (1962), who includes single-family households,offers the most conservative estimate of 1 person per 10 m2 of floor area. AsMaxwell (1988:9e10) recognizes, even though ethnographic data identify a positiverelationship between dwelling size and the number of its residents, decisionsgoverning building size are the products of many other factors. Such conditioningvariables include co-residential group organization, household activity regimes,volume of storage space, practical engineering parameters imposed by constructionmaterials and architectural design, and status of principal household memberswithin their communities.
watershed (if 100 percent occupancy is assumed, see Table 7). Wefeel most comfortable with the conservative estimate of 10 m2 perperson occupancy (12,975 people), based upon the availability ofagricultural land for food production and regional environmentalproductivity (Anschuetz, 1998, 2007).
7. Discussion and conclusion
The resulting estimates of population represent the maximumarchitectural capacities for ancestral Tewa villages (and the water-shed as a whole) if these villages were completely occupied at 100percent capacity. However, this approach ignores the processes ofaccretional site growth (and decline) for large and long-occupiedvillages. Archaeologists acknowledge that a site need not be occu-pied fully throughout its entire use life (Shacht, 1984). Case studiesin the Pueblo Southwest illustrate that a village can grow gradually(Riggs, 2001) and can be occupied sparsely for long periods of time(Creamer, 1996). Over the course of time, pueblo rooms areconstantly remodeled and their function changes, from habitation,to storage, to fill (Cameron, 1999; Crown, 1991). Therefore, whileour maximum architectural capacity figures provide an upper limitto how many people may have lived in the Rio Chama watershed,ourmodel only accounts for the first (but critical) step in estimatingmomentary population histories. We anticipate future researchthat combines additional lines of evidence such as dates for intra-site occupations and models to apportion population growth for amore fully developed population history of the region. Such esti-mates also may be evaluated against calculations of built agricul-tural space and the energetic requirements of farming to determine

Fig. 6. Architectural assumptions used in the roomblock decomposition model and formulas used to calculate hypothetical one-story roomblock volume (base drawing from Riggs,2001, Fig. 3.3).
Table 6Comparison of total mound volume for each site, room counts, and previous project's room count estimates. *Volume does not represent entire site.
LA# Site name Volume (m3) Rooms Previous room estimates
71 Howdi'owingeh 12,528.8* 1428 1671 (Fallon and Wening, 1987)252 Te'ewi'owingeh 8633 892 600 (Wendorf, 1953)253 Ku'owingeh 5042.1 521 554 (Maxwell, 1988)274 Poshu'owingeh 10,783 1114 1214 (Maxwell, 1988)297 Ponshipa'akedi’owingeh 264.2* 1535 1507 (Maxwell, 1988)299 Pesede'owingeh 5741.3 593 375 (Maxwell, 1988)306 Sapa'owingeh 54,599 2541 2561 (Maxwell, 1988)380 Hupovi'owingeh 9175.4 948 1074 (Maxwell, 1988)632 Posi'owingeh 21,348.1 2204 1024 (Maxwell, 1988)908 Tsama'owingeh II 12,873.1 1330 1176 (Maxwell, 1988)909 Tsama'owingeh I 1822.4 188 120 (Windes and McKenna, 2006)TOTAL 13,294 11,876
S. Duwe et al. / Journal of Archaeological Science 65 (2016) 20e31 29
the maximum number of people that the land could sustain.Our model demonstrates that a three-dimensional approach to
extrapolate room counts and living area provides Southwesternarchaeologists a accurate, objective, and consistent tool for esti-mating the maximum architectural capacity of an ancestral Pueblovillage. We argue that the analysis of adobe volume is the best way
to encompass the variability inherent in long-lived, multi-storysites. While we do not address how population growth and declineis apportioned, the construction of maximum population estimatescan, by themselves, address questions of anthropological concern.This is illustrated at the site of Posi'owingeh where our calculationincreased the total number of site rooms by a factor of 2.2 over
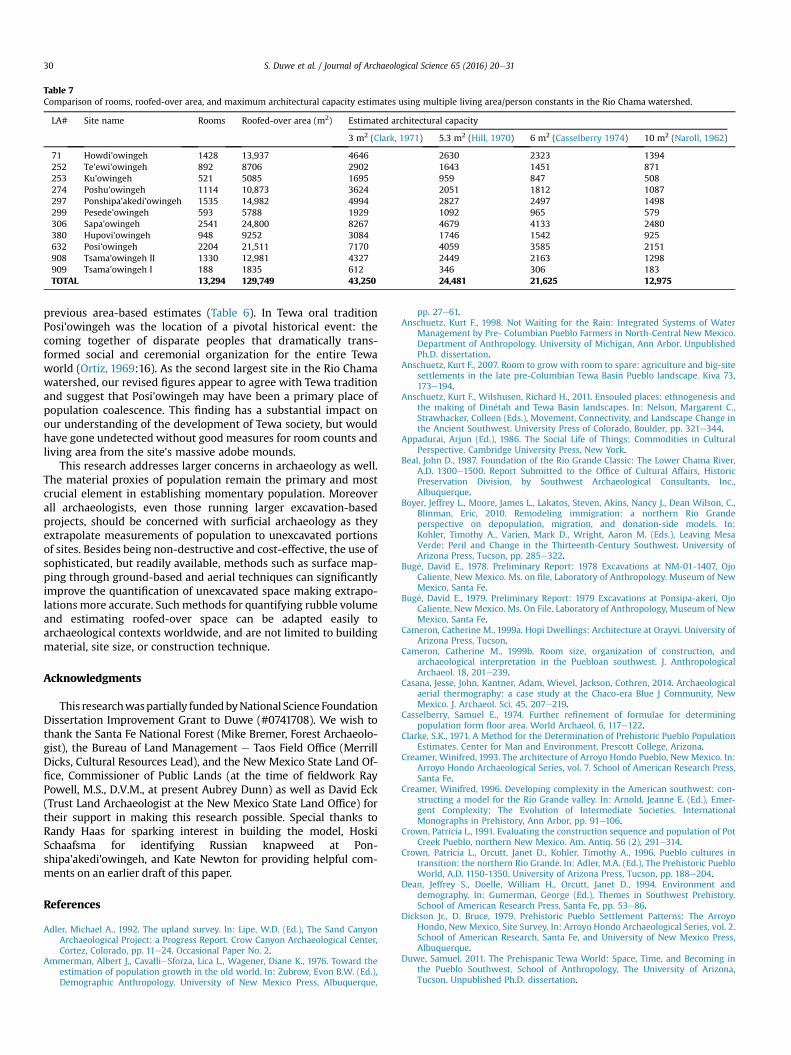
Table 7Comparison of rooms, roofed-over area, and maximum architectural capacity estimates using multiple living area/person constants in the Rio Chama watershed.
LA# Site name Rooms Roofed-over area (m2) Estimated architectural capacity
3 m2 (Clark, 1971) 5.3 m2 (Hill, 1970) 6 m2 (Casselberry 1974) 10 m2 (Naroll, 1962)
71 Howdi'owingeh 1428 13,937 4646 2630 2323 1394252 Te'ewi'owingeh 892 8706 2902 1643 1451 871253 Ku'owingeh 521 5085 1695 959 847 508274 Poshu'owingeh 1114 10,873 3624 2051 1812 1087297 Ponshipa'akedi’owingeh 1535 14,982 4994 2827 2497 1498299 Pesede'owingeh 593 5788 1929 1092 965 579306 Sapa'owingeh 2541 24,800 8267 4679 4133 2480380 Hupovi'owingeh 948 9252 3084 1746 1542 925632 Posi'owingeh 2204 21,511 7170 4059 3585 2151908 Tsama'owingeh II 1330 12,981 4327 2449 2163 1298909 Tsama'owingeh I 188 1835 612 346 306 183TOTAL 13,294 129,749 43,250 24,481 21,625 12,975
S. Duwe et al. / Journal of Archaeological Science 65 (2016) 20e3130
previous area-based estimates (Table 6). In Tewa oral traditionPosi'owingeh was the location of a pivotal historical event: thecoming together of disparate peoples that dramatically trans-formed social and ceremonial organization for the entire Tewaworld (Ortiz, 1969:16). As the second largest site in the Rio Chamawatershed, our revised figures appear to agree with Tewa traditionand suggest that Posi'owingeh may have been a primary place ofpopulation coalescence. This finding has a substantial impact onour understanding of the development of Tewa society, but wouldhave gone undetected without good measures for room counts andliving area from the site's massive adobe mounds.
This research addresses larger concerns in archaeology as well.The material proxies of population remain the primary and mostcrucial element in establishing momentary population. Moreoverall archaeologists, even those running larger excavation-basedprojects, should be concerned with surficial archaeology as theyextrapolate measurements of population to unexcavated portionsof sites. Besides being non-destructive and cost-effective, the use ofsophisticated, but readily available, methods such as surface map-ping through ground-based and aerial techniques can significantlyimprove the quantification of unexcavated space making extrapo-lations more accurate. Suchmethods for quantifying rubble volumeand estimating roofed-over space can be adapted easily toarchaeological contexts worldwide, and are not limited to buildingmaterial, site size, or construction technique.
Acknowledgments
This researchwaspartially fundedbyNational Science FoundationDissertation Improvement Grant to Duwe (#0741708). We wish tothank the Santa Fe National Forest (Mike Bremer, Forest Archaeolo-gist), the Bureau of Land Management e Taos Field Office (MerrillDicks, Cultural Resources Lead), and the New Mexico State Land Of-fice, Commissioner of Public Lands (at the time of fieldwork RayPowell, M.S., D.V.M., at present Aubrey Dunn) as well as David Eck(Trust Land Archaeologist at the New Mexico State Land Office) fortheir support in making this research possible. Special thanks toRandy Haas for sparking interest in building the model, HoskiSchaafsma for identifying Russian knapweed at Pon-shipa'akedi'owingeh, and Kate Newton for providing helpful com-ments on an earlier draft of this paper.
References
Adler, Michael A., 1992. The upland survey. In: Lipe, W.D. (Ed.), The Sand CanyonArchaeological Project: a Progress Report. Crow Canyon Archaeological Center,Cortez, Colorado, pp. 11e24. Occasional Paper No. 2.
Ammerman, Albert J., CavallieSforza, Lica L., Wagener, Diane K., 1976. Toward theestimation of population growth in the old world. In: Zubrow, Evon B.W. (Ed.),Demographic Anthropology. University of New Mexico Press, Albuquerque,
pp. 27e61.Anschuetz, Kurt F., 1998. Not Waiting for the Rain: Integrated Systems of Water
Management by Pre- Columbian Pueblo Farmers in North-Central New Mexico.Department of Anthropology. University of Michigan, Ann Arbor. UnpublishedPh.D. dissertation.
Anschuetz, Kurt F., 2007. Room to grow with room to spare: agriculture and big-sitesettlements in the late pre-Columbian Tewa Basin Pueblo landscape. Kiva 73,173e194.
Anschuetz, Kurt F., Wilshusen, Richard H., 2011. Ensouled places: ethnogenesis andthe making of Din�etah and Tewa Basin landscapes. In: Nelson, Margarent C.,Strawhacker, Colleen (Eds.), Movement, Connectivity, and Landscape Change inthe Ancient Southwest. University Press of Colorado, Boulder, pp. 321e344.
Appadurai, Arjun (Ed.), 1986. The Social Life of Things: Commodities in CulturalPerspective. Cambridge University Press, New York.
Beal, John D., 1987. Foundation of the Rio Grande Classic: The Lower Chama River,A.D. 1300e1500. Report Submitted to the Office of Cultural Affairs, HistoricPreservation Division, by Southwest Archaeological Consultants, Inc.,Albuquerque.
Boyer, Jeffrey L., Moore, James L., Lakatos, Steven, Akins, Nancy J., Dean Wilson, C.,Blinman, Eric, 2010. Remodeling immigration: a northern Rio Grandeperspective on depopulation, migration, and donation-side models. In:Kohler, Timothy A., Varien, Mark D., Wright, Aaron M. (Eds.), Leaving MesaVerde: Peril and Change in the Thirteenth-Century Southwest. University ofArizona Press, Tucson, pp. 285e322.
Bug�e, David E., 1978. Preliminary Report: 1978 Excavations at NM-01-1407, OjoCaliente, New Mexico. Ms. on file, Laboratory of Anthropology. Museum of NewMexico, Santa Fe.
Bug�e, David E., 1979. Preliminary Report: 1979 Excavations at Ponsipa-akeri, OjoCaliente, NewMexico. Ms. On File. Laboratory of Anthropology, Museum of NewMexico, Santa Fe.
Cameron, Catherine M., 1999a. Hopi Dwellings: Architecture at Orayvi. University ofArizona Press, Tucson.
Cameron, Catherine M., 1999b. Room size, organization of construction, andarchaeological interpretation in the Puebloan southwest. J. AnthropologicalArchaeol. 18, 201e239.
Casana, Jesse, John, Kantner, Adam, Wievel, Jackson, Cothren, 2014. Archaeologicalaerial thermography: a case study at the Chaco-era Blue J Community, NewMexico. J. Archaeol. Sci. 45, 207e219.
Casselberry, Samuel E., 1974. Further refinement of formulae for determiningpopulation form floor area. World Archaeol. 6, 117e122.
Clarke, S.K., 1971. A Method for the Determination of Prehistoric Pueblo PopulationEstimates. Center for Man and Environment, Prescott College, Arizona.
Creamer, Winifred, 1993. The architecture of Arroyo Hondo Pueblo, New Mexico. In:Arroyo Hondo Archaeological Series, vol. 7. School of American Research Press,Santa Fe.
Creamer, Winifred, 1996. Developing complexity in the American southwest: con-structing a model for the Rio Grande valley. In: Arnold, Jeanne E. (Ed.), Emer-gent Complexity: The Evolution of Intermediate Societies. InternationalMonographs in Prehistory, Ann Arbor, pp. 91e106.
Crown, Patricia L., 1991. Evaluating the construction sequence and population of PotCreek Pueblo, northern New Mexico. Am. Antiq. 56 (2), 291e314.
Crown, Patricia L., Orcutt, Janet D., Kohler, Timothy A., 1996. Pueblo cultures intransition: the northern Rio Grande. In: Adler, M.A. (Ed.), The Prehistoric PuebloWorld, A.D. 1150-1350. University of Arizona Press, Tucson, pp. 188e204.
Dean, Jeffrey S., Doelle, William H., Orcutt, Janet D., 1994. Environment anddemography. In: Gumerman, George (Ed.), Themes in Southwest Prehistory.School of American Research Press, Santa Fe, pp. 53e86.
Dickson Jr., D. Bruce, 1979. Prehistoric Pueblo Settlement Patterns: The ArroyoHondo, New Mexico, Site Survey. In: Arroyo Hondo Archaeological Series, vol. 2.School of American Research, Santa Fe, and University of New Mexico Press,Albuquerque.
Duwe, Samuel, 2011. The Prehispanic Tewa World: Space, Time, and Becoming inthe Pueblo Southwest. School of Anthropology, The University of Arizona,Tucson. Unpublished Ph.D. dissertation.

S. Duwe et al. / Journal of Archaeological Science 65 (2016) 20e31 31
Duwe, Samuel, Anschuetz, Kurt F., 2013. Ecological uncertainty and organizationalflexibility on the prehispanic Tewa landscape: notes from the northern frontier.In: Vierra, Bradley J. (Ed.), Mountain and Valley: Understanding Past Land Use inthe Northern Rio Grande Valley, NewMexico. University of Utah Press, Salt LakeCity, pp. 95e112.
Fallon, Denise, Wening, Karen, 1987. Howiri: Excavations at a Northern Rio GrandeBiscuit Ware Site, Laboratory of Anthropology Notes 261b. Museum of NewMexico Research Section, Santa Fe.
Goodman-Elgar, Melissa, 2008. The devolution of mudbrick: ethnoarchaeology ofabandoned earthen dwellings in the Bolivian Andes. J. Archaeol. Sci. 35,3057e3071.
Graves, Tim B., Willis, Mark, 2011. Permian Basin MOA Grant Program Investigationsat LA 143472: an Unusual Village in Southeastern New Mexico. Report of In-vestigations 789EP. Geo-Marine, El Paso, Texas.
Greenlee, Robert, 1933. Archaeological Sites in the Chama Valley, and Report on theExcavations at Tsama, 1929-1933. Manuscript on File. Laboratory of Anthro-pology, Museum of New Mexico.
Hassan, Fekri A., 1978. Demographic archaeology. In: Schiffer, Michael B. (Ed.),Advanced in Archaeological Method and Theory, vol. 1. Academic Press, NewYork, pp. 49e103.
Hassan, Fekri A., 1981. Demographic Archaeology. Academic Press, New York.Havilland, William A., 1972. Family size, prehistoric population estimates, and the
ancient Maya. Am. Antiq. 37, 135e139.Hill, James N., 1970. Broken K Pueblo: Prehistoric Social Organization in the
American Southwest. University of Arizona Press, Tucson. Anthropological Pa-pers of the University of Arizona No. 18.
Jeançon, Jean A., 1923. Excavations in the Chama Valley, New Mexico. Bulletin 81.Bureau of American Ethnology, Washington, D.C.
Liebmann, Matt, Walker, Chester, Sturm, Jennie, 2013. Mapping archaeological sitesusing an unmanned aerial vehicle. NewsMAC, pp. 8e10.
Lin, Albert Yu-Min, Novo, Alexandre, Har-Noy, Shay, Ricklin, Nathan D.,Stamatiou, Kostas, 2011. Combining GeoEye-1 satellite remote sensing, UAVaerial imaging, and geophysical surveys in anomaly detection applied toarchaeology. IEEE J. Sel. Top. Appl. Earth Observations Remote Sens. 4, 870e876.
Maxwell, Timothy D., 1988. Prehistoric Population Change in the Lower Rio ChamaValley, Northwestern New Mexico. Ms. On File. Office of Archaeological Studies,Museum of New Mexico, Santa Fe.
Maxwell, Timothy D., 1994. Prehistoric population change in the lower Rio Chamavalley, northwestern New Mexico. In: Paper Presented at the 59th AnnualMeeting of the Society for American Archaeology, Anaheim. CA.
Mera, Harry P., 1934. A Survey of the Biscuit Ware Area in Northern New Mexico.Technical Series, Bulletin No. 6. Laboratory of Anthropology, Santa Fe.
Mindeleff, Victor, 1891. A study of Pueblo architecture: Tusayan and Cibola. In: Part1 of Annual Report, Smithsonian Institution Bureau of American Ethnology, vol.8. Government Printing Office, Washington D.C.
Naroll, Raoul, 1962. Floor area and settlement population. Am. Antiq. 27 (4),587e589.
Orcutt, Janet D., 1999. Demography, settlement, and agriculture. In: Powers, R.P.,
Orcutt, J.D. (Eds.), The Bandelier Archaeological Survey, volume I, pp. 219e308.Intermountain Cultural Resource Management Professional Paper 57, Santa Fe.
Ortiz, Alfonso, 1969. The Tewa World: Space, Time, Being, and Becoming in a PuebloSociety. University of Chicago Press, Chicago.
Ortman, Scott G., 2012. Winds from the North: Tewa Origins and Historical An-thropology. University of Utah Press, Salt Lake City.
Ortman, Scott G., 2014. Uniform probability density analysis and population historyin the northern Rio Grande. J. Archaeol. Method Theory December (2014).
Parsons, Elsie C., 1929. The Social Organization of the Tewa of New Mexico. TheAmerican Anthropological Association, Menasha, Wis.
Parsons, Elsie C., 1994. Tewa Tales. University of Arizona Press, Tucson.Riggs, Charles R., 2001. The Architecture of Grasshopper Pueblo. University of Utah
Press, Salt Lake City.Santley, Robert S., 1990. Demographic archaeology in the Maya Lowlands. In: Pat-
rick Culbert, T., Rice, Don (Eds.), Precolumbian Population History in the MayaLowlands. University of New Mexico Press, Albuquerque, pp. 325e344.
Schacht, Robert M., 1984. The contemporaneity problem. Am. Antiq. 49 (4),678e695.
Schiffer, Michael B., Bar�on, A.M., Cort�es, P.P., Sepulveda, J.T., 1987. Deterioration ofadobe structures: a case study from San Pedro de Atacama, northern Chile. In:Nash, D.T., Petraglia, M.S. (Eds.), Natural Formation Processes and the Archae-ological Record. BAR International Series 352, Oxford.
Stubbs, Stanley A., Stallings, William A., 1953. The excavation of Pindi Pueblo, NewMexico. In: Monographs of the School of American Research and the Laboratoryof Anthropology, 18. School of American Research Press, Santa Fe.
Sunday, Eiselt B., Andrew, J. Darling, Duwe, Samuel, 2013. Population History,Agricultural Land Use and Cultural Continuity in the Ohkay Owingeh Home-land, Rio Chama Watershed (New Mexico v. Aragon. Report prepared for OhkayOwingeh Pueblo, Plaintiff).
Varien, Mark D., Ortman, Scott G., 2005. Accumulations research in the southwestUnited States: middle-range theory for big picture problems. World Archaeol.37 (1), 132e155.
Verhoeven, Geert J., 2009. Providing an archaeological bird’s-eye view e an overallpicture of ground-based means to execute low-altitude aerial photography(LAAP) in archaeology. Archaeol. Prospect. 16, 233e249.
Warrick, Gary, 2008. A Population History of the Huron-Petun, A.D. 500-1650.Cambridge University Press, New York.
Webster, David L., Freter, Anncorinne, 1990. The demography of Late Classic Copan.In: Patrick Culbert, T., Rice, Don (Eds.), Precolumbian Population History in theMaya Lowlands. University of New Mexico Press, Albuquerque, pp. 37e62.
Wendorf, Fred, 1953. Excavations at Te’ewi. In: Wendorf, Fred (Ed.), SalvageArchaeology of the Chama Valley, New Mexico. School of American ResearchPress, Santa Fe.
Windes, Thomas C., McKenna, Peter J., 2006. The kivas of Tsama (LA 908). In:Wiseman, Regge N., O'Laughlin, Thomas C., Snow, Cordelia T. (Eds.), South-western Interludes: Papers in Honor of Charlotte J. and Theodore R. Frisbie, vol.32. Archaeological Society of New Mexico, Albuquerque, pp. 233e253.