The Public Hospital Specialist Workforce - ASMS · The Public Hospital Specialist Workforce...
112
The Public Hospital Specialist Workforce Entrenched shortages or workforce investment? Association of Salaried Medical Specialists February 2013 Association of Salaried Medical Specialists
Transcript of The Public Hospital Specialist Workforce - ASMS · The Public Hospital Specialist Workforce...

The Public Hospital Specialist WorkforceEntrenched shortages or workforce investment?
Association of Salaried Medical Specialists
February 2013
Association of Salar ied Medical Special ists

Association of Salaried Medical Specialists
PO Box 10 763WellingtonNew ZealandT + 64 4 499 1271F +64 4 499 4500E [email protected]

Contents
Introduction 7
Executive Summary 9
The Public Hospital: an evolving institution 12
1 The importance of public hospitals 14
‘Reforming’ in the dark – and the consequences 16
2 New Zealand’s health needs 22
The health system’s response to health needs 22
New Zealand’s future health needs 26
The future for hospital and specialist services 28
Secondary services 30
Specialist/tertiary services 31
Summary 31
3 Demand for specialists 32
Health services improve health status 32
Factors impacting on demand for specialist services 33
Changing demographics 33
Rising public expectations 34
Quality and safety of services 34
Specialist training requirements 35
Technological advances 36
Changing models of care 39
Government objectives 41
Assessing workforce needs to match demand 41
Summary 43
Health Service Forecasts 44
4 Supply of medical specialists 47
Supply through training, recruitment and retention 48
Vacancies 54
Reasons for leaving 54
Medical specialist shortages 55
Key issues 57
Changing demographics in the specialist workforce 57
Clinician burnout 60
Use of the private sector 60
The current state of the workforce in selected specialities/service areas 61
5 Health Funding and expenditure 68
Funding health services as an investment 71
Conclusion 74
6 Government’s response to addressing specialist workforce shortages 75
“Number one priority” 75
Getting the measure of the crisis? 75
Developing clinical leadership 75
Health Workforce New Zealand 78
7 The current path… 82
8 What needs to happen 85
Requirements for progress 86

Appendix 1 87
Hospital productivity measurements 87
How sound is the measure? 89
The FTE count 90
The ED & Outpatient activity measurements 90
Inpatient measurements 91
Measuring value 91
The purpose behind the measure 93
Negative effects of publishing false productivity measures 94
Appendix 2 95
Appendix 3 96
Appendix 4 97
Canada: Family physicians and specialists in short supply 97
Appendix 5 99
Australia: specialist workforce shortages continue 99
Continuing specialist shortages 102
Conclusion 103
References 104
Figures
1: Readmission rates per 100 discharges, all DHBs 25 combined, 2001–11
2: Practising medical specialists in New Zealand: Trends 47 and Projections
3: Percentage of New Zealand graduates lost one year 50 after gaining vocational registraion
4: Percentage of IMG doctors lost three years after gaining 51 vocational registration
5: Percentage of vocationally registered IMGs lost over five 52 years from cohorts of 2000 & 2006

6: Average retention rates for IMGs after vocational scope 53 obtained, from 2000 to 2010 inclusive
7: Number of specialists by age group, 2001, 2004, 2007 & 2010 58
8: Proportion of specialists PER AGE GROUP working less than 59 40 hours PER week as at 2010
9: Per Capita Health Expenditure in OECD Countries, 2010 68
Doctor and nurse productivity in DHB provider arms 87 (medical and surgical)
Doctor and nurse efficiency and costs (2010 dollars) in DHB 88 provider arms (medical and surgical)
Specialists (including trainees) per 1,000 population, 96 2010 or latest year available
Tables
1: New Zealand’s position in the OECD’s international 23 health status indicators
2: Comparison of selected health care activities across 26 four countries
3: Graduate retention of class years 49
4: Immigration New Zealand’s Skills Shortage Lists, 56 2004 and 2012
5: District Health Board Funding 2007-2016 69

THE PUBLIC HOSPITAL SPECIALIST WORKFORCE ASMS
7
Introduction
In October 2010 the Minister of Health, Hon Tony Ryall, stated publicly: “We have a workforce crisis in New Zealand because we need to retain more of our hospital specialists.”
In November 2010 the blueprint document, Securing a sustainable senior medical and dental officer workforce in New Zealand: The business case, jointly developed by the DHBs and ASMS, reaffirmed there was a specialist workforce crisis, that it was causing serious risks for the public health system (including standards of patient care and financial waste), and set out actions to address the crisis.
Those actions, which included a greater investment in developing the specialist workforce, have not been implemented. And the sky is still intact. So has the situation between late 2010 and now changed to the extent that the crisis has been averted?
This paper reviews the issues raised in the Business Case and pulls together the latest data and research available to answer that question.
It includes an historical overview on how successive “reforms” have affected our public hospitals over recent decades, and their legacy. It examines New Zealand’s current and future health needs; factors influencing the demand for, and supply of, medical specialists; issues around health funding in times of economic difficulties; the Government’s response to workforce shortages; and what needs to happen next to secure a sustainable specialist workforce.

8

THE PUBLIC HOSPITAL SPECIALIST WORKFORCE ASMS
9
Executive Summary
Putting aside productivity and the issues of a workforce that is increasingly feminised and part-time, the key issues that are germane to the number of doctors in our workforce are recruitment, migration and retirement, and all three require address.
D Gorman, NZMJ 2011 1
1 RECRUITMENT: More specialists are entering the workforce but well short of the numbers needed – and agreed with DHBs – to enable safe and sustainable services. Each year, with every shortfall, the workforce deficit grows.
2 MIGRATION: Retention of our new specialists and potential future specialists is getting worse, especially among international medical graduate (IMG) doctors.
3 RETIREMENT: On current trends, in the next five years an estimated 19% of the specialist workforce could be lost due to a drop-off of doctors from the age of 55.
New Zealand has the second-highest emigration rate of doctors in the OECD. New Zealand has in effect become a medical training ground for other countries, especially Australia, which is facing continuing specialist shortages for the foreseeable future.
The New Zealand specialist workforce has the highest dependency on IMGs in the OECD, averaging 42% across all specialties. Further, it is trending upwards. Over recent years IMGs have comprised approximately half of new specialist registrations.
Employment of IMGs in both specialist and resident medical officer (RMO) positions is essential to the running of our health service, and the international “brain exchange” of hospital specialists facilitates the sharing of knowledge and experience. However, New Zealand’s excessive reliance on IMGs often adds further to specialists’ workloads and further worsens our systemic instability.
Retention rates of IMG specialists are poorer than those of New Zealand-trained specialists. While Medical Council data show that around 10% of a cohort of New Zealand specialists are lost to New Zealand three years post-vocational registration, over recent years about a quarter of vocationally registered IMGs are lost over the same period.

10
More specialists are entering the workforce but well short of the numbers needed – and agreed with DHBs in the The Business Case (2010) – to enable safe and sustainable services. Each year, with every shortfall, the workforce deficit grows. In fact, the workforce trends for specialists (and other doctors) may look better than they really are, given the increasing dependence on IMGs, many of whom – as the MCNZ has noted – are here for short stays only.
Retention of both IMG specialists and New Zealand-trained specialists who gained vocational registration over the last decade has become worse over that period. Over the past three years there are more significant indications of a “revolving door” effect.
The high turnover of IMGs reduces the capacity to develop strong clinical leadership and bring cohesiveness to medical services generally. It also increases specialists’ supervisory load.
Our high dependence on IMGs puts services in a vulnerable position in view of the increasing international competition to attract health professionals. Any change in migration flows outside the control of New Zealand authorities could have a dramatic impact on our health services. There are signs of this beginning to happen, especially in Asia. This may be significant for New Zealand because IMGs from Asia have one of the best IMG retention rates (whereas IMGs from North America, the United Kingdom and Australia tend to have poor retention rates).
Our growing and ageing population requires a significantly larger specialist workforce to serve it. Currently about 14% of New Zealanders are aged 65 or over; by 2021 that figure is projected to increase to 17%.
At the same time the specialist workforce is ageing. On recent trends approximately 19% of the workforce is likely to be lost over the next five years from the effects of the drop-off of specialists from the age 55.
There is an imbalance between specialists and RMOs which not only impedes the ability of specialists to provide the necessary training and support for RMOs, but also is likely to worsen New Zealand’s already poor retention rates of specialists and RMOs. The substantial government investment in boosting the RMO workforce could continue to be lost offshore.
A Ministerial Review Group report in 2009 estimated that up to $800 million is spent annually on potentially preventable adverse events in public hospitals. While a range of factors contribute to this, there are many examples indicating specialist staffing levels are an important one.
Shortages, combined with increasing clinical demands, are preventing many specialists from finding adequate time for training and supervision. This situation will worsen as the Government is requiring specialists to play a greater role in RMO training and education.
Over the past three years there are more significant indications of a “revolving door” effect.

THE PUBLIC HOSPITAL SPECIALIST WORKFORCE ASMS
11
Specialist shortages and heavy dependence on locum positions severely limit the ability to implement government policy to develop clinical leadership in our hospitals.
Of the medical graduates that first registered in 2000, only around 60% held a practising certificate 10 years later. Allowing for fluctuations and the increasing proportion of graduates that are not registering when they graduate, the losses in each year’s graduation class are not improving.
The loss to New Zealand of a relatively small number of New Zealand-trained specialists represents a loss of tens of millions of dollars of government investment – and leads to even further costs of tens of millions of dollars each year. Those costs are incurred in recruiting specialists from overseas, many of whom do not stay long, which in turn creates more recruitment costs. In the meantime many of the resulting service gaps are filled by employing locums on high-paying short-term contracts.
If we continue as we are:
• We will continue to lose many specialists and RMOs overseas.
• We will continue to rely heavily on IMGs and locums to maintain services, exacerbating the high medical staff turnover rates.
• Some services will not be clinically and financially viable.
• Some of the Government’s key health targets will not be achievable in the coming years.
• The ability to build a health service to meet future needs, including the development of clinical leadership, integration of services, regional and sub-regional service networks, and improved efficiencies through innovative models of service, will be seriously limited.
There is now a strong body of evidence showing comprehensive clinical leadership can achieve what New Zealand’s successive attempts at health reform have failed to achieve: significantly improve the effectiveness and efficiency of our public hospitals across the whole spectrum of services (not just the selected few targeted by Government) while managing the increasing costs of health care. Indeed, given the health indicators for the coming decade, the ability of our health system to meet the growing demands may well rest on the extent to which comprehensive clinical leadership is established in practice.
For this to succeed in any meaningful way, financial investment is needed to develop the capacity of the specialist workforce to enable “time for quality”, as envisioned in the Business Case agreed between DHBs and the ASMS.
Measures to improve recruitment and retention of specialists are becoming more urgent.

The Public Hospital: an evolving institution
Symbolically, public hospitals are viewed by the public as the main manifestation of
the health care system, as shown by the enthusiasm with which politicians seek to be
photographed opening new hospitals.2
For most people the core function of a hospital is simply to treat people who are ill, but
there is perhaps less awareness of the numerous other important roles and functions of
hospitals, some of which extend well beyond the hospital walls.
Generally, the main district health board (DHB) hospitals are settings for training the next
generation of health professionals; some undertake research, which is crucial for the advance
of health care delivery; they support surrounding health care providers in a variety of ways,
including diagnostic services; they provide a base to coordinate a range of community
services, such as district nursing, community mental health services, breast-screening services
and social work; they often include public health centres for coordinating health promotion
and illness prevention activities in the community, and they provide administration services
covering most, if not all, of the services provided by district health boards.
As such, the services that are usually found on the campus of most New Zealand hospitals
are well integrated with other publicly provided health services. Furthermore hospitals are
a major source of local employment and the peace of mind they offer may be a factor in
where people choose to live – both matters which can have a significant influence on local
economies.
Today’s hospitals reflect a combination of the legacy of the past and the needs of the
present. Many were established when cure for illness or treatment of injury often required
a relatively lengthy time in hospital.
Concentrating resources and professionals in the same building was a good step, based on three factors:
First – economies of scale (the bigger the work volume, the better the use of resources and the lower the unit costs – once an operations theatre has been installed, running it for more hours would distribute its costs over more cases);
Second – economies of reach/scope (using existing infrastructures would allow the achievement of higher quality results – a hospital with good emergency services and specialties such as cardiology, neurology, etc. can treat severe child pathologies immediately after delivery); and
Third – facilitating professional training and the diffusion of better practices and technological knowledge.3
12

THE PUBLIC HOSPITAL SPECIALIST WORKFORCE ASMS
13
The greatest changes occurred from the 1970s onwards with advances in laboratory
diagnosis and the massive expansion in pharmaceuticals, which transformed the
management of many diseases and conditions. New specialities emerged, and
common conditions previously treated with prolonged hospitalisation were managed
in ambulatory care.4
Perhaps the biggest physical change in hospitals has been the reduction in bed
numbers, due in part to advances in knowledge and technology that have enabled
treatment to be carried out more rapidly, leading to shorter (but more intensive)
hospital care and increasing numbers of patients treated as day patients.5
Contrary to what is often repeated, then, hospitals have gone through huge changes
– to the point that a present-day state-of-the-art hospital would be unrecognisable
to a doctor or nurse of just five decades ago.6
The scope and pace of organisational change in hospitals is staggering.7

14
1 The importance of public hospitals
To understand fully the current state of our district health board-employed medical specialist workforce it is necessary to understand some of the issues and developments that have had an impact on our public hospitals over recent times, especially the effects of successive “reforms” and their legacy.
Hospitals are an important component of the health care system and are central to the process of reform, and yet, as institutions, they have received remarkably little attention from policy-makers and researchers. They are important within the health care system for several reasons.
First – they account for a substantial proportion of the health care budget…
Second – their position at the apex of the health care system means that the policies they adopt, which determine access to specialist services, have a major impact on overall health care.
Third – the specialists who work in hospitals provide professional leadership.
Finally – technological and pharmaceutical developments, as well as more attention to evidence-based health care, mean that the services that hospitals provide can potentially contribute significantly to population health.
If hospitals are ineffectively organised, however, their potentially positive impact on health will be reduced or even be negative.
Hospitals in a Changing Europe8
New Zealand has the somewhat dubious distinction of having the most restructured health system in the developed world.9 However, as discussed below, nearly three decades of costly reform have not only failed to achieve their aims, in some aspects the changes have been regressive and, for medical specialists in particular, the legacy is in the Health Minister’s own words a workforce in crisis.10
Broadly speaking, the core objectives pursued in health reforms in many countries, including New Zealand’s successive restructurings, are strikingly straightforward: universal access for all citizens, effective care for better health outcomes, efficient use of resources, high-quality services and responsiveness to patient concerns. Yet once decision-makers seek to translate their objectives into the nuts and bolts of health system organisation, common principles rapidly devolve into divergent, occasionally contradictory, approaches.11

THE PUBLIC HOSPITAL SPECIALIST WORKFORCE ASMS
15
Hospitals are of course highly complex organisations and any attempts to make substantial changes pose many challenges for policymakers. In New Zealand, those challenges were compounded in part by an attempt to introduce radical changes along the lines of an untested market-based ideology, and in part by a serious lack of information about how hospitals operate, what they do, and the benefits they provide – consistent with the observations made above.
There is little evidence that hospitals, as institutions, have received much attention by New Zealand’s health research centres – compared with primary health care, for example – and the collection, reporting and analysis of robust national data on the quality and value of hospital services evidently has low priority, despite government aims for achieving better value for money.
A profile of the New Zealand health system produced in 2001 for the European Observatory of Health Care Systems found that while lessons had been learnt from the failed attempt to introduce market model theories and practice into the public health system, “there remain large gaps in the knowledge base” and: “There is no evidence as to whether quality of care improved or faltered during the 1990s and there are few outcome measures in place to evaluate hospital or physician performance.”12
A decade later and those large knowledge gaps remain. Organisations including the Treasury found fundamental data shortcomings when attempting to assess the performance of public hospitals.13 And in 2009 the Senior Medical Officer (SMO) Commission found “serious data inadequacy” when attempting to investigate the state of our public hospital specialist workforce, and called for work “to commence urgently to identify core information requirements, and establish systematic, routine, regular, simple, robust and appropriate ways of collecting, analysing and reporting that information”.14
Despite the SMO Commission’s prompting, there is little sign of improvement in 2013. Basic hospital workforce data such as the number of senior medical officers employed by DHBs can vary significantly depending on who compiled it and for what purpose.
The lack of robust information and research on hospitals did not deter governments from claiming good reasons to “reform” them, however. Since the 1980s New Zealand’s hospitals’ organisation and management has changed from 30 Hospital Boards to 14 Area Health Boards to 23 Crown Health Enterprises, then to Health and Hospital Services and lastly to the current 20 District Health Boards.
If health care system changes were submitted to the same scrutiny as new drug evaluations, they would probably not even be allowed to move from the animal to the human experimentation stage.

16
‘Reforming’ in the dark – and the consequences
A new drug cannot be introduced … without exhaustive scientific trials, but we usually introduce new ways of delivering health services with little or no scientific evaluation. We rationalise, change and formulate new systems, often based on economic and political imperatives, and yet rarely evaluate their impact upon patients. Significant morbidity and mortality may be associated with new models of health care delivery. If health care system changes were submitted to the same scrutiny as new drug evaluations, they would probably not even be allowed to move from the animal to the human experimentation stage.
K Hillman, Medical Journal of Australia15
The lack of sound data on hospitals and health services generally – especially data that indicate the true social and economic value of those services – has meant the rationale to support the changes brought in by successive governments has also lacked robustness. In fact the arguments for making changes often contradict the existing evidence on hospital performance.
The initial reform of the health system – from hospital boards to area health boards – progressed cautiously, with much of the preparatory work done in the 1970s and with area health boards (AHBs) formed gradually through the 1980s. However, a year before the first AHB (Northland) was formally established in 1984, the government gave notice that current health expenditure trends were no longer sustainable, though there were conflicting claims about the relative size of the health vote and the allocation of resources, and by 1985 the growth in public health expenditure had fallen behind the rate of inflation. Hospitals became the main target for cost cutting, with policy favouring greater concentration of resources on primary care.16,17
Measures to curb spending reached a new plane with the formation of a joint Treasury-Health Department Hospital and Related Service Taskforce, headed by businessman Alan Gibbs. The ensuing “Gibbs Report”, Unshackling the Hospitals, claimed hospitals were grossly inefficient, despite the fact that at the time information on the costs and volumes of services being provided by hospitals was virtually non-existent. It recommended a market-oriented approach to remedy the problems.18,19
Health Minister David Caygill did not agree with the remedy but is reported to have largely agreed with the diagnosis and, while expenditure on primary care continued to grow, public hospital funding was subject to further belt-tightening, which led to a 5.4% decrease in the number of public hospital beds between 1987 and 1989.

THE PUBLIC HOSPITAL SPECIALIST WORKFORCE ASMS
17
Real expenditure on public hospitals was declining, capital was not being maintained and debts were mounting. In contrast, expenditure on primary health care was increasing at an average rate of 6% per year.20
Health economist Toni Ashton
Overall, as a result of the cost constraints on public hospitals in the 1980s, total real public health expenditure per capita had grown by just 4.2% over the decade, and the public proportion of that spending had declined, according to Ministry of Health figures, from 88% in 1980 to 82% in 1991 (dropping to a low of 76.6% in 1993). 21,22,23
Nevertheless the statement of government health policy of 1991, heralding the impending reforms, claimed radical change was necessary in part because of what the Government considered were escalating costs (real public expenditure in 1991 was actually lower than in 1988/89). Health Minister Simon Upton argued that too much money was tied up in “monolithic structures, which tend to be both unwieldy and unresponsive to change” and which were inefficient in areas such as increasing day surgery, reducing the length of hospital stays and moving services into the community.24,25
However, alongside the Ministry’s figures indicating modest expenditure growth in the Health Vote over the previous decade, figures provided by Dunedin health economist Professor Michael Cooper indicated that between 1980 and 1988 hospital admissions had risen by 12%, outpatient admissions by 16% and day services by 150%.26 Furthermore, Treasury advice to the incoming Minister in 1990 noted that while “the quality of the data collected on the health system is very poor…[and] caution should be taken in the interpretation of all data”, there were signs of increasing efficiency from 1986-1989, including shorter inpatient stays (‘the best indicator of improved performance”), an increase in surgical throughput by up to 9.6% and evidence of a drop in waiting lists in the third year.27
The Government remained unmoved, claiming (without any empirical evidence) that hospital costs could be lowered by between 24% and 32% by managing hospitals on business principles. This was the rationale for subsequent health spending cuts estimated at more than $2.5 billion between 1991 and 1998. As occurred in the 1980s, there was also evidence of funding for public hospitals being shifted to the private sector.
In 1995 public hospitals received 51.6% of parliamentary appropriations for health; that declined to 48.1% by 1998 as more funding was allocated to “independent service providers”. In addition, the reforms themselves were expensive; with estimates ranging from 2% to 10% of the annual health vote (Treasury estimated the cost to be around $800 million). 28,29,30
Simon Upton argued that too much money was tied up in “monolithic structures’’

18
To help balance the books public hospitals cut services. The range of service “exits” was broad and substantially changed the service delivery landscape:
Examples included reductions in “financially unviable” hospital beds, departures in services considered to be “non-core business”… and departures from the provision of services in provincial hospitals.
R Gauld, Revolving Doors: New Zealand’s Health Reforms 31
By and large, the promised benefits of the reforms were not achieved; instead the system struggled to cope. Anecdotal evidence suggests many clinicians and managers departed, with many of the latter being replaced by a new cadre of generic managers with little knowledge of the health system or health care. There were also indications of an increased backlog of unmet health need with potentially long-term health consequences.32,33
…in the late 1990s, many patients may have been squeezed out from hospital care … These patients may then have presented some years later, in the early 2000s, with conditions that were more severe and harder to treat, and thus involved longer durations of clinical treatment.
I Poole et al, Restructuring and Hospital Care34
Independent analyses show key lessons to be learned from the failure of the reforms included the lack of involvement of clinicians in the decision-making and lack of recognition of their “norms and values”.35,36
That message was not heeded to any significant extent in the next round of reform when the newly elected Government of 2000 reorganised the system into district health boards under the guidance of a New Zealand Health Strategy. The strategy outlined five service priority areas:
• public health
• primary health care
• reducing waiting times for public hospital elective services
• improving the responsiveness of mental health services
• accessible and appropriate services for people living in rural areas
These priority areas “would be considered first if extra funding becomes available”. In fact Vote Health’s annual operating expenditure increased by around $2 billion between 2000/01 and 2007/08, excluding adjustments for inflation and population increases. Most of that went into funding new initiatives and to implement the Primary Health Care Strategy. Aside from the specifically targeted programmes, hospital-based services in general appear to have seen little if any increases in funding, over and above the population and inflation adjustments.37

THE PUBLIC HOSPITAL SPECIALIST WORKFORCE ASMS
19
Improving primary care services was the principle focus because they were “central to improving the health of New Zealanders and, in particular, tackling inequalities in health.”38 Absent was any suggestion of developing an equivalent of the Primary Care Strategy to guide the development of hospital services nationally.
The general idea was that improving access to primary care and giving greater emphasis to health promotion and illness prevention would reduce reliance on hospital care. This was a laudable aim given the evidence of avoidable hospital admissions increasing since at least the early 1980s. In just one of the country’s 20 DHBs (Canterbury), avoidable hospital admissions were estimated to be 31% of all admissions, costing $97 million in 2003.39
But the increased emphasis on primary care came at a cost to hospital services, as indicated above, and as with the earlier attempts at reform, the main objectives were not realised. Analyses of the effectiveness of the Primary Health Care Strategy suggest it fell short of expectation for a number of reasons, including contractual issues and shortcomings of the small business model as it operates within our primary health services. Analysis of the primary health sector is beyond the scope of this paper. Suffice to say, nationally, since 2003 there has been virtually no improvement in the rates of avoidable hospital admissions,40 so the growth in demand for hospital services continued, and once again this occurred as hospital funding was tightly contained.
To compound the pressure, long-standing staff shortages – not least in the medical specialist workforce – were having a more noticeable effect in key service areas, and DHBs were struggling to fill the gaps as more specialists and registrars were being lured to better-paying positions overseas.
As a result, timely access to hospital services became increasingly problematic, including:
• Increased waiting times in emergency departments;
• Longer waits for people getting a first specialist assessment (FSA), as the number of FSAs decreased;
• Longer waits for elective surgery as the rate of people getting elective surgery decreased. (Those having to wait longer for treatment included 24,000 patients who had been specialist-assessed as in need of an operation but had been sent back to their GPs for monitoring).41
At the same time, hospitals came under increasing pressure to improve efficiency. A Treasury report in 2005 noted that “available data does not enable robust conclusions about trends in DHB hospital or sector productivity to be drawn”. Nevertheless it claimed that hospital productivity “would appear to have fallen” – though it conceded its calculations were based on only 20%-25%

20
of DHB activity.42 Similarly, initial productivity measurements by the Ministry of Health, which indicated a decline, covered only 27% of DHB provider costs.43
Both Treasury and the Ministry accepted there may have been improvements in other unmeasured activities, the quality of services, and patients’ health outcomes, yet the Ministry continues to publish “productivity” measures of highly questionable methodology, including in the Ministry’s Annual Report 2012, and that run counter to other evidence and Ministry statements. (See Appendix 1 for an analysis of the Ministry’s productivity measure.)
A paper published in the New Zealand Medical Journal in 2007 reports that during the previous 17 years average length of stay (ALOS) had halved, inpatient admission rates had held steady, and bed numbers per 1,000 population had significantly reduced.
The New Zealand public system now seems more efficient than the Australian and English systems. Whether comparing the ALOS (3.9 days vs 6.1 in Australia, 5.0 in England), discharge rates per 1,000 population (157 vs 341 and 200) or hospital beds per 1,000 population (2.0 vs 4.0 and 3.4), New Zealand is well ahead.
G Jackson, H Rea NZMJ 44
A Waikato University study supported those findings but it also found temporary deteriorations in efficiency after periods of major restructuring.45
More recently, the Director-General of Health, in a submission to the Treasury in February 2011, wrote:
The [health] system’s cost effectiveness is demonstrated by its outputs and outcomes continuing to improve, with reducing increases in new funding in recent years. DHBs in particular have continued to do more with less in increasing outputs and delivering new initiatives while reducing their net deficits...46
Summarising the effects of the changes to date:
Each system shift required considerable time and effort to achieve. The costs of making the changes have also been considerable – almost certainly a 10-figure sum. The effects of the changes and associated polices have seen public hospital services repeatedly cut back over three decades and continuous pressure for hospitals to do more with less. Most of the promised benefits of each change have not been achieved and in some aspects the changes have been regressive in terms of timely access to quality services.
In the meantime New Zealand’s inability to adequately retain the specialists it trains, to recruit specialists, and to retain the specialists it recruits had created

THE PUBLIC HOSPITAL SPECIALIST WORKFORCE ASMS
21
an unstable workforce that was coming under increasing stress, culminating in 2007 with unprecedented stop-work meetings nationwide and a national ballot in which nine out of 10 senior doctors voted for limited industrial action. The subsequent SMO Commission investigation found, among other things, a specialist workforce disengaged from DHB management and attributed this to the lingering managerialism introduced in earlier reforms.
SMOs report being undervalued within their organisations and the health system in general. Lack of involvement and influence in the strategic direction of services was a source of immense frustration to SMOs we met with. Some senior DHB managers seemed to have a limited appreciation of SMO perspectives. In our view, this is largely a product of the health reforms of the 1990s, which introduced a culture to the public health system that has devalued clinicians and proved detrimental to effective working relationships and service delivery.
SMO Commission Report 47
Did the incoming Government of 2008 learn any lessons from the health reforms experience? To some extent it appears it did in that it avoided yet another restructuring and instead focused on measures to improve coordination of DHBs and improve planning on infrastructure, “especially IT, workforce and capital”.48
The Government also promised distributive clinical leadership with its In Good Hands policy statement (2009) and to give priority to addressing workforce specialist shortages. These two policies are linked in that clinical leadership cannot develop to any great extent until workforce shortages are rectified. How they have progressed to date is examined in more detail in this paper.
New Zealand’s inability to adequately retain the specialists it trains, to recruit
specialists, and to retain the specialists it recruits had created an unstable workforce
that was coming under increasing stress...

22
2 New Zealand’s health needs
At a high level, OECD indicators of member countries’ health status suggest that compared to other countries New Zealand’s current health needs are well above average.49
In 12 of the OECD’s 19 indicators (Table 1), New Zealanders’ state of health falls in the bottom half of OECD countries and we fall behind on many indicators in comparison with Australia, Canada and the United Kingdom.
Ironically, the one area where New Zealand scores particularly well is in perceived health status, where we are second behind the United States (which is also inconsistent with that country’s health indicators). However, the report cautions that the results from New Zealand, along with three other countries in the top five (including the United States), are not directly comparable with those for other countries due to methodological differences in the survey questionnaire, giving an upward bias.a
The health system’s response to health needs
As would be expected, New Zealand, like many OECD countries, has seen steady improvements in most high-level health status indicators over at least the past decade.50 This is due to a range of factors, including social, environmental, economic and lifestyle factors, as well as the effectiveness of the health system brought about by advances in knowledge and technology and more efficient practices.
The Ministry of Health’s Health and Independence Reports (up until 2012)51 show continuing progress in a number of areas, such as life expectancy (and “healthy life” expectancy), and reduction of mortality rates for cardiovascular disease and cancer, for example.
On the downside, infant mortality rates saw increases after a period where they had been falling or had been steady. Youth suicides, which are high by international standards, have not improved over recent years. Hospitalisations
a The survey response scale used in New Zealand, Australia, Canada and the United States (all in the top five) is asymmetric (skewed on the positive side), including the following response categories: “excellent, very good, good, fair, poor, very poor”. By contrast, in most other OECD countries the response scale is symmetric, with response categories being: “very good, good, fair, poor, very poor”.

THE PUBLIC HOSPITAL SPECIALIST WORKFORCE ASMS
23
TAblE 1 NEW ZEAlAND’S POSITION IN OECD INTERNATIONAl HEAlTH STATUS INDICATORS
NZ position out of 34 OECD countries (1 being best)
NZ position relative to Australia, Canada,UK
Year (or latest year available) 2007 2010 2007 2010
Life expectancy at birth 11 11 3 (above UK) 2 (behind Aust)
Premature mortality 22 (females)
18 (males)
27 (females)
16 (males)
4
4
4
4
Mortality from ischemic heart disease
24 (females)
23 (males)
28 (females)
27 (males)
4
4
4
4
Mortality from stroke 20 (females)
13 (males)
25 (females)
16 (males)
4
3 (above UK)
4
3 (above UK)
Mortality from all cancers 24 (females)
15 (males)
28th (females)
18 (males)
4
4
4
4
Mortality from transport accidents
20 28 4 4
Suicides 19 20 4 4
Infant mortality 21 28 3 = (with UK) 4
Infant health: Low birth weight 11 11 2 (below Canada)
1
Dental health among children 17 Not available 3 (Canada not included)
–
Perceived health status 1 2 (behind USA) 1 1
Below: 1 being lowest incidence/prevalence
Cancer incidence 30 3 (above Aust)
Obesity prevalence (adults) 28 31 4 4
Diabetes prevalence (adults aged 20-79 years)
Not available 7 – 2 (behind UK)
Type 1 diabetes incidence (children aged 0-14 years)
Not available 21 – 1
Aids incidence 12 10 1 1
Source: Health At A Glance, 2009 & 2011, OECD. OECD Health Data 2012.
24
for rheumatic fever and the rate of acute hospitalisations due to falls for people aged 65+ have increased over recent years (though both dropped slightly in 2010/11); and the prevalence of obesity is increasing.
Health indicators directly related to health services are a mixed bag.
On the positive side, there were:
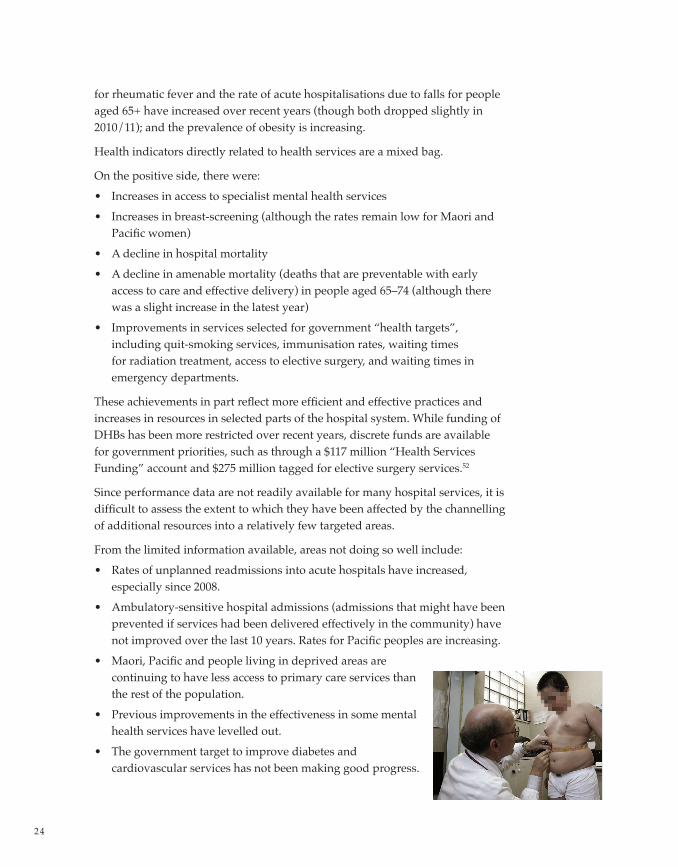
• Increases in access to specialist mental health services
• Increases in breast-screening (although the rates remain low for Maori and Pacific women)
• A decline in hospital mortality
• A decline in amenable mortality (deaths that are preventable with early access to care and effective delivery) in people aged 65–74 (although there was a slight increase in the latest year)
• Improvements in services selected for government “health targets”, including quit-smoking services, immunisation rates, waiting times for radiation treatment, access to elective surgery, and waiting times in emergency departments.
These achievements in part reflect more efficient and effective practices and increases in resources in selected parts of the hospital system. While funding of DHBs has been more restricted over recent years, discrete funds are available for government priorities, such as through a $117 million “Health Services Funding” account and $275 million tagged for elective surgery services.52
Since performance data are not readily available for many hospital services, it is difficult to assess the extent to which they have been affected by the channelling of additional resources into a relatively few targeted areas.
From the limited information available, areas not doing so well include:
• Rates of unplanned readmissions into acute hospitals have increased, especially since 2008.
• Ambulatory-sensitive hospital admissions (admissions that might have been prevented if services had been delivered effectively in the community) have not improved over the last 10 years. Rates for Pacific peoples are increasing.
• Maori, Pacific and people living in deprived areas are continuing to have less access to primary care services than the rest of the population.
• Previous improvements in the effectiveness in some mental health services have levelled out.
• The government target to improve diabetes and cardiovascular services has not been making good progress.

THE PUBLIC HOSPITAL SPECIALIST WORKFORCE ASMS
25
Hospital efficiency measures indicate the annual rate of day-case procedures are continuing to increase, and the average length of stay continues on a downward trend, especially since 2008, corresponding with an increase in unplanned readmissions, suggesting the Government’s drive to achieve more with less is having an effect on the quality of services. Ministry of Health data on unplanned readmission trends by age groups show a marked increase in readmission rates in all age groups from around 2008, although in 2011 the trend had levelled off.53 (Figure 1)
In selected service activities recorded by the OECD, overall access in New Zealand appears to be on a par with the United Kingdom, Australia and Canada (Table 2).
Source: Ministry of Health, 2012
16%
14
12
10
8
6
4
2
0
age 0 – 44 age 45 – 64 age 65 – 74 age 75 – 84 age 85+
FIGURE 1: READmISSION RATE PER 100 DISCHARGES, All DHbS COmbINED, 2001–11 INClUSIVE
2001
2002
2003
2004
2005
2006
2007
2008
2009
2010
2011
2001
2002
2003
2004
2005
2006
2007
2008
2009
2010
2011
2001
2002
2003
2004
2005
2006
2007
2008
2009
2010
2011
2001
2002
2003
2004
2005
2006
2007
2008
2009
2010
2011
2001
2002
2003
2004
2005
2006
2007
2008
2009
2010
2011

26
TAblE 2: COmPARISON OF SElECTED HEAlTH CARE ACTIVITIES RElATIVE TO
AUSTRAlIA, CANADA AND THE UNITED KINGDOm
Source: Health At A Glance 2009 & 2011, OECD. OECD Health Data 2012.
Health Care Activity NZ position 2007 2010
Consultations with doctors (GPs / specialists) per capita 4 4
Hospital discharges per 1,000 (including day stay) 2 (behind Aust) 2 (behind Aust)
Hospital discharges for circulatory disease 2 (behind Aust) 2 (behind Aust)
Hospital discharges for cancers Not available 2 (behind Aust)
Cardiac procedures (coronary angioplasty) 3 (ahead of UK) 3 (ahead of UK)
Hip replacements Not available 3 (ahead of Canada)
Knee replacements Not available 4
Patients undergoing dialysis 2 (behind Canada) 2 (behind Canada)
Patients living with a kidney transplant 4 4
Cataract surgeries 4 3 (ahead of Canada)
Waiting time for elective surgery Not available 1
Waiting times for specialist appointment Not available 2 (behind UK)
New Zealand’s future health needs
The challenges in meeting our health needs will become even greater over the next ten years as our population ages and as the incidence of chronic conditions associated with older people increases.
Statistics New Zealand’s medium population projections indicate that the country’s population as a whole will increase by about 9% over the next decade – from 4,425,000 in 2011 to 4,818,000 in 2021. The number of people aged 65 and over, however, is projected to increase by 38% – from 596,000 to 824,000. The share of the population comprising people aged 65 and over will increase over the same period from 14% to 17%.54
The ageing of the non-European population will be even more marked. The combined populations of Maori, Pacifica and Asian peoples aged 65 and over will increase by approximately 84% between 2011 and 2021.55
OECD data indicate that, in developed countries, per capita health expenditure on those aged 65 and over is typically three to five times that for the 15-64 age group.

THE PUBLIC HOSPITAL SPECIALIST WORKFORCE ASMS
27
New Zealand data indicate that older people are more likely to be admitted to hospital than the adult population as a whole. Registration rates for the main types of cancer are roughly 10 times as great for those aged 65 and over as they are for the 25–64 age group. Mortality rates for ischaemic heart disease and the main cancers are 12 to 22 times as great for older people as they are for younger adults.
Hospital statistics indicate older people accounted for just over a quarter of all discharges from acute and sub-acute care but that they accounted for just over half of all bed days.
Ministry of Health statistics show those aged 65 and over had higher rates for most chronic diseases compared to the comparison age group (50-64 years). That includes higher rates of all types of cardiovascular disease mortality and hospitalisation, as well as all types of cancer mortality, chronic obstructive pulmonary disease mortality and hospitalisation and higher prevalence of diabetes, arthritis and osteoporosis.
Success in prolonging life expectancy for decades slowly but firmly multiplied the number of patients with long-term conditions. In England in 2001, for example, long-term conditions affected 35% of the population (17.5 million out of 50 million people) and generated 80% of primary care consultations, as well as 66% of emergency hospital admissions.
Investing in Hospitals of the Future56
Hospitalisation and mortality rates for unintentional injury are significantly higher in older age groups, particularly among those aged 85+ years, compared with their counterparts aged 50-64 years.
The prevalence of disability is higher with increasing age. For moderate and severe levels of disability, older age groups have markedly higher rates than their counterparts aged 45-64 years.
Older Maori have a worse health status than their non-Maori counterparts in a range of indicators, including higher hospitalisation and mortality rates for almost all types of cardiovascular disease, almost all types of cancer, and chronic obstructive pulmonary disease.57 The prevalence of diabetes alone is predicted to grow by 132% among Maori and 148% among Pacific peoples between 2006 and 2021.58
Changes in trends in age-specific illnesses will have an impact on the demand for future health and disability services. It is not necessarily old age per se that results in increasing costs and demands, but the increased survival of people with poor health into old age. Increased demand for health services may relate to the growth of unhealthy lifestyles in western countries.
Specific analysis of age-related diseases indicates that the New Zealand health sector can expect increased demand in the coming two decades from cardiovascular diseases, cancers, strokes, diabetes mellitus, chronic obstructive pulmonary diseases,

28
osteoporotic fractures and musculoskeletal diseases.59
The alarming trend in obesity in New Zealand, which has one of the highest prevalence rates in the OECD (Table 1), will have a significant impact on health services in the coming years. Obesity is closely associated with Type-2 diabetes, sleep apnoea, asthma, metabolic syndrome, arthritis, gastroenterology and cardiovascular conditions.
The complexity of health problems will increase as the population ages, with more people suffering from multiple co-morbidities and chronic diseases, receiving a wide range of treatments that potentially interact with each other.60
Budget advice to the Treasury from the Director-General of Health projects population growth to add 10% to service demand over the next decade, and the ageing of New Zealand’s population will add a further 7%. Expenditure on people over 65 years of age is predicted to grow from 36% to 42% of the total.61
In addition, while old diseases may disappear, new ones will emerge. As the cases of AIDS, Severe Acute Respiratory Syndrome (SARS) or Avian Influenza (bird flu) illustrate, new infectious threats may suddenly appear and are almost impossible to predict. What is certain is they will have important consequences for clinical practice and hospital services. 62,63
There is also the re-emergence of old infectious diseases such as TB, partly related to emerging resistances to antibiotics.64 Indeed, WHO director-general Margaret Chan says “the threat …is global, extremely serious, and growing” and the prospects for turning it around “look dim”.65
Antimicrobial resistance is on the rise in Europe, and elsewhere in the world. We are losing our first-line antimicrobials. Replacement treatments are more costly, more toxic, need much longer durations of treatment, and may require treatment in intensive care units.
WHO Director-General, 2012 66
The future for hospital and specialist services
The pattern of hospital services involves balancing geographical access and public expectations – which call for dispersed facilities – with the need for a critical mass of interlinked specialties and economies of scale, which require some concentration. The configuration of hospital services, therefore, is not simply a technical or managerial issue but to a large degree a political decision.67
Although existing research on hospital configurations has limitations, there is little support for concentrating care in very large hospitals. Research indicates economies of scale can be achieved at quite low levels of around 200 beds and diseconomies of scale become important at levels over 650 beds, suggesting an optimal size of between 200-400 beds (most of our main provincial hospitals

THE PUBLIC HOSPITAL SPECIALIST WORKFORCE ASMS
29
fall within or slightly under this range) but perhaps allowing for some further concentration to achieve economies of scope.68
An important argument against concentration of hospitals is that such a policy will reduce access to care. This may be especially important if, as has been suggested in New Zealand, differential access to health care contributes to socioeconomic inequalities in health.69
Given the above factors, and considering our small population, New Zealand’s current hospital system appears to have reached a reasonable balance of large and small hospitals to achieve some efficiency of scale while also allowing for the need to provide fair access across the country.
Predicting how our hospital system may look in the future, however, is not straightforward. While it is possible to predict with some degree of certainty future trends in population and disease, it is much more difficult to predict technological changes or changes in political policies.
Based on current trends, the future is likely to see further compression of length of stay, renewed efforts to manage quality of care, and greater use of options such as ambulatory care, day-only hospitalisation, and home care.
Increasingly, hospital patients will have more complex problems and more co-morbidities. There will be more demand for specialised units caring for the seriously ill, such as multidisciplinary stroke units, and packages of care that involve orthopaedic surgery, geriatric medicine and rehabilitation services. Surgeons will be performing more complex procedures, and more intensive care and high-dependency beds will be required.70, 71
A key factor shaping change in hospitals has been increasing medical specialisation, and this is likely to continue.72 In the future, technological advances will require an even more specialised workforce. Greater specialisation can be expected in areas such as surgery, imaging, invasive cardiology, transplantation, oncology and genetics.73 This will add further pressure to concentrate more specialist services in the larger centres, creating issues of access to services in provincial New Zealand.
Perhaps the most significant factor influencing the shape and size of our future public hospital services, and exacerbating the effects of increased specialisation, is New Zealand’s specialist workforce crisis – or more specifically the question of how it is going to be addressed.
A National Health Board report suggests the answer lies in the reorganisation of services and development of new service models. (Health Workforce New Zealand is also focusing on this approach, discussed later in this paper). It outlines scenarios on how it believes secondary and tertiary services might be delivered:
Perhaps the most significant factor influencing the shape and size of our future public hospital services... is New Zealand’s specialist workforce crisis

30
Secondary services
Secondary hospitals will focus on enhancing core clinically viable services and increasing their reliance on broader partnerships with larger neighbouring hospitals in metropolitan areas, to address workforce and quality pressures. Services will be delivered in community settings where hospital or institutional facilities are not necessary.
National Health Board 2010 74
• An increased range and number of services will be organised on a sub-regional or regional basis and delivered through clinical networks.
• Quality standards will be maintained through shared evidence-based guidelines and patient pathways, and support through clinical networks.
• Specialists from larger DHBs and their support staff may travel more within their regional service.
• More specialists’ time will be spent on electronic interactions with patients (for example, through secure email or using telemedicine to enable virtual consultations rather than face-to-face) and with primary care practitioners.
• An increased proportion of clinicians’ time will be spent supporting staff within smaller DHBs, integrated family health centres and other regional services.
• New entrants to the health workforce will be trained to work in new ways, and the existing workforce will need to be retrained.
• Referrals, clinical pathways, policies and procedures previously based in local DHBs will be managed regionally.
• Growth of specialist services will generally be confined to larger provincial centres.
• The workforce will become increasingly diverse; for example, there is likely to be an increase in the number of clinical assistants and nurse practitioners.
• Providers will have better access to patient information and protocols across the regional service.
Specialist/tertiary services
In the future, provision of some specialty services may need to be consolidated into a smaller number of centres/hubs to maintain the critical mass of patient numbers needed for quality care, and ensure effective use of small numbers of highly specialised staff.
National Health Board 201075

THE PUBLIC HOSPITAL SPECIALIST WORKFORCE ASMS
31
• More services will be organised on a national basis, supported through national clinical networks.
• Specialists and support staff may travel more within regional or national based services and networks to deliver services to local populations.
• More specialists’ time will be spent on electronic interactions with patients (for example, through secure email or telemedicine).
• More specialists’ time will be spent supporting clinicians in other DHBs or in other parts of the specialists’ regionally or nationally based services or networks.
• Referrals, clinical pathways, policies and procedures will be organised across DHB and organisational boundaries.
• Growth will generally be confined to larger urban areas.
• Highly specialised services will look to Australia for peer support, review and quality improvement, and in some cases service delivery.
• Highly specialised services may be nationally based, to support clinical and financial viability and maximise workforce efficiency.
Hospitals providing highly specialised/tertiary services will continue to also provide secondary services for their local populations.
Summary
New Zealand has a relatively high health need compared to other OECD countries. Our health needs will increase as the population ages and becomes more ethnically diverse, including a growth in the number of people with multiple illnesses. Old illnesses that have been eliminated from New Zealand may re-emerge due to increasing disease resistance to antibiotics.
The response of government agencies to continuing specialist shortages is to focus on reorganising services and developing new service models. The National Health Board suggests some specialties may need to be consolidated into a smaller number of centres; specialists may need to spend more time travelling as well as making more use of communications technology to interact with patients and service providers regionally and nationally.

32
3 Demand for specialists
From the information available, our health system is meeting the needs of most New Zealanders most of the time. However, the data outlined in the previous chapter suggest that the shortfall in meeting those needs is significant and is likely to become even more so in the future, unless some important issues are addressed in the health sector.
As stated earlier, health status indicators are influenced by a number of factors, including social, environmental, economic and lifestyle factors. The effectiveness of the health system is also a key factor, the importance of which has tended to be understated.
Health services improve health status
A cross-country analysis of the determinants of health in 21 OECD countries found a significant negative relationship between health expenditure and premature mortality among women, as measured in potential years of life lost.76
A subsequent analysis of the same countries found the number of doctors is the second most important variable (after occupation) in terms of explaining variations in premature mortality (deaths under the age of 70) across countries and over time. It also found that a 10% increase in the number of doctors, holding all other factors constant, would result in a reduction in premature mortality of almost 4% for women and about 3% for men.77
The positive impact of health services on a population’s health status has also been found in recent studies which indicate that around half the gains in life expectancy in recent decades stem from improved health care.78 Furthermore, studies in OECD countries show that up to the age of 75 around 20% of male mortality and over 40% of female mortality may be averted by health care interventions.79
New Zealand research shows that of 56 conditions or groups of conditions where death is considered avoidable through timely health intervention, 24 were avoidable largely through primary prevention, 16 mainly through secondary prevention, and a further 16 mainly through tertiary prevention.80

THE PUBLIC HOSPITAL SPECIALIST WORKFORCE ASMS
33
Reliable data on the impact of health services on morbidity is scarce, though one study looking at the evidence of the effects of treatments for 19 diverse conditions estimated that, on average, individuals are relieved from about five years of poor quality of life (eg pain, loss of functions, prevention of complications) as a result of medical care.81
Factors impacting on demand for specialist services
As well as health status of our population, other influences on demand for medical specialists include the growing and ageing population, rising public expectations, advances in technology, requirements to meet quality and safety standards, training requirements, changing models of service, and government policy.
Changing demographics
As indicated in Chapter 2, New Zealand’s population is projected to grow by about 9% by 2021. At the same time the proportion of those aged 65 and over is expected to increase from the current 14% to 17% of the population.
A simple but graphic illustration of the effect of New Zealand’s changing demographics is provided in the latest Annual Report of the Southern Cross Medical Care Society:
Though the number of elective surgeries provided by District Health Board funding is at “record” levels, so too is the need for these services. This heightened demand is being echoed in the private sector. For example, between April 2007 and March 2012, the number of orthopaedic procedures funded by the Society increased by 26% - though total membership remained static over the same period.
Chief Executive, Southern Cross Medical Care Society 82
A Ministry of Health paper outlining some international responses to the increased demand for services for ageing populations highlighted four areas that will need to change if health systems are to cope with the increasing demand. They relate to a need for:83
• more practitioners to complement increasing population sizes;
• more specialist services to deal with specific conditions associated with age;
• more expertise in older people’s health because of the prevalence of chronic and multiple conditions; and
• more support services for older people who often need assistance with daily living.

34
A paper commissioned by the Ministry of Health to gauge the impact of population ageing on health and disability services and workforce implications called for forward planning to meet workforce shortfalls not only because of the increasing demand for services but also because the health workforce itself is ageing, as discussed further in the following chapter.84
Rising public expectations
The literature shows that in many western countries health care users are becoming more vocal about the health services they expect to receive. Furthermore, information technology is likely to have a big impact on the level of knowledge that will be held and can be accessed by individuals, which may result in increased participation of patients in decisions pertaining to their care.
In the United Kingdom, a major review of the National Health Service85 concluded that the future health service user is likely to be better educated, more informed, more affluent, time pressured, less deferential to authority and professionals, have more comparisons to apply to the health system, will want to have more control and exhibit greater choice, and will expect a more tailored health service.
Patients increasingly, and legitimately, demand to be seen at times that are convenient for them rather than for health professionals.86
Future older populations will demand higher levels of care for any given health need. In short, future patients will expect their health service to provide:
• a universal and fair service
• safe, high quality treatment
• fast access
• an integrated, joined up system
• comfortable accommodation, and
• services designed around the individual’s needs87
Quality and safety of services
Ensuring that healthcare is sustainably staffed is … not an optional luxury. We can no longer expect doctors and nurses to work unsafe long hours, with unstable teams of locum staff; nor can we draw resources away from other parts of the service to cross-subsidise inefficiencies. Therefore, safety and sustainable staffing of acute services are intrinsically linked.
The Future Hospital: The progressive case for change 88

THE PUBLIC HOSPITAL SPECIALIST WORKFORCE ASMS
35
The drive to improve the safety and quality of health services will have a significant positive impact on the efficiency and effectiveness of the service. One study has estimated that adverse events in our health services could cost New Zealand $870 million per year, of which $590 million is due to potentially preventable events – mostly occurring in the hospital system.89
While a range of factors contribute to this, there are many examples indicating specialist staffing levels is an important factor, especially given the increasing complexity of health care delivery is placing greater demands on the expertise of doctors and teams of healthcare professionals. However, increasing heavy clinical demands have meant many specialists are unable to find the recognised professional minimum standard of time for non-clinical duties, including time for continuing education, research, quality improvement activities and, not least, training and supervising other doctors.
An Australian survey of quality and safety practitioners found, “The single proposal judged by survey respondents to have the highest potential effect on reducing adverse events was that the supervision and support of junior doctors be improved.”90
Specialist training requirements
There is no reliable data available on the ratio of DHB-employed specialists to RMOs. The latest data available from DHBNZ’s Health Workforce Information Programme (HWIP) includes only high-level figures for the senior medical workforce and the junior medical workforce.91 Assuming the Medical Officer workforce is approximately 13% of the DHB senior medical workforce, based on unpublished DHB salary survey data, the HWIP data suggest the ratio of DHB specialists to RMOs is approximately 1: 1. This is considered to be well below the optimum.92 Nevertheless, the RMO workforce growth rate is set to pick up in the coming years as a result of increases in medical school intakes from 2004.93
The effects are already beginning to show, with the latest annual MCNZ Medical Workforce Survey showing a 7.6% increase in house officers in 2011.94
The former Medical Training Board, acknowledging the investment in medical school intakes, recommended that a corresponding investment is now also needed to ensure there is adequate workforce capacity to do the training. (The plan to increase medical school places by a further 200 represents a government investment estimated at approximately $300 million a year once it is fully implemented.b)95
b The cost of training a doctor up to their final year as a registrar is estimated at approximately $1.5 million per doctor ($500,000 as an undergraduate and at least $1 million postgraduate).

36
In addition, the Government’s support for the recommendations of the RMO Commission (excluding the single-employer proposal) has further significant implications for the specialist workforce employed by DHBs.96
The Commission’s findings and recommendations reflect the need for specialists to play a greater role in RMO training and education. However, a paper prepared by the secretariat to the SMO Commissionc and considered by the RMO Commission in its deliberations (and appended to its report) points out:
• The apprenticeship model of learning has many benefits, but implicit in the apprenticeship model is a significant time investment by SMOs to provide doctors in training with quality training and learning experiences.
• The changing health care environment is putting the apprenticeship model under threat.
• Several factors impact adversely on the availability of SMOs to teach resident doctors, including inadequate time for training, growing training demands, and a lack of clearly defined teaching responsibilities and duties in specialists’ employment agreements.97
“Feedback from the consultation meetings with SMOs (and RMOs) indicates that a strong commitment to education and training by a DHB can be a significant pull factor for medical recruitment and retention. In practice, however, SMOs often carry heavy clinical and non-clinical workloads associated with meeting hospital’s service requirements. SMOs are generally not allocated dedicated time for teaching, supervising and mentoring junior clinical staff. This is borne out by the Clinical Training Agency: Summary of Responses to 2006 Training Programme Questionnaire, which found that the most common issue for supervisors was having insufficient time to provide clinical supervision. Both doctors in training and supervisors found that their workloads limited their ability to effectively participate in the training.”
Secretariat to the SMO Commission 2009 98
Technological advances
The contribution of new technologies in improving health, and their costs and benefits, are issues of major importance in many countries. But technological innovation is, by its very nature, hard to predict because it involves the discovery of the previously unknown. There is no standardised measure of technological change by which it can be factored into health service projections.
c The Commission on Competitive and Sustainable Terms and Conditions of Employment for Senior Medical and Dental Officers Employed by District Health Boards

THE PUBLIC HOSPITAL SPECIALIST WORKFORCE ASMS
37
Technological change could potentially reduce demand for health services and lower costs or, just as easily, generate increased demand on the health sector and raise costs.99,100
Generally, to date, the latter has tended to occur. The introduction of new drugs, for example, may improve the effectiveness of treatment for some illnesses, but may also increase needs in two ways:
Firstly, they have the capacity to benefit more people and might also increase the average length of illness (expand morbidity rates) in that they keep alive those that may have died without the new treatment. Secondly, it is likely that the amount of treatment for each patient may rise in terms of visits to the prescribing doctor.101,102
In the United Kingdom it has been found that over the past 20 years medical technology has increased the availability and accessibility of treatments to a larger number of people and for longer periods of time.103
A report by the National Health Board is unequivocal: “Technological advances, and desire for publicly funded access to them, will generate ongoing growth in specialised services.”104
In areas such as surgery, technological advances have led to the application of existing procedures to a wider range of individuals. Research on the effects of the introduction of laparoscopic technology on the threshold to perform cholecystectomy, for example, found that the improved technology led to increased rates of surgery. Minimally invasive surgical techniques are rapidly improving and finding new applications. If this trend continues, the demand for surgical procedures may see even further increases as clinical thresholds for other procedures are lowered.105
Developments in new technology have also led to the creation of new specialties, as well as a need for more specialists.
From 1983 to 2001 the leading not-for-profit health maintenance organisations in the United States, Kaiser Permanente, saw a much greater increase in its specialist workforce compared to its primary care workforce, evidently due to “the inexorable impact of changing technology in the practise of medicine in our setting”. Positive features of Kaiser Permanente are its high level of clinical leadership and vertical integration (between primary and secondary).106
Examples of the impact of technology are illustrated in three areas (cardiology, radiology, and gastroenterology). In each example, the diagnosis or treatment of a common condition in 1983 was well within the purview of the primary care physician but by 2001 had moved into the purview of the procedure-based specialist:
“Technological advances, and desire for publicly funded access to them, will generate ongoing growth in specialised services.”

38
In 1983 cardiac auscultation by stethoscope, for the diagnosis of both congenital and acquired heart disease, was a proud part of the armamentarium of primary care physicians, both adult and paediatric. By 2001 cardiac auscultation, for these purposes, had largely been replaced by extremely sophisticated echocardiography, a much more sensitive and specific tool but one performed routinely by highly trained echocardiographers, a subspecialty barely thought of in 1983.
Similarly, in 1983 breast self-exam and physician breast examination were important parts of the early detection of breast cancer. By 2001, although both self- and physician breast examination were still widely practised, screening mammography had become the medical “bottom line” for the early detection of breast cancer. Thus, much of the job of detecting breast cancer has passed from primary care physicians to highly trained mammographers, a subspecialty of radiology.
In 1983 the most commonly used screening test for the detection of colorectal cancer was fecal occult blood testing. This test was generally ordered and interpreted by primary care physicians... While fecal occult blood testing is still used, it has largely been replaced by screening sigmoidoscopy, and more recently by colonoscopy, both requiring the talent of highly skilled gastroenterologic endoscopists.
FJ Crosson 2004 107
While Kaiser Permanente has seen specialist services grow with the greater development and use of new technology, the health maintenance organisation has achieved lower rates of hospital use compared to other HMOs (as well as Britain’s National Health Service), its health costs per employee are indicated to be around 10% lower than the United States average, while its health outcomes compare well with other American providers. It has achieved this through a range of measures such as technology assessment, evidence-based medicine, active peer review and integrated team-based care.108,109 The latter is not only necessary to provide effective patient-centred care – the dramatic expansion of information to be evaluated, diagnostic alternatives and therapies to be prescribed will also require a greater emphasis on collaboration and teamwork over individual work.110
The literature indicates that while new technologies will enable more treatment and care to take place outside of traditional hospital settings, at the same time the assessment of treatment options will continue to become more sophisticated. Continuing advances in scientific knowledge will require new areas of specialisation and expertise within the team.111,112
Technologies derived from our newfound ability to understand disease at a molecular level will increase the number of specific types of diseases and the number of therapies from which practitioners must make a selection. For example, instead of two major types of diabetes, we may find that there are dozens based on key differences in the molecular mechanisms that lead to the common finding of elevated

THE PUBLIC HOSPITAL SPECIALIST WORKFORCE ASMS
39
blood sugar. Similar kinds of heterogeneity are likely to be found for most diseases… For common diseases such as high blood pressure, diabetes, and heart disease, a future practitioner may have to select from hundreds if not thousands of potential treatment options.
DR Masys 2002 113
A further effect of rapid technological advances concerns the time needed for specialists to continually update their knowledge and technical skills to keep abreast with latest medical advancements. It is compulsory for specialists to fulfil ongoing medical education requirements.
Furthermore, as diagnostic techniques improve and procedures become more diverse, in-hospital training requirements for resident medical officers (RMOs) increase. Pressures on the hospital system mean that hospitals are finding it more difficult to release consultants to supervise and teach RMOs. 114,115
Innovations such as “telemedicine” and “telehealth” could provide the opportunity for specialists and other health professionals to monitor a person’s health status remotely, as well as linking health professional networks around the country and overseas, which is especially valuable for some of the smaller specialties. This still requires a specialist at one end of the communication line, however, as well as much greater investment in the necessary communication technology and associated training.
Overseas studies have identified a number of barriers to the introduction of telemedicine, including an aversion to using telemedical devices among some people, especially older people; funding; lack of skills; and workforce shortages.116, 117, 118
It has also been argued that developing the telemedicine approach ignores other roles of the hospital, in particular its caring role (and public expectations to have access to local secondary care services), as well as its role in training and professional development.119
While such technology may improve quality, treatment options and access to health care, there is no sign that in the foreseeable future telemedicine or any other new technology will mitigate the need to increase the specialist workforce to meet the current and future health needs of an ageing population. The evidence suggests quite the opposite.
Changing models of care
As discussed in Chapter 1, our hospitals have undergone huge changes over the past decades. Models of care have always been evolving, especially as a response to changing technology and, in New Zealand’s case, continual health

40
system “reforms”. However, with demand for health services increasing and the supply of health professionals becoming more limited, a new impetus is being given to “changing models of care” – a catch-phrase for health service “reformers” internationally – which are now considered “essential to ensure a sustainable, affordable medical workforce into the future”.120 There is now a more concerted drive towards service redesign and workforce re-engineering, including finding ways to transfer some medical specialists’ tasks to other health professionals in an attempt to mitigate specialist workforce shortages.
The international literature includes specific examples where new models have indeed improved access to services and freed up time for specialists to do other work. There are also good examples where greater collaboration and development of national and regional clinical networks improves effectiveness and efficiency, while relieving some of the pressures created by a thinly spread workforce, particularly in the smaller specialties. However, the evidence from such studies suggests any impact they may have on future demand for specialists would be, at best, marginal and may in fact increase pressure on other groups of health professionals such as general practitioners.121, 122
A recent major Australian report which looks at long-term planning for the specialist workforce in Australia suggests some new models of care could “significantly impact workforce requirements” and provides a number of “real world” examples that, if widely implemented, could mitigate the demand for specialists in the future. However, there is no way of knowing to what extent – or even whether – this might happen, especially when considered alongside the countervailing factors such as the ageing and changing gender composition of the medical workforce, changing attitudes regarding work-life balance, and rising public expectations as new treatments become available. It may also be fairly assumed that any freed-up specialist’s time is used to improve the quality and effectiveness of the service, including addressing unmet (and unmeasured) needs. Not least, as with some other international studies, there is an implicit assumption in the examples that certain other health practitioners will be available to take on additional responsibilities, including GPs, nurse practitioners, advanced practice nurses, optometrists, advanced practitioner physiotherapists and radiographers, all of which are in short supply.123
What is clear from New Zealand’s experience is that the implementation of new models will be restricted, or even unable to proceed, while there are shortages of key specialists, as well as other clinicians, and where the turnover of staff is such as to disrupt continuity in the development of new innovative approaches. Further, some new models of care in a fully integrated system require increased use of specialists to achieve maximum benefits. This is especially the case in implementing clinical leadership, which is discussed in more detail in Chapter 6.124,125
There is now a more concerted drive towards service redesign and workforce re-engineering...

THE PUBLIC HOSPITAL SPECIALIST WORKFORCE ASMS
41
Government objectives
In addition to government objectives to improve the quality and safety of services, and improve the quality of medical training, other key objectives, which depend on an adequate specialist workforce if they are to be achieved on a sustainable basis, include:
• better access to cancer services;
• reduced wait times for cardiac services;
• continuing increases in elective surgery (by 4,000 a year), with waiting times no longer than four months by the end of 2014;
• reduced waiting times for first specialist appointments (FSAs) so all patients are seen within four months by 2014;
• better clinical integration across the health sector;
• better quality care and treatment for older people;
• more responsive mental health and addiction services;
• further reductions in the average length of stay in hospital;
• increased productivity; and
• improvement in quality of hospital treatment, including reducing unplanned readmissions and the incidence of adverse events.126
The Government has given strong emphasis to developing clinical leadership as a means of achieving improvements such as those above. The Minister has acknowledged that clinical leadership is a fundamental driver for better health outcomes. However, the considerable potential for strong clinical leadership to improve cost-effectiveness and service performance, as indicated in overseas research, is also dependent upon clinicians – and especially medical specialists – having the time to put it into practice.
Assessing workforce needs to match demand
There is no accepted or established way of objectively measuring a nation’s need for doctors.127 One way of assessing New Zealand’s medical specialist workforce needs for the next decade is to examine established workforce levels in a range of other developed countries that have similar age characteristics projected for New Zealand.
New Zealand, with 14% of its citizens aged 65 and over, has a relatively young population. In 2009 the proportion of the population aged 65 and over had already reached at least 16% in 16 OECD countries and at least 17% (New Zealand’s estimate for 2021) in 10 countries.d
d Austria, Belgium, Estonia, Germany, Greece, Italy, Japan, Portugal, Sweden, Switzerland. Source: OECD Health Data 2011 (figures for 2009 or latest year available).

42
The average number of specialists (including trainee specialists) in those 10 countries was 2.3 per 1,000 population, ranging from 1.8 (for Belgium) to 3.34 (for Greece)e. New Zealand’s equivalent figure in 2009 was 1.29 per 1,000 population, which put it in 26th position out of 30 OECD countries (see Appendix 3). Canada, which is also near the bottom of the OECD list, is also experiencing specialist shortages (see Appendix 4).
To reach 2.3 specialists-plus-registrars per 1,000 population by 2021, assuming the proportion of specialists to registrars remains constant (approximately 70% total specialists and 30% registrars, based on recent MCNZ workforce survey reportsf), New Zealand’s total specialist workforce (private and public) needs to increase to approximately 1.6 specialists/1,000 population, or from 4,634 in 2012g to 7,700 in 2021 – an annual average net increase of about 340 specialists. (New Zealand registration data show an average annual average increase of 173 specialists in the eight years to March 2012.)
Another way to estimate our future needs is to use Australia as a benchmark, looking at what New Zealand would need in order to match the Australian specialist workforce per 1,000 population. New Zealand’s health needs, as indicated by key health status indicators, tend to be greater than Australia’s (Table 1) but are generally within a comparable range. Further, Australia has a similar proportion of the population aged 65+ and similar population projections to 2021. Catching up with Australia would present a more pragmatic target, given the size of Australia’s specialist workforce is very moderate compared with other OECD countries (Appendix 3).
This was the approach used in the DHB-ASMS The Business Case,128 which estimated Australia would have 1.4 specialists per 1,000 population by 2021 and New Zealand would need to increase its total specialist workforce by an average of 232 specialists per year from 2010/11 to reach a similar figure by that year. However, more recent health workforce data indicate Australia is increasing its specialist workforce at a higher rate than previously estimated.
The latest data129 available show Australia is projected to have approximately 1.5 practising specialists per 1,000 population by 2021 (the data excludes specialists who are working in non-clinical roles). Data on projected specialist workforce demand suggest a slightly lower figure (about 1.45 specialist/1000), although the report points out this does not necessarily mean the workforce would be in oversupply, particularly for some specialties such as obstetrics and gynaecology,
e Data was not available for Japan
f MCNZ workforce surveys include specialists working solely in the private sector, and specialists employed in non-clinical work. DHBNZ data indicated that in practice, the proportion of specialists to registrars is closer to 60%/40%.
g Based on the Medical Register as at March 2012.

THE PUBLIC HOSPITAL SPECIALIST WORKFORCE ASMS
43
ophthalmology, pathology, psychiatry, diagnostic radiology and radiation oncology, which are projected to be in short supply in 2025. Also, data limitations have meant some aspects of demand, which is based on service use, have not been included in the projections.h
To reach 1.5 specialists per 1,000 population by 2021, New Zealand’s total specialist workforce (private and public) needs to increase from 4,634 in 2012 to 7,200 in 2021 – an annual average net increase of about 285 specialists. This is more than 100 specialists per year above the current average net growth.
Summary
The demand for more medical specialists over the next decade is considerable. Key factors include:
• An ageing and more ethnically diverse population, many with multiple illnesses
• A high health need compared to most other OECD countries.
• A low number of specialists compared to most other OECD countries.
• Rising public expectations for better access and better quality services.
• Technological advances requiring new areas of specialisation and a likely increase in demand for new services
• A growing training workload
• Government’s objectives, which require specialists to find additional time to, among other things:
– develop and implement comprehensive clinical leadership, within DHBs, between DHBs and in regional and national clinical networks;
– provide services and training in community-based centres;
– provide services and training in a more regional context;
– take a greater role in training and supervision of resident doctors;
– achieve (and sustain) health targets that impact on a wide range of specialties;
– improve access and responsiveness of mental health services; and
– improve quality and safety of services generally.
• Specialist workforce demand projections in Australia indicate New Zealand needs to significantly increase its rate of workforce growth if it is to match Australia’s specialist-to-population ratio by 2021.
h Estimated from average projected supply and demand figures for 2018 and 2025 from a range of modelled scenarios, including introduction of new models of care, reduced reliance on immigration, capped working hours, and registrar work factors. Where projections are not provided for some smaller specialties, estimated projections are based on the average supply projections of all other specialties, and supply for these smaller specialties is assumed to be equal to demand.

Health Service Forecasts
Demand for specialist services in a series of Health Service Forecasts (formally called
“Reviews”), funded by Health Workforce New Zealand, is summarised below:
Rehabilitation Services
Chronic Obstructive Pulmonary Disease (COPD)
It is estimated that at least 223,000 New Zealanders have COPD, with only around
22% of cases being diagnosed. Hospitalisation rates for COPD are still increasing
among men and women, Maori and non-Maori. Although pulmonary rehabilitation
has proven benefits, it is doubtful if more than 2% of new COPD patients, or 10%
of existing patients in New Zealand, have access to a rehabilitation programme.
Stroke
According to a 1997 study, there were approximately 32,000 people in New Zealand
living with stroke, and only 30% of those were independent in activities of daily
living.
In 2009 there were approximately 6000 first-ever strokes and 2000 recurrent strokes
in New Zealand. More than 90% of stroke sufferers are admitted to hospital. A
recent study in Auckland following up five years after stroke showed a range of on-
going functional impairments:
• Dementia(22.5%)
• Recurrentstroke(20%)
• Institutionalised(15%)
• Depression(30%)
• Bladdercontrolproblemsorfalls(33%)
Currently only 39% of New Zealand stroke patients are admitted to a hospital stroke
unit, compared to 74% in the United Kingdom and more than 80% in Scandinavian
countries. Stroke units save lives: for stroke patients, general wards have a 14% to
25% higher mortality rate than stroke units.
If current trends in incidence and mortality continue, then the number of people
living with stroke will reach 50,000 by 2015.
44

THE NE W ZEALAND SPECIALIST WORKFORCE ASMS
Anaesthesia
The New Zealand Anaesthesia workforce is “severely stressed in some regions. It is
likely to come under more stress as demand for [anaesthesia] resources increases
over the next decade with a risk of service failure unless specific measures are taken
to address this demand”.
Palliative care
There are major gaps in palliative care service provision, while demand is increasing.
There are increasing referrals and increasing demand for hospital palliative care
services due to an under-resourced community palliative care service, and there are
limited palliative care services in many rural areas.
Aged care
Baseline projections indicate that those 65 and over being admitted to an acute
hospital will rise by around 64% between now and 2026.
Ophthalmology
Currently there is a shortage of ophthalmologists and only a total of 18 training
places in ophthalmology throughout New Zealand. This will be insufficient to meet
future population growth and the increase in eye health conditions that will result
from the ageing population, even with the development of clinical networks. While
the other eye health workforces can assist with medical treatments of some eye
health disease, ophthalmologists are the only eye health workforce that undertakes
eye health surgery and would provide an essential leadership role within eye health
managed clinical networks. There is therefore a need to address both workforce
numbers and training places.
Musculoskeletal services
One in four adults in New Zealand is affected by a musculoskeletal disorder. In
2005, one in six New Zealanders was living with arthritis; by 2020 this is expected
to reach one in five, due to demographic ageing. There will be increases in the
number of people who will have “wear and tear” problems, more people with less
effective muscle performance and lower physical skill levels, as well as a weakened
structural system. These elements will be further affected by obesity, coronary heart
disease and osteoporosis.
45

Gastroenterology
To deliver a service meeting the requirements of the proposed national colonoscopy
screening programme the total number of colonoscopies performed within the
public health service needs to increase by 10%-12% plus a further 15% to ensure
individuals identified at increased risk of CRC were offered a surveillance colonoscopy
within six months from the time of first referral or scheduled repeat date.
Follow-on colonoscopies need to be performed by gastroenterologists or surgeons
and if newer technologies result in colonoscopy becoming a more interventional
procedure this will impact further on the workforce.
Diabetes
Diabetes prevalence is increasing in New Zealand at a mean rate of 8%-9%
compounded per annum. Diabetes incidence rates are expected to increase 1.5%
per year (reflecting the obesity epidemic).
In 2011, the estimated number of people with diabetes was over 237,000 and is
estimated to increase by 50% by 2021 without effective prevention programmes.
Diabetes prevalence is higher among Maori (5%-10%), Pacific (4%-8%) and Asian
Indian (4%) populations compared with New Zealanders of European descent (3%).
About 90% of those with diabetes have type 2 diabetes (T2DM) but the prevalence
of both type 1 diabetes (T1DM) and gestational diabetes (GDM) is also increasing.
Type 2 diabetes is increasingly being diagnosed at younger ages, and even in
childhood.
Diabetes has no boundaries. It is a complex multi-system metabolic disease affecting
all age groups. The number of people with diabetes requiring care will continue to
rise across all health care settings for the foreseeable future. Appropriate expertise
will be required for all types of diabetes now and into the future, and different
expertise will be required to meet the complex demands.
Mental Health
The aim to 2020 is to reach towards the 7%–9% of the population with the highest
mental health needs, “of which half to two-thirds currently have poorly addressed
and high levels of distress, loss of functionality and poor health outcomes”.
46

THE PUBLIC HOSPITAL SPECIALIST WORKFORCE ASMS
47
4 Supply of medical specialists
Supply of medical specialists has three elements:
• Newly trained specialists joining the specialist workforce
• Recruitment (from New Zealand and overseas), and
• Retention
Before examining these elements, it is important to have an understanding of recent trends in the medical specialist workforce.
8000
7000
6000
5000
4000
3000
2000
1000
0
Data from the medical register show an average annual increase of 173 specialists in the eight years to March 2012. Data from DHBs indicate an average annual increase of 154 DHB-employed specialists over the seven years to July 2011 (Figure 2 & Appendix 2).
The difference between the MCNZ and DHBs’ totals is an indicator of the number of specialists practising solely in non-DHB sectors (eg private hospitals,
Sources: MCNZ Medical Register; District Health Boards, Statistics New Zealand, Health Workforce Australia, Australian Bureau of Statistics
FIGURE 2: PRACTISING mEDICAl SPECIAlISTS IN NEW ZEAlAND: TRENDS AND PROJECTIONS
2004 05 06 07 08 07 08 09 10 11 12 13 14 15 16 17 18 19 20 21
Projected
Total practising specialists on the register
DHB specialists
Requirement to match Australia’s latest projections
DHB-ASMS Business Case agreement
Projections on current trend

48
private practice, universities, government departments etc). Part of the difference may also be due to an unknown number of short-term registrants being included in the MCNZ’s figures (ie not on a salary), and partly because the two sets of data are collected at different times of the year (March for MCNZ and July for DHBs).
According to the SMO Commission report, in 2008 about 8% of specialists practised solely in solo or group private practice or a private hospital, based on MCNZ workforce survey data. The above data, despite including other non-DHB employers, suggest that may be conservative. A Royal Australasian College of Surgeons’ survey in 2007 found 17.5% of the workforce was working solely in private practice,130 and a survey of ophthalmologists in 2010 found a similar proportion (16%) did likewise.131 Some specialties, however, will have limited ability to practise in the private sector. Use of the private sector is discussed later in this chapter.
The average annual increase of 173 specialists (private and public) falls well short of the increase needed (232 annually) to fulfil the agreement ASMS reached with DHBs in the 2010 Business Case and to match Australia’s latest specialist workforce projections, on a per-population basis, by 2021.
Supply through training, recruitment and retention
The sources of the specialist workforce are (a) from the pool of registrars as they qualify for vocational registration and (b) overseas-trained specialists.
The entrenched, long-term shortage of specialists in New Zealand is due in part to decisions on the supply of doctors in the past. The capped number of medical school places was reduced by over 50 in 1982 to 285 per year and remained at that level for 22 years. In 2004 it was increased by 40, and then by a further 40 in 2007. The Government’s plan to increase the number of places by a further 200 over five years from 2010 will mean that between 2004 and 2015 the number of medical school entrants will double, leading to a sharp increase in the number of doctors entering prevocational and vocational training.132,133
However, it takes at least 13 years to produce a medical specialist (17 years on average),134,135 so even the modest effects of the 2004 increase will not flow on to the specialist workforce for another five to 10 years – and there will be losses along the way.
The latest MCNZ workforce data show the proportion of New Zealand graduates that are not registering when they graduate has been increasing. The proportion of registrants averaged 91.8% of the class size in the three years to 2003 compared with 85.4% in the three years to 2010. This is not taken into account in MCNZ’s retention figures, which are based on registered

THE PUBLIC HOSPITAL SPECIALIST WORKFORCE ASMS
49
doctors. Nevertheless, more than a third of New Zealand medical graduates are no longer practising in New Zealand 10 years after their initial registration following graduation.136 (Table 3)
Such attrition rates considerably limit the supply of the next generation of specialists. Until this is addressed, New Zealand’s capacity to develop its specialist workforce will continue to depend heavily on IMGs for the foreseeable future and casts doubts on the extent of the medium-to-longer term benefits from the recent and planned increases in medical school intakes.
Data is not readily available on the inflows and outflows of registrars. However, MCNZ workforce survey data show the total number of registrars has increased from 1227 in 2000 to 1787 in 2011 – an average annual increase of 51 registrars,i
which is well below the number of new specialists needed per year.
Final year1
Class size 2
Students Percentage of registered3 graduates retained, by post-graduate year4
1 2 3 4 5 6 7 8 9 10 11
2000 323 286 94 82 74 77 78 79 76 74 67 60 59
2001 297 271 95 79 78 81 80 78 74 72 65 63
2002 308 285 94 81 76 79 82 78 76 72 71
2003 329 302 94 81 80 78 79 75 74 71
2004 342 284 101 87 85 88 85 81 79
2005 318 297 100 84 77 78 77 74
2006 322 287 99 89 85 80 80
2007 323 284 96 83 79 77
2008 356 308 102 93 88
2009 389 337 100 92
2010 382 317 100
1 ‘Final class year’ is used as Auckland and Otago medical schools identify graduate year differently.2 ‘Size of class’ is taken from a list of those in final class years as given by medical schools. Not all are
necessarily eligible for graduation.3 ‘Registered’ is defined as those from the class year who have been registered at some time.4 ‘Year’ gives those who held one or more practising certificates in the year April to March as a
percentage of the graduates from the class year who registered in New Zealand.5 The percentage retained can be more than 100% where more graduates were registered in that
year than were registered in the first postgraduate year.
i This figure is the net increase, including an unknown number that is added each year, minus the number that gain vocational registration, and minus an unknown number who leave the workforce
TAblE 3: RETENTION OF NEW ZEAlAND GRADUATES FROm ClASS yEARS 2000–2010`
Source: MCNZ 2012
5

50
Further, the last decade has seen a general decline in retention rates of doctors after they become vocationally registered. Figure 3 illustrates the trend in the percentage of New Zealand-trained doctors lost one year after gaining vocational registration. Hospital specialists account for nearly two-thirds of new vocational registrations.
The retention trends fluctuate more in subsequent post-vocational registration years but the general direction is towards an increasing loss of doctors. For example: three years post-registration, 10% of those who registered in 2008 were not practising here compared with 5.5% of those who registered in 2000. Six years post-registration, 11.5% of those who registered in 2005 were not practising here compared with 5% of those who registered in 2000.
It is often argued that many doctors who leave New Zealand tend to return eventually. The data show that over recent years some specialists and GPs (not many) have indeed returned, at least for the short to medium term. However, by eight to 10 years post-registration the numbers tend to drift away again and the eventual loss is greater than in the early post-registration years.
16%
14
12
10
8
6
4
2
02000 01 02 03 04 05 06 07 08 09 10
Source: Compiled from MCNZ data 2012
FIGURE 3: PERCENTAGE OF NEW ZEAlAND GRADUATES lOST ONE yEAR AFTER GAINING
VOCATIONAl REGISTRATION
Year of registration
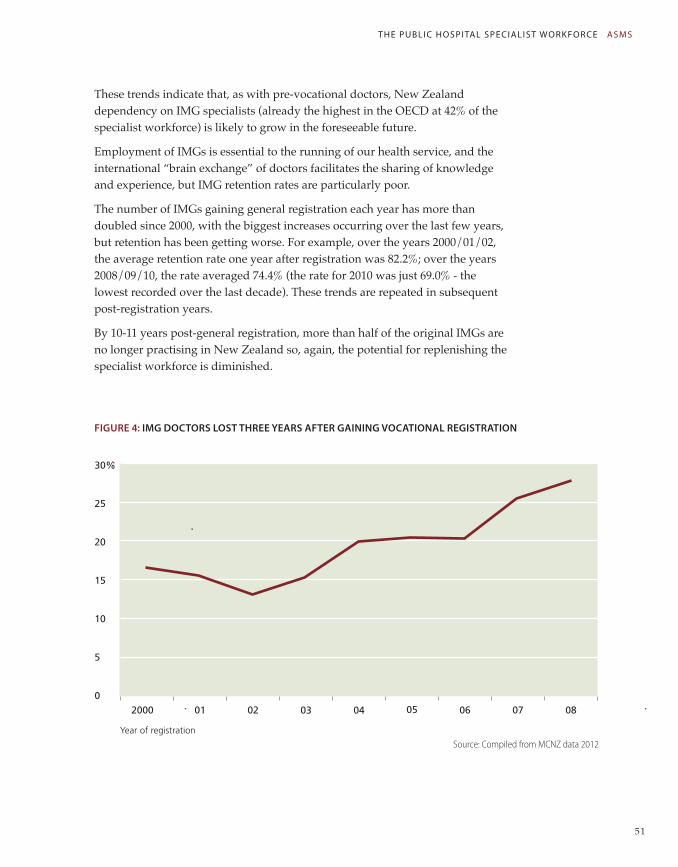
THE PUBLIC HOSPITAL SPECIALIST WORKFORCE ASMS
51
These trends indicate that, as with pre-vocational doctors, New Zealand dependency on IMG specialists (already the highest in the OECD at 42% of the specialist workforce) is likely to grow in the foreseeable future.
Employment of IMGs is essential to the running of our health service, and the international “brain exchange” of doctors facilitates the sharing of knowledge and experience, but IMG retention rates are particularly poor.
The number of IMGs gaining general registration each year has more than doubled since 2000, with the biggest increases occurring over the last few years, but retention has been getting worse. For example, over the years 2000/01/02, the average retention rate one year after registration was 82.2%; over the years 2008/09/10, the rate averaged 74.4% (the rate for 2010 was just 69.0% - the lowest recorded over the last decade). These trends are repeated in subsequent post-registration years.
By 10-11 years post-general registration, more than half of the original IMGs are no longer practising in New Zealand so, again, the potential for replenishing the specialist workforce is diminished.
FIGURE 4: ImG DOCTORS lOST THREE yEARS AFTER GAINING VOCATIONAl REGISTRATION
30%
25
20
15
10
5
0
Source: Compiled from MCNZ data 2012
2000 01 02 03 04 05 06 07 08
Year of registration

52
Similar patterns exist for IMG specialists. Over the last decade, the number of IMGs gaining vocational registering has averaged 49% of the total number and the retention rate has deteriorated. For example, over the years 2000/01/02, the average IMG retention rate one year after registrating was 90.2%; over the years 2008/09/10, the rate averaged 83.3%. Similar trends emerge in subsequent post-registration years. Figure 4 illustrates the trend of IMG doctors lost three years post-registration.
Figure 5 compares the attrition rates of doctors who registered in 2000 with those who registered in 2006. Of the doctors who registered in 2006, 25% of them were lost within five years.
FIGURE 5: PERCENTAGE OF VOCATIONAlly REGISTERED ImGS lOST OVER FIVE yEARS
FROm COHORTS OF 2000 & 2006
While all of the above examples show retention declining for IMG doctors and New Zealand vocationally registered doctors in the short-to-medium term, it remains to be seen whether more doctors will return in the longer term. However, it is notable that in every year since 2000, the longer-term retention rates (8-10 years post-registration) are lower, and in some cases considerably lower, than the retention rates one year post-registration. The effect is illustrated in Figure 6, showing the average loss of IMG vocationally registered doctors over a period of 10 years. By the end of that period, around 30% of doctors were lost to New Zealand.
It is reasonable to assume, therefore, that the longer term loss of doctors will reflect the trends of the short-to-medium term losses.
Source: Compiled from MCNZ data, 2012
Post-registration year1 2 3 4 5
30%
25
20
15
10
5
0
Doctors registered in 2000
Doctors registered in 2006

THE PUBLIC HOSPITAL SPECIALIST WORKFORCE ASMS
53
FIGURE 6: AVERAGE RETENTION RATES FOR ImGS AFTER VOCATIONAl SCOPE ObTAINED,
FROm 2000 TO 2010 INClUSIVE
There is a paucity of data on turnover rates of New Zealand doctors, but new vocational registrations data for the 10 years to 2012 show that on average 313 new hospital specialists join the workforce each year (both IMGs and New Zealand doctors), while the net average increase of specialists over the same period is only 166 per year. That means, in round figures, we gained about 3100 specialists (an average annual growth rate of around 8%) and lost about 1500 specialists (an average annual loss of nearly 4% of the total workforce). Data is not readily available on the composition of these losses but the MCNZ’s workforce survey reports suggest the losses are mostly IMGs.
In comparison, the workforce exit rates for 25 specialties and sub-specialties in Australia in 2012 averaged 1.5%.137
The high turnover of IMGs in New Zealand results in an increasing share of senior and junior medical posts being filled by locums on short-term contracts. This reduces the capacity to bring cohesiveness to medical services generally, and increases specialists’ supervisory load. An accreditation programme recently introduced by the Medical Council to ensure appropriate support and supervision is provided to IMGs may help to improve retention but it will also add further to specialists’ current supervisory workload.
Our high dependence on IMGs also puts services in a vulnerable position in view of the increasing international competition to attract health professionals.
Source: Compiled from MCNZ data 2012
100%
80
60
40
20
0
IMGs lost
IMGs retained
1 2 3 4 5 6 7 8 9 10 11
54
Any change in migration flows outside the control of New Zealand authorities could have a dramatic impact on our health services.
There are already signs of this, such as Indo-Asian doctors choosing to stay at home to attend to a growing affluent middle class, the related recent decision by India’s Government to recognise overseas-trained doctors, and a growing and increasingly specialised health workforce in the United States.138
A reduction in the flow of doctors from Asia will hurt New Zealand since Asian doctors have one of the best IMG retention rates. On the other hand, while there has been speculation that New Zealand may start to see a greater influx of RMOs from the United Kingdom and Australia, IMGs from those countries have relatively low retention rates.
To date, Australia has been by far the most popular destination for New Zealand doctors. Over recent years around 300 New Zealand doctors annually have moved across the Tasman (settlers, and permanent and long-term stays), including many specialists.139 Despite Australia’s drive to reduce its dependency on IMGs in the long term, all the indications point to a continuation of Australia’s recruitment of New Zealand specialists in the foreseeable future. Australia is continuing to experience specialist shortages – described as “critical” in some places – across the full range of specialties. (See more on Australia in Appendix 5.)
There are no official statistics kept on the number of specialists emigrating each year from New Zealand. However, an OECD paper conservatively estimates 29% of New Zealand trained doctors are working overseas.140
Vacancies
There is no reliable data on vacancies rates nationwide. DHB budget constraints influence the number of official vacancies as only funded positions are recorded. This has meant that in 2008, for example, DHBNZ’s official vacancy rate nationally was approximately 10% of positions, but data collected by ASMS in specific DHBs indicated there were up to 24% real vacancies in that year.141 The latest retention trends suggest that situation has not improved, and may have become even worse.
Reasons for leaving
There is a range of “push” and “pull” factors that motivates specialists to leave. Key factors include “onerous” on-call hours, shortages of RMOs as well as senior staff (resulting in more work for SMOs), lack of administrative support, lack of real non-clinical time, poor relationships with management, unstable
Poor workforce planning, poor retention of registrars ... and specialists has led to across-the-board shortages, which are becoming increasingly entrenched.

THE PUBLIC HOSPITAL SPECIALIST WORKFORCE ASMS
55
staffing with high dependence on locums, lack of time for mentoring young doctors, increasing numbers of staff working part-time putting more pressure on full-timers, as well as remuneration.j
There is evidence that remuneration is becoming an increasingly important “push” and “pull” factor.
An MCNZ survey of doctors who had indicated they were leaving New Zealand found those who were vocationally registered tended to cite increased remuneration and further training as their reasons for leaving New Zealand (although no figures have been released to show the extent of this). Seventy-five percent of those with a vocational registration indicated they were heading for Australia.142
A separate Medical Council-commissioned study on why IMGs leave New Zealand found 41% of survey respondents were on short-term visits. The main barriers to retention were identified as low incomes, family reasons and training opportunities.143 DHB exit interview data indicate a high proportion of departing senior medical officers (SMOs) are on fixed-term contracts. Registration data suggest many of these are IMGs.
Currently, despite the serious implications for New Zealand’s medical specialist workforce trends, neither Health Workforce New Zealand nor the MCNZ have any plans to examine the reasons why vocationally registered doctors have a poor retention rate.
Medical specialist shortages
A combination of poor workforce planning, poor retention of registrars (depleting the potential recruitment pool for specialists), and poor retention of specialists has led to across-the-board shortages, which are becoming increasingly entrenched.
A report prepared by the National Health Board says health workforce shortages overall are worsening, and are “a key threat to the health system’s ability to provide a full range of accessible, high-quality health services”. Maintaining 24/7 acute care is difficult in some areas. DHBs are “having to spread their resources thinly to maintain locally based services” and pressures are evident in some of the smaller centres’ tertiary and specialist services “due to demographic change, global workforce shortages and quality/safety concerns”. “Super-specialties” in some areas are also under pressure “largely due to low volumes and workforce shortages”.144
j Factors identified by delegates at the ASMS Annual Conference in 2008. These are broadly similar to those often quoted in international studies.

56
Table 4 indicates that New Zealand has been experiencing widespread medical specialist shortages since at least 2004 when the skills shortage lists were first published. In fact the lists include almost every medical specialty with an occupational classification in both 2004 and 2012 (the occupational classification system is now more specific in relation to medical specialties, hence the longer list in in 2012).
TAblE 4: ImmIGRATION NEW ZEAlAND SKIll SHORTAGE lISTS, 2004 AND 2012
2004/05 2012
Immediate Skills Shortage List
Surgeons
Physician
Obstetrician & Gynaecologist
Radiologist
Radiation Oncologist
Anaesthetist
Long-Term Skills Shortage
Anaesthetist
Radiologist
Intensive Care Specialist
Radiation Oncologist
Pathologist
Psychiatrist
Renal Medicine Specialist
General Surgeons
Immediate Skills Shortage List
Specialist Physician (General Medicine),
Cardiologist
Clinical Haematologist
Endocrinologist
Gastroenterologist
Neurologist
Paediatrician
Rheumatologist
Thoracic Medicine Specialist
Specialist Physicians not elsewhere classified*
Cardiothoracic Surgeon
Neurosurgeon
Orthopaedic Surgeon
Otorhinolaryngologist
Paediatric Surgeon
Plastic and Reconstructive Surgeon
Urologist
Vascular Surgeon
Dermatologist
Emergency Medicine Specialist
Ophthalmologist
Long-Term Skills Shortage
Anaesthetist
Radiologist
Intensive Care Specialist
Medical Oncologist
Radiation Oncologist
Obstetrician & Gynaecologist
Pathologist
Psychiatrist
Renal Medicine Specialist
Palliative Medicine Specialist
General Surgeons
Notes: Immigration New Zealand’s immediate skills shortage list is for “occupations that have an immediate shortage of highly skilled workers in New Zealand”. The long-term list “identifies those occupations where there is an absolute (sustained and ongoing) shortage of highly skilled workers both globally and throughout New Zealand”.
* Specialist physicians not elsewhere classified include specialists in rehabilitation, immunology, geriatric medicine, industrial medicine, palliative medicine, public health, sexual health and infection diseases.

THE PUBLIC HOSPITAL SPECIALIST WORKFORCE ASMS
57
“Dental specialists” is the sole category not on the lists, though this appears to be an oversight rather than a true reflection of the dental specialist workforce. Health Workforce New Zealand includes dentistry on its “Shortage specialties” list.145 While the proportion of DHB-employed dentists and dental specialists increased slightly between 2005 and 2009 in relation to the total dentist workforce (from 5.6% to 6.1% of the total workforce), it is in the context of a general shortage of dentists in most parts of New Zealand, with dentists included on the current Immediate Skills Shortage List.146, 147
Internationally, the size of the dentist workforce in New Zealand measures poorly against other comparable countries. A comparison of seven selected countries in 2004 shows New Zealand in last position in relation to the number of FTE dentists per 100,000 population. Iceland was top of the list with 93.6 FTEs/100,000, followed by Sweden (80.0), Japan (67.7), United States (58.7), United Kingdom (49.3), Australia (49.2) and New Zealand (42.4).148
Key issues
Key issues exacerbating specialist recruitment and retention pressures include:
• the changing composition of the workforce in terms of age and gender;
• clinician burnout; and
• increased use of the private sector.
Changing demographics in the specialist workforce
In 2010 the average age of New Zealand medical specialists was 50.
There is no information available on retirement rates of specialists. While the evidence suggests a good number of specialists continue working beyond the traditional retirement age, the number of specialists approaching retirement will be another influence on supply over the coming decades.
The ageing of the specialist workforce is illustrated in Figure 7, showing how the largest group of doctors has shifted from the 40-44 age group in 2001 to the 50-54 age group in 2010. In each year there is a sharp drop-off in numbers in the age groups above the peak age group. As the peak age group becomes older, the drop-off becomes more severe. Unpublished MCNZ data for 2010 shows there are 35% fewer doctors aged 55-59 than aged 50-54; and there are 26% fewer doctors aged 60-64 than aged 55-59. The number of doctors aged 60-64 is less than half the number aged 50-54.149
On recent trends approximately 19% of the workforce is likely to be lost over the next five years from the effects of the drop-off of specialists from the age 55.

58
When the SMO Commission examined these trends in 2009 it commented that owing to the lack of data “it is difficult to interpret what this means. It seems likely to reflect a loss of SMOs to the system through early retirement and emigration”.150
FIGURE 7: NUmbER OF SPECIAlISTS by AGE GROUP, 2001, 2004, 2007 & 2010
Source: MCNZ 2012.
Medical Council statistics also show the estimated average number of hours worked per week begins to fall as specialists get older. Within the next five years 12% of the specialist workforce will turn 60.
Notwithstanding questions of robustness of the “hours worked” datak, the ageing of the workforce appears to be contributing to an increase in the number of specialists working part-time. (Figure 8)
The increasing numbers of women in the workforce is another key factor.
k The 2011 MCNZ workforce survey figures for the average number of hours worked by doctors will have a significant margin of error, given the data is based on doctors’ estimates of hours worked in a “typical” week (including worked on-call hours), which can vary greatly, or the hours worked in the most recent week at the time of the survey.
800
700
600
500
400
300
200
100
0
30–34 35–39 40–44 45–49 50–54 55–59 60–64 65–69 70+
Age groups
2010200720042001

THE PUBLIC HOSPITAL SPECIALIST WORKFORCE ASMS
59
In 2011 women comprised 27% of the specialist workforce, compared with 19% in 2000 and 13% in 1990. Gender statistics for practising registrars indicate the proportion of female specialists will continue to increase. In 2011 52% of registrars were women.
Between 40% and 50% of vocational trainees were women in anaesthesia, internal medicine, occupational medicine, ophthalmology, otolaryngology surgery and psychiatry. Women outnumbered men in vocational training in: emergency medicine (51%), obstetrics and gynaecology (73%), paediatrics (69%), pathology (64%), public health medicine (68%), palliative medicine (71%), rehabilitation medicine (75%), rural hospital medicine (67%) and sexual health medicine (83%).151
Medical Council and Census data show women tend to work fewer hours than men. The working life contribution for female medical practitioners, when measured in total time worked, is about 80% of that of a male medical practitioner. This tendency of female medical practitioners to work fewer hours, combined with the increase in women in the medical workforce, results in a need to increase the overall numbers of medical practitioners to obtain the same number of full-time equivalents (FTEs).152
The female medical workforce is thought to have a greater preference than
Compiled from NZMC Workforce Survey data 2010
FIGURE 8: PROPORTION OF SPECIAlISTS PER AGE GROUP WORKING lESS THAN 40 HOURS PER WEEK
AS AT 2010
30–34 35–39 40–44 45–49 50–54 55–59 60–64 65–69 70+
80%
70
60
50
40
30
20
10
0
Age groups

60
males for both well-organised salaried employment and flexible part-time work. It is also commonly believed that female doctors have a greater interest in family and work-life balance. However, the Health Workforce Advisory Committee observed that lifestyle and work-life balance aspirations are changing throughout all working populations. “These new aspirations may be more characteristic of generation than gender.”153
In 2010 25.5% of doctors were recorded as working less than 40 hours compared with 22.9% in 2006.
Clinician burnout
While it appears more specialists are working part-time, many continue to work long hours. In 2010, 45% of the DHB specialist workforce are recorded as working 50 hours or more per week on average and 14% worked 60 hours or more.
Long working hours are contributing to significant staff burnout.
Prevalence studies of stress in New Zealand doctors in 2000 and 2001 found that around 10% of New Zealand general practitioners, physicians, and surgeons had symptoms consistent with significant psychological distress. A survey of New Zealand hospital doctors published in 2004 found nearly 30% of respondents suffered psychological distress, with 10% classified as severe. Most frequent stressful situations reported were associated with work demands, commonly found in other studies.154,155
A study involving 267 consultants from a wide range of specialties at Christchurch DHB in 2006/07 found one in five had symptoms of high burnout, with long work hours and low job satisfaction being key contributory factors. A quarter of the respondents reported working longer than 60 hours per week.156
Evidence suggests that burnout has major repercussions for patients and employers, including poorer perceived and real patient care along with higher staff turnover.157,158
A survey of senior doctors working in Britain’s National Health Service found less than a quarter of the respondents definitely intended to work in the NHS to normal retirement age; a reduction in workload or shorter working hours were reported to be the greatest inducement to stay until normal retirement age.159
Use of the private sector
The number of tax-funded surgical procedures provided in private hospitals (excluding ACC) increased from 1451 cases in 2005/06 to over 11,700 in 2011/12, when they accounted for over 8% of all of the elective operations that are funded by the DHBs.
A study involving 267 consultants from a wide range of specialties ... found one in five had symptoms of high burnout...

THE PUBLIC HOSPITAL SPECIALIST WORKFORCE ASMS
61
Outsourcing more elective services to the private sector has the potential to provide more timely services to patients. However, there are also downsides that could have a significant negative impact on the public system over time.
First, as commented in a Ministry of Health report: “In a number of DHBs, a critical mass with respect to volume of work is required to ensure clinical and financial viability. This includes the ability to provide both elective and acute services. The removal of services (in most cases lower acuity services) to alternative providers, may potentially compromise the viability of the DHBs…”160
Contracting more services out to the private sector could put even greater pressure on the public hospitals if health professionals simply shift from the public to the private sector in response to the increased demand. 161
At the same time, the demand for privately funded services is also increasing. In the year to June 2011 New Zealand’s largest health insurer, Southern Cross, funded 158,000 elective procedures, a 25% increase since 2006.162
The cumulative effects of these trends are most likely to exacerbate problems of recruitment and retention in the public sector.
The current state of the workforce in selected specialities/service areas
Surgery (across all specialties)
A study into New Zealand’s projected need for surgeons to 2026 estimates that to provide sufficient services to cover estimated need requires approximately 77 new surgeons a year.
The average number of new vocational registrations in surgical specialties for the last five years (2008-2012 inclusive) was 48.163
General surgery
An estimated 28 new general surgeons are required each year to meet New Zealand’s needs to 2026. The average number of new vocational registrations in general surgery for the last five years was 15.164 General surgeons are already on Immigration New Zealand’s “Long-term skill shortage list”.
Otolaryngology - head and neck surgery (ORL-HNS)
An estimated eight new otolaryngology surgeons are required each year to meet New Zealand’s needs to 2026. The average number of new vocational registrations in otolaryngology for the last five years was 5.6.165
Auckland DHB comments: “The population is ageing and demanding/needing more ORL surgery. Techniques and types of operations available are

62
also increasing. There is likely to be a significant shortage of ORL surgeons in Australia and New Zealand for the foreseeable future. The number of trainees should be increased, but the limiting factors [are] government funding for training posts and suitable training positions.”166
Cardiothoracic Surgery
An estimated three new cardiothoracic surgeons are required each year to meet New Zealand’s needs to 2026. The average number of new vocational registrations in cardiothoracic surgery for the last five years was 1.6.167
Orthopaedic Surgery
An estimated 25 new orthopaedic surgeons are required each year to meet New Zealand’s needs to 2026. The average number of new vocational registrations in orthopaedic surgery for the last five years was 13.168
Plastic and Reconstruction Surgery
An estimated five new plastic and reconstruction surgeons are required each year to meet New Zealand’s needs to 2026. The average number of new vocational registrations in plastic and reconstruction surgery for the last five years was 4.169
Urology
MCNC registration data show there are currently 57 urologists practising in New Zealand. Approximately 74 urologists are needed to match the recommended specialist surgeon to population ratio of 1:60,000.170
An estimated seven new urologists are required each year to meet New Zealand’s needs to 2026. The average number of new vocational registrations in urology for the last five years was 3.3 171
Neurosurgery
MCNC registration data show there are currently 21 neurosurgeons practising in New Zealand. Approximately 25 neurosurgeons are needed to match the recommended specialist surgeon to population ratio of 1:175,000.
An estimated two new neurosurgeons are required each year to meet New Zealand’s needs to 2026. The average number of new vocational registrations in neurosurgery for the last five years was 1.172
Paediatrics
The MCNZ medical register shows there are currently 312 active paediatricians in New Zealand, indicating a specialist to population (0-18 years) ratio of approximately 1:3200. However, overseas studies suggest the ideal ratio ranges from one paediatrician per 1200 to one paediatrician for every 2000 children.173

THE PUBLIC HOSPITAL SPECIALIST WORKFORCE ASMS
63
Radiology
RANZCR New Zealand Branch data indicates that of 178 radiologists produced by the New Zealand training programme since 1997, 48 (27%) are now overseas. If this trend continues, by 2020, instead of adding approximately 161 newly trained radiologists to the workforce, the real figure might be closer to 118.174
Oncology
According to the MCNZ there were 54 radiation oncologists working in New Zealand, down from 59 in 2009. The shortage of oncologists is due to:
• New Zealand’s growing and ageing population, which means increasing demand for oncologists to diagnose and treat cancer
• an ageing workforce – nearly a third of specialist doctors, including oncologists, are over 55 years old and due to retire in the next 10 years
• some oncologists moving overseas for better pay and working conditions
• a worldwide shortage of specialist doctors, including oncologists.
www.careers.govt.nz
Palliative Medicine
• There are major gaps in palliative care service provision.
• There are increasing referrals and increasing demand for hospital palliative care services due to an under-resourced community palliative care service.
• The recruitment and retention of palliative care medicine specialists in urban and provincial areas is a major issue.
• There are not enough doctors training to become palliative care medicine specialists.
Palliative Care Workforce Service Review175
Pathology
In 2001 the Clinical Training Agency reported: “The pathology workforce is under major stress. Two high-profile cases recently have highlighted the deficiency in the workforce, and there is pressure to address this as soon as possible.” 176
At the time there were 218 pathologists practising in New Zealand,177 which meant there was one pathologist per 18,000 population. The medical register in 2012 shows there are 213 specialists with a vocational registration in pathology, plus 37 specialists in other fields of medicine who have a second vocational registration in pathology. The total 250 translates to approximately the same pathologist-per-population ratio as in 2001.

64
Sexual Health
NZMC registration data show there are currently 19 sexual health medicine specialists practising in New Zealand. Overseas studies suggest a specialist to population ratio of 1:100,000 is needed,178 indicating New Zealand has less than a half of the required sexual health specialist workforce.
Emergency Medicine
Medical register shows there are currently 151 specialists practising in emergency medicine. In 2003 the New Zealand faculty of the Australasian College for Emergency Medicine estimated New Zealand needed a minimum of 180 specialists to achieve an acceptable standard of care.179
Intensive Care Medicine
In 2008, Auckland DHB commented:
“The current specialist to population ratio is far from adequate although the exact ratio depends on which part of the country is being considered. There are about 50 FTE intensive care specialists active in New Zealand at present, with up to 18 FTE more non-intensive care trained specialists also active in intensive care medicine. Almost all of this latter group are anaesthetic specialists who are practising (often cross cover) in peripheral centres because there is an insufficient number of qualified intensive care specialists available to fill these positions.180
In 2012 the medical register shows there are 48 specialists with a vocational registration in intensive care medicine (FTE unknown) plus 14 anaesthetists with intensive care medicine as a second vocational registration.
A report by the Australian and New Zealand Intensive Care Society shows New Zealand has only two-thirds the number of intensive care beds as Australia, proportionate to population. Patients admitted into New Zealand’s Intensive Care Units are more severely ill than those in Australia and mortality rates are higher. 181
Ophthalmology
The HWNZ “Eye Health Workforce” Service Review reports that in 2010 there were 119 ophthalmologists practising in New Zealand (of whom 19 worked solely in the private sector). The estimated current shortage is between four and 20 specialists and the forecast need (not accounting for the shortages) is an additional 33 by 2015. In other words, the ophthalmologist workforce needs to increase by between 37 and 53 specialists (31% - 46%) by 2015. At the same time there is a predicted shortfall of 120 ophthalmologists in Australia by 2015.182
Rehabilitation
There is no comprehensive rehabilitation service in New Zealand. The medical register indicates there are just 20 rehabilitation specialists currently in practice.
THE PUBLIC HOSPITAL SPECIALIST WORKFORCE ASMS
65
The current rehabilitation workforce faces issues of recruitment and retention at all levels; from the unregulated workforce of caregivers, through allied health professionals to rehabilitation medicine specialists. Training in rehabilitation is limited and uptake is not currently adequate to meet the needs of a comprehensive system.
Geriatricians, who have a rehabilitation component to their work, are often only available on a limited basis. There is currently only one specialist children’s rehabilitation centre in New Zealand: the Wilson Centre in the Waitemata DHB.
There is no pathway for training of paediatric registrars who may be interested in rehabilitation to become paediatric rehabilitation specialists in New Zealand as the rehabilitation service is not considered a priority in times of major junior staff shortages by local DHBs.
Rehab Service and Workforce Forecast, Final Report December 2011. HWNZ183
Stroke
There is currently no comprehensive stroke management system in place across DHBs. In December 2010, the Clinical Guidelines for Stroke Management recommended that:
• all DHBs should provide organised stroke services
• all people admitted to hospital with stroke should expect to be managed in a stroke unit by a team of health practitioners with expertise in stroke and rehabilitation.
Currently only 39% of New Zealand stroke patients are admitted to a stroke unit.
Aged care
There were 37 geriatricians employed by DHBs in September 2008. By 2026 there will need to be between 58 to 53 practising in acute hospitals.
Workforce for the Care of Older People. Phase 1 Report, February 2011 184
Anaesthesia
The New Zealand Anaesthesia workforce is currently severely stressed in some regions. It is likely to come under more stress as demand for anaesthetic resources increases over the next decade with a risk of service failure unless specific measures are taken to address this demand.
The two most significant causes of inadequate SMO manpower in the anaesthesia workforce are mal-distribution and mal-retention. Australia is currently our single biggest threat due to the huge salary disparities that exist. The somewhat intractable 35% salary gap that exists between the two countries in some sectors results in a steady loss of our most experienced senior doctors (Statistics NZ 2010). Resting on our laurels of lifestyle and scenery is insufficient of itself to arrest this attractive proposition.

66
There are two separate issues regarding anaesthesia resource to consider.
One is the potential difficulty in supplying anaesthesia and operating room (OR) resources to meet the increased demand for elective surgery and other procedures (which has been noted by HWNZ and many others). The other quite different issue is the potential difficulty in supplying sufficient anaesthesia resource to cover acute/urgent surgery (i.e. having adequate staff to maintain a good/safe on-call roster), which until now has received only limited examination. Recent recommendations to DHBs to increase permanent on-call anaesthetists in secondary obstetric units are in response to under-staffing and quality and safety issues. We have to be mindful of ‘not robbing Peter to pay Paul’ by ensuring sufficient resource is available in OR in all high demand acute areas.
Anaesthesia 20/20: HWNZ, March 2012 (edited)185
Psychiatry
According to the MCNZ, there were 642 psychiatrists practising in NewZealand in 2011, compared with 673 in 2008.186
While demand for specialist skills continues to rise there is a continuing trend of declining supply as interest in training in psychiatry has fallen from over 200 10 years ago to just over 100 places now. Our specialist workforce is ageing rapidly and we are dependent on imports to supply our needs. Approximately 25% of doctors practising as psychiatrists are not vocationally registered with the New Zealand Medical Council. It is likely that planned increases in Mental Health & Addiction funding and services in Australia will add pressure to the outflow of trained New Zealand doctors. Psychiatry provides the core of our specialist services and even as we continue to diversify our mental health workforce, we will need to find ways to both increase the supply and better utilise and leverage the capacity we have and retain them with attractive environments in which to practice.
Towards the Next Wave of Mental Health & Addiction Services and Capability Workforce Service Review Report 187
Gastroenterology
There are an estimated 50 FTE specialists currently delivering the gastroenterology service. However, there are vacancies around the country which need to be filled (the exact number is not clear) and an additional 10-15 FTEs is required by 2020 to meet the diagnostic needs of the population, undertake surveillance of increased risk groups and to meet colonoscopy screening requirements.
There is a significant recruitment and retention problem…which has reached crisis point especially affecting smaller centres. In the South Island alone there are unfilled full-time or part-time gastroenterology positions on the West Coast,

THE PUBLIC HOSPITAL SPECIALIST WORKFORCE ASMS
67
Timaru, Dunedin and Invercargill, and inadequate cover in Marlborough. This results in major inequities for patients in these areas who may now have little or no access to gastroenterology expertise.
High workload and long waiting times in the larger centres prevents gastroenterologists in these centres from providing services to the smaller centres. There are similar issues in the North Island. There are major differences between centres in numbers of colonoscopies performed per head of population, resulting in noticeable delayed cancer diagnosis in centres with less service provision.
Workforce implications for gastroenterology specialists, general physicians and general surgeons require retention and recruitment strategies alongside current training programmes.
HWNZ Gastroenterology Workforce Service Review (edited)188
Diabetes
New Zealand has just 0.35 FTE diabetes medical specialists per 100,000 population. No DHB has a diabetes specialist service that is at or above that recommended by the Federation of the Royal College of Physicians of the United Kingdom (1 FTE per 125,000 or 0.8 FTE per 100,000).
There are currently 14.5 FTE diabetes medical specialists practising in New Zealand; we require a further 19.4 FTEs to meet recommended numbers, plus additional FTEs as the population increases.
A persistent shortage of diabetes specialist physicians, especially in rural areas, will require attention to recruitment and retention, as well as to encouraging trainees into the speciality.
Diabetes Workforce Service Review, May 2011189

68
5 Health Funding and expenditure
New Zealand has long had a modest level of health spending on an international scale. In 2010 New Zealand’s total health expenditure per capita put it in 20th position among the OECD’s 34 countries.190 (Figure 9)
FIGURE 9: PER CAPITA HEAlTH ExPENDITURE IN OECD COUNTRIES, 2010
USANorway
SwitzerlandNetherlandsLuxembourg
DenmarkCanadaAustria
GermanyFrance
BelgiumSwedenIreland
AustraliaUK
IcelandOECD
FinlandSpainJapan
New ZealandItaly
GreecePortugalSlovenia
IsraelSlovak Rep
KoreaCzech Rep
HungaryPolandEstonia
ChileMexicoTurkey
* Purchasing Power Parity equalises the purchasing power of different currencies, taking into account the relative cost of living and inflation rates in different countries.
0 1000 2000 3000 4000 5000 6000 7000 8000 9000
US$ PPP* per capita
Source: OECD Health Data 2012

THE PUBLIC HOSPITAL SPECIALIST WORKFORCE ASMS
69
The Ministry of Health reports that Vote Health operational spending in 2009 dollars grew by 4.5% in 2009/10, then decreased by 1.6% in 2010/11, then increased by 2.7% in 2011/12, and 2.1% in 2012/13. “Though overall funding for the health sector has increased in 2011/12 and 2012/13, the rate of increase is much lower than in the past.”191
However, when allowance is made for ageing and the growth in demand for new services due to the availability of new treatments, as well as inflation and population growth, the most recent positive funding figures become negative. For example, the inflation-adjusted increase of 2.1% for Vote Health’s operation spending in 2012/13 is estimated to be an actual drop in funding of between $254 million and $290 million when all those factors are considered.192
TAblE 5: DISTRICT HEAlTH bOARD FUNDING 2007–2016
2006/7 2007/8 2008/9 2009/10 2010/11 2011/12 2012/13 2013/14 2014/15 2015/16
ACTUAl ACTUAl ACTUAl ACTUAl ACTUAl FORECAST FORECAST FORECAST FORECAST FORECAST
Payments to DHBs
8,547 9,312 10,038 10,670 11,133 11,503 12,057 11,992 11,982 11,956
Real (2006 $) 8,291 8,777 9,286 9,709 9,622 9,848 10,123 9,846 9,609 9,355
Real $ per population
1,961 2,056 2,152 2,223 2,184 2,221 2,258 2,173 2,097 2,020
% annual change
4.8 4.7 3.3 -1.8 1.7 1.7 -3.8 -3.5 -3.7
Sources: Budget Economic and Fiscal Update, The Treasury, May 2012 (Payments to DHBs); Statistics NZ (CPI rates); Economic Outlook, The Treasury, January 2012 (CPI forecast –to year ending March); Statistics NZ (population projections)
Further, Treasury data on DHB funding and forecast funding, when adjusted for inflation and population growth, indicate year-on-year decreases from 2013/14 to 2015/16 (Table 5).
A four-year budget plan submitted to the Treasury by the Director-General of Health in February 2011 reveals some of the details of the funding shortfalls. It is based on an assumed $350 million increase in Vote Health operating spending for 2012/13 (it was in fact $337 million) and describes how the Ministry of Health intends to address priorities for the health sector for the period 2012/13 to 2015/16, “while continuing to deliver significant reductions in real cost”.193
The reductions take into account decreases in DHB deficits, “cost and demographic pressures and other funding pressures that need to be met, such as Kiwi Saver, and the cost of meeting new priorities and challenges to the health
CPI Index June 2006 = 1,000
1,020 1,061 1,081 1,099 1,157 1,168 1,191 1,218 1,247 1,278

70
of New Zealanders”. They are described as “the amount of efficiency savings and reprioritisation required to manage” within operating budgets and have a cumulative effect totalling $376 million in 2012-13; $719 million in 2013-14; $1,087 million in 2014-15; and $1,514 million in 2015-16.
At the same time, the plan spells out expectations in performance improvements in a wide range of services, as indicated in Chapter 3 and as outlined in the Minister’s latest “Letters of Expectation” to DHBs (available on the ASMS website).
The Ministry is also targeting specific service areas via a series of reviews aimed at delivering “efficiencies” required for budget 2013 and 2014. The four initial areas are:
• child and maternity services
• mental health (total budget including DHB expenditure)
• public health services
• unplanned services (such as emergency services).
The plan is for each of these service areas to achieve 10% “savings” over four years.
As explained in the four-year plan, the belief in the do-more-for-less approach succeeding is based on the achievements to date, much of which is down to the efforts of clinical staff, and contradicts the Ministry’s claims of a decline in hospital productivity:
New Zealand’s total health expenditure per capita (public and private contributions combined for 2009) is less than the OECD average while delivering comparable results in many areas and significant improvements in others, such as reducing waiting times for elective surgery while maintaining access to services.
The system’s cost effectiveness is demonstrated by its outputs and outcomes continuing to improve, with reducing increases in new funding in recent years. DHBs in particular have continued to do more with less in increasing outputs and delivering new initiatives while reducing their net deficits by $139 million over the last three years from $155 million in 2008/09, down to $16 million in 2010/11.
We have avoided major service failure and the loss of public confidence that has typified some previous fiscal tightening in the sector. We have successfully managed unexpected events such as the Canterbury earthquake and the 2009 swine flu pandemic. …
Clinical involvement has … been essential in improving models of care and developing workforce capability.
Director-General of Health 2011194

THE PUBLIC HOSPITAL SPECIALIST WORKFORCE ASMS
71
But while hospitals are doing more, and doing so more efficiently, there have been costs. In 2010/11, news media reported cuts and deterioration in services in a large number of areas, including eye operations, services for mental health and addictions, community health services, public health, cancer treatment and diabetes services.195
The signs of further impending service retrenchment are emerging. In May 2012, the Waikato DHB wrote to staff about its concerns regarding $12 million savings needed for the 2012/13 financial year, and $19 million the following year, saying that it was likely to impact on staffing levels and salaries. Northland DHB has also warned of possible staff cuts. The Sunday Star Times has reported significant staffing shortages and shortages of equipment due to a freeze on spending at the Auckland DHB.196
Funding health services as an investment
While there appears to be general acceptance in New Zealand that the global economic downturn necessitates restraint in government spending, there is also a compelling argument presented by organisations such as the WHO and the OECD for ensuring that health spending decisions in the short term do not result in higher costs in the medium to long term.
“…short-term policy responses to crises have often had long-term consequences… Even a temporary easing of pressures on health spending may well come at a high price. Many of the short-term policies can result in reduced access to care, less equitable provision of services, less responsive care, poorer quality, and delayed access to desirable new technologies.”
Health System Priorities When Money Is Tight, OECD 2010197
Although the economic crisis puts policymakers under great pressure, safeguarding and improving healthcare is vital for long-term growth. With the right approaches, we can produce improvements and savings as well. The public, as well as Hippocrates, would approve.
Secretary-General of the OECD 2010198
These observations are especially pertinent to New Zealand, where the Government’s fiscal position was stronger than most other OECD countries when the recession hit in 2008.199
There is strong evidence from high-income countries that good health contributes to higher employment rates, less sick leave, higher productivity, and a lower probability of early retirement.
In June 2008 European members of the WHO met to discuss a new way of thinking about health systems, in particular a model of relations between health
There is a compelling argument ... for ensuring that health spending decisions in the short term do not result in higher costs in the medium to long term.

72
systems, health, and wealth, in which each can be mutually supportive.
Conference papers prepared by teams of researchers and economists show that wise, evidence-based health spending can play an important part in improving a country’s productivity and wealth – a message reinforced by OECD analysts in a paper prepared for OECD health ministers in October 2010.200, 201, 202
The question of whether health services make a meaningful contribution to population health (and, in turn, to the economy) has long been debated. However, with substantial changes in the scope of health care over recent decades that have enabled many previously lethal conditions to be cured, the question is no longer whether health care contributes to population health but by how much.203
OECD countries have achieved major gains in population health over recent decades… Economic growth and education are major factors behind this success story, but health systems deserve much credit, too. Indeed, recent OECD estimates suggest that possibly up to 40% of the increase in life expectancy since the early 1990s could be due to more and better health spending. …
A dramatic example over the past decade has been the better survival and lower disability rates after ischemic and haemorrhagic stroke, largely reflecting the impact of dedicated stroke units in hospitals.
Similarly, over the past five years, the number of people dying within 30 days after Acute Myocardial Infarction (AMI) has been reduced by a fifth, because of actions such as thrombolysis and early treatment with aspirin and beta-blockers.
Health System Priorities When Money Is Tight, OECD 2010
A Ministry of Health study shows that a third of our increase in life expectancy over recent times is a direct result of better health care, especially for diseases like stroke, diabetes, heart disease and certain cancers.204, 205
Research shows the economic value of increasing life expectancy can be considerable. One European Commission study shows the years of life gained that were attributable to health care in selected countries in the 1990s amounted to a positive economic return on health investment of up to 250%.206
A United States study on survival from heart attacks over a 14-year period found that every dollar spent on treatment produced an estimated health gain worth $7.207
The economic costs of not investing in health, on the other hand, are also considerable, as demonstrated in numerous cost-of-illness studies. One British study estimated the economic burden of coronary heart disease in Britain in 1999 was over seven billion pounds (almost 1% of Britain’s GDP in that year). Only a quarter of that cost was for public health services, the rest – the less

THE PUBLIC HOSPITAL SPECIALIST WORKFORCE ASMS
73
visible costs – were for informal care and lost productivity.208
Government decisions to cut services do not eliminate the cost of illness or injury. That cost is simply shifted to the community, where it is carried by individuals, families, employers and other social services – and ultimately the economy.
A countervailing argument for investment in health services is that by enabling people to live longer we increase the burden on health services. But evidence is emerging in a number of countries showing older people are healthier than ever, partly because of healthier lifestyles and partly due to improved health care.209
The WHO has found that, as health expenditure per capita increases, not only does life expectancy increase but the number of years of healthy life (ie illness and injury free) also increases – and often at a greater rate.
The jury is still out on whether that is happening here, because New Zealand has not been gathering robust data long enough to say so with any certainty. Nevertheless, the early signs have been promising. Ministry of Health figures show that “healthy life expectancy” at birth began to increase from 2001 at a greater rate than total life expectancy; and the 2006 New Zealand Disability Survey shows (cautiously) that from 2001 to 2006 self-reported disability fell by 8% for New Zealanders aged 65 and over.210
It has been estimated that even small improvements in health (a decline in disability rates of 0.5% per year across all age groups in New Zealand) could offset about one-third of projected extra health care costs resulting from population ageing. Faster declines would produce a larger offset.211
The European countries debating these issues have agreed the evidence supports a new approach to health policy, where health is viewed as a key investment in wealth rather than a drain on it. This is reflected in the EU’s “Lisbon Strategy” which includes “Healthy Life Years” as indicators of progress towards its aims of increasing economic competitiveness and social cohesion.
The Secretary-General of the OECD, Angel Gurria, says the economic crisis “should not be allowed to erode our hard-won achievements” and points to actions that policymakers should focus on to make health more affordable and effective in addressing present and future challenges:
Two fronts stand out which, if tackled, would bear near-certain fruit. First, quality could be improved: evidence shows that better services lead to shorter treatments and healthier outcomes. Policy should shift the emphasis from volume to quality, by realigning pay incentives for hospitals, doctors and nurses, for instance. Better quality can also save money by avoiding unnecessary procedures,
74
not to mention some costly mistakes. The Institute of Medicine in the US once estimated that medical error kills more people than traffic accidents.
Secondly, greater emphasis must be placed on prevention. Obesity provides a good example. In 1980, one person in ten was obese across the OECD. Today, in half of the OECD countries, every second person is obese or overweight…
Secretary-General of the OECD 2010212
An OECD paper examining broader policy responses to the economic crisis urges governments to invest in innovation to strengthen the medium and long-term potential of the economy. “Some of these may add to demand in the short term, but most are more likely to offer benefits in the longer term.”213
Conclusion
Health services have been providing more services while real funding, when all costs are included, has been decreasing. The Government has signalled that this will continue as further cuts are planned while new services targets are introduced. International evidence shows short-term policy responses often lead to higher long-term costs, both in terms of health care and the broader economy, and supports investing in improving the cost-effectiveness of services for long-term gains.

THE PUBLIC HOSPITAL SPECIALIST WORKFORCE ASMS
75
6 Government’s response to addressing specialist workforce shortages
“Number one priority”
The Government has acknowledged the seriousness of New Zealand’s medical workforce shortages. Health Minister Tony Ryall said in October 2010: “We have a workforce crisis in New Zealand because we need to retain more of our hospital specialists…” He called it his “number one priority” in health.214
Since then there has been no discernible improvement. Specialist numbers have increased, but at no greater rate than prior to 2010, which has proved to be inadequate because it has led to the current crisis. The growth rate is also well short of a modest target agreed with the DHBs in the 2010 The Business Case. In fact the workforce trends for specialists (and other doctors) may look better than they really are, given the increasing dependence on IMGs, many of whom – as the MCNZ has noted – are here for short stays only.
Getting the measure of the crisis?
The lack of reliable information on the use of locums was one of the frustrations expressed by the 2009 SMO Commission, which reported “serious data inadequacy” concerning the state of the specialist workforce. “This is symptomatic of the lack of accountability and priority for workforce planning and management, which is even more remarkable given that the health system is a particularly labour-dependent industry.”215
We believe work needs to commence urgently to identify core information requirements, and establish systematic, routine, regular, simple, robust and appropriate ways of collecting, analysing and reporting that information. The need for purpose-specific research also needs to be explored, together with the placement of data in the public domain to enable independent research and analysis, while still protecting the privacy of individual SMOs.
SMO Commission, 2009216
Notwithstanding that the Government accepted the Commission’s recommendations, for the Government to act on its priority to address workforce shortages, one would expect to see, as a first step, progress made in collecting, analysing and publishing the relevant data to guide workforce planning. However, the situation faced by the Commission in 2009 remains virtually unchanged today.

76
Developing clinical leadership
The Government has given strong emphasis to developing clinical leadership, in part to help address workforce issues.
Clinical leadership and engagement is a central feature of the Government’s plans to foster clinical networks. Clinical networks can help in meeting the challenges of having a thinly spread specialist workforce in “vulnerable health services” such as paediatric oncology, clinical genetics and major burns.
Clinical leadership is also promoted as a way of retaining clinicians in the workforce. Better clinical engagement will improve quality and job satisfaction.
In fact there is a wealth of international research showing we would get much more out of our scarce health dollars by empowering clinicians to make the decisions on how services are delivered, organised and planned. The Health Minister has acknowledged that “Globally, clinical leadership is recognised as a fundamental driver of a better health service.”
Citing research by global management consultants McKinsey as an example, the Minister has drawn attention to evidence of a clear link between strong clinical leadership and hospital performance. “The researchers found that best practice operational approaches in hospitals had a positive impact on productivity, infection rates, readmission rates, patients and finance…Stronger and more direct clinician involvement means more service and better quality.”
McKinsey, in a paper entitled “When clinicians lead”, provides a specific example as to why clinical leadership is so important.217,218
“Consider the case of Kaiser Permanente… [a large health service provider in the United States]. In the late 1990s, Kaiser Permanente Colorado was struggling with worsening clinical and financial performance and losing top doctors to private practice and rival organisations. A new executive medical director — Jack Cochran, a paediatric plastic surgeon — made clinical leadership an explicit force for improving outcomes for patients. Within five years, Colorado had become Kaiser’s highest-performing affiliate on quality of care and a beacon of quality within US health care. Patients were significantly more satisfied, staff turnover fell dramatically, and net income rose from zero to $87 million.”
The paper concluded that, “Improvements happened because clinicians (most notably doctors) played an integral part in shaping clinical services.”
“We have a workforce crisis in New Zealand because we need to retain more of our hospital specialists… [it is the] number one priority...’’
Q&A, TVNZ, 3 October 2010

THE PUBLIC HOSPITAL SPECIALIST WORKFORCE ASMS
77
It is for these reasons that the New Zealand Government has given strong emphasis to developing clinical leadership across our health system.
The SMO Commission recommended that DHBs and the Ministry of Health develop effective clinical leadership and participation, and that DHBs initiate and monitor an ongoing programme of specialist leadership development. This was endorsed by the Minister.
The Ministerial Review Group (MRG), which was set up in 2009 to recommend how New Zealand might improve the quality and performance of the public health system, made a number of recommendations to reinforce the development of clinical leadership, including that DHBs should ensure that formal clinical leadership roles are recognised by the allocation of sessional time during the working week to enable clinical leaders to fulfil their duties. Those recommendations were endorsed by the Government.219
Not least, the Minister has endorsed In Good Hands220 and instructed DHBs to use it as a guide to implement clinical leadership. Clinical leadership in this context is much more comprehensive than formal positions of clinical leadership such as chief medical advisers and clinical directors. It is inclusive of wider clinical engagement that potentially involves all or most senior medical and dental officers. The document calls for comprehensive clinician leadership at all levels of DHBs, including devolving decision-making as much as practical to the level of the work unit or department. It says clinical leadership must include the whole spectrum from inherent (eg, surgery, clinic, bedside, theatre relationships) through peer-elect (eg practice, ward, department arrangements) to clinician-management appointment (eg clinical directors, clinical board).
Effective clinical leadership, which involves all specialists as well as the formal leadership positions, requires additional specialist time to put it into practice.
However, in 2010 a national survey of ASMS members on the application of clinical leadership in DHBs found a mere 20% of respondents believed they have enough time to engage in clinical leadership activities or development programmes. Not surprisingly, when DHBs’ clinical leadership application was assessed in a Clinical Governance Development Index (CGDI), none achieved even a 50% markl despite, in some cases, strong support for developing clinical leadership from senior management.221, 222
That only one in five specialists have time for clinical leadership beyond their normal clinical duties is significant further evidence of the effects of the specialist workforce crisis.
A subsequent survey on clinical leadership, conducted in May/June 2012,
l Based on responses to seven survey questions.
Q&A, TVNZ, 3 October 2010

78
involved the whole health professional workforce in public hospitals but included a comparison with the earlier survey, based on responses to six questions from each survey, using only SMO responses from the 2012 survey. The SMO response rate is estimated at around 35%, compared with 52% for the initial survey. Notwithstanding the poor response rate, the latest survey suggests improvements in some aspects of clinical leadership, such as awareness of the principles of clinical leadership and better support from management, but the overall result from SMO responses remains mediocre – a mean 54% mark across all DHBsm based on the CGDI, assessed from the six selected survey questions.
Furthermore, while the perceived improvements in awareness and attitudes towards clinical leadership are steps in the right direction, the capacity to put good intentions into practice remains in question. A question on adequate time for clinical leadership was not included in the latest survey but anecdotal reports suggest this has not changed since the ASMS-member survey.
Health Workforce New Zealand
Health Workforce New Zealand (HWNZ) was set up in 2009 to provide national leadership on the planning and development of the country’s health and disability workforce. It’s Executive Chair, Professor Des Gorman, referring to the increases and planned increases in medical school intakes, wrote in an NZMJ editorial last year that unless there is a significant improvement in retention, almost none of the training schemes will deliver the number of medical practitioners that have been forecast to be needed by 2021.
Putting aside productivity and the issues of a workforce that is increasingly feminised and part-time, the key issues that are germane to the number of doctors in our workforce are recruitment, migration and retirement, and all three require address.
D Gorman, NZMJ 2011223
“A range of alternative strategies then need to be, and progressively are being, put in place,” including “task substitution and role diversity for the medical profession”, bonding schemes and clinician-led service reviews.224 These strategies feature in HWNZ’s work.
The Voluntary Bonding Scheme, overseen by HWNZ, helps to pay off student loans for newly graduated doctors and other health professionals who agree to work in hard-to-staff areas, and later hard-to-staff specialties, for three to five
m Excluding Canterbury DHB.

THE PUBLIC HOSPITAL SPECIALIST WORKFORCE ASMS
79
years. In 2012 43 doctors had registered interest in the scheme, though no figures are readily available on the actual uptake.225 The Advanced Trainee Fellowship Scheme supports trainees (up to 25 each year) who, on completion of their training, are committed to return to work in an appropriate medical specialist position or a hard-to-staff post for at least two years.
To date HWNZ has published 10 clinician-led service reviews (now called “forecasts”). The reviewers/forecasters were tasked with thinking innovatively to develop a vision of their particular service and workforce for 2020 in the context of a doubling of service demand but only a 30%-40% increase in funding and constraints on the availability of professional skills.
HWNZ reports on its website:
Some clear themes have emerged from the forecasts [reviews]. They recommend:
• making better use of the existing health workforce, from untrained workers to highly specialist, by developing new roles and extending existing roles to make best use of the skills of all members of the health care team
• a focus on prevention, rehabilitation and self-care to underpin a shift of resources from hospital to community.
• better use of the potential of IT, including telemedicine
• development of regional clinical networks to make best use of resources and ensure provision of services to all communities.226
The reviews/forecasts also expressed clear concerns about specialist workforce shortages and recruitment and retention problems, not acknowledged by HWNZ, which are included in this paper in the summary of selected specialties and service areas (Chapter 4).
It is unclear how – or if – the recommendations made by the clinician reviewers are to be transferred into action. The process set out by HWNZ includes a trail that leads via the HWNZ board to “future modelling”, then to “economic impacts”, to “sector partners”, to “DHB partners”, to “sector modelling”, to “prioritisation of demonstration projects” and eventually back to the HWNZ board for “decisions on training intentions” and “policy”, “regulation” and “innovation”.227
HWNZ’s “Workforce Innovation Programme” explores the development of new and extended workforce roles, new and extended scopes of practice and new models of care. Though earlier, Professor Gorman co-authored a paper commenting:

80
We… suggest a cautious response to recommendations to address medical shortages by retraining nurses or other health workers, given that there are current and predicted shortages in almost all health disciplines
D Gorman and .P Brooks, MJA, 2010228
A project had been planned earlier this year to test the role of “nurse endoscopist” in New Zealand. However, the recruitment of a suitably qualified nurse endoscopist from the United Kingdom was not successful. An evaluation of a project piloting the use of physician assistants, released earlier this year, raised more questions than it answered, as reported in The Specialist in June.229 The evaluation report of the project was also roundly criticised by the New Zealand Nurses Organisation:
…The Report is wanting in several ways: it is methodologically flawed, factually incorrect in places, deficient in data sources, and demonstrates both poor understanding of the health workforce context in Aotearoa, and faulty logic in the sweeping conclusions it draws. As such it would be neither wise nor safe to act on its recommendations.
NZNO, 2012 230
HWNZ has since acknowledged the physician assistant pilot “had limitations”. It is now planning further pilots in rural hospital and primary care settings, which are due to begin early this year.231
Other HWNZ projects include “non-surgical orthopaedic physicians” and “registered nurse first surgical assistants”.
Extending the roles of non-specialists into specialist practice was a topic included in a discussion paper produced by the Gastroenterology Society. It raises some issues of relevance across other specialties:
In the Society’s view non-specialists – ie, endoscopic nurses – could undertake some procedures but these would be small in volume and mainly limited to routine gastroscopy. In the United Kingdom it is estimated that nurses perform approximately 20% of endoscopy. When considering New Zealand’s small population/low volumes it would appear that endoscopic nurses would not be appropriate in the New Zealand environment. There is a need to increase the number of colonoscopies undertaken in New Zealand. However, this not a procedure that the non-specialists can undertake without significant training – ie at least 3-5 years.
In order to deliver these services the non-specialist workforce would need to be trained and supervised... Depending on the procedures undertaken the non-specialist would need to train for a minimum of 12 months (to deliver routine gastroscopy) to five years (to undertake colonoscopy screening)…
D Gorman and P brooks: ‘‘We suggest a cautious response to recommendations to address medical shortages by retraining nurses or other health workers, given... predicted short-ages in almost all health disciplines’’

THE PUBLIC HOSPITAL SPECIALIST WORKFORCE ASMS
81
If non-specialists are to make a valuable contribution to the health workforce then they must be adequately supervised. Supervision would be provided by specialists and these activities would place yet another level requirement on the SMOs’ limited time. As some of these procedures would require supervision by experienced trainers in endoscopy this may place restrictions on training opportunities for gastroenterology registrars and surgical registrars.232
Gastroenterology Society of New Zealand
HWNZ has also overseen the establishment of a New Zealand Centre of Excellence in Health Care Leadership at the University of Auckland, which will “draw on existing initiatives to establish programmes for clinical, managerial and executive leadership at all levels”.233
The centre was set up following an HWNZ clinical leadership forum in June 2010. Key messages from the forum included:
HWNZ should lead development of a strategy for national leadership, one all parts of the sector can contribute to.
A national approach must be inclusive – multidisciplinary, targeted at all levels and all organisations – with co-ordination and shared learning across professional bodies, education and employers. We need to create a pathway for leadership development from novice to expert and invest in the many not the few.
The initiative needs investment and there is an urgent need and expectation for action. This must not become the ‘51st report’.
HWNZ Clinical Leadership Forum, June 2010
The centre will “coordinate existing programmes…commission future programmes, advise on curriculum development and oversee research and evaluation in leadership”. Progress will be evaluated after two years (ie, due by June 2012).234 As at November 2012, an evaluation had yet to be published.
The potential for evidence-based initiatives to improve access and free up time for specialists to do other work is reason alone for them to be supported and developed. However, the evidence from local and international studies to date suggests any impact they may have on mitigating future demand for specialists may be, at best, marginal.
On the other hand, there is compelling evidence, as discussed in this paper and The Business Case, for developing successful innovative models featuring comprehensive clinical leadership.235

82
7 The current path…
The consequences of specialist shortages are far-reaching, with a considerable effect on the efficiency and effectiveness of public hospital services, but they go largely unnoticed by the general public, in part because the shortages are so entrenched. Continuing shortages appear to have become a “norm” for many public hospital departments. That only a fifth of specialists have indicated they have enough time to engage in clinical leadership activities is symptomatic of a wider issue of clinical workloads overflowing into specialists’ non-clinical time.
Anecdotal evidence suggests the incursion of clinical duties into non-clinical time and the apparently heavy use of locums to fill at least some of the gaps temporarily have in effect become a buffer that have saved many services from becoming dysfunctional. There are of course consequences – and the longer these situations continue, the greater the consequences.
In the meantime, success in our health system is tending to focus on outputs – more and quicker – rather than outcomes that give an indication of the effectiveness of the services and its value. DHBs may hit the target but miss the point. One indication of that is the increasing number of unplanned readmissions into acute hospitals since 2008.
Similarly, the monitoring and reporting of specialist workforce trends – and the effects of those trends – are inadequate or non-existent. Much of what we need to know to enable a robust assessment of the state of our health services, and specialist services in particular, is not available. But again there are signs that ought to be ringing warning bells for our policy-makers. Three key indicators are:
1 Recruitment: More specialists are entering the workforce but well short of the numbers needed – and agreed with DHBs – to enable safe and sustainable services. Each year, with every shortfall, the workforce deficit grows.
2 Migration: Retention of our new specialists and potential future specialists is getting worse, especially among IMG doctors.
3 Retirement: On current trends, in the next five years an estimated 19% of the specialist workforce could be lost due to a drop-off of doctors from the age of 55.
If these three issues in particular are not urgently addressed there is a high risk of a spiralling effect rendering many services unviable. The consequences
Success in our health system is tending to focus on outputs – more and quicker – rather than outcomes... DHbs may hit the target but miss the point.

THE PUBLIC HOSPITAL SPECIALIST WORKFORCE ASMS
83
were summarised in the 2010 The Business Case and they are equally, if not more relevant today. In summary:236
• The heavy dependence on IMGs will increase, escalating the high turnover of senior medical staff and increasing the current level of wasteful expenditure by DHBs.
• New Zealand’s health workforce (and therefore services) will remain vulnerable to the effects of the competitive overseas market. The impact on provincial DHBs and specialties where staff are already hard to find will become increasingly noticeable.
• Continued and increasing heavy reliance on locums will be seen, along with the associated increased costs, with a continuing loss of continuity of services and mounting pressures on permanent staff. High dependency on locums also undermines the quality of training and supervision, and the development of clinical leadership, multidisciplinary teams and clinical networks.
• Continued shortages of SMOs will nullify efforts to reduce adverse events. With preventable events estimated to cost $590 million a year, an opportunity to improve safety and quality while creating savings will be lost. In fact, an increase in adverse events may be seen in some areas.
• Some of the Government’s key health targets will not be achieved on a sustainable basis as they depend on an adequate supply of specialists across the whole range of specialties, and government objectives will be compromised.
• The proportional imbalance within the medical workforce will continue, with insufficient numbers of specialists to train and supervise RMOs. This will compound expectations and job stress for specialists and mean less training for RMOs. Job satisfaction will suffer further and continue to adversely affect recruitment and retention of specialists and potentially RMOs.
• Specialists and RMOs will continue to be lost to overseas competitors.
• Increased medical school intakes will have no appreciable impact as graduates will depart the country because of poor training and as they observe senior doctors in New Zealand struggling to meet both clinical and leadership demands, resulting in potentially substantial financial losses.
• New Zealand will continue to be the unsolicited training ground for other countries.
• Understaffing will mean some services will not be clinically and financially viable, and many others will struggle to meet increased demands efficiently, effectively and safely.
• Efforts to develop a generalist specialist workforce, which require an adequate supply of New Zealand trainers and trainees, will be jeopardised.

84
• Unnecessary extra effort will be required in order to improve services to substitute for an inadequate level of expertise and human capital.
• Lack of specialist time outside of clinical duties will prevent the establishment of comprehensive clinical leadership. This will hinder development of multidisciplinary clinical networks, deter reconfiguring services with a more regional focus, inhibit creation of more innovative ways to deliver services, and prevent integration of hospital and community based services. The considerable potential for improved cost-effectiveness and service performance, as indicated in overseas research, will be lost, and the counterfactual of slow, inefficient services will ensue.237,238

THE PUBLIC HOSPITAL SPECIALIST WORKFORCE ASMS
85
8 What needs to happen
The significant challenges facing our health system are well documented and well known. The Government has called for changes in the way services are delivered to ensure our services are able to meet those challenges. At the same time it is reducing health funding in real terms and expecting DHBs to make considerable “efficiencies” to stay within budget.
In a financially and resource-strapped system, the risk of making short-term decisions with long-term detrimental clinical and financial consequences is high. To prevent this and to ensure robust quality decision-making, there needs to be extensive involvement and engagement of specialists.
There is now a strong body of evidence showing comprehensive clinical leadership can achieve what New Zealand’s successive attempts at health reform have failed to achieve: significantly improve the effectiveness and efficiency of our public hospitals across the whole spectrum of services (not just the selected few targeted by Government) while managing the increasing costs of health care.
Indeed, given the health indicators for the coming decade, the ability of our health system to meet the growing demands may well rest on the extent to which comprehensive clinical leadership is established in practice.
Quite simply, the reforms we need are only likely to be successful if clinically led.
– D Gorman, Executive Chair, HWNZ239
Successful clinical governance, as envisaged by the Government’s In Good Hands policy statement and by the Time for Quality agreement between the ASMS and the country’s DHBs requires distributive leadership, embedded at every level of the system.
Clinical leadership must include the whole spectrum from inherent (eg surgery, clinic, bedside, theatre relationships) through peer-elect (eg practice, ward, department arrangements) to clinician-management appointment (eg clinical directors, clinical board).
– In Good Hands, ASMS & DHBs240
There is now a strong body of evidence showing comprehensive clinical leadership can achieve what New Zealand’s successive attempts at health reform have failed to achieve...

86
Clinical leadership means the entire clinical team of staff is actively engaged with the task of improving patient safety and outcomes. Clinical leadership will enable this engagement and facilitate high morale in a collaborative team environment.
Where particular actions are identified as achieving positive clinical indicators, these should be addressed with haste. Clinical leadership will see the necessary culture change implemented to facilitate these outcomes.
The Time for Quality Agreement sets out the parameters of the partnership between managers and SMOs. The latter are expected to provide the leadership in service design, configuration and best practice service delivery driven by the parties’ commitment to good quality outcomes for patients.241
The Business Case outlines some of the many specific benefits of comprehensive clinical leadership, including:
• Effective and efficient development of new innovative service models
• Quality training and supervision
• Sustainable achievement of government health targets
• Improved safety and quality of services and outcomes
Requirements for progress
The Ministerial Review Group recommendations to reinforce the development of clinical leadership (endorsed by the Government), include that:
a Clinical leaders have a recognised allocation of time for the role
b A programme of cultural change is developed to enhance clinical leadership
c Resources are available to develop leadership skills as part of professional development programmes.
Priority must be given to seeing these recommendations put into action. For this to succeed in any meaningful way, financial investment is needed to develop the capacity of the specialist workforce to enable “time for quality”, as envisioned in The Business Case agreed between DHBs and the ASMS.
This requires, as a matter of urgency, improved specialist recruitment and retention measures.

THE PUBLIC HOSPITAL SPECIALIST WORKFORCE ASMS
87
Appendix 1
Hospital productivity measurements
The Ministry of Health publishes its version of hospital productivity measures in its annual reports. The two charts below are based on those published in the annual report for 2011 (the vertical index values in the Ministry’s published charts begin at 85 and 90 respectively, so the trends appear more severe).
DOCTOR AND NURSE PRODUCTIVITy IN DHb PROVIDER ARmS (mEDICAl AND SURGICAl)
Indexed growth compared with 2003/04 base period = 100
A footnote with the chart states: Inputs are counts of notional FTE medical and nursing employees, including estimated locums and bureau nurses (although such roles do not affect the total FTE count), working within medical and surgical services in DHB provider arms. Outputs are medical and surgical inpatient case-weighted discharges added to outpatient and emergency department volumes of price-weighted attendances. Outputs relate to public hospitals only.
160
140
120
100
80
60
40
20
0
2003/04 04/05 05/06 06/07 07/08 08/09 09/10
Dr and nurse labour inputs (FTEs)Medical and surgical outputsProductivity (outputs per FTE)

88
160
140
120
100
80
60
40
20
0
2003/04 04/05 05/06 06/07 07/08 08/09 09/10
Accompanying text also explains: “The number of medical personnel FTEs grew by 15% in 2006/07, compared with 5% annual growth in the preceding two years. This increase partly reflects the fact that a new definition of FTE was adopted in July 2006… (from 1 July 2006 medical and nursing DHB FTE figures have been derived on an accruals basis using total number of hours worked monthly [including overtime] divided by 40 hours. Prior to 1 July 2006 there was not a standardised method of reporting staff numbers by DHBs, so that FTE data after 1 July 2006 is not directly comparable to previous years, particularly for medical personnel).”
Text accompanying the second chart state: “The Ministry of Health’s measure of hospital productivity described above is constructed using centrally collected data and is intended to assess sector-wide trends. The trends should be interpreted with caution due to measurement difficulties.”
DOCTOR AND NURSE EFFICIENCy AND COSTS (2010 DOllARS) IN DHb PROVIDER ARmS
(mEDICAl AND SURGICAl)
Indexed growth compared with 2003/04 base period = 100
Dr and nurse labour input costs ($2010)Cost per output (real $2010)Medical and Surgical outputs

THE PUBLIC HOSPITAL SPECIALIST WORKFORCE ASMS
89
A footnote with the chart states: Labour costs are medical and nursing personnel direct costs for salaried staff added to outsourced medical and nursing costs (outsourced costs are higher than permanent FTE cost). Costs relate to doctors and nurses working within medical and surgical services in DHB provider arms. Outputs are medical and surgical inpatient case-weighted discharges added to outpatient and emergency department volumes of price-weighted attendances. Outputs relate to public hospitals only.
The Ministry of Health’s 2012 Annual Report included only a single chart (an updated version of the first chart above), which shows a slight (0.7%) increase in “productivity” between 2009/10 and 2010/11.
How sound is the measure?
The Ministry’s measure covers only a part of the health system (hospitals), and only part of the hospital service (medical and surgical) and only a part of medical and surgical services (the size and cost of medical and nursing personnel). It is in effect a measurement made within a silo, within a silo, within a silo, and totals an estimated 27% of DHB provider costs.
An unpublished Ministry of Health document242 explaining the methodology used to assess hospital productivity concedes some obvious limitations:
• The exclusion of services such as primary care, disability support services, mental health services, community care services and services provided in the aged care sector.
• The exclusion of DHB provider arm activity outside of medical and surgical services such as the work of allied health professionals like physiotherapists, nor personnel costs or FTEs for non-medical and nursing staff. The model therefore does not measure the effect of one of the Government’s high-profile policies of moving “backroom” resources to the “front line.”
• The exclusion of consumables, capital, and overheads.
• The exclusion of measures showing changes in quality of health services.
• The inability to measure the value of benefits and outcomes from health care intervention for each type of patient activity.
Leaving aside all the measures that are not used, the document reveals a number of weaknesses in the methodology which raise significant questions about the accuracy of the measures that are used.

90
The FTE count
The size of the medical and nursing workforce in medical and surgical services has been based on a high-level FTE count combining medical and nursing personnel from the former District Health Board New Zealand’s Health Workforce Information Programme (HWIP). As discussed in a number of earlier ASMS papers, the HWIP data is unreliable. In the four quarters to March 2010, for example, HWIP’s SMO headcount and FTE count fluctuate wildly, including a difference of nearly 400 SMOs (and nearly 300 FTEs) between the first and second quarters. The HWIP data are also substantially different from DHB payroll data – a difference which DHBNZ was unable to explain during the ASMS-DHB collaboration on the 2010 The Business Case. More recent and upgraded HWIP data243 continue to be at variance with payroll data.
To quantify the nursing and medical workforce, permanent nursing personnel and medical personnel of all levels are lumped together in a single FTE count. An estimated number of locums and bureau nurses are added, based on the costs of outsourced staff costs divided by average salaries for medical and surgical personnel. This will overstate the number of FTEs, as outsourced staff receive higher pay rates than salaried staff.
The Ministry’s Annual Report 2011 describes these FTE counts as “notional”.
The ED & Outpatient activity measurements
The measurement for Emergency Department and Outpatients activity “relates to DHB planning volumes and prices and not to the actual out-turn of volumes and prices” [Ministry’s emphasis].244 Any actual improvement in productivity and efficiency, therefore (eg providing greater volumes than planned and/or reducing costs) would not be measured.
In order to convert ED and Outpatient activities into a common currency with inpatient activity, ED/Outpatient volumes were converted to Case Weighted Discharge Equivalents (CWDEs) using a ratio of ED/Outpatient purchase unit prices to the average inpatient price. However, because inpatient prices have increased more than ED/Outpatient prices, using the average inpatient price to convert outpatient/ED dollars to CWDEs led to an apparent Outpatient/ED decline in activity when activity was actually increasing. For example, the formula produced a 9% decline in ED/Outpatient activity in 2007/08, but “price weighted volumes” for ED/Outpatients over the same period grew by 8%.

THE PUBLIC HOSPITAL SPECIALIST WORKFORCE ASMS
91
In 2009 the formula was refined but, owing to data inadequacies, this “required a significant amount of data manipulation and cleaning to produce a consistent volume trend over the period analysed”. Whether this refinement and data manipulation addressed the earlier understating of ED/Outpatient activity is not stated, however.
Inconsistencies in DHB data has also meant that some ED and Outpatient attendances have been excluded, including more than 6% of ED attendances in 2001/02 rising to more than 8% in 2007/08.
Inpatient measurements
Up until 2008/09 the cost of inpatient activity was calculated using the sum of all case-weighted discharges based on Victorian hospital cost data. In 2008/09 a new set of cost weights were applied, using New Zealand hospital cost data. A data “smoothing concept” was implemented “to mitigate the impact of large cost weight swings from the previous set of Victorian… based cost weights used in prior funding years”.
Measuring value
The stated primary reason for measuring a part of hospital “productivity” is to assess services in terms of the “value for money” being achieved.245, 246 Yet the measurement being used omits any assessment of the value of the services being provided.
As Britain’s National Health Service Confederation put it in 2006:
Productivity should start with the quality of patient care, what patients value and what represents improvement in the health of the population. This means that measures that do not incorporate quality of outcomes, the quality of the patients’ experiences, the idea of prevention and well-being are missing a very important part of the story.
Our current measures focus on outputs rather than outcomes. For example, hip replacements are currently measured by the number so that the more hip replacements we do the more productive the NHS is rated. Yet for the patient, measures such as how mobile the patient becomes after the operation, how much the pain has reduced, whether they have had any additional infections or how much longer the replacement has improved their life as a result of the procedure are much better indicators of success.
NHS Confederation 2006 247

92
Aside from the health and social benefits of health service interventions, good health has a significant impact on a country’s economic productivity:
People in poor health are less likely to work and, when in work, are less productive. They are less likely to invest in their own education or to save for retirement, and so to support the wider economy. The economic position of countries today owes much to the extent to which they were able to achieve better health historically.
WHO 2008 248
The question of whether health services make a meaningful contribution to population health (and, in turn, to the economy) has long been debated. However, with substantial changes in the scope of health care over recent decades that have enabled many previously fatal conditions to be cured, the question is no longer whether health care contributes to population health but by how much.249
To take account of the value factor, Britain’s Department of Health, in collaboration with the University of York, proposed and modelled several types of adjustments:250
• Mortality within 30 days of hospital admission
• Health effects of treatment, life expectancy and waiting times
• Value weight for statin use
• Blood pressure control
• Heart attack survival
• Patient experience
• Value of health
The last adjustment, value of health, is based on improvements in life expectancy that result in additional years of employment. The approach to the adjustments for the first five factors is based on an increase in quality adjusted life years (QALY) as the common metric. Increased QALYs are converted to a dollar value and ultimately to increased output. The sum effect of these adjustments changed the productivity growth rate from negative to positive.n
This more sophisticated approach to measuring health service productivity has been acknowledged by both the Ministry of Health and Treasury.251,252 However, while the Ministry recognises “there is a compelling rationale for making these adjustments to the basic productivity (output over input) measurement, we
n While some adjustment for quality is now included in NHS productivity measures, Britain’s Parliamentary Public Accounts Committee reports that: “The Department [of Health] has not yet agreed with the Office for National Statistics a measure for NHS productivity, …The Department does not believe that the existing measure sufficiently accounts for improvements in quality.” – Public Accounts Committee, 26th Report: Management of NHS Hospital Productivity, 9 March 2011.

THE PUBLIC HOSPITAL SPECIALIST WORKFORCE ASMS
93
have decided not to propose adjusting for quality directly in the productivity measure at this time”.253
Evidently the quality of New Zealand’s health service information and data is the main prohibiting factor.
The purpose behind the measure
The significant shortcomings of productivity measurement outlined above (most of which are conceded by the Ministry) beg the question: Why go to so much trouble (and presumably no small cost) to produce figures that are virtually meaningless?
The answer is provided in the Ministry document, which, as a background to the development of the measurement, refers to concern about rising health expenditure and the effects of past wage settlements, “particularly [those of] senior doctors and nurses”.
A Ministry of Health Performance Assessment and Management Steering Group (PAM)o was set up to “enhance” performance assessment and “management” of the sector. To that end, it decided to “initially develop a productivity measure which captured the following key drivers of DHB provider arm financial sustainability: personnel costs; labour productivity; wage pressures and settlements”. It would focus exclusively on doctors and nurses working in DHB medical and surgical service areas.
Hospital outputs are measured on a cost weight or case weight basis (the terms case weight, cost weight, and cost weight may be used interchangeably254). These are based on estimated average total hospital cost of treatment and care associated with a particular diagnosis (ie labour and non-labour costs).
Nursing and medical salaries are only one part of a much more complex equation. Comparing a comprehensive output measure against a partial input measure can produce skewed results. If the trend is for a greater increase in cost-weighted discharges (CWDs) that have a relatively high medical/nursing component, for example, one would expect to see corresponding increases in staff numbers and salary costs per CWD, with corresponding decreases in non-labour costs. Since the latter is not measured, the real measure of staff efficiency and cost-effectiveness is not known.
o The PAM Steering Group was formed in early 2005. It was chaired by the Director-General of Health with representatives from two Ministry directorates, DHBs, District Health Boards New Zealand (DHBNZ), Treasury, Department of Prime Minister and Cabinet (DPMC), and the State Services Commission (SSC).

94
Which leads one to conclude that the productivity exercise appears to be less about providing any sensible assessment of “value for money” but more about creating official statistics (the kind that give statistics a bad name) to curb medical and nursing wage pressures.
Negative effects of publishing false productivity measures
The regular publication of these productivity measures create incentives for DHBs to focus on increasing hospital “outputs” without a corresponding emphasis on, firstly, preventing hospital admissions and, secondly, improving – or even maintaining – quality and safety of hospital services.
While increasing numbers of patients are entering hospital, and the average length of stay has continued to trend downwards, there has been very little improvement in avoidable hospital admission rates over the past 10 years (rates for Maori and Pacific peoples in particular have increased), and unplanned readmissions to hospital have been increasing over recent years.255
Further, while all the key statistics on hospital activities show hospitals are continuing to get busier, the claims of declining productivity can have only a negative effect on professional satisfaction levels and staff morale, which in turn are factors associated with staff turnover. A study to investigate psychological distress among doctors in a New Zealand public hospital found that perceptions of decreased work productivity were significantly related to psychological distress.256
Endnote: The Ministry has advised that it is currently updating its productivity measurement with new data and methods.

THE PUBLIC HOSPITAL SPECIALIST WORKFORCE ASMS
95
Appendix 2
PRACTISING mEDICAl SPECIAlISTS IN NEW ZEAlAND
2005 2006 2007 2008 2009 2010 2011 2012
MCNZ Register (public & private)
Total practising specialists*
3451 3536 3757 3903 4060 4262 4438 4634
Annual change 198 85 221 146 157 202 176 196
Annual % change 6% 3% 6% 4% 4% 5% 4% 4%
DHB Workforce Data
DHB specialists 2811 2845 2894 3312 3457 3533 3685 3836
Annual change 202 34 49 418 145 76 152 141
Annual % change 8% 1% 2% 14% 4% 2% 4% 4%
Difference between Register & DHB data
Net Difference 640 691 863 591 603 729 753 808
% of total practising specialists
18.5% 19.5% 23.0% 15.1% 14.9% 17.1% 17.0% 17.4%
The spike in DHB numbers in 2008 is not replicated in the medical register figures. There are several possible reasons for this. The spike may be in part due to the settlement of the MECA, which included a $10,000 lump sum retention payment. This, along with the aspirations expected of the SMO Commission that never materialised, may have slowed down the drift to Australia. There may also have been a larger than usual influx of IMG salaried specialists with provisional vocational registration, who would not have been included in the MCNZ data (ie vocationally registered doctors). The spike might also be simply due to an inaccuracy in the DHBs’ statistics in that year.
Source: MCNZ Medical Register; District Health Boards (ASMS Annual Salary Survey)
* These figures represent doctors on the register with a vocational scope of practice, a current practising certificate and a New Zealand address as at 31 March of that year (2 April for 2012). It is a count of unique doctors, so does not double-count those with multiple vocational scopes. The figures exclude general practitioners and doctors in accident and medical practices unless they also have a vocational scope that is not one of those scopes (eg. occupational medicine, public health medicine etc). The figures include specialists with confidential addresses, assuming they are New Zealand addresses.

96
Appendix 3
SPECIAlISTS (INClUDING TRAINEES) PER 1,000 POPUlATION, 2010 OR lATEST yEAR AVAIlAblE*
Per 1,000 population
4
3
2
1
0
Gre
ece
Cze
ch R
ep
Ital
y
Swit
zerl
and
Au
stri
a
Spai
n
Icel
and
Isra
el
Ger
man
y
USA
Esto
nia
Swed
en
Port
ug
al
Luxe
mb
ou
rg UK
Slo
ven
ia
Bel
giu
m
Pola
nd
Hu
ng
ary
Fran
ce
Net
her
lan
ds
No
rway
Fin
lan
d
Au
stra
lia
Den
mar
k
Irel
and
Mex
ico
New
Zea
lan
d
Can
ada
Ko
rea
Turk
ey
Source: OECD Health Data (2012), compiled by ASMS*Notes:
• Dataarenotavailabletoseparatespecialistsfromtraineespecialists.• Figuresasat2009forItaly,Australia,DenmarkandMexico.• Somecountries(alllistedaboveNewZealand),excluderesidentdoctors/trainees.• InsufficientdataavailableforSlovakRepublic,Japan,Chile.

THE PUBLIC HOSPITAL SPECIALIST WORKFORCE ASMS
97
Appendix 4
Canada: Family physicians and specialists in short supply
Canada is experiencing similar medical workforce shortages to that of New Zealand. Currently between four million and five million Canadians do not have a family physician, and many practices are at capacity and unable to take on new patients.
The shortage of family physicians has put extra pressure onto hospital services, where there are media reports of lengthening waiting lists and shortages of specialists. The Canadian government agency Service Canada reports:
Currently, significant needs and even shortages have been identified in the following specialties: radiation oncology, anatomical pathology, surgery, emergency medicine, cardiology, psychiatry, nephrology and geriatrics.
Service Canada, 2012 257
Alberta alone had 175 vacancies for medical specialists (and 300 for GPs) in July 2012. 258
A Commonwealth Fund comparison of access to specialist services and elective surgery in eight countries in 2010 and 2011 put Canada in last position on both counts. The other countries were New Zealand, France, Germany, United Kingdom, United States, Netherlands and Australia. (New Zealand ranked 5th for both access to specialist services and elective surgery.) 259
The Royal College of Physicians and Surgeons of Canada (RCPSC) recently told a government standing committee that physicians face growing demands for their time. Non-metropolitan areas in particular are “seriously underserviced”.
Increasingly complex cases of diseases, conditions, and treatments, ageing population, and/or the complex medical needs especially, among children and youth, is increasing the demand and workloads of specialties such as oncology, general surgery, geriatric psychiatry, general internal medicine, neurology and, palliative care.
Royal College of Physicians and Surgeons of Canada, 2012 260
The RCPSC also warns: “US recruitment of Canadian talent may be on the upswing because of health care reform in America.”

98
Like New Zealand, Canada has increased its medical school intakes in recent years, the effects of which are starting to be seen. The RCPSC reports: “There is a shortage of academic staff and time for mentoring and training upcoming physicians. Competing demands on specialists’ workloads erodes the protected time for these duties.”
An analysis of the inflows and outflows of the Canadian medical workforce indicates the increases in medical school intakes will be insufficient to meet future demands and that “a significant intake of foreign physicians” will be required. 261 The Canadian Medical Association has also called for changes to make it easier for foreign-trained doctors to practise in Canada. 262 Such measures were included in broader immigration policy changes recently announced by the Canadian Immigration Minister. 263

THE PUBLIC HOSPITAL SPECIALIST WORKFORCE ASMS
99
Appendix 5
Australia: specialist workforce shortages continue
The number of New Zealand specialists leaving to practise in Australia permanently is not monitored but a number of sources indicate it is significant. A survey by the ASMS found that in the 18 months to July 2007 New Zealand lost at least 80 specialists to Australia – the equivalent of a senior medical specialist workforce at a regional hospital. 264 Unpublished Australian Department of Immigration and Citizenship (DIAC) data show that between 2006/07 and 2008/09 an annual average of 306 New Zealand doctors moved to Australia on a permanent or long-term basis. An analysis of the data indicates that at least a 100 of them were likely to have been specialists. 265
MCNZ registration figures show that over that same period there were 299 new vocational registrations on average each year in New Zealand (excluding GPs and Accident and Medical Practitioners). The migration figures therefore suggest we may have lost – to Australia alone – the equivalent of one-third of our new intake of specialists.
More recently, a medical recruitment company claims to have seen a 300% rise in New Zealand doctors leaving to find better pay in Australia in the year to February 2011, including more who are intending to leave permanently. 266
On the other hand, the Dean of the Faculty of Medical and Health Science at the University of Auckland claimed during an address to the 2012 ASMS Annual Conference, that the numbers leaving for Australia have dramatically reduced since 2007. However despite repeated attemps to obtain the data to support that claim, none has been forthcomming.
An OECD paper conservatively estimates 29% of New Zealand doctors are working overseas, mostly in Australia, giving New Zealand the second-highest expatriation rate in OECD countries (behind Luxemburg). 267
Geographical proximity, cultural similarity and higher wages all contribute to Australia’s attraction for New Zealand doctors. Movement between the two countries is also facilitated by transnational medical colleges that set up similar requirements for post-graduate medical training.
Health services in Australia are facing similar pressures to New Zealand’s: a growing and ageing population, changing nature of the burden of disease, rising public expectations and medical workforce shortages in many areas resulting

100
in a heavy dependence on international medical graduates (though still considerably less dependent than New Zealand).
Australia has been quicker than New Zealand to respond to workforce shortages by increasing its medical school intake, beginning with modest increases from 2000, then increasing dramatically in 2007 and 2008, with the ultimate aim of making Australia “self-sufficient” in the supply of doctors and nurses by 2025. Consequently, the number of Australian medical graduates entering the workforce has increased from approximately 1600 in 2006 to an estimated 3500 in 2012. 268
However, the “self-sufficiency” policy will not affect the specialist workforce for some years to come.
From the time of graduation, it can take up to nine years full-time to become a specialist.269 This may in fact take considerably longer as many doctors are opting to take longer to complete vocational training. A survey of Australian vocational trainees in 2004 found 48% of respondents were taking longer to complete vocational training than they had previously expected. Part-time training and taking time-out were factors associated with the delay.270
Furthermore, Australia’s aim of self-sufficiency poses a considerable challenge. According to scenarios outlined in a recent Australian government report, a 50% reduction in IMGs by 2025 would require 9,300 doctors to fill the gap, while a 95% reduction would require the replacement of 15,200 doctors, “demonstrating the significant role of international contributions to the medical workforce in meeting current and projected future demand”.271
The aim of replacing IMGs with home-grown doctors also has to take account of the fact that competition for graduate professions within Australia is increasing and the workforce pool is shrinking as a proportion of the total population, driven by the ageing demographics of the workforce.272
Considering these challenges and current medical workforce pressures, a number of reports have reinforced the message that IMGs will continue to fill workforce shortfalls in the years ahead.
Western Australia is facing a crippling
shortage of medical specialists, with half
of specialties “critically” short of experts
to treat cancer, heart and diabetes
patients, according to a leaked report. A
WA Health Department discussion paper
warns some specialties are understaffed,
with long waiting lists for treatment….
Of 41 medical specialties across the
public and private health systems,
20 are ranked as having critical
shortfalls, including general medicine,
endocrinology, haematology,
cardiothoracic surgery, radiation
oncology and paediatric surgery. Another
16 specialties have “high” shortages.
The West Australian, 12 April 2012

THE PUBLIC HOSPITAL SPECIALIST WORKFORCE ASMS
101
…given the reliance in the Australian medical workforce on international health professionals … it is unlikely that Australia would limit immigration for at least the short to medium term.
Health Workforce Australia, 2012 273
Notwithstanding the initiatives promoted by all levels of government, including the provision of additional education and training places to grow the domestically trained workforce … the Committee understands that IMGs are needed to address current workforce shortages and are an integral part of Australia’s medical workforce. It appears that IMGs will continue to fulfil this role at least in the short to medium term.
House of Representatives Standing Committee on Health and Ageing, 2012 274
Despite goals for self-sufficiency, migration seems certain to remain an imperative for Australia for the foreseeable future.
Lesleyanne Hawthorne, Professor (International Health Workforce), 2012275
Some are concerned that the expansion in student numbers is excessive. However, we calculate that to maintain existing health service levels in 2025, taking into account the additional health burden of ageing Australia and assuming that as much as 20% of existing medical duties are taken up by other health professionals, Australia will still need to import about 25% of the medical workforce. Generational factors and the effect of the increasing feminisation of the medical workforce will likely result in these calculations being optimistic.
Des Gorman, Peter Brooks, 2009276
In the meantime, Australia, which has fewer specialists per population than most OECD countries (Appendix 3), is continuing to experience shortages across a wide range of specialties.277 The Australian equivalent of New Zealand’s Skills Shortage Lists, the “Skilled Occupations List”, currently includes every medical specialty listed by ANZSCO.278
The effects of the shortages have been exacerbated by the rapidly increasing training demands on specialists at a time when clinical demands are also increasing. For those specialists involved in training, the proportion of hours spent in direct patient care has declined.279 In addition, the quality of training is under increasing pressure. It is now common for hospital consultants and registrars to have eight or more students accompany them on a ward round when previously there would have been two or three at such sessions.280
The pressure on medical training positions has led to suggestions that Australian resident medical officers may start heading for New Zealand. However, an Australian Medical Association report to a recent industrial coordination meeting (13 & 14 September) indicates all Australian domestic

102
graduates have now got places. There were 552 international students, of whom 498 have also found positions. The remainder have returned to their home countries as a condition of their scholarships.
Until 2016 the number of Australian medical graduates will continue to increase before leveling off. At this stage there is a projected shortage of training positions for the next few years but whether this is addressed in advance remains to be seen.
The AMA says that if any RMOs from Australia come to New Zealand next year due to a lack of training positions, they are likely to be a small number in their third or fourth years.
Continuing specialist shortages
Looking ahead, the extent of the specialist shortages in Australia will continue to vary between specialties, between states and between metropolitan and provincial areas. Workforce indicators show pressures on supply over the next decade will continue through a number of factors, including a rise in the numbers of retirements among specialists, a rise in the proportion of female specialists, and a greater demand for more flexible and part-time employment, especially from “Generation Y” specialists.
A Health Workforce Australia report on supply and demand projections for designated medical specialties indicate that, despite the increases medical school intakes, the shortages may well continue
Source: Australian Government: Department of Immigration and Citizenship, 1 July 2012
Skilled Occupation List (SOL) - Australia
The Skilled Occupations list is updated annually and identifies
occupations that are in demand and “are critical to Australia’s
economic development in the medium to long term”.
Specialist Physician (General Medicine)CardiologistClinical HaematologistEndocrinologistGastroenterologistNeurologistPaediatricianRheumatologistThoracic Medicine SpecialistCardiothoracic SurgeonNeurosurgeonOrthopaedic SurgeonOtorhinolaryngologistPaediatric SurgeonPlastic and Reconstructive SurgeonUrologist
Vascular SurgeonDermatologistEmergency Medicine SpecialistOphthalmologistAnaesthetistRadiologistIntensive Care SpecialistMedical OncologistRadiation OncologistObstetrician & GynaecologistPathologistPsychiatristRenal Medicine SpecialistPalliative Medicine SpecialistGeneral SurgeonDental Specialist
Specialist Physicians nec*
* Specialist physicians not elsewhere classified include specialists in rehabilitation, immunology, geriatric medicine, industrial medicine, palliative medicine, public health, sexual health and infection diseases.

THE PUBLIC HOSPITAL SPECIALIST WORKFORCE ASMS
103
in a range of specialties through to 2025, depending on a number of factors, including the extent to which Australia moves towards self-sufficiency and the extent to which the hoped-for gains from implementing new models of care are realised.
Conclusion
For at least the foreseeable future, Australia will continue to recruit New Zealand specialists in significant numbers unless appropriate action is taken to improve New Zealand retention.

104
References
1. D Gorman. “The disposition and mobility of medical practitioners in New Zealand”, NZMJ 4, Vol 124 No 1330; March 2011.
2. M McKee, J Healy. “The role of the hospital in a changing environment”, Bulletin of the World Health Organisation, 2000, 78 (6).
3. A Durán. “Los hospitales del future” [The hospitals of the future]. Eidon, Journal of the Institute of Health Sciences, 29 (Special Issue) in Governing Public Hospitals, R Saltman et al (eds), European Observatory on Health Systems and Policies, WHO, 2011
4. M McKee, J Healy. “The role of the hospital in a changing environment”, Bulletin of the World Health Organisation, 2000, 78 (6).
5. L Malcolm. “Trends in hospital bed utilisation in New Zealand 1989 to 2006: more or less beds in the future?” NZMJ, Vol 120, No 1264, 26 October 2007.
6. J Healy, M McKee. “The Evolution of Hospital Systems”, in Hospitals in a Changing Europe, M McKee, J Healy (ed), European Observatory on Health Care Systems Series, 2002.
7. European Observatory on Health Care Systems. Hospitals in a Changing Europe, M McKee, J Healy (eds); European Observatory on Health Care Systems Series, 2002.
8. Ibid.
9. R Gauld. Revolving Doors: New Zealand’s Health Reforms. Institute of Policy Studies and the Health Services Research Centre, Victoria University, Wellington, October 2001.
10 . Hon T Ryall, Minister of Health, Q&A, TVNZ, 3 October 2010.
11. European Observatory on Health Care Systems. Hospitals in a Changing Europe, M McKee, J Healy (eds); European Observatory on Health Care Systems Series, 2002.
12. S French, A Old, J Healy. Health Care Systems in Transition: New Zealand 2001, European Observatory on Health Care Systems 2001.
13. Treasury Report: Value for Money in Health – The DHB Sector, February 2005. Available at: www.treasury.govt.nz
14. SMO Commission. The Director-General of Health’s Commission on Competitive and Sustainable Terms and Conditions of Employment for Senior Medical and Dental Officers Employed by District Health Boards, Ministry of Health, June 2009.
15. K Hillman. “Restructuring hospital services” Medical Journal of Australia, 169(5): 239.
16. Ibid
17. D Dow. Safeguarding Public Health: A History of the New Zealand Department of Health. Victoria University Press, Wellington 1995
18. A Gibbs, D Fraser, J Scott. Unshackling the Hospitals: Report of the Hospital and Related Services Taskforce. Hospital and Related Services Taskforce, Wellington 1988.
19. R Gauld. Revolving Doors: New Zealand’s Health Reforms. Institute of Policy Studies and the Health Services Research Centre, Victoria University, Wellington, October 2001.
20. T Ashton. “Health care systems in transition: New Zealand – Part 1: An overview of New Zealand’s health care system.” Journal of Public Health Medicine, Vol. 18, No. 3, pp. 269-273
21. L Malcolm. “Trends in Primary Medical Care Related Services and Expenditure in New Zealand 1983-93”. NZMJ 106, pp470-474, 1993
22. T Ashton. “Health care systems in transition: New Zealand – Part 1: An overview of New Zealand’s health care system.” Journal of Public Health Medicine, Vol. 18, No. 3, pp. 269-273
23. Ministry of Health. Health Expenditure Trends 1980-99. Ministry of Health August 2000.
24. Hon S Upton. Your Health & the Public Health: A Statement of Government Health Policy. Minister of Health, Wellington 1991.
25. D Dow. Safeguarding Public Health: A History of the New Zealand Department of Health. Victoria University Press, Wellington 1995
26. Ibid
27. R Gauld. Revolving Doors: New Zealand’s Health Reforms. Institute of Policy Studies and the Health Services Research Centre, Victoria University, Wellington, October 2001.
28. B Easton. “The New Zealand Health Reforms in Context”. Applied Health Economics and Policy. 1 (2) 2002.
29. B Easton. “The sorry state of the health system”, NZ Listener, 21 November 1998.
30. R Gauld. Revolving Doors: New Zealand’s Health Reforms. Institute of Policy Studies and the Health Services Research Centre, Victoria University, Wellington, October 2001.
31. Ibid
32. T Ashton. “Running on the Spot: Lessons from a decade of health reform in New Zealand.” Applied Health Economics and Policy, 2002;1(2):97-106

THE PUBLIC HOSPITAL SPECIALIST WORKFORCE ASMS
105
33. B Easton. “The New Zealand Health Reforms in Context”. Applied Health Economics and Policy. 1 (2) 2002
34. I Poole et al. Restructuring and Hospital Care: Sub-National Trends, Differentials, and their Impacts; New Zealand from 1981. Population Studies Centre, University of Waikato, 2009
35. T Ashton. “Running on the Spot: Lessons from a decade of health reform in New Zealand.” Applied Health Economics and Policy, 2002;1(2):97-106
36. A Hornblow. “A turbulent decade: lessons from the health reforms” (editorial), NZMJ Vol 113 No 1108, 28 April 2000
37. ASMS. Repairing the leaking bucket. A paper to the Commission on Competitive and Sustainable Terms and Conditions of Employment for Senior Medical and Dental Officers employed by DHBs, January 2009.
38. Hon A King. The Primary Health Care Strategy. Ministry of Health, February 2001.
39. I Sheerin, G Allen, et al. “Avoidable hospitalisations: potential for primary and public health initiatives in Canterbury, NZMJ, No 119, Vol 1236, 23 June 2006.
40. Ministry of Health Annual Reports 2011& 2012
41. Hon T Ryall. Better, Sooner, More Convenient: Health Discussion Paper, National Party, 2007
42. NZ Treasury. Treasury Report: Value for Money in Health – The DHB Sector, February 2005. Available at: www.treasury.govt.nz
43. Ministry of Health. Productivity and efficiency in the delivery of public hospital services in New Zealand, Ministry of Health, Wellington, June 2007
44. G Jackson, H Rae. “Future hospital trends in New Zealand”, NZMJ, Vol 120 No 1264, 26 October 2007.
45. I Poole et al. Restructuring and Hospital Care: Sub-National Trends, Differentials, and their Impacts; New Zealand from 1981. Population Studies Centre, University of Waikato, 2009
46. K Woods. Director-General of Health. Vote Health: Four-Year Budget Plan, February 2011.
47. SMO Commission. The Director-General of Health’s Commission on Competitive and Sustainable Terms and Conditions of Employment for Senior Medical and Dental Officers Employed by District Health Boards, Ministry of Health, June 2009.
48. National Government. The Government’s response to the Ministerial Review Group’s Report ‘Meeting the Challenge’, 21 October 2009.
49. OECD. Health at a Glance 2009 and 2011: OECD Indicators. OECD Paris
50. OECD. Health at a Glance 2011.
51. Ministry of Health. Health and Independence Report 2007 and Health and Independence Report 2008. Later reports are included in the Ministry of Health’s Annual Reports. Available at www.moh.govt.nz
52. NZ Treasury. Vote:Health, Budget 2012.
53. Ministry of Health. Annual Report for the year ending 30 June 2011, including the Director-General of Health’s Annual Report on the State of Public Health, Ministry of Health, October 2011. Data to 2011 provided by Ministry of Health, 2012.
54. Statistics New Zealand, Population Projections, Series 5. 2009 base.
55. Statistics New Zealand, Population Projections, Series 5. 2006 base.
56. P Degeling P, J Erskine J. “New models of long-term care and implications for service redesign.” In: Rechel B et al (eds.) Investing in hospitals of the future. Copenhagen, WHO Regional Office for Europe on behalf of the European Observatory on Health Systems and Policies:27–44.
57. Ministry of Health. Older People’s Health Chartbook 2006. Public health Intelligence Monitoring Report No 12. Available at: www.moh.govt.nz
58. National Health Committee. Meeting the Needs of people with Chronic Conditions. National Advisory Committee on Health and Disability. Wellington, 2007. (Updated 12 April 2012.)
59. Ibid
60. Dubois, McKee & Nolte (2006); Hillman (1999); Saltman & Figueras (1997) in B Rechel et al. Investing in Hospitals of the Future, European Observatory on Health Care Systems Series, 2002.
61. K Woods. Director-General of Health. Vote Health: Four-Year Budget Plan, February 2011.
62. B Rechel et al. Investing in Hospitals of the Future, European Observatory on Health Care Systems Series, 2002.
63. M McKee, J Healy. “The role of the hospital in a changing environment”, Bulletin of the World Health Organisation, 2000, 78 (6).
64. B Rechel et al. Investing in Hospitals of the Future, European Observatory on Health Care Systems Series, 2002.
65. M Chan, “Antimicrobial resistance in the European Union and the world,” WHO director-general’s keynote address to the conference on Combating Antimicrobial Resistance: time for action, Copenhagen, Denmark, 14 March 2012

106
66. Ibid
67. M McKee, J Healy. “The role of the hospital in a changing environment”, Bulletin of the World Health Organisation, 2000, 78 (6).
68. Aletras V, Jones A, Sheldon TA. “Economies of scale and scope”. In: Ferguson, Sheldon, Posnett J, (eds.) Concentration and choice in health care. Glasgow, Royal Society of Medicine Press, 1997: 23–36.
69. M McKee, J Healy. “The role of the hospital in a changing environment”, Bulletin of the World Health Organisation, 2000, 78 (6).
70. K Hillman (1999). “The changing role for acute care hospitals.” Medical Journal of Australia, 170(7): 325-9.
71. R Saltman, J Figueras (1997). European Health Care Reform: Analysis of Current Strategies, WHO Regional Publications, European Series No 72, Copenhagen: WHO Regional Office for Europe.
72. N Edwards, A Harrison A. “The hospital of the future. Planning hospitals with limited evidence: a research and policy problem”. British Medical Journal, 319:1361–1363, 1999.
73. C-A Dubois, M McKee, E Nolte. “Analysing trends, opportunities and challenges”. Human resources for health in Europe. Maidenhead, Open University Press:15–40, 2006.
74. National Health Board. Trends in Service Design and New Models of Care: A Review, Ministry of Health, August 2010
75. Ibid
76. Z Or. “Determinants of health outcomes in industrialised countries: a pooled, cross-country, time-series analysis”. OECD Economic Studies, 30 53-77, OECD 2000.
77. Z Or. Exploring the effects of health care on mortality across OECD countries: Labour Market and Social Policy – Occasional Papers No 46. OECD 2001.
78. J Figueras, M McKee (eds). Health Systems, Health, Wealth and Societal Well-being. European Observatory on Health Systems and Policy series. Open University Press, Berkshire, England 2012 (p 284)
79. Ibid
80. M Tobias, G Jackson (2001). “Avoidable mortality in New Zealand, 1981-97”, Australian and New Zealand Journal of Public Health, 25: 12-21; in J Figueras, M McKee (eds). Health Systems, Health, Wealth and Societal Well-being. European Observatory on Health Systems and Policy series. Open University Press, Berkshire, England 2012 (p 284)
81. J Bunker et al (1994 & 1995) in J Figueras, M McKee (eds). Health Systems, Health, Wealth and Societal Well-being. European Observatory on Health Systems and Policy series. Open University Press, Berkshire, England 2012 (p 118)
82. I McPherson, Chief Executive Officer’s Report, Southern Cross Medical Care Society 2012 Annual Report, 2012.
83. Ministry of Health. Ageing New Zealand and Health and Disability Services 2001-2021. Ministry of Health 2004. Available at www.moh.govt.nz
84. J Cornwall, J Davey. Impact of Population Ageing in NZ on the Demand for Health and Disability Support Services, and Workforce Implications. Background paper prepared for the Ministry of Health, December 2004. NZ Institute for Research on Ageing and the Health Services Research Centre. Victoria University, Wellington
85. D Wanless. Securing our future health: taking a long-term view. Department of Health, 2002. London
86. European Observatory on Health Care Systems. Hospitals in a Changing Europe, M McKee, J Healy (eds); European Observatory on Health Care Systems Series, 2002.
87. D Wanless. Securing our future health: taking a long-term view. Department of Health, 2002. London
88. J Farrington-Douglas, R Brooks (2007). The Future Hospital: The progressive case for change, Institute for Public Policy Research, London, January 2007.
89. Brown et al. (2002). “Cost of Medical Injury in New Zealand: A Retrospective Cohort Study”. The Journal of Health Serv Res Policy (7): Suppl 1.
90. J Richardson, J McKie. “Increasing the options for reducing adverse events: Results from a modified Delphi technique,” Australia and New Zealand Health Policy, 14 November 2008.
91. DHBNZ. Health Workforce Information Programme: DHB Base Data Reports, from June 2010.
92. Commission on the Resident Medical Officer Workforce. Treating People Well: Report of the Director-General of Health’s Commission on the Resident Medical Officer Workforce. Appendix 12. 11 June 2009.
93. Medical Training Board. Foundations of Excellence: Building infrastructure for education and training, J une 2009.
94. MCNZ. New Zealand Medical Workforce in 2011. MCNZ 2012
95. Medical Training Board. Foundations of Excellence: Building infrastructure for education and training, June 2009
96. Commission on the Resident Medical Officer Workforce. Treating People Well: Report of the Director-General of Health’s Commission on the Resident Medical Officer Workforce. Wellington: Ministry of Health 2009..
97. Secretariat to the SMO Commission. Treating People Well: Report of the RMO Commission, Appendix 12, June 2009.

THE PUBLIC HOSPITAL SPECIALIST WORKFORCE ASMS
107
98. Ibid
99. P Sheehan. Health Costs, Innovation and Ageing. Melbourne, Pharmaceutical Industry Project. Equity, sustainability and industry development. Working Paper No. 9. Centre for Strategic Economic Studies, Victoria University of Technology, 2002. Quoted in Cornwall and Davey (2004).
100. P Mohr, C Mueller, et al. The Impact of Medical Technology on Future Health Care Costs. Bethesda: Project Hope, Centre for Health Affairs, 2001. Quoted in Cornwall and Davey (2004)
101. RG Evans, SG McGrail et al. Apocalypse No: Population aging and the future of health care systems. Social and Economic Dimensions of an Ageing Population. Research Paper no. 59. Hamilton: McMaster University, 2001.
102. Ibid
103. D Wanless. Securing our future health: taking a long-term view. Department of Health, 2002. London
104. National Health Board. Trends in Service Design and New Models of Care: A Review, Ministry of Health, August 2010
105. DA Etzioni et al, “The Ageing Population and its Impact on the Surgery Workforce,” Annals of Surgery, 2003 August; 238(2): 170–177.
106. FJ Crosson, “The changing shape of the physician workforce in prepaid group practice”, Health Affairs, 4 February 2004. Available at: http://content.healthaffairs.org/cgi/content/full/hlthaff.w4.60v1/DC1
107. Ibid
108. Ibid
109. R Feachem et al, “Getting more for their dollar: a comparison of the NHS with California’s Kaiser Permanente”, BMJ 2002;324(7330):135 (19 January)
110. DR Masys, “Effects of current and future information technologies on the health care workforce,” Health Affairs, Vol 21, No 5, 2002
111. Ibid
112. National Public Health Services for Wales, Impact of Medical Technological Advances, October 2005
113. DR Masys, “Effects of current and future information technologies on the health care workforce,” Health Affairs, Vol 21, No 5, 2002
114. Government Careers Service website: Physician: pay and job outlook. Available at: www.careers.govt.nz/default.aspx?id0=60103&id1=J15110
115. Doctors in Training Workforce Roundtable. Training the Medical Workforce: 2006 and Beyond. Ministry of Health, 2006. Available at: www.moh.govt.nz
116. C Terschüren, M Mensing, O Mekel. “Is telemonitoring an option against shortage of physicians in rural regions?” Attitude towards telemedical devices in the North Rhine-Westphalian health survey, Germany, BMC Health Services Research, Vol 12, April 2012
117. JJ Moffatt, DS Eley. “Barriers to the up-take of telemedicine in Australia – a view from providers,” Rural and Remote Health, 11: 1581, February 2011.
118. M Barrett, A Larson et al. “Challenges faced in implementation of a telehealth enabled chronic wound care system,” Rural and Remote Health, 9: 1154, August 2009.
119. M McKee, J Healy. “The role of the hospital in a changing environment”, Bulletin of the World Health Organisation, 2000, 78 (6).
120. Health Workforce Australia. Health Workforce 2025: Medical Specialties, Volume 3, November 2012
121. ASMS. Repairing the leaking bucket. A paper to the Commission on Competitive and Sustainable Terms and Conditions of Employment for Senior Medical and Dental Officers employed by DHBs, pp 38-45. January 2009.
122. ASMS and 20 DHBs. Securing a Sustainable Senior Medical and Dental Officer Workforce in New Zealand: The Business Case, pp 17-19. November 2010.
123. Health Workforce Australia. Health Workforce 2025: Medical Specialties, Volume 3, November 2012.
124. ASMS. Repairing the leaking bucket. A paper to the Commission on Competitive and Sustainable Terms and Conditions of Employment for Senior Medical and Dental Officers employed by DHBs, pp 38-45. January 2009.
125. ASMS and 20 DHBs. Securing a Sustainable Senior Medical and Dental Officer Workforce in New Zealand: The Business Case, pp 17-19. November 2010.
126. K Woods. Director-General of Health. Vote Health: Four-Year Budget Plan, February 2011.
127. Health Workforce Advisory Committee. Fit for Purpose and for Practice. Advice to the Minister of Health on the issues concerning the medical workforce in New Zealand. 2006. Available at: www.hwac.govt.nz
128. ASMS and 20 DHBs. Securing a Sustainable Senior Medical and Dental Officer Workforce in New Zealand: The Business Case, November 2010.
129. Health Workforce Australia. Health Workforce 2025: Medical Specialties, Volume 3. November 2012.
130. NZ Herald, “More surgeons quitting public practice to go private: survey” 23 October 2007.
131. HWNZ. Eye Health Workforce Service Review – Appendix 2. HWNZ.

108
132. Medical Training Board. Foundations of Excellence: Building infrastructure for education and training, June 2009.
133. Hon T Ryall, “More smart solutions to health workforce crisis,” media release, 30 September 2008.
134. Doctors in Training Workforce Roundtable. Training the Medical Workforce: 2006 and Beyond, Ministry of Health 2006.
135. Clinical Training Agency. The Health Workforce: A training programme analysis. Ministry of Health, Wellington, 2001.
136. MCNZ. New Zealand Medical Workforce in 2011. MCNZ 2012
137. Health Workforce Australia. Health Workforce 2025: Medical Specialties, Volume 3, November 2012.
138. DF Gorman, PM Brooks. “On solutions to the shortage of doctors in Australia and New Zealand,” Med J Aust 2009; 190 (3): 152-156
139. Australian Department of Immigration and Citizenship. Unpublished data
140. P Zurn, J-C Dumont. Health Workforce and International Migration: Can New Zealand Compete? OECD Health Working Paper No 33, 2008.
141. ASMS Vacancy Survey, 2008.
142. MCNZ. Doctors leaving New Zealand: Analysis of Online Survey Results, MCNZ, September 2011.
143. Ibid
144. National Health Board. Trends in Service Design and New Models of Care: A Review, Ministry of Health, August 2010.
145. HWNZ (2012), Advanced Trainee Fellowship Schemes: Terms and Conditions. Available at: http://healthworkforce.govt.nz/our-work/advanced-trainee-fellowship-atf/atf-terms-and-conditions
146. WM Thomson. 2005 Workforce Analysis, Dental Council of NZ, February 2006.
147. JM Broadbent. Dental Council Workforce Analysis 2009, Dental Council of NZ, April 2011.
148. Shearer DM, MacLeod RJ, Thomson WM. “Oral-health-related quality of life: an overview for the general dental practitioner.” New Zealand Dental Journal 103: 82–7., 2007.
149. NZMC. Unpublished data from The NZ Medical Workforce 2010. NZMZ, 2011.
150. Report of the Director-General of Health’s Commission on Competitive and Sustainable Terms and Conditions of Employment for Senior Medical and Dental Officers Employed by District Health Boards. June 2009
151. MCNZ, The NZ Medical Workforce in 2011, MCNZ 2012.
152. Bewley and Bewley (1975). Quoted in Health Workforce Advisory Committee (2005). Fit for purpose and for practice: a review of the medical workforce in New Zealand. Consultation Document. Available at www.hwac.govt.nz
153. Health Workforce Advisory Committee (2005). Fit for purpose and for practice: a review of the medical workforce in New Zealand. Consultation Document. Available at www.hwac.govt.nz
154. W Cunningham, T Cookson. “Addressing stress related impairment in doctors. A survey of providers’ and doctors’ experience of a funded counselling service in New Zealand”, NZMJ, Vol 122, No 1300, 7 August 2009.
155. D Clark, R Singh. “Life events, stress appraisals, and hospital doctors’ mental health”, NZMJ Vol 117, No 1204, 22 October 2004.
156. LJ Surgenor, RL Spearing et el. “Burnout in hospital-based medical consultants in the New Zealand public health system”, NZMJ Vol 122, No 1300, 7 August 2009.
157. Ibid
158. B Moreno-Jiménez, Gálvez-Herrer et al. “A study of physicians’ intention to quit: The role of burnout, commitment and difficult doctor- patient interactions”, Psicothema 2012. Vol. 24, Nº 2
159. K Taylor, T Lambert, M Goldacre. “Future career plans of a cohort of senior doctors working in the National Health Service,” J R Soc Med. 2008 April 1; 101(4): 182–190.
160. Ministry of Health. Addressing Disincentives – Working Party Report, Ministry of Health June 2006. Available: www.moh.govt.nz/publications
161. T Ashton. “The benefits and risks of DHBs contracting out elective procedures to private providers,” NZMJ, Vol 123 No 1314, 14 May 2010
162. Southern Cross Medical Care Society, Annual Reports 2011 and 2007.
163. MCNZ Annual Reports, 2008 to 2012.
164. Ibid
165. Ibid
166. Auckland District Health Board. Career Med: Specialties List. Available at http://www.careermed.co.nz/specialties/OTOLARYNGOLOGY/workforceprojects.html
167. MCNZ Annual Reports, 2008 to 2012.
168. Ibid
169. Ibid
170. Clinical Training Agency. The Health Workforce: A Training Programme Analysis, CTA, 2001, 101-104
171. MCNZ Annual Reports, 2008 to 2012.

THE PUBLIC HOSPITAL SPECIALIST WORKFORCE ASMS
109
172. Ibid
173. L Althouse, J Stockman. “Paediatric Workforce: A look at paediatrics data from the American Board of Paediatrics,” Journal of Paediatrics 2006;148:166-9. Available at: http://journals.elsevierhealth.com/periodicals/ympd/search/quick
174. RANZCR. Radiology Workforce Report: New Zealand, 2010.
175. Health Workforce New Zealand Service reviews, available at www.healthworkforce.govt.nz
176. Clinical Training Authority. Purchasing Intentions Plan 2001-2002. CTA 2001. Available at: www.moh.govt.nz
177. CareerMed. Auckland DHB. http://www.careermed.co.nz/specialties/PATHOLOGY/workforceprojects.html
178. Auckland District Health Board. 2008. Career Med: Specialties List. Available at http://www.careermed.co.nz/specialties/SEXUAL.HEALTH/workforceprojects.html
179. New Zealand Faculty of the Australasian College for Emergency Medicine, 2003. Workforce Document.
180. Auckland District Health Board. 2008. Career Med: Specialties List. Available at www.adhb.govt.nz/CETU/cim/specialties/specialty.information.html
181. ANZICS. Centre for Outcome and Resource Evaluation, Annual Report 2010
182. Health Workforce New Zealand Service Reviews, available at www.healthworkforce.govt.nz
183. Ibid
184. Ibid
185. Anaesthesia 20/20: A Report on How to Provide Sufficient Anaesthesia Resources in New Zealand for the Next Decade and Beyond, New Zealand. Anaesthesia Resource Review Group (AARG). HWNZ, March 2012
186. www.careers.govt.nz
187. Health Workforce New Zealand Service Reviews, available at www.healthworkforce.govt.nz
188. Ibid
189. Ibid
190. OECD Health Data 2012
191. Ministry of Health, Annual Report 2012.
192. B Rosenberg, Did the Budget Provide Enough for Health? Working Paper on Health, No 8, NZCTU, 10 June 2012.
193. K Woods. Director-General of Health. Vote Health: Four-Year Budget Plan, February 2011.
194. Ibid
195. B Rosenberg, Did the Budget Provide Enough for Health? Working Paper on Health, No 8, NZCTU, 10 June 2012.
196. Ibid
197. OECD. Health System Priorities When Money Is Tight. A paper prepared for the OECD Health Ministerial Meeting, Paris, 7-8 October 2010.
198. A Gurria (Secretary-General of the OECD). “Health care and the value of prevention”, OECD Observer, No 281, October 2010.
199. I Powell. “Health and the Global Recession”, Report on Executive Director’s Visit to Europe, July-August 2011.
200. M Suhrcke et al. The economic costs of ill health in the European Region, World Health Organisation 2008.
201. J Figueras, M McKee, et al. Health Systems, Health and Wealth: Assessing the Case for Investing in Health Systems. WHO 2008.
202. OECD. Health System Priorities When Money Is Tight. OECD health ministerial meeting, Session 1, Paris, October 2010.
203. J Figueras, M McKee (eds). Health Systems, Health, Wealth and Societal Well-being. European Observatory on Health Systems and Policy series. Open University Press, Berkshire, England 2012 (pp 101-2)
204. Ministry of Health. Annual Report 2009.
205. M Tobias and L-C Yeh (Ministry of Health). “How much does health care contribute to health gain and to health inequality? Trends in amenable mortality in New Zealand 1981-2004?” Aust NZ Public Health. 2009; 33:70-8
206. M Suhrcke et al. The Contribution of Health to the Economy in the European Union, European Commission, August 2005.
207. DM Cutler, M McClellan. “Is technological change in medicine worth it?” Health Affairs, 20(5): 11-29; in Health Systems, Health, Wealth and Societal Well-being. European Observatory on Health Systems and Policy series. Open University Press, Berkshire, England 2012 (pp 101-2), J Figueras, M McKee (eds).
208. J Liu et al. (2002), “The economic burden of coronary heart disease in the UK”, Heart, 88: 597–603
209. J Figueras, M McKee, et al. Health Systems, Health and Wealth: Assessing the Case for Investing in Health Systems. WHO 2008
210. Statistics NZ. 2006 Disability Survey.
211. J Bryant, S Sonerson. “Gauging the Cost of Ageing”, Finance & Development, Vol 43, No 3. International Monetary Fund, 2006.
212. A Gurria (Secretary-General of the OECD). “Health care and the value of prevention”, OECD Observer, No 281, October 2010.
213. OECD 2009. Policy Responses to the Economic Crisis: Investing in innovation for long-term growth. OECD, June 2009.

110
214. Hon T Ryall, Minister of Health, Q&A, TVNZ, Sunday 3 October 2010.
215. SMO Commission. The Director-General of Health’s Commission on Competitive and Sustainable Terms and Conditions of Employment for Senior Medical and Dental Officers Employed by District Health Boards, Ministry of Health, June 2009.
216. Ibid
217. J Mountford, C Webb. “When Clinicians Lead”, Health International, No 9, 2009.
218. P Castro et al. “A healthier health care system for the United Kingdom,” McKinsey Quarterly, February 2008.
219. Ministerial Review Group. Meeting the Challenge. Annex 5: Commentary of Enhancing Clinical Leadership, July 2009
220. Ministerial Task Group on Clinical Leadership. In Good Hands – Transforming Clinical Governance in New Zealand, February 2009
221. I Powell. “Poor to mediocre performance by DHBs in clinical governance and leadership,” The Specialist, March 2011. ASMS.
222. R Gauld, S Horsburgh, J Brown. “The Clinical Governance Development Index: Results from a New Zealand Study”. BMJ Qual Saf doi:10.1136/bmjqs.2011.051482
223. D Gorman. “The disposition and mobility of medical practitioners in New Zealand”, NZMJ 4, Vol 124 No 1330; March 2011.
224. Ibid
225. Ministry of Health, Annual Report 2012.
226. HWNZ (2012). http://www.healthworkforce.govt.nz/our-work/workforce-service-forecasts
227. HWNZ (2012). http://healthworkforce.govt.nz/sites/all/files/WSR%20Process%20Map.pdf
228. DF Gorman, PM Brooks. “On solutions to the shortage of doctors in Australia and New Zealand,” Med J Aust 2009; 190 (3): 152-156
229. A Belich. “Physician Assistants: The final report on the Counties Manukau DHB demonstration”, The Specialist, Issue 91, ASMS, June 2012
230. M Head, S Trim, L Walker. Critical Review of the Pilot and Final Evaluation Report of the Counties Manukau District Health Board Demonstration Pilot, NZNO, June 2012
231. HWNZ. www.healthworkforce.govt.nz
232. Gastroenterology Society of New Zealand. Gastroenterology and Endoscopy Workforce: 2020 – a discussion paper.
233. HWNZ. www.healthworkforce.govt.nz
234. HWNZ. “Health Workforce New Zealand confirms New Zealand Centre of Excellence in Health Care Leadership”. Stakeholder announcement, 21 February 2011.
235. ASMS/DHBs (2010). Securing a Sustainable Senior Medical and Dental Officer Workforce in New Zealand: The Business Case. ASMS & DHBs.
236. Ibid
237. J Mountford, C Webb. “When clinicians lead”, Health International, No 9, 2009
238. C Ham, H Dickinson. Engaging Doctors in Leadership: What can we learn from international experience and research evidence? NHS Institute for Innovation and Improvement, 2008
239. D Gorman. “The disposition and mobility of medical practitioners in New Zealand”, NZMJ 4, Vol 124 No 1330; March 2011.
240. Ministerial Task Group on Clinical Leadership. In Good Hands – Transforming Clinical Governance in New Zealand, February 2009
241. ASMS & 21 DHBs. Time for Quality Agreement. Available at: www.asms.or.nz
242. Ministry of Health. Technical documentation on the 2009 update of the Ministry of Health Performance Assessment and Management Steering Group (PAM) Productivity Metric. Available at: www.moh.govt.nz/notebook/nbbooks.nsf/0/.../$FILE/ATTLLDXY
243. DHBNZ. Health Workforce Information Programme: DHB Base Data Reports, from June 2010.
244. Ministry of Health. Technical documentation on the 2009 update of the Ministry of Health Performance Assessment and Management Steering Group (PAM) Productivity Metric. Available at: www.moh.govt.nz/notebook/nbbooks.nsf/0/.../$FILE/ATTLLDXY
245. NZ Treasury. Treasury Report: Value for Money in Health – The DHB Sector, February 2005. Available at: www.treasury.govt.nz
246. Ministry of Health Annual Report 2011
247. NHS Confederation. What Is Productivity? NHS Confederation, 2006 London.
248. J Figueras, M McKee, et al. Health Systems, Health and Wealth: Assessing the Case for Investing in Health Systems. WHO 2008.
249. J Figueras, M McKee (eds). Health Systems, Health, Wealth and Societal Well-being. European Observatory on Health Systems and Policy series. Open University Press, Berkshire, England 2012 (pp 101-2)

THE PUBLIC HOSPITAL SPECIALIST WORKFORCE ASMS
111
250. A Simkins, “Health quality indicators and value of health: accounting for quality change,” presented at the OECD/ONS London workshop on productivity in health and education sectors, October 2006 http://www.oecd.org/dataoecd/24/16/37434465.pdf For more detail on the methodologies used by the Department of Health and York University, refer to: http://www.dh.gov.uk/en/Publicationsandstatistics/Publications/PublicationsPolicyAndGuidance/DH_4124266
251. J Douglas (2006). Measurement of Public Sector Output and Productivity: Adjusting for Quality. Treasury, November 2006.
252. Director-General’s Performance Assessment and Management (PAM) Steering Group. Productivity and efficiency in the delivery of public hospital services in New Zealand: Initial results from two approaches to measurement. Ministry of Health June 2007.
253. Ibid
254. DHBNZ. SFG Casemix Cost Weights Project Group (2005). New Zealand Casemix Framework for Publicly Funded Hospitals, DHBNZ, NZHIS, March 2005
255. Ministry of Health. Annual Reports for the Year Ending 30 June 2011 & June 12. Ministry of Health, October 2011 & 2012.
256. D Clark, R Singh. “Life events, stress appraisals, and hospital doctors’ mental health”, NZMJ Vol 117, No 1204, 22 October 2004.
257. Service Canada. Specialist Physicians Analytical Text. Available: http://www.servicecanada.gc.ca/eng/qc/job_futures/statistics/3111.shtml
258. Human Resource and Skills Development Canada. Labour Market Monitor: Alberta Health Service, July 2012
259. Commonwealth Fund International Health Policy Surveys. In Ministry of Health Annual Report 2012, p223.
260. RCPSC. Balancing the talent pool: Fixing the skills gap: Addressing existing labour shortages in high demand occupations. RCPSC brief to the Standing Committee on Human Resources, Skills and Social Development and the Status of Persons with Disabilities (HUMA), 7 May 2012.
261. N Esmail. “Canada’s physician supply”, Fraser Forum, Fraser Institute, March/April 2011.
262. CMA. A Doctor for Every Canadian – Better Planning for Canada’s Health Human Resources. CMA’s brief to the House of Commons Standing Committee on Human Resources, Skills and Social Development and the Status of Persons with Disabilities – Addressing Existing Labour Shortages in High-Demand Occupations, 9 May 2012.
263. N de Bono. “Foreign docs could get fast-tracked into Canada”. QMI Agency, 17 April 2012.
264. ASMS. Survey Summary, 29 July 2007.
265. ASMS. Medical Workforce Trends: Australia. A paper prepared for the joint ASMS-DHBs workshop as part of national DHB collective agreement (MECA) negotiations on 18 May 2010.
266. H Donnell, “Three-fold increases in doctors heading to Oz – recruiters,’ NZ Herald, 21 February 2011.
267. P Zurn, J-C Dumont. Health Workforce and International Migration: Can New Zealand Compete? OECD Health Working Paper No 33, 2008.
268. Health Workforce Australia. Australia’s Health Workforce Series: Doctors in Focus, 2012.
269. Ibid
270. AMWAC. Career Decision Making by Postgraduate Doctors. AMWAC Medical Careers Surveys, 2004: Key Findings. AMWAC Report 2005.3 December 2005
271. Health Workforce Australia. Health Workforce 2025: Doctors, Nurses and Midwives 2025 – Volume 1, March 2012
272. National Health Workforce Taskforce. Health Workforce in Australia and Factors for Current Shortages, KPMG, April 2009.
273. Health Workforce Australia. Health Workforce 2025: Doctors, Nurses and Midwives 2025 – Volume 1, March 2012.
274. The Parliament of the Commonwealth of Australia. Lost in the Labyrinth: Report on the inquiry into registration processes and support for overseas trained doctors, House of Representatives Standing Committee on Health and Ageing, March 2012.
275. L Hawthorne. International medical migration: what is the future for Australia? MJA Open 2012; 1 Suppl 3: 18-21, 23 July 2012.
276. DF Gorman, PM Brooks. ‘On solutions to the shortage of doctors in Australia and New Zealand,’ Med J Aust 2009; 190 (3): 152-156
277. Health Workforce Australia. Health Workforce 2025: Medical Specialties, Volume 3, November 2012.
278. Australian Government: Department of Immigration and Citizenship (2012). Skilled Occupations List. 1 July 2012. Available at http://www.immi.gov.au/skilled/_pdf/sol-schedule1.pdf
279. A Scott, J Li, The Effects of Medical Graduate Expansion in Australia. Health Workforce Australia, Final Report, March 2012.
280. M Metherell, “Teaching crisis for trainee doctors”, Sydney Morning Herald, 6 August 2012.

112