THE PRUDENTIAL SERIES FUND - fascore.com€¦ · The Prudential Series Fund, ... exploration and...
28
THE PRUDENTIAL SERIES FUND ANNUAL REPORT ‰ DECEMBER 31, 2011 Natural Resources Portfolio — Class II Shares This report is one of several that provides financial information about certain investment choices available under variable life insurance and variable annuity contracts. Based on the variable contract you own or the portfolios you invested in, you may receive additional reports that provide financial information on those investment choices. Please refer to your variable life insurance or variable annuity contract prospectus to determine which portfolios are available to you. Please note that this document may include prospectus supplements that are separate from and not a part of the annual report.
Transcript of THE PRUDENTIAL SERIES FUND - fascore.com€¦ · The Prudential Series Fund, ... exploration and...

THE PRUDENTIAL SERIES FUNDANNUAL REPORT ‰ DECEMBER 31, 2011
Natural Resources Portfolio — Class II Shares
This report is one of several that provides financial information aboutcertain investment choices available under variable life insurance andvariable annuity contracts. Based on the variable contract you own or theportfolios you invested in, you may receive additional reports that providefinancial information on those investment choices. Please refer to yourvariable life insurance or variable annuity contract prospectus todetermine which portfolios are available to you.
Please note that this document may include prospectus supplements thatare separate from and not a part of the annual report.

This report is only authorized for distribution when preceded or accompanied by a current prospectus. Investors should carefullyconsider the contract and the underlying portfolios’ investment objectives, risks, and charges and expenses before investing. Thecontract prospectus and the underlying portfolio prospectuses contain information on the investment objectives, risks, andcharges and expenses, as well as other important information. Read them carefully before investing or sending money.
The Prudential Series Fund offers two classes of shares in each Portfolio: Class I and Class II. Class I shares are sold only toseparate accounts of The Prudential Insurance Company of America, Pruco Life Insurance Company, and Pruco Life InsuranceCompany of New Jersey (collectively, Prudential) as investment options under variable life insurance and variable annuitycontracts (the Contracts). (A separate account keeps the assets supporting certain insurance contracts separate from thegeneral assets and liabilities of the insurance company.) Class II shares are offered only to separate accounts of non-Prudentialinsurance companies for the same types of Contracts.
A description of the Fund’s proxy voting policies and procedures is available, without charge, upon request. Owners of variableannuity contracts should call (888)778-2888, and owners of variable life insurance contracts should call (800)778-2255 toobtain descriptions of the Fund’s proxy voting policies and procedures. The description is also available on the website of theSecurities and Exchange Commission (the Commission) at www.sec.gov. Information regarding how the Fund voted proxiesrelating to portfolio securities during the most recent 12-month period ended June 30 is available on the website of theCommission at www.sec.gov and on the Fund’s website.
The Fund files with the Commission a complete listing of portfolio holdings as of its first and third quarter-end on Form N-Q.Form N-Q is available on the Commission’s website at www.sec.gov or by visiting the Commission’s Public Reference Room. Formore information on the Commission’s Public Reference Room, please visit the Commission’s website or call(800)SEC-0330. Form N-Q is also available on the Fund’s website at www.prudential.com or by calling the telephone numbersreferenced above, for variable annuity and variable life insurance contract owners.
The Fund’s Statement of Additional Information contains additional information about the Fund’s Trustees and is availablewithout charge upon request by calling (888)778-2888.
The Prudential Series FundLetter to Contract Owners
Annual Report December 31, 2011
� D E A R C O N T R A C T O W N E R
At Prudential, our primary objective is to help investors achieve and maintain long-term financial success. This Prudential Series Fund annual report outlines our efforts toachieve this goal. We hope you find it informative and useful.
Prudential has been building on a heritage of success for more than 135 years. The qualityof our businesses and risk diversification has enabled us to manage effectively throughvolatile markets over time. We believe the array of our products provides a highlyattractive value proposition to clients like you who are focused on financial security.
Your financial professional is the best resource to help you make the most informedinvestment decisions. Together, you can build a diversified investment portfolio that alignswith your long-term financial goals. Please keep in mind that diversification and assetallocation strategies do not assure a profit or protect against loss in declining markets.
Thank you for selecting Prudential as one of your financial partners. We value yourtrust and appreciate the opportunity to help you achieve financial security.
Sincerely,
Stephen PelletierPresident,The Prudential Series Fund January 31, 2012
P R E S I D E N TS T E P H E N P E L L E T I E R

[THIS PAGE INTENTIONALLY LEFT BLANK]

The Prudential Series Fund, Natural Resources Portfolio December 31, 2011
Investment Manager’s Report - As of December 31, 2011
Average Annual Total Returns 1-Year 5-Year 10-YearSince
Inception
Portfolio: Class I -19.03% 5.05% 17.56% N/A
Portfolio: Class II -19.35 4.63 N/A 13.27%
Lipper (VUF) Natural Resources Funds Index -13.07 2.14 N/A 9.57
S&P 500 Index 2.09 -0.25 2.92 3.40
Past performance does not guarantee future returns. The investment return and principal value of aninvestment will fluctuate, so that an investor’s shares, when redeemed, may be worth more or less thantheir original cost. Current performance may be lower or higher than the past performance data quoted.Portfolio (Class II) inception: 4/28/2005. Portfolio performance is net of investment fees and fund expenses,but not product charges, which, if included, would significantly lower the performance quoted. Unless notedotherwise, Index returns reflect performance beginning the closest month-end date to the Portfolio’s inception(Class II). Performance figures may reflect fee waivers and/or expense reimbursements. In the absence ofsuch fee waivers and/or expense reimbursements, total returns would be lower.
$10,000 INVESTED OVER 10 YEARS1
$50,418 Portfolio: Class I$13,333 S&P 500 Index
$80,000$70,000
$50,000$60,000
$40,000
$20,000$30,000
$10,000$0
12/31
/11
12/31
/10
12/31
/09
12/31
/08
12/31
/07
12/31
/06
12/31
/05
12/31
/04
12/31
/03
12/31
/02
12/31
/01
For the year ended December 31, 2011, the Natural Resources Portfolio Class I shares declined by 19.03% and Class II shares declined by 19.35%.
The Portfolio’s subadviser is Jennison Associates LLC (Jennison). The Portfolio’s investment objective is long-term growth of capital.
The Portfolio underperformed the broad market indexes as well the Lipper (VUF) Natural Resources Fund Index (Index), which declined by 13.07%.After reaching a high in April, U.S. equity markets declined for five consecutive months. But double-digit performance in the fourth quarter drove theS&P 500 Index to a 2.09% gain. Seven out of 10 S&P 500 sectors advanced, although industrials, materials, and financials declined.
Much of the Portfolio’s underperformance relative to the broader market reflected the year’s extraordinary commodity price volatility, largelyattributable to investor anxiety over the global economic outlook. Performance relative to the Index was hurt by a stock allocation away from the moredefensive, large-cap integrated oil and gas producers and a greater weighting in the materials sector.
Among the Portfolio’s detractors for the period, energy sector holdings outnumbered materials sector detractors. Two of the Portfolio’s energyexploration and production (E&P) holdings suffered from unexpected reserve problems. Pacific Rubiales, a Canada-based developer of heavy crude oiland natural gas in Colombia and Peru, faced challenges after disappointing drilling results in the spring. Shares of OGXPetroleo e Gas Participacoes,Brazil’s largest independent E&P Company, suffered as the company fell short of expectations. Nevertheless, Jennison believes the company is on theverge of a multi-year growth trajectory that is currently underappreciated. Alpha Natural Resources, another E&P detractor, experienced mergerintegration problems from its acquisition of coal-mining giant Massy Energy.
Falling metals prices and a strengthening dollar hurt metals and mining stocks in general, especially toward the end of the period. Freeport-McMoRan Copper & Gold declined in tandem. Jennison continues to like Freeport for its strong management team that has executed well throughvolatile commodity markets.
Energy names dominated the year’s key contributors, which included E&P names, such as Cabot Oil & Gas and Noble Energy, as well as PetrohawkEnergy, a U.S.-based independent natural gas producer acquired for a significant premium by Anglo-Australian mining giant BHP Billiton. Jennisonbelieves Cabot Oil & Gas has a high-quality asset base and further upside potential from its Marcellus Shale holdings. Independent oil and gascompany Noble Energy is now the largest natural gas producer in Israel, in addition to onshore U.S. operations and deepwater development projectsaround the world. Jennison sees Noble as a multi-year growth story with strong prospects.
Randgold Resources, a gold producer, was the only non-energy name among the year’s noteworthy contributors. Jennison regards the company’ssuccessful weathering of a coup in the Ivory Coast as evidence of its solid management.
The Portfolio no longer holds a position in Petrohawk Energy.
Prudential Investments LLC (PI), an indirect, wholly owned subsidiary of Prudential Financial, Inc., serves as the investment manager for the Fund.
1 The graph is based on the performance of Class I shares. Performance of Class II shares will be lower due to differences in the fee structure. Class II shares haveassociated 12b-1 and administrative fees at an annual rate of 0.25% and 0.15%, respectively, of the average daily net assets of the Class II shares.
The Lipper Variable Underlying Funds (VUF) Natural Resources Funds Index is calculated by Lipper Analytical Services, Inc. and consists of an equal dollar-weightedcomposite of the 10 largest funds in the Lipper VUF Natural Resources Fund classification. The index is rebalanced quarterly. Natural Resources Funds are deemed asfunds that invest primarily in the equity securities of domestic and foreign companies engaged in natural resources. S&P 500 Index is an unmanaged, market value-weighted index of 500 stocks generally representative of the broad stock market. These returns are net of investment fees and fund expenses, but not product charges.Investors cannot invest directly in a market index or average. For a complete list of holdings, refer to the Schedule of Investments section of this report.
Jennison Associates LLC is a registered investment advisor and a Prudential Financial company.

The Prudential Series FundPresentation of Portfolio Holdings — unaudited
December 31, 2011
Natural Resources
Five Largest Holdings (% of Net Assets)
Noble Energy, Inc. 2.8%
National Oilwell Varco, Inc. 2.8%
Concho Resources, Inc. 2.7%
Cameron International Corp. 2.5%
Schlumberger Ltd. 2.3%
For a complete list of holdings, please refer to the Schedule of Investments section of this report. Holdings reflect only long-terminvestments. Holdings/Issues/Industries/Sectors are subject to change.

The Prudential Series FundFees and Expenses — unaudited
December 31, 2011
As a contract owner investing in Portfolios of the Fund through a variable annuity or variable life contract, you incur ongoing costs,including management fees, and other Portfolio expenses. This example is intended to help you understand your ongoing costs (indollars) of investing in the Fund and to compare these costs with the ongoing costs of investing in other investment options. Thisexample does not reflect fees and charges under your variable annuity or variable life contract. If contract charges were included, thecosts shown below would be higher. Please consult the prospectus for your contract for more information about contract feesand charges.
The example is based on an investment of $1,000 invested at the beginning of the period and held for the entire period July 1, 2011through December 31, 2011.
Actual ExpensesThe first line of the table below provides information about actual account values and actual expenses. You may use this information,together with the amount you invested, to estimate the Portfolio expenses that you paid over the period. Simply divide your accountvalue by $1,000 (for example, an $8,600 account value divided by $1,000 = 8.6), then multiply the result by the number in the firstline under the heading entitled “Expenses Paid During Period” to estimate the Portfolio expenses you paid on your account during thisperiod. As noted above, the table does not reflect variable contract fees and charges.
Hypothetical Example for Comparison PurposesThe second line of the table below provides information about hypothetical account values and hypothetical expenses based on thePortfolio’s actual expense ratio and an assumed rate of return of 5% per year before expenses, which is not the Portfolio’s actual return.The hypothetical account values and expenses may not be used to estimate the actual ending account balance or expenses you paidfor the period. You may use this information to compare the ongoing costs of investing in the Portfolio and other investment options.To do so, compare this 5% hypothetical example with the 5% hypothetical examples that appear in the shareholder reports of the otherinvestment options.
Please note that the expenses shown in the table are meant to highlight your ongoing Portfolio costs only and do not reflect anycontract fees and charges, such as sales charges (loads), insurance charges or administrative charges. Therefore the second line of thetable is useful to compare ongoing investment option costs only, and will not help you determine the relative total costs of owningdifferent contracts. In addition, if these contract fee and charges were included, your costs would have been higher.
The Prudential Series Fund Portfolios
BeginningAccount Value
July 1, 2011
EndingAccount Value
December 31, 2011
Annualized ExpenseRatio based on theSix-Month period
Expenses PaidDuring the
Six-Month period*
Natural Resources (Class I) Actual $1,000.00 $ 818.50 0.51% $2.34
Hypothetical $1,000.00 $1,022.63 0.51% $2.60
Natural Resources (Class II) Actual $1,000.00 $ 816.90 0.91% $4.17
Hypothetical $1,000.00 $1,020.62 0.91% $4.63
* Portfolio expenses (net of fee waivers or subsidies, if any) for each share class are equal to the annualized expense ratio for eachshare class (provided in the table), multiplied by the average account value over the period, multiplied by the 184 days in the six-month period ended December 31, 2011, and divided by the 365 days in the Portfolio’s fiscal year ended December 31, 2011 (toreflect the six-month period). Expenses presented in the table include the expenses of any underlying portfolios in which thePortfolio may invest.

[THIS PAGE INTENTIONALLY LEFT BLANK]
NATURAL RESOURCES PORTFOLIO
SCHEDULE OF INVESTMENTS December 31, 2011
LONG-TERM INVESTMENTS — 98.2%
COMMON STOCKS — 97.9% SharesValue
(Note 2)
Chemicals — 1.6%Celanese Corp., Ser. A . . . . . . . . . . . . . . 14,925 $ 660,730Mosaic Co. (The) . . . . . . . . . . . . . . . . . . . 177,070 8,929,640Neo Material Technologies, Inc.
(Canada)* . . . . . . . . . . . . . . . . . . . . . . . 277,051 1,993,407Potash Corp. of Saskatchewan, Inc. . . . 112,897 4,660,388
16,244,165
Construction Materials — 1.7%Holcim Ltd. (Switzerland) . . . . . . . . . . . . 22,316 1,193,846Indocement Tunggal Prakarsa Tbk PT
(Indonesia) . . . . . . . . . . . . . . . . . . . . . . 3,831,451 7,204,438Semen Gresik Persero Tbk PT
(Indonesia) . . . . . . . . . . . . . . . . . . . . . . 6,332,998 7,997,003Vulcan Materials Co.(a) . . . . . . . . . . . . . 4,815 189,470
16,584,757
Energy Equipment & Services — 22.5%Baker Hughes, Inc. . . . . . . . . . . . . . . . . . 21,184 1,030,390Cameron International Corp.* . . . . . . . . 497,006 24,447,725Core Laboratories NV(a) . . . . . . . . . . . . 52,391 5,969,955Dresser-Rand Group, Inc.* . . . . . . . . . . . 200,898 10,026,819Dril-Quip, Inc.* . . . . . . . . . . . . . . . . . . . . . 259,815 17,101,023Ensco PLC (United Kingdom), ADR . . . 202,429 9,497,969FMC Technologies, Inc.*(a) . . . . . . . . . . 337,035 17,603,338Halliburton Co. . . . . . . . . . . . . . . . . . . . . . 627,567 21,657,337Helmerich & Payne, Inc. . . . . . . . . . . . . . 195,533 11,411,306Key Energy Services, Inc.* . . . . . . . . . . . 671,621 10,389,977Lufkin Industries, Inc. . . . . . . . . . . . . . . . 129,100 8,689,721Nabors Industries Ltd.* . . . . . . . . . . . . . . 330,004 5,722,269National Oilwell Varco, Inc. . . . . . . . . . . 406,837 27,660,848Noble Corp. . . . . . . . . . . . . . . . . . . . . . . . 35,922 1,085,563OSX Brasil SA (Brazil), 144A* . . . . . . . . 409,350 2,523,804Patterson-UTI Energy, Inc. . . . . . . . . . . . 536,451 10,718,291Rowan Cos., Inc.* . . . . . . . . . . . . . . . . . . 315,790 9,577,911Saipem SpA (Italy) . . . . . . . . . . . . . . . . . 31,679 1,346,865Schlumberger Ltd. . . . . . . . . . . . . . . . . . . 341,201 23,307,440Technip SA (France) . . . . . . . . . . . . . . . . 13,999 1,315,741Tenaris SA (Luxembourg), ADR . . . . . . 32,067 1,192,251Weatherford International Ltd.* . . . . . . . 77,771 1,138,567
223,415,110
Food Products — 0.2%Adecoagro SA* . . . . . . . . . . . . . . . . . . . . 256,842 2,124,083Agrenco Ltd. (Brazil), 144A* . . . . . . . . . . 1,166,700 93,824
2,217,907
Metals & Mining — 27.1%African Rainbow Minerals Ltd.
(South Africa) . . . . . . . . . . . . . . . . . . . . 302,040 6,398,082Agnico-Eagle Mines Ltd. . . . . . . . . . . . . . 36,091 1,310,825Alacer Gold Corp.* . . . . . . . . . . . . . . . . . 818,604 8,429,110Alamos Gold, Inc. (Canada) . . . . . . . . . . 385,128 6,634,598Alcoa, Inc. . . . . . . . . . . . . . . . . . . . . . . . . 106,847 924,227AXMIN, Inc. (Canada)* . . . . . . . . . . . . . . 1,556,200 68,740Barrick Gold Corp. . . . . . . . . . . . . . . . . . . 27,131 1,227,678BHP Billiton Ltd. (Australia), ADR(a) . . . 197,177 13,926,612Cia de Minas Buenaventura SA (Peru),
ADR . . . . . . . . . . . . . . . . . . . . . . . . . . . 302,482 11,597,160Cliffs Natural Resources, Inc. . . . . . . . . . 296,419 18,481,725
COMMON STOCKS
(continued) SharesValue
(Note 2)
Metals & Mining (continued)Detour Gold Corp. (Canada),* . . . . . . . . 153,028 $ 3,777,820Eldorado Gold Corp. (Canada) . . . . . . . 1,158,821 15,947,652European Goldfields Ltd. (Canada)* . . . 529,054 6,169,484First Quantum Minerals Ltd.
(Canada) . . . . . . . . . . . . . . . . . . . . . . . 951,315 18,722,813First Uranium Corp. (South Africa),
144A* . . . . . . . . . . . . . . . . . . . . . . . . . . 400,000 64,785First Uranium Corp. (South Africa)* . . . . 61,100 9,896Freeport-McMoRan Copper & Gold,
Inc. . . . . . . . . . . . . . . . . . . . . . . . . . . . . 437,303 16,088,377Gabriel Resources Ltd. (Canada)*(a) . . 600,701 3,702,972Gold Reserve, Inc. (NYSE)* . . . . . . . . . . 121,100 339,080Gold Reserve, Inc. (TSX)* . . . . . . . . . . . 124,300 348,955Goldcorp, Inc. . . . . . . . . . . . . . . . . . . . . . 26,892 1,189,971Highland Gold Mining Ltd. (United
Kingdom) . . . . . . . . . . . . . . . . . . . . . . . 195,600 571,077Iamgold Corp. (Canada) . . . . . . . . . . . . . 70,974 1,127,224Iluka Resources Ltd. (Australia) . . . . . . . 68,939 1,092,916Impala Platinum Holdings Ltd.
(South Africa), ADR . . . . . . . . . . . . . . . 341,190 7,031,926Kinross Gold Corp. . . . . . . . . . . . . . . . . . 825,171 9,406,949Nevsun Resources Ltd. (Canada) . . . . . 989,556 5,497,803Newcrest Mining Ltd. (Australia) . . . . . . 304,977 9,233,126Newmont Mining Corp. . . . . . . . . . . . . . . 17,803 1,068,358Northern Dynasty Minerals Ltd.*(a) . . . . 399,636 2,413,801Nucor Corp. . . . . . . . . . . . . . . . . . . . . . . . 30,099 1,191,017Pan American Silver Corp. (Canada) . . 118,954 2,601,517Pan American Silver Corp. . . . . . . . . . . . 262,519 5,725,539Pilot Gold, Inc. (Canada)* . . . . . . . . . . . . 110,875 140,396Platinum Group Metals Ltd.* . . . . . . . . . 1,234,422 1,073,947Platmin Ltd., Private Placement
(South Africa), 144A(original cost $1,102,975;purchased 11/27/2007)*(b)(c) . . . . . . 129,100 17,108
Quadra FNX Mining Ltd. (Canada)* . . . 222,658 3,295,885Randgold Resources Ltd. (Jersey
Islands), ADR . . . . . . . . . . . . . . . . . . . . 203,703 20,798,076Reliance Steel & Aluminum Co. . . . . . . . 175,677 8,553,713Rio Tinto PLC (United Kingdom),
ADR(a) . . . . . . . . . . . . . . . . . . . . . . . . . 224,655 10,990,123Seabridge Gold, Inc.*(a) . . . . . . . . . . . . . 123,150 1,983,946SEMAFO, Inc. (Canada), 144A . . . . . . . 1,126,530 7,298,256Silver Wheaton Corp. . . . . . . . . . . . . . . . 312,448 9,048,494Southern Copper Corp. . . . . . . . . . . . . . . 162,388 4,900,870Tahoe Resources, Inc., 144A* . . . . . . . . 116,000 2,013,134Tahoe Resources, Inc.* . . . . . . . . . . . . . 54,907 952,889Teck Resources Ltd. (Canada) . . . . . . . 8,313 293,026United States Steel Corp.(a) . . . . . . . . . 34,287 907,234Vedanta Resources PLC (United
Kingdom) . . . . . . . . . . . . . . . . . . . . . . . 9,960 156,998Walter Energy, Inc. . . . . . . . . . . . . . . . . . 16,130 976,833Western Areas NL (Australia) . . . . . . . . 354,812 1,847,166Xstrata PLC (Switzerland) . . . . . . . . . . . 740,408 11,245,481Yamana Gold, Inc. . . . . . . . . . . . . . . . . . 70,750 1,039,317
269,854,707
SEE NOTES TO FINANCIAL STATEMENTS.
A1
NATURAL RESOURCES PORTFOLIO (continued)
SCHEDULE OF INVESTMENTS December 31, 2011
COMMON STOCKS(continued) Shares
Value(Note 2)
Oil, Gas & Consumable Fuels — 44.8%Adaro Energy TBK PT (Indonesia) . . . 32,472,696 $ 6,338,756Advantage Oil & Gas Ltd. REG D
(Canada)* . . . . . . . . . . . . . . . . . . . . . . 332,000 1,381,772Anadarko Petroleum Corp. . . . . . . . . . . 299,291 22,844,882Apache Corp. . . . . . . . . . . . . . . . . . . . . 165,409 14,982,747Arch Coal, Inc. . . . . . . . . . . . . . . . . . . . . 51,431 746,264Bankers Petroleum Ltd.
(Canada)*(a) . . . . . . . . . . . . . . . . . . . 1,036,124 4,515,721BG Group PLC (United Kingdom) . . . . 608,421 13,006,142Bill Barrett Corp.* . . . . . . . . . . . . . . . . . 205,774 7,010,720Bonavista Energy Corp. (Canada) . . . . 173,994 4,452,538Cabot Oil & Gas Corp. . . . . . . . . . . . . . 211,260 16,034,634Cairn Energy PLC (United
Kingdom)* . . . . . . . . . . . . . . . . . . . . . 1,212,864 4,997,093Cameco Corp. (Canada) . . . . . . . . . . . 39,474 713,341Canadian Oil Sands Ltd. (Canada) . . . 48,946 1,117,050Carrizo Oil & Gas, Inc.*(a) . . . . . . . . . . 250,899 6,611,189Chesapeake Energy Corp. . . . . . . . . . . 42,582 949,153Cimarex Energy Co. . . . . . . . . . . . . . . . 190,876 11,815,224Cobalt International Energy, Inc.* . . . . 522,811 8,114,027Concho Resources, Inc.* . . . . . . . . . . . 283,963 26,621,531Consol Energy, Inc. . . . . . . . . . . . . . . . . 298,790 10,965,593Denbury Resources, Inc.*(a) . . . . . . . . 692,281 10,453,443Devon Energy Corp. . . . . . . . . . . . . . . . 19,705 1,221,710Energy XXI Bermuda Ltd.*(a) . . . . . . . . 148,738 4,741,767EOG Resources, Inc. . . . . . . . . . . . . . . 144,800 14,264,248EQT Corp. . . . . . . . . . . . . . . . . . . . . . . . 19,910 1,090,869Far East Energy Corp.* . . . . . . . . . . . . 4,866,388 1,021,941FX Energy, Inc.* . . . . . . . . . . . . . . . . . . 199,243 956,366Hess Corp. . . . . . . . . . . . . . . . . . . . . . . . 172,087 9,774,542HollyFrontier Corp. . . . . . . . . . . . . . . . . 600,973 14,062,768HRT Participacoes EM Petroleo SA
(Brazil)* . . . . . . . . . . . . . . . . . . . . . . . 2,476 753,984HRT Particpacoes EM Petroleo SA
(Brazil), 144A* . . . . . . . . . . . . . . . . . . 3,700 1,126,712Kodiak Oil & Gas Corp.* . . . . . . . . . . . . 725,650 6,893,675Kosmos Energy Ltd.* . . . . . . . . . . . . . . 194,768 2,387,856Laredo Petroleum Holdings, Inc.* . . . . 118,753 2,648,192Linc Energy Ltd. (Australia), 144A* . . . 1,570,292 1,766,701Marathon Petroleum Corp. . . . . . . . . . . 387,176 12,889,089MEG Energy Corp. (Canada),
144A* . . . . . . . . . . . . . . . . . . . . . . . . . 131,600 5,369,926Murphy Oil Corp. . . . . . . . . . . . . . . . . . . 24,339 1,356,656Newfield Exploration Co.* . . . . . . . . . . . 184,639 6,966,429Niko Resources Ltd. (Canada) . . . . . . . 70,958 3,359,317Noble Energy, Inc. . . . . . . . . . . . . . . . . 297,508 28,081,780Occidental Petroleum Corp. . . . . . . . . . 221,374 20,742,744OGX Petroleo e Gas Participacoes SA
(Brazil)* . . . . . . . . . . . . . . . . . . . . . . . 1,813,217 13,240,057Oil Search Ltd. (Papua New
Guinea) . . . . . . . . . . . . . . . . . . . . . . . 1,026,146 6,559,627Pacific Rubiales Energy Corp.
(Canada) . . . . . . . . . . . . . . . . . . . . . . 589,576 10,839,518Pioneer Natural Resources Co. . . . . . . 12,948 1,158,587Plains Exploration & Production
Co.* . . . . . . . . . . . . . . . . . . . . . . . . . . . 35,493 1,303,303QGEP Participacoes SA (Brazil)(b) . . . 156,526 1,384,629
COMMON STOCKS(continued) Shares
Value(Note 2)
Oil, Gas & Consumable Fuels (continued)QGEP Participacoes SA (Brazil),
144A(b) . . . . . . . . . . . . . . . . . . . . . . . 413,300 $ 3,656,051Quicksilver Resources, Inc.*(a) . . . . . . 657,812 4,413,919Range Resources Corp. . . . . . . . . . . . . 17,214 1,066,235Rosetta Resources, Inc.* . . . . . . . . . . . 206,491 8,982,359Sanchez Energy Corp.*(a) . . . . . . . . . . 147,400 2,544,124Southwestern Energy Co.* . . . . . . . . . . 496,262 15,850,608Suncor Energy, Inc. . . . . . . . . . . . . . . . 429,597 12,385,282Sunoco, Inc. . . . . . . . . . . . . . . . . . . . . . . 28,793 1,181,089Talisman Energy, Inc. . . . . . . . . . . . . . . 979,875 12,493,406Trident Resources Corp., Private
Placement(original cost $9,770,532;purchased 6/30/2010)*(b)(c) . . . . . . 24,233 11,941,108
Ultra Petroleum Corp.* . . . . . . . . . . . . . 34,840 1,032,309Whiting Petroleum Corp.* . . . . . . . . . . . 304,504 14,217,292Williams Cos., Inc. (The) . . . . . . . . . . . 8,718 287,868Woodside Petroleum Ltd.
(Australia) . . . . . . . . . . . . . . . . . . . . . . 27,885 873,305Zodiac Exploration, Inc.
(Canada)*(b) . . . . . . . . . . . . . . . . . . . 4,820,909 1,514,297Zodiac Exploration, Inc.—D Shares
(Canada)*(b) . . . . . . . . . . . . . . . . . . . 11,600,000 3,643,681
445,717,746
TOTAL COMMON STOCKS(cost $732,033,341) . . . . . . . . . . . . . . . . . . . . . . . . . . 974,034,392
PREFERRED STOCK — 0.3%Metals & Mining
Iron Co./Manabi, Private Placement,144A(original cost $3,660,000;purchased 05/25/2011)*(b)(c) . . . . . 3,660 3,180,742
Units
RIGHTOil, Gas & Consumable Fuels
Trident Resources Corp. CVR, PrivatePlacement(original cost $0; purchased06/30/2010)*(b)(c) . . . . . . . . . . . . . . . 9,007 —
WARRANTMetals & Mining
Crystallex International Corp.(Canada), Private Placementexpiring 11/04/14 (original cost $0;purchased 11/04/2009)*(b)(c) . . . . . 221,350 —
TOTAL LONG-TERM INVESTMENTS(cost $735,693,341) . . . . . . . . . . . . . . . . . . . . . . . . . . 977,215,134
SEE NOTES TO FINANCIAL STATEMENTS.
A2

NATURAL RESOURCES PORTFOLIO (continued)
SCHEDULE OF INVESTMENTS December 31, 2011
SHORT-TERMINVESTMENT — 6.2% Shares
Value(Note 2)
Affiliated Money Market Mutual FundPrudential Investment Portfolios 2 —
Prudential Core Taxable MoneyMarket Fund(cost $61,182,312; includes$43,202,233 of cash collateralreceived for securities on loan)(Note 4)(d)(e) . . . . . . . . . . . . . . . . . . . . 61,182,312 $ 61,182,312
TOTAL INVESTMENTS — 104.4%(cost $796,875,653) . . . . . . . . . . . . . . . . . . . . . . . . . . 1,038,397,446
LIABILITIES IN EXCESS OFOTHER ASSETS — (4.4)% . . . . . . . . . . . . . . . . . . . . (43,911,158)
NET ASSETS — 100.0% . . . . . . . . . . . . . . . . . . . . . . . $ 994,486,288
The following abbreviations are used in portfolio descriptions:
144A Security was purchased pursuant to Rule 144A underthe Securities Act of 1933 and may not be resoldsubject to that rule except to qualified institutionalbuyers. Unless otherwise noted, 144A securities aredeemed to be liquid.
ADR American Depositary ReceiptCVR Contingent Value RightsNYSE New York Stock ExchangeTSX Toronto Stock Exchange
* Non-income producing security.
(a) All or a portion of security is on loan. The aggregate market valueof such securities, including those sold and pending settlement, is$42,183,720; cash collateral of $43,202,233 (included in liabilities)was received with which the Portfolio purchased highly liquid short-term investments.
(b) Indicates a security that has been deemed illiquid.
(c) Indicates a restricted security; the aggregate original cost of suchsecurities is $14,533,507. The aggregate value of $15,138,958 isapproximately 1.5% of net assets.
(d) Represents security, or a portion thereof, purchased with cashcollateral received for securities on loan.
(e) Prudential Investments LLC, the manager of the Portfolio, alsoserves as manager of the Prudential Investment Portfolios 2-Prudential Core Taxable Money Market Fund.
Various inputs are used in determining the value of the Portfolio’sinvestments. These inputs are summarized in the three broad levelslisted below.
Level 1—quoted prices generally for securities actively traded on aregulated securities exchange and for open-end mutual fundswhich are trade at daily net asset value.
Level 2—other significant observable inputs (including, but not limitedto, quoted prices for similar securities, interest rates,prepayment speeds foreign currency exchange rates, andamortized cost) generally for debt securities, swaps, forwardforeign currency contracts and for foreign stocks priced usingvendor modeling tools.
Level 3—significant unobservable inputs for securities valued inaccordance with Board approved fair valuation procedures.
The following is a summary of the inputs used as of December 31,2011 in valuing such portfolio securities:
Level 1 Level 2 Level 3
Investments inSecurities
Common Stocks . . . . . . . . $ 962,076,176 $ — $11,958,216Preferred Stock . . . . . . . . . — — 3,180,742Right . . . . . . . . . . . . . . . . . . — — —Warrant . . . . . . . . . . . . . . . — — —Affiliated Money Market
Mutual Fund . . . . . . . . . . 61,182,312 — —
Total . . . . . . . . . . . . . . . . . . $1,023,258,488 $ — $15,138,958
The following is a reconciliation of assets in which significantunobservable inputs (Level 3) were used in determining fair value:
CommonStocks
PreferredStocks
Balance as of 12/31/10 . . . . . . . . . . . . . . $14,313,416 $ —Realized gain (loss) . . . . . . . . . . . . . . . . — —Change in unrealized appreciation
(depreciation)* . . . . . . . . . . . . . . . . . . (1,658,285) (479,258)Purchases . . . . . . . . . . . . . . . . . . . . . . . . — 3,660,000Sales . . . . . . . . . . . . . . . . . . . . . . . . . . . . — —Transfers into Level 3 . . . . . . . . . . . . . . 115,558 —Transfers out of Level 3 . . . . . . . . . . . . . (812,473) —
Balance as of 12/31/11 . . . . . . . . . . . . . . $11,958,216 $3,180,742
* Of which $(3,124,960) was included in Net Assets relating tosecurities held at the reporting period end.
It is the Portfolio’s policy to recognize transfers in and transfers out atthe fair value as of the beginning of period. At the reporting period end,there was one common stock security transferred from Level 3 intoLevel 1 as a result of the resumption of pricing available on a majorexchange and there was one common stock security transferred intoLevel 3 as a result of the security being delisted from a major exchange.
The industry classification of portfolio holdings and liabilities in excessof other assets shown as a percentage of net assets as ofDecember 31, 2011 were as follows:
Oil, Gas & Consumable Fuels . . . . . . . . . . . . . . . . . . . . . . . . . . 44.8%Metals & Mining . . . . . . . . . . . . . . . . . . . . . . . . . . . . . . . . . . . . . 27.4Energy Equipment & Services . . . . . . . . . . . . . . . . . . . . . . . . . 22.5Affiliated Money Market Mutual Fund (including 4.3% of
collateral received for securities on loan) . . . . . . . . . . . . . . . 6.2Construction Materials . . . . . . . . . . . . . . . . . . . . . . . . . . . . . . . . 1.7Chemicals . . . . . . . . . . . . . . . . . . . . . . . . . . . . . . . . . . . . . . . . . . 1.6Food Products . . . . . . . . . . . . . . . . . . . . . . . . . . . . . . . . . . . . . . 0.2
104.4Liabilities in excess of other assets . . . . . . . . . . . . . . . . . . . . . (4.4)
100.0%
SEE NOTES TO FINANCIAL STATEMENTS.
A3
NATURAL RESOURCES PORTFOLIO (continued)
SCHEDULE OF INVESTMENTS December 31, 2011
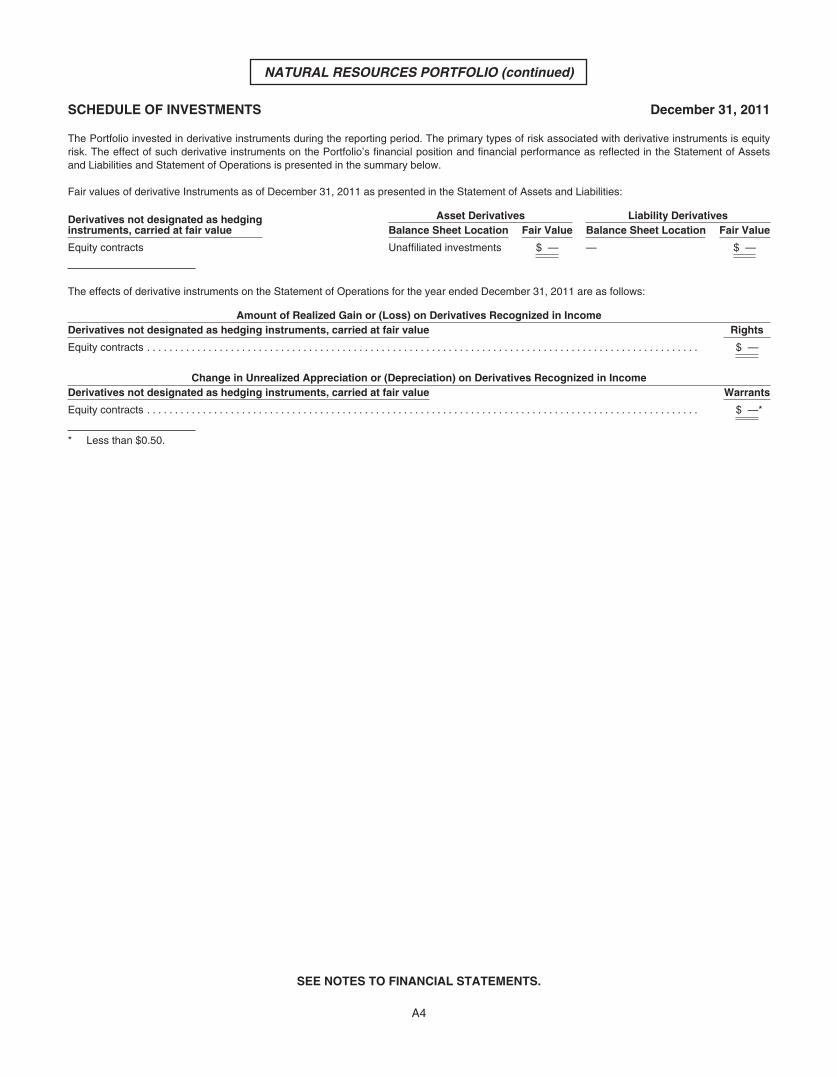
The Portfolio invested in derivative instruments during the reporting period. The primary types of risk associated with derivative instruments is equityrisk. The effect of such derivative instruments on the Portfolio’s financial position and financial performance as reflected in the Statement of Assetsand Liabilities and Statement of Operations is presented in the summary below.
Fair values of derivative Instruments as of December 31, 2011 as presented in the Statement of Assets and Liabilities:
Derivatives not designated as hedginginstruments, carried at fair value
Asset Derivatives Liability DerivativesBalance Sheet Location Fair Value Balance Sheet Location Fair Value
Equity contracts Unaffiliated investments $ — — $ —
The effects of derivative instruments on the Statement of Operations for the year ended December 31, 2011 are as follows:
Amount of Realized Gain or (Loss) on Derivatives Recognized in IncomeDerivatives not designated as hedging instruments, carried at fair value Rights
Equity contracts . . . . . . . . . . . . . . . . . . . . . . . . . . . . . . . . . . . . . . . . . . . . . . . . . . . . . . . . . . . . . . . . . . . . . . . . . . . . . . . . . . . . . . . . . . . . . . . . . . . $ —
Change in Unrealized Appreciation or (Depreciation) on Derivatives Recognized in IncomeDerivatives not designated as hedging instruments, carried at fair value Warrants
Equity contracts . . . . . . . . . . . . . . . . . . . . . . . . . . . . . . . . . . . . . . . . . . . . . . . . . . . . . . . . . . . . . . . . . . . . . . . . . . . . . . . . . . . . . . . . . . . . . . . . . . . $ —*
* Less than $0.50.
SEE NOTES TO FINANCIAL STATEMENTS.
A4
NATURAL RESOURCES PORTFOLIO (continued)
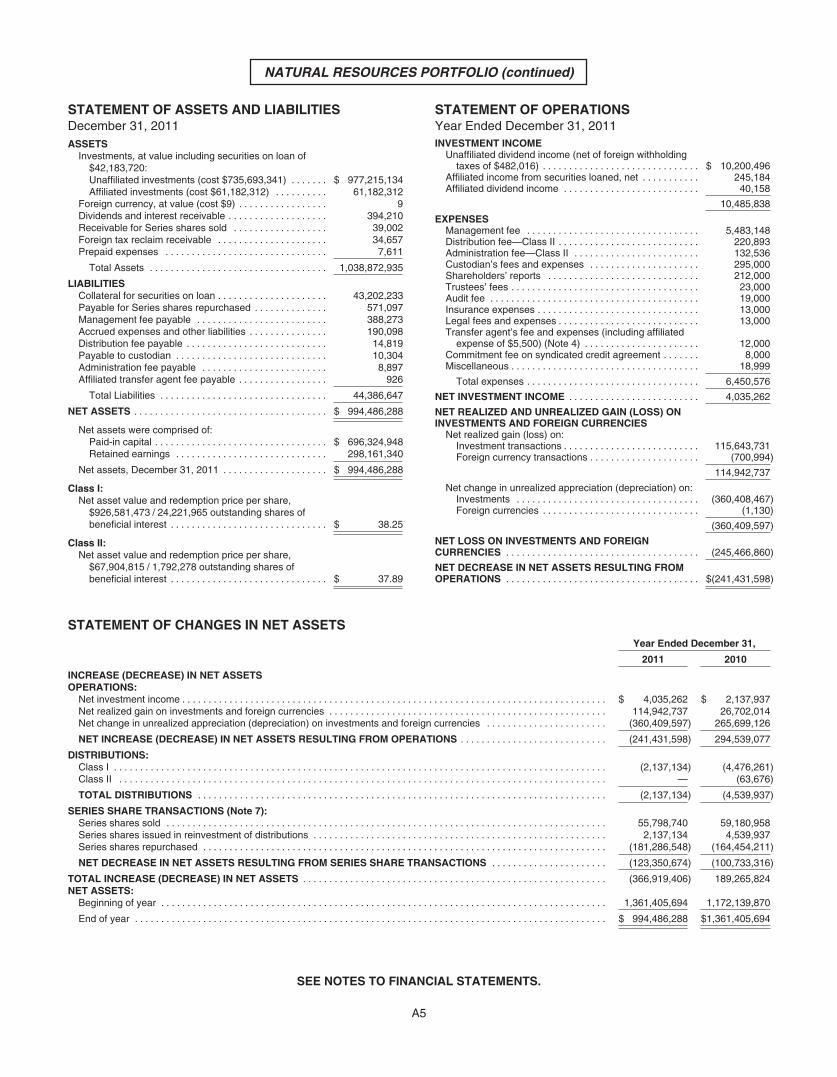
STATEMENT OF ASSETS AND LIABILITIESDecember 31, 2011ASSETS
Investments, at value including securities on loan of$42,183,720:Unaffiliated investments (cost $735,693,341) . . . . . . . $ 977,215,134Affiliated investments (cost $61,182,312) . . . . . . . . . . 61,182,312
Foreign currency, at value (cost $9) . . . . . . . . . . . . . . . . . 9Dividends and interest receivable . . . . . . . . . . . . . . . . . . . 394,210Receivable for Series shares sold . . . . . . . . . . . . . . . . . . 39,002Foreign tax reclaim receivable . . . . . . . . . . . . . . . . . . . . . 34,657Prepaid expenses . . . . . . . . . . . . . . . . . . . . . . . . . . . . . . . 7,611
Total Assets . . . . . . . . . . . . . . . . . . . . . . . . . . . . . . . . . . 1,038,872,935
LIABILITIESCollateral for securities on loan . . . . . . . . . . . . . . . . . . . . . 43,202,233Payable for Series shares repurchased . . . . . . . . . . . . . . 571,097Management fee payable . . . . . . . . . . . . . . . . . . . . . . . . . 388,273Accrued expenses and other liabilities . . . . . . . . . . . . . . . 190,098Distribution fee payable . . . . . . . . . . . . . . . . . . . . . . . . . . . 14,819Payable to custodian . . . . . . . . . . . . . . . . . . . . . . . . . . . . . 10,304Administration fee payable . . . . . . . . . . . . . . . . . . . . . . . . 8,897Affiliated transfer agent fee payable . . . . . . . . . . . . . . . . . 926
Total Liabilities . . . . . . . . . . . . . . . . . . . . . . . . . . . . . . . . 44,386,647
NET ASSETS . . . . . . . . . . . . . . . . . . . . . . . . . . . . . . . . . . . . . $ 994,486,288
Net assets were comprised of:Paid-in capital . . . . . . . . . . . . . . . . . . . . . . . . . . . . . . . . . $ 696,324,948Retained earnings . . . . . . . . . . . . . . . . . . . . . . . . . . . . . 298,161,340
Net assets, December 31, 2011 . . . . . . . . . . . . . . . . . . . . $ 994,486,288
Class I:Net asset value and redemption price per share,
$926,581,473 / 24,221,965 outstanding shares ofbeneficial interest . . . . . . . . . . . . . . . . . . . . . . . . . . . . . . $ 38.25
Class II:Net asset value and redemption price per share,
$67,904,815 / 1,792,278 outstanding shares ofbeneficial interest . . . . . . . . . . . . . . . . . . . . . . . . . . . . . . $ 37.89
STATEMENT OF OPERATIONSYear Ended December 31, 2011INVESTMENT INCOME
Unaffiliated dividend income (net of foreign withholdingtaxes of $482,016) . . . . . . . . . . . . . . . . . . . . . . . . . . . . . . $ 10,200,496
Affiliated income from securities loaned, net . . . . . . . . . . . 245,184Affiliated dividend income . . . . . . . . . . . . . . . . . . . . . . . . . . 40,158
10,485,838
EXPENSESManagement fee . . . . . . . . . . . . . . . . . . . . . . . . . . . . . . . . . 5,483,148Distribution fee—Class II . . . . . . . . . . . . . . . . . . . . . . . . . . . 220,893Administration fee—Class II . . . . . . . . . . . . . . . . . . . . . . . . 132,536Custodian’s fees and expenses . . . . . . . . . . . . . . . . . . . . . 295,000Shareholders’ reports . . . . . . . . . . . . . . . . . . . . . . . . . . . . . 212,000Trustees’ fees . . . . . . . . . . . . . . . . . . . . . . . . . . . . . . . . . . . . 23,000Audit fee . . . . . . . . . . . . . . . . . . . . . . . . . . . . . . . . . . . . . . . . 19,000Insurance expenses . . . . . . . . . . . . . . . . . . . . . . . . . . . . . . . 13,000Legal fees and expenses . . . . . . . . . . . . . . . . . . . . . . . . . . . 13,000Transfer agent’s fee and expenses (including affiliated
expense of $5,500) (Note 4) . . . . . . . . . . . . . . . . . . . . . . 12,000Commitment fee on syndicated credit agreement . . . . . . . 8,000Miscellaneous . . . . . . . . . . . . . . . . . . . . . . . . . . . . . . . . . . . . 18,999
Total expenses . . . . . . . . . . . . . . . . . . . . . . . . . . . . . . . . . 6,450,576
NET INVESTMENT INCOME . . . . . . . . . . . . . . . . . . . . . . . . . 4,035,262
NET REALIZED AND UNREALIZED GAIN (LOSS) ONINVESTMENTS AND FOREIGN CURRENCIES
Net realized gain (loss) on:Investment transactions . . . . . . . . . . . . . . . . . . . . . . . . . . 115,643,731Foreign currency transactions . . . . . . . . . . . . . . . . . . . . . (700,994)
114,942,737
Net change in unrealized appreciation (depreciation) on:Investments . . . . . . . . . . . . . . . . . . . . . . . . . . . . . . . . . . . (360,408,467)Foreign currencies . . . . . . . . . . . . . . . . . . . . . . . . . . . . . . (1,130)
(360,409,597)
NET LOSS ON INVESTMENTS AND FOREIGNCURRENCIES . . . . . . . . . . . . . . . . . . . . . . . . . . . . . . . . . . . . . (245,466,860)
NET DECREASE IN NET ASSETS RESULTING FROMOPERATIONS . . . . . . . . . . . . . . . . . . . . . . . . . . . . . . . . . . . . . $(241,431,598)
STATEMENT OF CHANGES IN NET ASSETSYear Ended December 31,
2011 2010
INCREASE (DECREASE) IN NET ASSETSOPERATIONS:
Net investment income . . . . . . . . . . . . . . . . . . . . . . . . . . . . . . . . . . . . . . . . . . . . . . . . . . . . . . . . . . . . . . . . . . . . . . . . . . . . . . . . . $ 4,035,262 $ 2,137,937Net realized gain on investments and foreign currencies . . . . . . . . . . . . . . . . . . . . . . . . . . . . . . . . . . . . . . . . . . . . . . . . . . . . . 114,942,737 26,702,014Net change in unrealized appreciation (depreciation) on investments and foreign currencies . . . . . . . . . . . . . . . . . . . . . . . (360,409,597) 265,699,126
NET INCREASE (DECREASE) IN NET ASSETS RESULTING FROM OPERATIONS . . . . . . . . . . . . . . . . . . . . . . . . . . . . (241,431,598) 294,539,077
DISTRIBUTIONS:Class I . . . . . . . . . . . . . . . . . . . . . . . . . . . . . . . . . . . . . . . . . . . . . . . . . . . . . . . . . . . . . . . . . . . . . . . . . . . . . . . . . . . . . . . . . . . . . . (2,137,134) (4,476,261)Class II . . . . . . . . . . . . . . . . . . . . . . . . . . . . . . . . . . . . . . . . . . . . . . . . . . . . . . . . . . . . . . . . . . . . . . . . . . . . . . . . . . . . . . . . . . . . . — (63,676)
TOTAL DISTRIBUTIONS . . . . . . . . . . . . . . . . . . . . . . . . . . . . . . . . . . . . . . . . . . . . . . . . . . . . . . . . . . . . . . . . . . . . . . . . . . . . . . (2,137,134) (4,539,937)
SERIES SHARE TRANSACTIONS (Note 7):Series shares sold . . . . . . . . . . . . . . . . . . . . . . . . . . . . . . . . . . . . . . . . . . . . . . . . . . . . . . . . . . . . . . . . . . . . . . . . . . . . . . . . . . . . 55,798,740 59,180,958Series shares issued in reinvestment of distributions . . . . . . . . . . . . . . . . . . . . . . . . . . . . . . . . . . . . . . . . . . . . . . . . . . . . . . . . 2,137,134 4,539,937Series shares repurchased . . . . . . . . . . . . . . . . . . . . . . . . . . . . . . . . . . . . . . . . . . . . . . . . . . . . . . . . . . . . . . . . . . . . . . . . . . . . . (181,286,548) (164,454,211)
NET DECREASE IN NET ASSETS RESULTING FROM SERIES SHARE TRANSACTIONS . . . . . . . . . . . . . . . . . . . . . . (123,350,674) (100,733,316)
TOTAL INCREASE (DECREASE) IN NET ASSETS . . . . . . . . . . . . . . . . . . . . . . . . . . . . . . . . . . . . . . . . . . . . . . . . . . . . . . . . . . (366,919,406) 189,265,824NET ASSETS:
Beginning of year . . . . . . . . . . . . . . . . . . . . . . . . . . . . . . . . . . . . . . . . . . . . . . . . . . . . . . . . . . . . . . . . . . . . . . . . . . . . . . . . . . . . . 1,361,405,694 1,172,139,870
End of year . . . . . . . . . . . . . . . . . . . . . . . . . . . . . . . . . . . . . . . . . . . . . . . . . . . . . . . . . . . . . . . . . . . . . . . . . . . . . . . . . . . . . . . . . . $ 994,486,288 $1,361,405,694
SEE NOTES TO FINANCIAL STATEMENTS.
A5

[THIS PAGE INTENTIONALLY LEFT BLANK]

NOTES TO THE FINANCIAL STATEMENTS OFTHE PRUDENTIAL SERIES FUND
Note 1: General
The Prudential Series Fund (“Series Fund”), organized as a Delaware statutory trust, is a diversified open-endmanagement investment company registered under the Investment Company Act of 1940 (“1940 Act”), asamended. On January 2, 2006, each Portfolio of the Series Fund changed its federal income tax status from aregulated investment company to a partnership. As a result of that conversion, the Series Fund wasreorganized from a Maryland corporation to a Delaware statutory trust. Pursuant to this reorganization, theSeries Fund has been renamed “The Prudential Series Fund.” The Series Fund is composed of eighteenPortfolios (“Portfolio” or “Portfolios”), each with separate series shares. The information presented in thesefinancial statements pertains to the Portfolio listed below along with the Portfolio’s investment objective.
Natural Resources Portfolio: Long-term growth of capital.
The ability of issuers of debt securities (other than those issued or guaranteed by the U.S. Government) heldby the Portfolios to meet their obligations may be affected by the economic or political developments in aspecific industry, region or country. Foreign security and currency transactions may involve certainconsiderations and risks not typically associated with those of domestic origin as a result of, among otherfactors, the possibility of political and economic instability or the level of governmental supervision andregulation of foreign securities markets.
Note 2: Accounting Policies
The following is a summary of significant accounting policies followed by the Series Fund and the Portfolio inpreparation of its financial statements.
Securities Valuation: Securities listed on a securities exchange (other than options on securities and indices)are valued at the last sale price on such exchange on the day of valuation or, if there was no sale on suchday, at the mean between the last reported bid and asked prices, or at the last bid price on such day in theabsence of an asked price. Securities traded via NASDAQ are valued at the NASDAQ official closing price(“NOCP”) on the day of valuation, or if there was no NOCP, at the last sale price. Securities that are activelytraded in the over-the-counter market, including listed securities for which the primary market is believed byPrudential Investments LLC (“PI” or “Manager”) in consultation with the subadvisors, to be over-the-counter,are valued at market value using prices provided by an independent pricing agent or principal market maker.Options on securities and indices traded on an exchange are valued at the last sale price as of the close oftrading on the applicable exchange or, if there was no sale, at the mean between the most recently quoted bidand asked prices on such exchange or at the last bid price in the absence of an asked price. Futures contractsand options thereon traded on a commodities exchange or board of trade are valued at the last sale price atthe close of trading on such exchange or board of trade or, if there was no sale on the applicable commoditiesexchange or board of trade on such day, at the mean between the most recently quoted bid and asked priceson such exchange or board of trade or at the last bid price in the absence of an asked price. Prices may beobtained from independent pricing services which use information provided by market makers or estimates ofmarket values obtained from yield data relating to investments or securities with similar characteristics.Securities for which reliable market quotations are not readily available, or whose values have been affectedby events occurring after the close of the security’s foreign market and before the Series Fund’s normalpricing time, are valued at fair value in accordance with the Board of Trustees’ approved fair valuationprocedures. When determining the fair value of securities, some of the factors influencing the valuationinclude, the nature of any restrictions on disposition of the securities; assessment of the general liquidity of thesecurities; the issuer’s financial condition and the markets in which it does business; the cost of theinvestment; the size of the holding and the capitalization of the issuer; the prices of any recent transactions orbids/offers for such securities or any comparable securities; any available analyst media or other reports orinformation deemed reliable by the investment advisor regarding the issuer or the markets or industry in whichit operates. Using fair value to price securities may result in a value that is different from a security’s mostrecent closing price and from the price used by other mutual funds to calculate their net asset values.
Investments in open-end, non-exchange-traded mutual funds are valued at their net asset value as of theclose of the New York Stock Exchange on the date of valuation.
B1

Short-term debt securities that are held in the Portfolio which mature in more than 60 days are valued at fairvalue and those short-term debt securities of sufficient credit quality which mature in 60 days or less arevalued at amortized cost which approximates fair value. The amortized cost method values a security at itscost at the time of purchase and thereafter assumes a constant amortization to maturity of the differencebetween the principal amount due at maturity and cost.
The Portfolio may hold up to 15% of its net assets in illiquid securities, including those which are restricted asto disposition under securities law (“restricted securities”). Restricted securities are valued pursuant to thevaluation procedures noted above.
Foreign Currency Translation: The books and records of the Series Fund are maintained in U.S. dollars.Foreign currency amounts are translated into U.S. dollars on the following basis:
(i) market value of investment securities, other assets and liabilities — at the current rates of exchange.
(ii) purchases and sales of investment securities, income and expenses — at the rates of exchange prevailingon the respective dates of such transactions.
Although the net assets of the Series Fund are presented at the foreign exchange rates and market values atthe close of the period, the Series Fund does not isolate that portion of the results of operations arising as aresult of changes in the foreign exchange rates from the fluctuations arising from changes in the market pricesof long-term portfolio securities held at the end of the period. Similarly, the Series Fund does not isolate theeffect of changes in foreign exchange rates from the fluctuations arising from changes in the market prices oflong-term portfolio securities sold during the period. Accordingly, these realized foreign currency gains orlosses are included in the reported net realized gains or losses on investment transactions.
Net realized gains or losses on foreign currency transactions represent net foreign exchange gains or lossesfrom the holding of foreign currencies, currency gains or losses realized between the trade and settlementdates on securities transactions, and the difference between the amounts of dividends, interest and foreignwithholding taxes recorded on the Series Fund’s books and the U.S. dollar equivalent amounts actuallyreceived or paid. Net unrealized currency gains or losses from valuing foreign currency denominated assetsand liabilities (other than investments) at period end exchange rates are reflected as a component of netunrealized appreciation (depreciation) on foreign currencies.
Warrants and Rights: The Portfolio holds warrants and rights acquired either through a direct purchase,included as part of a private placement, or pursuant to corporate actions. Warrants and rights entitle theholder to buy a proportionate amount of common stock, or such other security that the issuer may specify, at aspecific price and time through the expiration dates. Such warrants and rights are held as long positions by thePortfolio until exercised, sold or expired. Warrants and rights are valued at fair value in accordance with theBoard of Trustees’ approved fair valuation procedures.
Securities Lending: Each Portfolio of the Series Fund may lend its portfolio securities to banks and broker-dealers. The loans are secured by collateral at least equal to the market value of the securities loaned.Collateral pledged by each borrower is marked to market daily, based on the previous day’s market value,such that the value of the collateral exceeds the value of the loaned securities. Loans are subject totermination at the option of the borrower or the Portfolio. Upon termination of the loan, the borrower will returnto the Portfolio securities identical to the loaned securities. Should the borrower of the securities fail financially,the Portfolio has the right to repurchase the securities using the collateral in the open market. The Portfoliorecognizes income, net of any rebate and securities lending agent fees, for lending its securities in the form offees or interest on the investment of any cash received as collateral. The Portfolio also continues to receiveinterest and dividends or amounts equivalent thereto on the securities loaned and recognizes any unrealizedgain or loss in the market price of the securities loaned that may occur during the term of the loan.
Securities Transactions and Net Investment Income: Securities transactions are recorded on the trade date.Realized gains (losses) on sales of securities are calculated on the identified cost basis. Dividend income isrecorded on the ex-dividend date; interest income, which is comprised of four elements: stated coupon,original issue discount, market discount and market premium, is recorded on the accrual basis. Expenses arerecorded on the accrual basis. The Series Fund’s expenses are allocated to the respective Portfolios on thebasis of relative net assets except for Portfolio specific expenses which are attributable directly to a Portfolioor class level.
B2

For Portfolios with multiple classes of shares, net investment income (loss) (other than administration anddistribution fees, which are charged to the respective class) and unrealized and realized gains (losses) areallocated daily to each class of shares based upon the relative proportion of adjusted net assets of each classat the beginning of the day.
Taxes: For federal income tax purposes, each Portfolio in the Series Fund is treated as a separate taxpayingentity. The Portfolios are treated as partnerships for tax purposes. No provision has been made in the financialstatements for U.S. federal, state, or local taxes, as any tax liability arising from operations of the Portfolios isthe responsibility of their partners. The Portfolios are not generally subject to entity-level taxation. Partners ofeach Portfolio are subject to taxes on their distributive share of partnership items.
Withholding taxes on foreign dividends, interest and capital gains have been provided for in accordance withthe Series Fund’s understanding of the applicable country’s tax rules and regulations.
Distributions: Distributions from the Portfolio are made in cash and automatically reinvested in additionalshares of the same Portfolio. The Portfolio’s distributions are generally made on an annual basis. Distributionsare recorded on the ex-date.
Estimates: The preparation of financial statements requires management to make estimates andassumptions that affect the reported amounts and disclosures in the financial statements. Actual results coulddiffer from these estimates.
Note 3: Agreements
The Series Fund has a management agreement with PI. Pursuant to this agreement PI has responsibility forall investment advisory services and supervises the subadvisor’s performance of such services. PI hasentered into a subadvisory agreement with Jennison Associates LLC (“Jennison”), (the “Subadvisor”), underwhich it provides investment advisory services for the Portfolio of the Series Fund. PI pays for the services ofthe Subadvisor, compensation of officers of the Series Fund, occupancy and certain clerical andadministrative expenses of the Series Fund. The Portfolio bears all other costs and expenses.
The management fee paid to PI is accrued daily and payable monthly, using the value of the Portfolio’saverage daily net assets, at the annual rate specified below.
Portfolio Management FeeEffective
Management Fee
Natural Resources Portfolio . . . . . . . . . . . . . . . . . . . . . . . . . . . . 0.45% 0.45%
The Series Fund has a distribution agreement with Prudential Investment Management Services LLC(“PIMS”), which acts as the distributor of the Class I and Class II shares of the Series Fund. The Series Fundcompensates PIMS for distributing and servicing the Series Fund’s Class II shares pursuant to a plan ofdistribution (the “Class II Plan”), regardless of expenses actually incurred by PIMS. The distribution fees areaccrued daily and payable monthly. No distribution or service fees are paid to PIMS as distributor of theClass I shares of the Series Fund. Pursuant to the Class II Plan, the Class II shares of each Portfoliocompensate PIMS for distribution-related activities at an annual rate of 0.25% of the average daily net assetsof the Class II shares.
The Series Fund has an administration agreement with PI, which acts as the administrator of the Class IIshares of the Series Fund. The administration fee paid to PI is accrued daily and payable monthly, at theannual rate of 0.15% of the average daily net assets of the Class II shares.
PIMS, PI and Jennison are indirect, wholly-owned subsidiaries of Prudential Financial, Inc. (“Prudential”).
Note 4: Other Transactions with Affiliates
Prudential Mutual Fund Services LLC (“PMFS”), an affiliate of PI and an indirect, wholly-owned subsidiary ofPrudential, serves as the Series Fund’s transfer agent. Transfer agent’s fees and expenses in the Statementof Operations include certain out-of-pocket expenses paid to non-affiliates, where applicable.
B3

Prudential Investment Management, Inc. (“PIM”), an indirect wholly-owned subsidiary of Prudential serves asthe Series Fund’s security lending agent. For the year ended December 31, 2011, PIM was compensated asfollows for these services by the Series Fund Portfolio:
Portfolio PIM
Natural Resources Portfolio . . . . . . . . . . . . . . . . . . . . . . . . . . . . . . . . . . . . . . . . . . . . . . . . . . . . $73,237
The Portfolio invests in the Prudential Core Taxable Money Market Fund (the “Core Fund”), a portfolio ofPrudential Investment Portfolios 2, registered under the 1940 Act, as amended, and managed by PI. Earningsfrom the Core Fund are disclosed on the Statement of Operations as affiliated dividend income.
Note 5: Portfolio Securities
The aggregate cost of purchases and the proceeds from the sales of securities (excluding governmentsecurities and short-term issues) for the year ended December 31, 2011 were as follows:
Portfolio Cost of Purchases Proceeds from Sales
Natural Resources Portfolio . . . . . . . . . . . . . . . . . . . . . . . . $412,456,951 $538,621,936
Note 6: Tax Information
After January 2, 2006, all Portfolios are treated as partnerships for tax purposes. The character of the cashdistributions made by the partnerships is generally classified as return of capital nontaxable distributions. Aftereach fiscal year each partner will receive information regarding their distributive allocable share of thepartnership’s income, gains, losses and deductions.
Prior to January 2, 2006, each Portfolio, which was incorporated as of that date, qualified as a regulatedinvestment company under the Internal Revenue Code and distributed all of its taxable income, including anynet realized gains on investments, to shareholders.
With respect to the Portfolios, book cost of assets differs from tax cost of assets as a result of each Portfolio’sadoption of a mark to market method of accounting for tax purposes. Under this method, tax cost of assets willapproximate its fair market value.
Management has analyzed the Portfolios’ tax positions taken on federal income tax returns for all open taxyears and has concluded that no provision for income tax is required in the Portfolios’ financial statements forthe current period. The Portfolios’ federal and state income tax returns for tax years for which the applicablestatutes of limitations have not expired are subject to examination by the Internal Revenue Service and statedepartments of revenue.
Note 7: Capital
The Series Fund offers Class I and Class II shares. Neither Class I nor Class II shares of a Portfolio aresubject to any sales charge or redemption charge and are sold at the net asset value of the Portfolio. Class Ishares are sold only to certain separate accounts of Prudential to fund benefits under certain variable lifeinsurance and variable annuity contracts (“contracts”). Class II shares are sold only to separate accounts ofnon-Prudential insurance companies as investment options under certain contracts. The separate accountsinvest in shares of the Series Fund through subaccounts that correspond to the Portfolios. The separateaccounts will redeem shares of the Series Fund to the extent necessary to provide benefits under thecontracts or for such other purposes as may be consistent with the contracts. As of December 31, 2011, theNatural Resources Portfolio has Class II shares outstanding.
Transactions in shares of beneficial interest of the Natural Resources Portfolio were as follows:
Natural Resources Portfolio:Class I Shares Amount
Year ended December 31, 2011:Series shares sold . . . . . . . . . . . . . . . . . . . . . . . . . . . . . . . . . . . . . . . . . . . . . . . . . . . 412,131 $ 18,208,621Series shares issued in reinvestment of distributions . . . . . . . . . . . . . . . . . . . . . . . 47,177 2,137,134Series shares repurchased . . . . . . . . . . . . . . . . . . . . . . . . . . . . . . . . . . . . . . . . . . . . (2,846,544) (127,557,784)
Net increase (decrease) in shares outstanding . . . . . . . . . . . . . . . . . . . . . . . . . . . . (2,387,236) $(107,212,029)
B4

Natural Resources Portfolio (cont’d):Class I Shares Amount
Year ended December 31, 2010:Series shares sold . . . . . . . . . . . . . . . . . . . . . . . . . . . . . . . . . . . . . . . . . . . . . . . . . . . 480,166 $ 18,914,478Series shares issued in reinvestment of distributions . . . . . . . . . . . . . . . . . . . . . . . 126,305 4,476,261Series shares repurchased . . . . . . . . . . . . . . . . . . . . . . . . . . . . . . . . . . . . . . . . . . . . (3,058,129) (114,388,529)
Net increase (decrease) in shares outstanding . . . . . . . . . . . . . . . . . . . . . . . . . . . . (2,451,658) $ (90,997,790)
Class II
Year ended December 31, 2011:Series shares sold . . . . . . . . . . . . . . . . . . . . . . . . . . . . . . . . . . . . . . . . . . . . . . . . . . . 875,550 $ 37,590,119Series shares issued in reinvestment of distributions . . . . . . . . . . . . . . . . . . . . . . . — —Series shares repurchased . . . . . . . . . . . . . . . . . . . . . . . . . . . . . . . . . . . . . . . . . . . . (1,252,490) (53,728,764)
Net increase (decrease) in shares outstanding . . . . . . . . . . . . . . . . . . . . . . . . . . . . (376,940) $ (16,138,645)
Year ended December 31, 2010:Series shares sold . . . . . . . . . . . . . . . . . . . . . . . . . . . . . . . . . . . . . . . . . . . . . . . . . . . 1,032,268 $ 40,266,480Series shares issued in reinvestment of distributions . . . . . . . . . . . . . . . . . . . . . . . 1,807 63,676Series shares repurchased . . . . . . . . . . . . . . . . . . . . . . . . . . . . . . . . . . . . . . . . . . . . (1,375,362) (50,065,682)
Net increase (decrease) in shares outstanding . . . . . . . . . . . . . . . . . . . . . . . . . . . . (341,287) $ (9,735,526)
Note 8: Borrowings
The Portfolio along with other affiliated registered investment companies (the “Funds”), is a party to aSyndicated Credit Agreement (“SCA”) with a group of banks. The purpose of the SCA is to provide analternative source of temporary funding for capital share redemptions. The SCA provides for a commitment of$900 million for the period December 16, 2011 through December 14, 2012. The Funds pay an annualizedcommitment fee of 0.08% of the unused portion of the SCA. Prior to December 16, 2011, the Funds hadanother Syndicated Credit Agreement of $750 million commitment with an annualized commitment fee of0.10% of the unused portion. Interest on any borrowings under the SCA is paid at contracted market rates.The commitment fee for the unused amount is accrued daily and paid quarterly.
The Portfolio did not borrow any amounts pursuant to the SCA during the year ended December 31, 2011.
Note 9: Ownership and Affiliates
As of December 31, 2011, all of Class I shares of record of the Portfolio were owned by the PrudentialInsurance Company of America (“PICA”) on behalf of the owners of the variable insurance products issuedby PICA.
Note 10: New Accounting Pronouncements
In April 2011, the Financial Accounting Standards Board (“FASB”) issued Accounting Standards Update(“ASU”) No. 2011-03 “Reconsideration of Effective control for Repurchase Agreements”. The objective ofASU 2011-03 is to improve the accounting for repurchase agreements and other agreements that both entitleand obligate a transferor to repurchase or redeem financial assets before their maturity. Under previousguidance, whether or not to account for a transaction as a sale was based on, in part, if the entity maintainedeffective control over the transferred financial assets. ASU 2011-03 removes the transferor’s ability criterionfrom the effective control assessment. This guidance is effective prospectively for interim and annual reportingperiods beginning on or after December 15, 2011. At this time, management is evaluating the implications ofASU No. 2011-03 and its impact on the financial statements has not been determined.
B5

In May 2011, the FASB issued ASU No. 2011-04 “Amendments to Achieve Common Fair Value Measurementand Disclosure Requirements in U.S. GAAP and IFRSs”. ASU 2011-04 includes common requirements formeasurement of and disclosure about fair value between U.S. GAAP and IFRS. ASU 2011-04 will requirereporting entities to disclose quantitative information about the unobservable inputs used in the fair valuemeasurements categorized within Level 3 of the fair value hierarchy. In addition, ASU 2011-04 will requirereporting entities to make disclosures about amounts and reasons for all transfers in and out of Level 1 andLevel 2 fair value measurements. The new and revised disclosures are effective for interim and annualreporting periods beginning after December 15, 2011. At this time, management is evaluating the implicationsof ASU No. 2011-04 and its impact on the financial statements has not been determined.
B6

Financial HighlightsNatural Resources Portfolio
Class IYear Ended December 31,
2011(a) 2010(a) 2009(a) 2008(a) 2007(a)
Per Share Operating Performance:Net Asset Value, beginning of year . . . . . . . . . . . . . . . . . . . . . . . . . . . . . . . . . . . . $ 47.33 $ 37.15 $ 23.70 $ 56.28 $ 45.67
Income (Loss) From Investment Operations:Net investment income . . . . . . . . . . . . . . . . . . . . . . . . . . . . . . . . . . . . . . . . . . . . . . .16 .08 .15 .22 .43Net realized and unrealized gain (loss) on investments . . . . . . . . . . . . . . . . . . . (9.16) 10.26 17.34 (25.97) 21.09
Total from investment operations . . . . . . . . . . . . . . . . . . . . . . . . . . . . . . . . . (9.00) 10.34 17.49 (25.75) 21.52
Less Distributions . . . . . . . . . . . . . . . . . . . . . . . . . . . . . . . . . . . . . . . . . . . . . . . . (.08) (.16) (4.04) (6.83) (10.91)
Net Asset Value, end of year . . . . . . . . . . . . . . . . . . . . . . . . . . . . . . . . . . . . . . . . . $ 38.25 $ 47.33 $ 37.15 $ 23.70 $ 56.28
Total Return(b) . . . . . . . . . . . . . . . . . . . . . . . . . . . . . . . . . . . . . . . . . . . . . . . . . . . (19.03)% 27.98% 77.10% (53.00)% 48.30%Ratios/Supplemental Data:Net assets, end of year (in millions) . . . . . . . . . . . . . . . . . . . . . . . . . . . . . . . . . . . $ 926.6 $1,259.5 $1,079.6 $ 677.4 $1,669.9Ratios to average net assets(c):
Expenses . . . . . . . . . . . . . . . . . . . . . . . . . . . . . . . . . . . . . . . . . . . . . . . . . . . . . . . .50% .50% .53% .50% .48%Net investment income . . . . . . . . . . . . . . . . . . . . . . . . . . . . . . . . . . . . . . . . . . . . .36% .22% .51% .47% .80%
Portfolio turnover rate . . . . . . . . . . . . . . . . . . . . . . . . . . . . . . . . . . . . . . . . . . . . . . . 34% 28% 27% 40% 39%
Natural Resources PortfolioClass II
Year Ended December 31,2011(a) 2010(a) 2009(a) 2008(a) 2007(a)
Per Share Operating Performance:Net Asset Value, beginning of year . . . . . . . . . . . . . . . . . . . . . . . . . . . . . . . . . . . . $ 46.98 $36.88 $23.54 $ 55.92 $ 45.55
Income (Loss) From Investment Operations:Net investment income (loss) . . . . . . . . . . . . . . . . . . . . . . . . . . . . . . . . . . . . . . . . . (.02) (.07) .03 .05 .28Net realized and unrealized gain (loss) on investments . . . . . . . . . . . . . . . . . . . (9.07) 10.20 17.21 (25.86) 20.92
Total from investment operations . . . . . . . . . . . . . . . . . . . . . . . . . . . . . . . . . . (9.09) 10.13 17.24 (25.81) 21.20
Less Distributions . . . . . . . . . . . . . . . . . . . . . . . . . . . . . . . . . . . . . . . . . . . . . . . . — (.03) (3.90) (6.57) (10.83)
Net Asset Value, end of year . . . . . . . . . . . . . . . . . . . . . . . . . . . . . . . . . . . . . . . . . $ 37.89 $46.98 $36.88 $ 23.54 $ 55.92
Total Return(b) . . . . . . . . . . . . . . . . . . . . . . . . . . . . . . . . . . . . . . . . . . . . . . . . . . . (19.35)% 27.48% 76.41% (53.19)% 47.70%Ratios/Supplemental Data:Net assets, end of year (in millions) . . . . . . . . . . . . . . . . . . . . . . . . . . . . . . . . . . . $ 67.9 $101.9 $ 92.6 $ 42.3 $ 47.9Ratios to average net assets(c):
Expenses . . . . . . . . . . . . . . . . . . . . . . . . . . . . . . . . . . . . . . . . . . . . . . . . . . . . . . . .90% .90% .93% .90% .88%Net investment income (loss) . . . . . . . . . . . . . . . . . . . . . . . . . . . . . . . . . . . . . . . (.04)% (.18)% .10% .12% .51%
Portfolio turnover rate . . . . . . . . . . . . . . . . . . . . . . . . . . . . . . . . . . . . . . . . . . . . . . . 34% 28% 27% 40% 39%
(a) Calculated based on average shares outstanding during the year.
(b) Total return is calculated assuming a purchase of a share on the first day and a sale on the last day of each year reported and includesreinvestment of distributions and does not reflect the effect of insurance contract charges. Total return does not reflect expenses associated withthe separate account such as administrative fees, account charges and surrender charges which, if reflected, would reduce the total returns forall years shown. Performance figures may reflect voluntary fee waivers and/or expense reimbursements. In the absence of voluntary fee waiversand/or expense reimbursements, the total return would be lower. Past performance is no guarantee of future results. Total returns may reflectadjustments to conform to generally accepted accounting principles.
(c) Does not include expenses of the underlying portfolios in which the Portfolio invests.
SEE NOTES TO FINANCIAL STATEMENTS.
C1

[THIS PAGE INTENTIONALLY LEFT BLANK]

REPORT OF INDEPENDENT REGISTERED PUBLIC ACCOUNTING FIRM
The Board of Trustees and ShareholdersThe Prudential Series Fund:
We have audited the accompanying statement of assets and liabilities of the Natural Resources Portfolio (hereafterreferred to as the “Portfolio”), a portfolio of The Prudential Series Fund, including the portfolio of investments, as ofDecember 31, 2011, and the related statement of operations for the year then ended, the statement of changes in netassets for each of the years in the two-year period then ended and the financial highlights for each of the years in thefive-year period then ended. These financial statements and financial highlights are the responsibility of the Portfolio’smanagement. Our responsibility is to express an opinion on these financial statements and financial highlights basedon our audits.
We conducted our audits in accordance with the standards of the Public Company Accounting Oversight Board (UnitedStates). Those standards require that we plan and perform the audit to obtain reasonable assurance about whether thefinancial statements and financial highlights are free of material misstatement. An audit includes examining, on a testbasis, evidence supporting the amounts and disclosures in the financial statements. Our procedures includedconfirmation of securities owned as of December 31, 2011, by correspondence with the custodian, transfer agent andbrokers or by other appropriate auditing procedures where replies from brokers were not received. An audit also includesassessing the accounting principles used and significant estimates made by management, as well as evaluating theoverall financial statement presentation. We believe that our audits provide a reasonable basis for our opinion.
In our opinion, the financial statements and financial highlights referred to above present fairly, in all material respects,the financial position of the Portfolio as of December 31, 2011, and the results of its operations, the changes in its netassets and the financial highlights for the periods described in the first paragraph above, in conformity with U.S.generally accepted accounting principles.
New York, New YorkFebruary 16, 2012
D1

INFORMATION ABOUT TRUSTEES AND OFFICERS (Unaudited)Information about the Trustees and the Officers of the Fund is set forth below. Trustees who are not deemed to be “interested persons”of the Fund, as defined in the 1940 Act, are referred to as “Independent Trustees.” Trustees who are deemed to be “interested persons”of the Fund are referred to as “Interested Trustees.” The Trustees are responsible for the overall supervision of the operations of the Fundand perform the various duties imposed on the directors of investment companies by the 1940 Act.
Independent Trustees(1)
Name, Address, AgeNo. of Portfolios Overseen
Principal Occupation(s) During Past Five Years Other Directorships Held
Susan Davenport Austin (44)No. of Portfolios Overseen: 84
Senior Vice President and Chief Financial Officer (Since 2007) andVice President of Strategic Planning and Treasurer (2002-2007) ofSheridan Broadcasting Corporation; President of Sheridan GospelNetwork (Since 2004); Vice President, Goldman, Sachs & Co.(2000-2001); Associate Director, Bear, Stearns & Co. Inc (1997-2000); Vice President, Salomon Brothers Inc (1993-1997);President of the Board, The MacDowell Colony (Since 2010);Chairman of the Board of Directors, Broadcast Music, Inc. (Since2007); Member of the Board of Directors, Hubbard Radio, LLC(Since 2011); formerly Member of the Board of Directors, NationalAssociation of Broadcasters (2004-2010).
None
Saul K. Fenster, Ph.D. (78)No. of Portfolios Overseen: 84
President Emeritus of New Jersey Institute of Technology (since2002); formerly President (1978-2002) of New Jersey Institute ofTechnology; Commissioner (1998-2002) of the Middle StatesAssociation Commission on Higher Education; Commissioner(1985-2002) of the New Jersey Commission on Science andTechnology; formerly Director (1998-2005) of Society ofManufacturing Engineering Education Foundation; formerlyDirector of Prosperity New Jersey; formerly a director or trustee ofLiberty Science Center, Research and Development Council of NewJersey, New Jersey State Chamber of Commerce, and NationalAction Council for Minorities in Engineering.
Formerly Director (2000-2006) of IDT Corporation.
Delayne Dedrick Gold (73)No. of Portfolios Overseen: 84
Marketing Consultant (1982-present); formerly Senior VicePresident and Member of the Board of Directors, Prudential BacheSecurities, Inc.
None
W. Scott McDonald, Jr., Ph.D. (74)No. of Portfolios Overseen: 84
Formerly Management Consultant (1997-2004) and of Counsel(2004-2005) at Kaludis Consulting Group, Inc. (company servinghigher education); formerly principal (1995-1997), Scott McDonaldAssociates; Chief Operating Officer (1991-1995), FairleighDickinson University; Executive Vice President and Chief OperatingOfficer (1975-1991), Drew University; interim President (1988-1990), Drew University; formerly Director of School, College andUniversity Underwriters Ltd.
None
Thomas T. Mooney (70)No. of Portfolios Overseen: 84
Formerly Chief Executive Officer, Excell Partners, Inc. (2005-2007)formerly President of the Greater Rochester Metro Chamber ofCommerce (1976-2004) formerly Rochester City Manager (1973);formerly Deputy Monroe County Executive (1974-1976).
None
Thomas M. O’Brien (61)No. of Portfolios Overseen: 84
President and COO (since November 2006) and CEO (since April2007) of State Bancorp, Inc. and State Bank; formerly ViceChairman (January 1997-April 2000) of North Fork Bank; formerlyPresident and Chief Executive Officer (December 1984-December1996) of North Side Savings Bank; formerly President and ChiefExecutive Officer (May 2000-June 2006) Atlantic Bank of New York.
Director (since April 2008) of Federal Home Loan Bank of NewYork; formerly Director (December 1996-May 2000) of North ForkBancorporation, Inc.; formerly Director (May 2000-April 2006) ofAtlantic Bank of New York; Director (since November 2006) ofState Bancorp, Inc. (NASDAQ: STBC) and State Bank of LongIsland.
F. Don Schwartz (76)No. of Portfolios Overseen: 84
Independent Management/Marketing Consultant (since 2002);formerly CEO and President of AceCo, Inc. (1985-2001) (consultingfirm specializing in universal/variable life and variable annuityproducts); formerly Vice President of The Equitable Life AssuranceSociety; formerly Guest Insurance Professor at the AmericanCollege, Louisiana State University, Alabama State University andthe Insurance Marketing Institute; Advisor to several stateinsurance commissioners; a Chartered Life Underwriter, CharteredFinancial Consultant and Fellow of the Life InsuranceManagement Institute.
None.
E1

Interested Trustees(1)
Name, Address, AgeNo. of Portfolios Overseen
Principal Occupation(s) During Past Five Years Other Directorships Held
Stephen Pelletier (58)No. of Portfolios Overseen: 84
President of Prudential Annuities (since September 2008);Chairman and CEO, International Investments, PrudentialFinancial (since January 1998).
None
Robert F. Gunia (65)No. of Portfolios Overseen: 84
Independent Consultant (since October 2009); formerly ChiefAdministrative Officer (September 1999-September 2009) andExecutive Vice President (December 1996-September 2009) ofPrudential Investments LLC; formerly Executive Vice President(March 1999-September 2009) and Treasurer (May 2000-September 2009) of Prudential Mutual Fund Services LLC; formerlyPresident (April 1999-December 2008) and Executive VicePresident and Chief Operating Officer (December 2008-December2009) of Prudential Investment Management Services LLC;formerly Chief Administrative Officer, Executive Vice President andDirector (May 2003-September 2009) of AST Investment Services,Inc.
Director (since May 1989) of The Asia Pacific Fund, Inc.
Timothy S. Cronin (46)Number of Portfolios Overseen: 84
Chief Investment Officer and Strategist of Prudential Annuities(since January 2004); Director of Investment & Research Strategy(since February 1998); President of AST Investment Services, Inc.(since June 2005).
None.
(1) The year that each Trustee joined the Fund’s Board is as follows: Susan Davenport Austin, 2011; Timothy S. Cronin, 2011; Saul K. Fenster, 1983; Delayne Dedrick Gold, 2001; Robert F.Gunia, 2001; W. Scott McDonald, Jr., 1983; Thomas T. Mooney, 2001; Thomas M. O’Brien, 2003; Stephen Pelletier, 2011; F. Don Schwartz, 2003.
Fund Officers(a)(1)
Name, Address and AgePosition with the Fund
Principal Occupation(s) During the Past Five Years
Kathryn L. Quirk (59)Chief Legal Officer
Vice President and Corporate Counsel (since September 2004) of Prudential; Executive Vice President, Chief Legal Officer and Secretary(since July 2005) of PI and Prudential Mutual Fund Services LLC; Vice President and Corporate Counsel (since June 2005) and Secretary(since February 2006) of AST Investment Services, Inc.; formerly Senior Vice President and Assistant Secretary (November 2004-August2005) of PI; formerly Assistant Secretary (June 2005-February 2006) of AST Investment Services, Inc.; formerly Managing Director,General Counsel, Chief Compliance Officer, Chief Risk Officer and Corporate Secretary (1997-2002) of Zurich Scudder Investments, Inc.
Deborah A. Docs (54)Secretary
Vice President and Corporate Counsel (since January 2001) of Prudential; Vice President (since December 1996) and Assistant Secretary(since March 1999) of PI; formerly Vice President and Assistant Secretary (May 2003-June 2005) of AST Investment Services, Inc.
Jonathan D. Shain (53)Assistant Secretary
Vice President and Corporate Counsel (since August 1998) of Prudential; Vice President and Assistant Secretary (since May 2001) of PI;Vice President and Assistant Secretary (since February 2001) of PMFS; formerly Vice President and Assistant Secretary (May 2003-June2005) of AST Investment Services, Inc.
Claudia DiGiacomo (37)Assistant Secretary
Vice President and Corporate Counsel (since January 2005) of Prudential; Vice President and Assistant Secretary of PI (since December2005); Associate at Sidley Austin Brown Wood LLP (1999-2004).
John P. Schwartz (40)Assistant Secretary
Vice President and Corporate Counsel (since April 2005) of Prudential; Vice President and Assistant Secretary of PI (since December2005); Associate at Sidley Austin Brown Wood LLP (1997-2005).
Andrew R. French (49)Assistant Secretary
Vice President and Corporate Counsel (since February 2010) of Prudential; formerly Director and Corporate Counsel (2006-2010) ofPrudential; Vice President and Assistant Secretary (since January 2007) of PI; Vice President and Assistant Secretary (since January2007) of PMFS.
Timothy J. Knierim (53)Chief Compliance Officer
Chief Compliance Officer of Prudential Investment Management, Inc. (since July 2007); formerly Chief Risk Officer of PIM and PI (2002-2007) and formerly Chief Ethics Officer of PIM and PI (2006-2007).
Valerie M. Simpson (53)Deputy Chief Compliance Officer
Chief Compliance Officer (since April 2007) of PI and AST Investment Services, Inc.; formerly Vice President-Financial Reporting (June1999-March 2006) for Prudential Life and Annuities Finance.
Theresa C. Thompson (49)Deputy Chief Compliance Officer
Vice President, Compliance, PI (since April 2004); and Director, Compliance, PI (2001 - 2004).
Richard W. Kinville (43)Anti-Money Laundering Compliance Officer
Vice President, Corporate Compliance, Anti-Money Laundering Unit (since January 2005) of Prudential; committee member of theAmerican Council of Life Insurers Anti-Money Laundering and Critical Infrastructure Committee (since January 2007); formerlyInvestigator and Supervisor in the Special Investigations Unit for the New York Central Mutual Fire Insurance Company (August 1994-January 1999); Investigator in AXA Financial’s Internal Audit Department and Manager in AXA’s Anti-Money Laundering Office (January1999-January 2005); first chair of the American Council of Life Insurers Anti-Money Laundering and Critical Infrastructure Committee(June 2007-December 2009 ).
Grace C. Torres (52)Treasurer and Principal Financial andAccounting Officer
Assistant Treasurer (since March 1999) and Senior Vice President (since September 1999) of PI; Assistant Treasurer (since May 2003)and Vice President (since June 2005) of AST Investment Services, Inc.; Senior Vice President and Assistant Treasurer (since May 2003) ofPrudential Annuities Advisory Services, Inc.; formerly Senior Vice President (May 2003-June 2005) of AST Investment Services, Inc.
E2

Fund Officers(a)(1)
Name, Address and AgePosition with the Fund
Principal Occupation(s) During the Past Five Years
M. Sadiq Peshimam (48)Assistant Treasurer
Vice President (since 2005) of Prudential Investments LLC.
Peter Parrella (53)Assistant Treasurer
Vice President (since 2007) and Director (2004-2007) within Prudential Mutual Fund Administration; formerly Tax Manager at SSB CitiFund Management LLC (1997-2004).
Alan Fu (55)Assistant Treasurer
Vice President and Corporate Counsel - Tax, Prudential Financial, Inc. (since October 2003).
(a) Excludes Mr. Pelletier and Mr. Cronin, interested Board Members who also serve as President and Vice President, respectively.
(1) The year in which each individual became an Officer of the Fund is as follows: Kathryn L. Quirk, 2005; Deborah A. Docs, 2005; Jonathan D. Shain, 2005; Claudia DiGiacomo, 2005; John P.Schwartz, 2006; Andrew R. French, 2006; Timothy J. Knierim, 2007; Valerie M. Simpson, 2007; Theresa C. Thompson, 2008; Grace C. Torres, 1997; Peter Parrella, 2007; M. Sadiq Peshimam,2006; Alan Fu, 2006; Richard W. Kinville, 2011.
Explanatory Notes to Tables:
Trustees are deemed to be “Interested”, as defined in the 1940 Act, by reason of their affiliation with Prudential Investments LLC and/or an affiliate of Prudential Investments LLC. StephenPelletier and Timothy Cronin are Interested Trustees because they are employed by an affiliate of the Manager of the Fund. Robert F. Gunia will be considered an Interested Trustee for atleast two years after his retirement from employment by the Manager and its affiliates (which was on or about October 21, 2009). He will also be an Interested Trustee as long as he holds abeneficial interest in securities issued by the Manager or its affiliates.
Unless otherwise noted, the address of all Trustees and Officers is c/o Prudential Investments LLC, Gateway Center Three, 100 Mulberry Street, Newark, New Jersey 07102.
There is no set term of office for Trustees or Officers. The Independent Trustees have adopted a retirement policy, which calls for the retirement of Trustees on December 31 of the year inwhich they reach the age of 78, provided that the Board may extend the retirement age on a year-by-year basis for a Trustee.
“Other Directorships Held” includes only directorships of companies required to register or file reports with the SEC under the Securities Exchange Act of 1934 (that is, “public companies”)or other investment companies registered under the 1940 Act.
“No. of Portfolios Overseen” includes all investment companies managed by Prudential Investments LLC (PI) and/or AST Investment Services, Inc. (ASTI) (collectively, the Manager) that areoverseen by the Trustee. The investment companies for which PI and/or ASTI serves as Manager include The Prudential Variable Contract Accounts, The Prudential Series Fund, AdvancedSeries Trust and Prudential’s Gibraltar Fund, Inc.
E3

The Prudential Series Fund Class II Portfolios are available through life insurance contracts issued by various insurancecompanies other than The Prudential Insurance Company of America and its affiliates. The funds in The Prudential Series Fundare distributed by Prudential Investment Management Services (PIMS), LLC, a Prudential Financial company and memberSIPC. PIMS’ principal business address is Gateway Center Three, 100 Mulberry Street, Newark, New Jersey 07102-3777. Eachcompany is solely responsible for its own financial condition and contractual obligations.
Life insurance and annuity contracts contain exclusions, limitations, reductions of benefits, and terms for keeping them in force.Your licensed financial professional can provide you with costs and complete details. Contract guarantees are based on theclaims-paying ability of the issuing company.

Prudential Investments, Prudential, the Prudential logo, and the Rock symbol are service marks of Prudential Financial, Inc.and its related entities, registered in many jurisdictions worldwide.
0172717-00004-00 PSF-AR NATR-CLASS II