The Proximate and Phytochemical Properties of Red Pitaya ... PAPERS/JTAS Vol... · the sugar...
18
Pertanika J. Trop. Agric. Sc. 42 (3): 903 - 920 (2019) © Universiti Putra Malaysia Press TROPICAL AGRICULTURAL SCIENCE Journal homepage: http://www.pertanika.upm.edu.my/ Article history: Received: 27 February 2019 Accepted: 29 May 2019 Published: 19 August 2019 ARTICLE INFO E-mail addresses: [email protected] (Ruth Chrisnasari) [email protected] (Chriselda Catya Sudono) [email protected] (Maria Rosari Dwi Utami) [email protected] (Ardhia Deasy Rosita Dewi) [email protected] (Tjandra Pantjajani) * Corresponding author ISSN: 1511-3701 e-ISSN: 2231-8542 The Proximate and Phytochemical Properties of Red Pitaya (Hylocereus polyrhizus) Stem Flour and Its Potential Application as Food Products Ruth Chrisnasari*, Chriselda Catya Sudono, Maria Rosari Dwi Utami, Ardhia Deasy Rosita Dewi and Tjandra Pantjajani Department of Biology, Faculty of Biotechnology, University of Surabaya, Jalan Raya Kalirungkut, Surabaya, East Java 60293, Indonesia ABSTRACT Red pitaya fruit and peel have been widely explored for food products due to their functional properties. However, the stem still has limited use. This work was aimed to determine the proximate and phytochemical properties of red pitaya stem by processing it as flour and applied it as food products. The different drying temperature (40, 50, 60ºC) on the flouring process was conducted to determine the best drying condition. The best drying temperature was then used to prepare the flour by using whole stem (epidermis and cortex) and peeled stem (cortex only). The result showed that the effective drying temperature on the flouring process was 60ºC. The predominant component in the whole and peeled stem flour was fiber (total of hemicelluloses, cellulose and lignin), which contained up to 50.4% and 43.03% respectively. The second largest component was protein which the whole stem flour contained 9.09% of it and the peeled stem flour contained 11.97% of it. Both of the flour contained high vitamin C (3.64–3.76%) and phenolic compounds (43.55–44.54 mg/g). Either whole or peeled stem flour showed antioxidant activity up to 91% of inhibition and antibacterial activity against Escherichia coli, Staphylococcus aureus as well as Salmonella typhi. The resulting flour has been successfully applied as substitute and additional ingredients to make fiber enriched food products. Keywords: Drying temperature, phytochemical, pitaya stem flour, proximate analysis
Transcript of The Proximate and Phytochemical Properties of Red Pitaya ... PAPERS/JTAS Vol... · the sugar...

Pertanika J. Trop. Agric. Sc. 42 (3): 903 - 920 (2019)
© Universiti Putra Malaysia Press
TROPICAL AGRICULTURAL SCIENCEJournal homepage: http://www.pertanika.upm.edu.my/
Article history:Received: 27 February 2019Accepted: 29 May 2019Published: 19 August 2019
ARTICLE INFO
E-mail addresses:[email protected] (Ruth Chrisnasari)[email protected] (Chriselda Catya Sudono)[email protected] (Maria Rosari Dwi Utami)[email protected] (Ardhia Deasy Rosita Dewi)[email protected] (Tjandra Pantjajani)* Corresponding author
ISSN: 1511-3701e-ISSN: 2231-8542
The Proximate and Phytochemical Properties of Red Pitaya (Hylocereus polyrhizus) Stem Flour and Its Potential Application as Food Products
Ruth Chrisnasari*, Chriselda Catya Sudono, Maria Rosari Dwi Utami, Ardhia Deasy Rosita Dewi and Tjandra PantjajaniDepartment of Biology, Faculty of Biotechnology, University of Surabaya, Jalan Raya Kalirungkut, Surabaya, East Java 60293, Indonesia
ABSTRACT
Red pitaya fruit and peel have been widely explored for food products due to their functional properties. However, the stem still has limited use. This work was aimed to determine the proximate and phytochemical properties of red pitaya stem by processing it as flour and applied it as food products. The different drying temperature (40, 50, 60ºC) on the flouring process was conducted to determine the best drying condition. The best drying temperature was then used to prepare the flour by using whole stem (epidermis and cortex) and peeled stem (cortex only). The result showed that the effective drying temperature on the flouring process was 60ºC. The predominant component in the whole and peeled stem flour was fiber (total of hemicelluloses, cellulose and lignin), which contained up to 50.4% and 43.03% respectively. The second largest component was protein which the whole stem flour contained 9.09% of it and the peeled stem flour contained 11.97% of it. Both of the flour contained high vitamin C (3.64–3.76%) and phenolic compounds (43.55–44.54
mg/g). Either whole or peeled stem flour showed antioxidant activity up to 91% of inhibition and antibacterial activity against Escherichia coli, Staphylococcus aureus as well as Salmonella typhi. The resulting flour has been successfully applied as substitute and additional ingredients to make fiber enriched food products.
Keywords: Drying temperature, phytochemical, pitaya
stem flour, proximate analysis
Ruth Chrisnasari, Chriselda Catya Sudono, Maria Rosari Dwi Utami, Ardhia Deasy Rosita Dewi and Tjandra Pantjajani
904 Pertanika J. Trop. Agric. Sc. 42 (3): 903 - 920 (2019)
INTRODUCTION
Red pitaya or known as red dragon fruit (Hylocereus polyrhizus) is a member of the Cactaceae family from the Cactoidea subfamily of the Cactea tribe. This fruit has been popular because of its nutritional composition and antioxidant activity. Many researchers have conducted some studies to explore the potential use of red pitaya fruit and peel as prospective functional food products and sources of natural pigment (Ho & Latif, 2016; Jamilah et al., 2011; Rebecca et al., 2010; Tenore et al., 2012). However, the study on utilization of red pitaya stem for food product has not been conducted yet.
Red pitaya stem is an abundant agricultural waste. In the local pitaya plantations in East Java – Indonesia, as much as ±60 ton per hectare, red pitaya stem can be obtained at every harvest time. During that time, red pitaya stem is only limited to be used for transplant and animal feed. Jafaar et al. (2009) reported that the stem of red pitaya still had a high nutritional value, especially the ascorbic acid content which was found to be higher than the fruit flesh. One of the efforts to exploit red pitaya stem is by making it as flour. The flouring process consists of several stages including removal of thorns and bark, reductions of size, drying, flouring, and sieving. The drying temperature is a critical controlled step to produce pitaya stem flour with high vitamin C, since it is easily destroyed in high temperature.
In the other hand, the research on exploration of agricultural biomass as a source of dietary fiber has increased in the
last decade (Dungani et al., 2016). Pitaya stem can be a new candidate to be utilized as a source of dietary fiber. The consumption of dietary fiber has been correlated with the prevention of many diseases (Dahl & Stewart, 2015). Thus, determination of proximate and phytochemical properties of red pitaya stem flour is important to be done. In this research, red pitaya stem was processed into flour by using the whole stem (epidermis and cortex) and peeled stem (cortex only). The bark stem (epidermis) of red pitaya is green while the cortex is greenish white. The green color of the plant is generally caused by chlorophyll. Chlorophyll and its derivatives have been reported to have anti-mutagenic activity (Ong et al., 1986) and antioxidants (Lanfer-Marquez et al., 2005). Chlorophyll also contributes to the appearance of the final color of product. In addition to the chlorophyll, bark also has high enough fiber content and vitamin C, so the effect of stripping the bark will have an effect on the nutritional composition and appearance of red pitaya stems flour. The obtained red pitaya stem flours then are analyzed to know its proximate and phytochemical properties. By knowing its characteristics, the flour can be applied to create a new fiber enriched food products.
MATERIALS AND METHODS
Preparation and Production of Red Pitaya Stem Flour
The red pitaya stem used in this research was taken from plantation in Banyuwangi, East Java, Indonesia. The thorns were removed

The Properties and Application of Red Pitaya Stem Flour
905Pertanika J. Trop. Agric. Sc. 42 (3): 903 - 920 (2019)
from the stems and then the stems were washed with running water. The whole stem flour was made from both epidermis and cortex of the stem, while peeled stem flour was made only from the cortex of the stem. The whole and peeled stems were thinly sliced (±0.2 mm) then dried in 50ºC using cabinet dryer. The drying process was stopped until it reached a moisture content of ±3-5%. The dried sliced stems were mashed and sieved into 70 mesh size. The obtained flours were then analyzed for proximate and phytochemical analyses and used to make food products hereinafter.
Determination of Drying Temperature for the Production of Red Pitaya Stem Flour
The peeled stem flours dried using three different temperatures (40, 50 and 60ºC) were analyzed for their vitamin C level. The drying time to achieve ±3-5% of moisture content was also monitored. The vitamin C content and drying time were used to determine the best drying temperature. Statistical analysis was conducted using One Way ANOVA (Pvalue<0.05) followed by Tukey multiple comparison test. The selection of drying temperature was based on the shortest time while the vitamin C content still could be preserved. The selected temperature was then used to prepare the red pitaya stem flour for further analyses.
Analysis of Red Pitaya Stem Flour
The whole stem and peeled stem of red pitaya stem flour were analyzed for proximate and phytochemical analyses. All
analyses were conducted in triplicate. The difference between samples was determined using T-test (Pvalue <0.05). The protocol for proximate and phytochemical analyses is described as follows.
Proximate Analysis
Moisture Content. As much as 2 g of the sample was placed in the crucible which its constant weight has been known. The sample then was placed inside 105 °C drying oven (Memmert 600, Germany) for 3-5 h and placed in the desiccators afterwards for allowing cooling. The dried sample was weighed until it achieved its constant weight (weighing difference was less than 0.2 mg). The formula for moisture content calculation described as follows:
Moisture content (%) =
W2 – W3× 100
W2 – W1
Note: W1 = weight of crucible; W2 = weight of crucible and sample before drying; and W3 = weight of crucible and sample after drying
Ash. The ash content measurement was conducted by weighing 2 grams of sample and put it into crucible. The total initial weight of the sample and the crucible was recorded. The sample was then placed in a muffle furnace oven (Daihan Scientific FX-14, Korea) at 550°C for 8 h. The sample was placed in the desiccators for cooling and weighed until it achieved its constant weight. The ash content was calculated as:
Ruth Chrisnasari, Chriselda Catya Sudono, Maria Rosari Dwi Utami, Ardhia Deasy Rosita Dewi and Tjandra Pantjajani
906 Pertanika J. Trop. Agric. Sc. 42 (3): 903 - 920 (2019)
Ash content (%) =
W2 – W3× 100
W2 – W1
Note: W1 = weight of crucible; W2 = weight of crucible and sample before ashing; and W3 = weight of crucible and sample after ashing
Reducing Sugar and the Total Sugar. The sample was prepared by dissolving the 5 grams of flour into 100 ml distilled water which stirred for 1 hour. The non-soluble part was separated with the soluble part by
centrifugation 6,708 × g for 10 minutes. The soluble part then taken for further sugar analyses and the added distilled water was calculated as a dilution factor. The concentration of reducing sugar was determined by dinitrosalicylic (DNS) colorimetric assay (Miller, 1959). The total sugar was determined by sulfuric acid phenol method (Dubois et al., 1956). Both of the total and reducing sugar determinations were using glucose as sugar standard, and the formula described as follows:
Reducing sugar (%) =Reducing sugar concentration × dilution volume
× 100Initial weight of sample
Total sugar (%)=
Total sugar concentration × dilution volume× 100
Initial weight of sample
Starch. The concentration of starch was determined by weighing sample of 5 grams and added with 50 ml of distilled water into a 250 ml glass beaker and stirred for 1 hour. The suspension is filtered and washed with distilled water until the volume of filtrate is 250 ml. The filtrate is discarded. The residue on the filter paper was washed 5 times with 10 ml of ether and allowed to evaporate. The residue then washed with 150 ml of 10% alcohol to release dissolved carbohydrates. The residue in the filter paper was then moved to Erlenmeyer and washed with 200 ml of distilled water and
20 ml of 25% HCl. The Erlenmeyer then covered with condenser and then heated in boiling water for 2.5 hours. The solution was allowed to cool then neutralized with 45% NaOH solution and dilution was carried out until the volume was reached 500 ml. The sample then was filtered and the sugar content expressed as glucose was determined from the obtained filtrate by dinitrosalicylic (DNS) colorimetric assay for reducing sugar measurement. Reducing sugar weight was multiplied by 0.9 as the weight of starch. Reducing sugar weight and starch content equations are listed below:
Reducing sugar weight = Reducing sugar concentration × dilution volume
Starch content (%) =Reducing sugar weight × 0.9
× 100Initial weight of sample
The Properties and Application of Red Pitaya Stem Flour
907Pertanika J. Trop. Agric. Sc. 42 (3): 903 - 920 (2019)
Lignoce l lu loses . The ana lys i s o f lignocelluloses (lignin, cellulose, and hemicelluloses) was conducted according to Chesson (1981). As much as one gram of flour sample (a) and 150 ml of distilled water were mixed and heated in a 95ºC water bath for 1 hour. The mixture was filtrated and the residue was rinsed with 300 ml of hot water. The residue was dried in an oven to a constant weight (b). The residue was added with 150 ml of H2SO4 1N and heated in a 90-100ºC water bath for an hour. The mixture was filtered and rinsed with 300 ml of hot water. Then, the residue was dried (c). Dry residue was soaked in 10 ml of 72% H2SO4 for 4 hours at room temperature. After that, 150 ml of H2SO4 1N was added to the mixture and refluxed in the water bath for 1 hour. The solid was rinsed with 400 ml of distilled water and heated in an oven at 105ºC and a constant weight was weighed. The solid was burnt in furnace and the ash was weighed (e). The formula for calculation of percent cellulose, hemicellulose, and lignin described as follows:
Hemicellulose (%) =b – c
× 100a
Cellulose (%) =c – d
× 100a
Lignin (%) =d – e
× 100a
Note: a = weight of sample (gram); b = weight of first residue (gram); c = weight of second residue (gram); d = weight of third residue (gram); e = weight of ash (gram)
Crude Fiber. As much as 2 grams of fat-free sample was added with 50 ml of 1.25% H2SO4 and put into 500 ml Erlenmeyer. This mixture was boiled for 30 minutes using condenser, and was added with 3.25% NaOH then boiled again for 30 minutes. The samples then immediately filtered in hot condition using a Buchner funnel with non-gray Whatman 54, 41, or 541 filter paper which had been dried and known for its weight. The residue on the filter paper was washed sequentially with 1.25% hot H2SO4, hot water, and 96% ethanol. The filter paper and its contents were lifted and placed on a crucible (that has known for its weight) and dried at 105ºC. The sample was then cooled and guided until a fixed weight was obtained. The weight of the residue represents the weight of crude fiber. The percent of the crude fiber was calculated using the following formula:
Crude fiber (%)
=
Weight of crude fiber
× 100Weight of sample
Crude Protein. The crude protein content was evaluated using micro-Khjeldal method (Koch & McMeekin, 1924). As much as 1 g of the sample was placed inside a Kjeldahl flask. The sample was then added with 15 g of K2SO4, 1 mg of CuSO4 catalyst solution, 1 g of catalyst selen, boiling stone and 25 mg of concentrated H2SO4. The mixture then was boiled and the color changed into a clear green. The mixture was then cooled off and diluted using distilled water as needed. 75 ml of 30 % NaOH solution was given
Ruth Chrisnasari, Chriselda Catya Sudono, Maria Rosari Dwi Utami, Ardhia Deasy Rosita Dewi and Tjandra Pantjajani
908 Pertanika J. Trop. Agric. Sc. 42 (3): 903 - 920 (2019)
before it was distilled for 5–10 min until the solution reached 150 mL, with 50 mL of 4 % H3BO3 solution posing as the container. The solution was then titrated using 0.1 N HCl. The difference in the total value of
the titrated sample and the blank, posed as the total value of nitrogen. The protein content is obtained through the process of multiplying N% with 6.25 convection factor.
N (%) =(mL of HCl in sample – mL of HCl in blank) × N HCl × 1.4007
× 100Weight of sample in gram
Protein content (%) = N % × 6.25
Fat. The fat content was measured by directly extracting the pitaya stem flour with petroleum ether in Soxhlet extractor for 4 h. The residue after solvent removal in round
bottom flask represents the fat content of the sample. The fat content calculation was conducted as follows:
Fat content (%) =Weight of the residue
× 100Weight of sample
Phytochemical Analysis
Vitamin C. Vitamin C was measured by mixing 100 mg of sample with 10 ml of distilled water and then stirred for 2-3 minutes. The solution was added with 5 ml of starch indicator and titrated with 0.1 N
Iodine solution which was standardized with Na2S2O3 solution which has standardized by KIO3 0.1 N as the primary standard solution. Then, the titration was stopped when the solution titrated with iodine solution was dark blue and lasted for about 1 minute.
Vitamin C (%) =Mr of Ascorbic Acid × N iodine × V iodine (L)
× 100Weight of the sample
Antioxidant Activity. Testing of antioxidant activity was carried out using DPPH reagent (2, 2-diphenyl-1-picrylhydrazyl). The test was carried out by adding 0.5 ml 10,000 ppm of the sample with 0.5 ml of DPPH 0.1 mM (in ethanol). The control solutions were made by replacing samples with sample solvents and added with 0.5 ml of DPPH
0.1 mM (in ethanol). Blank solutions were made by using sample solvents, while all tubes were incubated in a dark room for 30 minutes. After that, measurements were taken by reading the absorbance using a spectrophotometer at a wavelength of 517 nm (Marques et al., 2012). The percent of inhibition was calculated using this formula:
The Properties and Application of Red Pitaya Stem Flour
909Pertanika J. Trop. Agric. Sc. 42 (3): 903 - 920 (2019)
Total Phenolic Compound. As much as 200 µl of 2,000 ppm flour samples in water were added with 2.5 ml of Folin-Ciocalteau reagent (10% v/v) and 2 ml of Na2CO3 (7.5% w/v) and homogenized then incubated for 15 minutes at 45 ̊C. The absorbance of the solution was then measured by a spectrophotometer at a wavelength of 765 nm. The total phenolic compounds expressed as milligrams (mg) gallic acid equivalent per gram of sample (mg GAE/g sample). As a standard, gallic acid was used in ethanol at various concentrations (0, 5, 10, 20, 40, 80 and 100 ppm) (Javanmardi et al., 2003).
Antibacterial Activity. A total of 100 mg of red pitaya stem (whole and peeled) flour samples were dissolved into 100 µl distilled water to be tested for antimicrobial activity. Antimicrobial activity was aimed primarily towards pathogenic bacteria such as Staphylococcus aureus, Escherichia coli, and Salmonella typhimurium. Each of these pathogenic microbes was grown in nutrient broth to reach OD600 = 0.5. Furthermore, antimicrobial testing using the pour plate technique was carried out by adding 100 µL of bacteria to 15 ml of nutrient agar and homogenized. The media was then poured into sterile petri dishes and left until the media was solidified. Sterile cylinder cups were planted partially on the media to contain microbial inoculums and added with 100 μl of positive control,
negative control, and samples. The media then was incubated at 37ºC for 24 hours. Observations were made by determining the diameter of the clear zone formed around the cylinder cup. The positive controls used for Staphylococcus aureus and Escherichia coli were ampicillin (100 mg/ml) and chloramphenicol (5 mg/ml) respectively, while the negative controls used were distilled water as the solvents of the samples.
Toxicity Test. Toxicity test was carried out using the Brine Shrimp Lethality Test (BSLT) method using Artemia salina. As much as 10 mg of shrimp eggs A. salina was grown in 100 ml of filter-sterilized seawater. The hatching temperature was ± 25-30ºC and pH ± 6-7 for 48 h. After the hatching process, the active nauplii were collected and used for the assay. As much as 20 ml of pitaya stem flour in brine solution (250 ppm, 500 ppm, 1000 ppm and 1500 ppm) was put into a petri dish containing 20 nauplii and incubated at room temperature for 24 h and surviving larvae were counted. The experiments were conducted along with control and each treatments were conducted in triplicate.
The Application of Red Pitaya Stem Flour on Food Products
Red pitaya whole stem and peeled stem flour were applied to enrich several food products, i.e. cake, cookies, noodle, pudding, yoghurt and jelly drink. Descriptive sensory
Inhibition (%) =Absorbance of control – (absorbance of sample – blank)
× 100Absorbance of control
Ruth Chrisnasari, Chriselda Catya Sudono, Maria Rosari Dwi Utami, Ardhia Deasy Rosita Dewi and Tjandra Pantjajani
910 Pertanika J. Trop. Agric. Sc. 42 (3): 903 - 920 (2019)
evaluations were carried out for those products using five selected trained panelist. The selection began with thirty people from both students and staffs in our institution who committed to attend the training and evaluation sessions. The screening procedure to obtain five selected trained panelist was based on Meilgaard et al. (1999). The trained panelists were involved to generate lexicon to evaluate several food products enriched with pitaya stem flour which consist of appearance, aroma, taste, color and texture attributes using a 0–15 scale. The food products composition were added or substituted with pitaya stem flour using following proportions: yoghurt (addition of 1, 2 and 3%), cake (20% substitution of total flour), cookies (25% substitution of total flour), noodle (substitution 5, 10 and 15% of total flour), pudding (addition of 1, 2 and 3%) and jelly drink (addition of 1, 2 and 3%). Analysis of variance (ANOVA) followed with Tukey test were used to determine the differences between samples, excepting cake and cookies data analysis were using one tailed T-test. All statistical analyses were performed using IBM SPSS Statistic 24 (SPSS Inc, USA).
RESULTS AND DISCUSSION
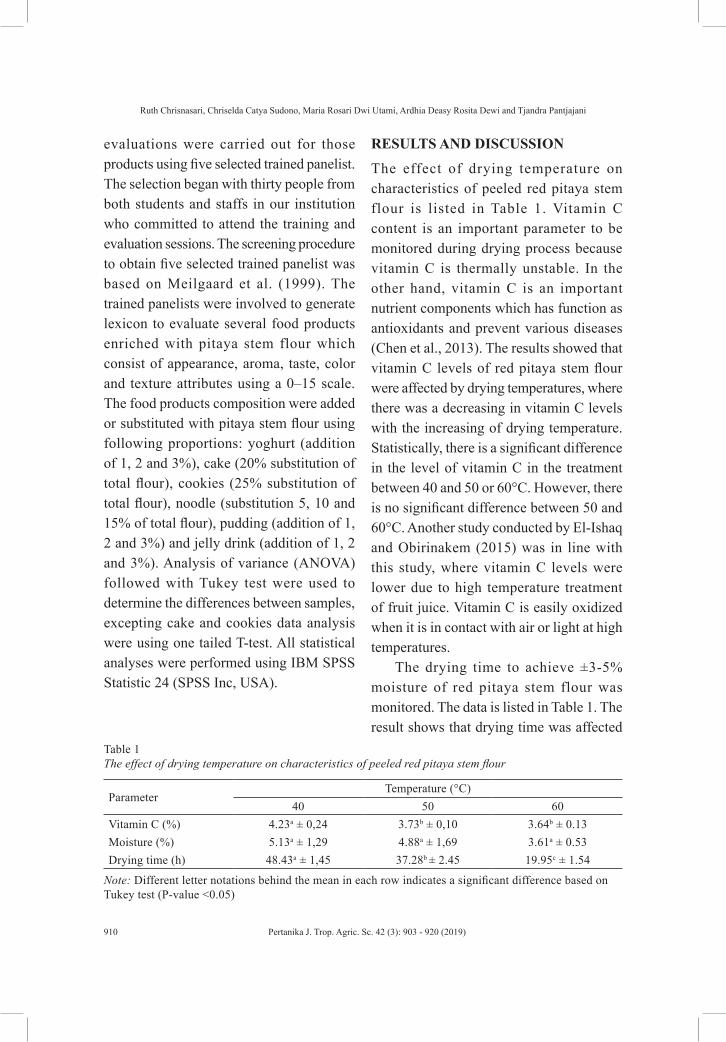
The effect of drying temperature on characteristics of peeled red pitaya stem flour is listed in Table 1. Vitamin C content is an important parameter to be monitored during drying process because vitamin C is thermally unstable. In the other hand, vitamin C is an important nutrient components which has function as antioxidants and prevent various diseases (Chen et al., 2013). The results showed that vitamin C levels of red pitaya stem flour were affected by drying temperatures, where there was a decreasing in vitamin C levels with the increasing of drying temperature. Statistically, there is a significant difference in the level of vitamin C in the treatment between 40 and 50 or 60°C. However, there is no significant difference between 50 and 60°C. Another study conducted by El-Ishaq and Obirinakem (2015) was in line with this study, where vitamin C levels were lower due to high temperature treatment of fruit juice. Vitamin C is easily oxidized when it is in contact with air or light at high temperatures.
The drying time to achieve ±3-5% moisture of red pitaya stem flour was monitored. The data is listed in Table 1. The result shows that drying time was affected
Table 1The effect of drying temperature on characteristics of peeled red pitaya stem flour
ParameterTemperature (°C)
40 50 60Vitamin C (%) 4.23a ± 0,24 3.73b ± 0,10 3.64b ± 0.13Moisture (%) 5.13a ± 1,29 4.88a ± 1,69 3.61a ± 0.53Drying time (h) 48.43a ± 1,45 37.28b ± 2.45 19.95c ± 1.54
Note: Different letter notations behind the mean in each row indicates a significant difference based on Tukey test (P-value <0.05)
The Properties and Application of Red Pitaya Stem Flour
911Pertanika J. Trop. Agric. Sc. 42 (3): 903 - 920 (2019)
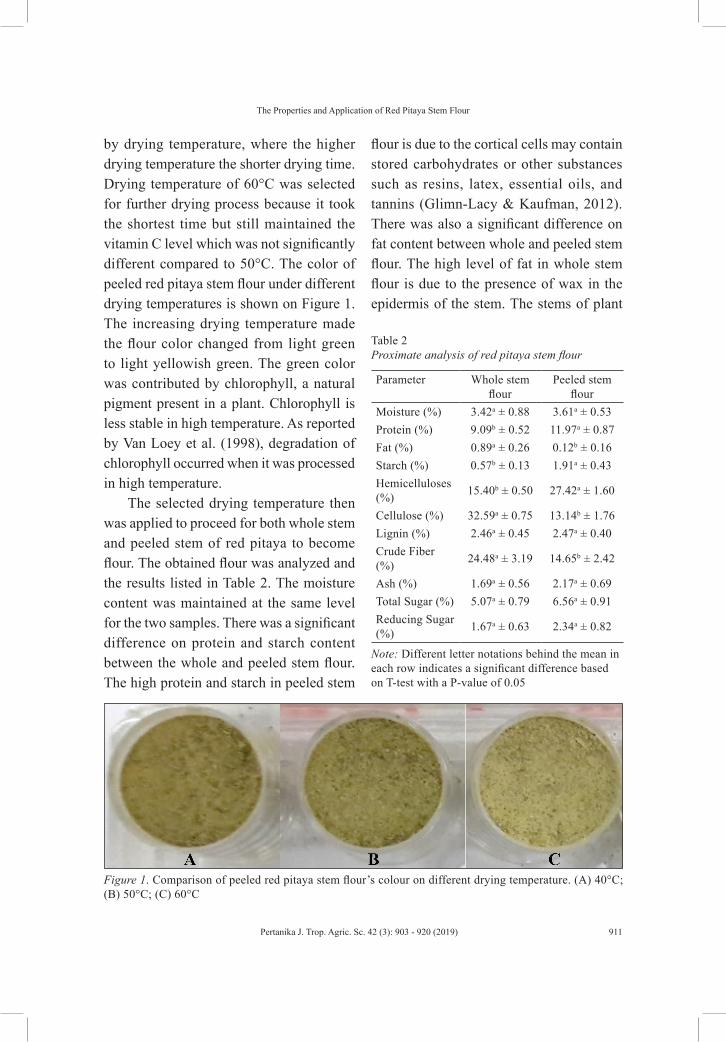
by drying temperature, where the higher drying temperature the shorter drying time. Drying temperature of 60°C was selected for further drying process because it took the shortest time but still maintained the vitamin C level which was not significantly different compared to 50°C. The color of peeled red pitaya stem flour under different drying temperatures is shown on Figure 1. The increasing drying temperature made the flour color changed from light green to light yellowish green. The green color was contributed by chlorophyll, a natural pigment present in a plant. Chlorophyll is less stable in high temperature. As reported by Van Loey et al. (1998), degradation of chlorophyll occurred when it was processed in high temperature.
The selected drying temperature then was applied to proceed for both whole stem and peeled stem of red pitaya to become flour. The obtained flour was analyzed and the results listed in Table 2. The moisture content was maintained at the same level for the two samples. There was a significant difference on protein and starch content between the whole and peeled stem flour. The high protein and starch in peeled stem
Figure 1. Comparison of peeled red pitaya stem flour’s colour on different drying temperature. (A) 40°C; (B) 50°C; (C) 60°C
Table 2Proximate analysis of red pitaya stem flour
Parameter Whole stem flour
Peeled stem flour
Moisture (%) 3.42a ± 0.88 3.61a ± 0.53Protein (%) 9.09b ± 0.52 11.97a ± 0.87Fat (%) 0.89a ± 0.26 0.12b ± 0.16Starch (%) 0.57b ± 0.13 1.91a ± 0.43Hemicelluloses (%) 15.40b ± 0.50 27.42a ± 1.60
Cellulose (%) 32.59a ± 0.75 13.14b ± 1.76Lignin (%) 2.46a ± 0.45 2.47a ± 0.40Crude Fiber (%) 24.48a ± 3.19 14.65b ± 2.42
Ash (%) 1.69a ± 0.56 2.17a ± 0.69Total Sugar (%) 5.07a ± 0.79 6.56a ± 0.91Reducing Sugar (%) 1.67a ± 0.63 2.34a ± 0.82
Note: Different letter notations behind the mean in each row indicates a significant difference based on T-test with a P-value of 0.05
flour is due to the cortical cells may contain stored carbohydrates or other substances such as resins, latex, essential oils, and tannins (Glimn-Lacy & Kaufman, 2012). There was also a significant difference on fat content between whole and peeled stem flour. The high level of fat in whole stem flour is due to the presence of wax in the epidermis of the stem. The stems of plant
Ruth Chrisnasari, Chriselda Catya Sudono, Maria Rosari Dwi Utami, Ardhia Deasy Rosita Dewi and Tjandra Pantjajani
912 Pertanika J. Trop. Agric. Sc. 42 (3): 903 - 920 (2019)
sometimes covered with smooth layers of wax which give them a whitish surface color and protect them from intense sunlight by acting as a moisture barrier (Raven, et al., 1981). From the data listed in Table 2, it also can be seen that there is a significant difference on crude fiber, hemicellulose and cellulose content between whole and peeled stem flour. Hemicellulose is a polysaccharide matrix found in plant biomass about 20-30% of the plants dry weight. It is stated that hemicellulose is a polysaccharide matrix as a filler of space between cellulose along with lignin in plant cell walls (Bergander & Salmen, 2002). However, there is no significant difference between whole and peeled stem flour on lignin, ash, starch, total sugar and reducing sugar content. Jaafar et al. (2009) suggested that red pitaya stems had a total ash content of 1.5% in young stems and 4.5% in stems that were quite old.
Phytochemical properties of red pitaya stem flour were shown in Table 3. Statistically, there was no significant difference of vitamin C and antioxidant activity for whole stem and peeled stem flour. However, there was a significant difference on the total phenolic compound between whole stem and peeled stem flour.
It indicates that the epidermis contributes to higher phenolic compound than the cortex. The differential accumulation of the total phenols is associated with differential cytological and physiological activities within tissue and organs. The production of these compounds is highly ordered process and regulated by differential expression of genes involved in phenylpropanoid pathway (Chang et al., 2009; Mamti et al., 2006). The phenolic compounds also reported to have antioxidant activity against free radical compounds (Loganayaki et al., 2013). However, in this experiment there was no clear relationship between the levels of phenolic compounds and antioxidant activity. Where the total of phenolic compounds between whole and peeled flour differed significantly, the antioxidant activity was not significantly differed. This can be caused by differences in phenolic components in the epidermis of pitaya stem which can cause different antioxidant activities, depending on the phenolic structure (Nićiforović et al., 2010). This result is also in accordance with other findings reported by Bajpai et al. (2005) and Sengul et al. (2009) which stated no correlation between total phenolic content and antioxidant activities of medicinal plant
Table 3Phytochemical properties of red pitaya stem flour
Parameter Whole stem flour Peeled stem flourVitamin C (%) 3.76a ± 0.18 3.64a ± 0.13Total Phenolic Compound (mg/g) 44.54a ± 0.11 43.55b ± 0.19Antioxidant Activity (% inhibition)* 90.89a ± 2.77 90.67a ± 0.86
Note: Different letter notations behind the mean in each row indicate a significant difference based on T-test with a P-value of 0.05. *Ascorbic acid was used as positive control for antioxidant activity assay. The percent of inhibition of ascorbic acid was 91.46%
The Properties and Application of Red Pitaya Stem Flour
913Pertanika J. Trop. Agric. Sc. 42 (3): 903 - 920 (2019)
extracts. Moreover, the observed antioxidant activity was not only from the phenolic compounds, but also from the presence of other phytochemicals such pigments and vitamins as well as the synergistic effects among them. On the other hand, Folin Ciocalteu method used for total phenolic content determination is not an absolute measurement of the amount of phenolic substances (Sengul et al., 2009).
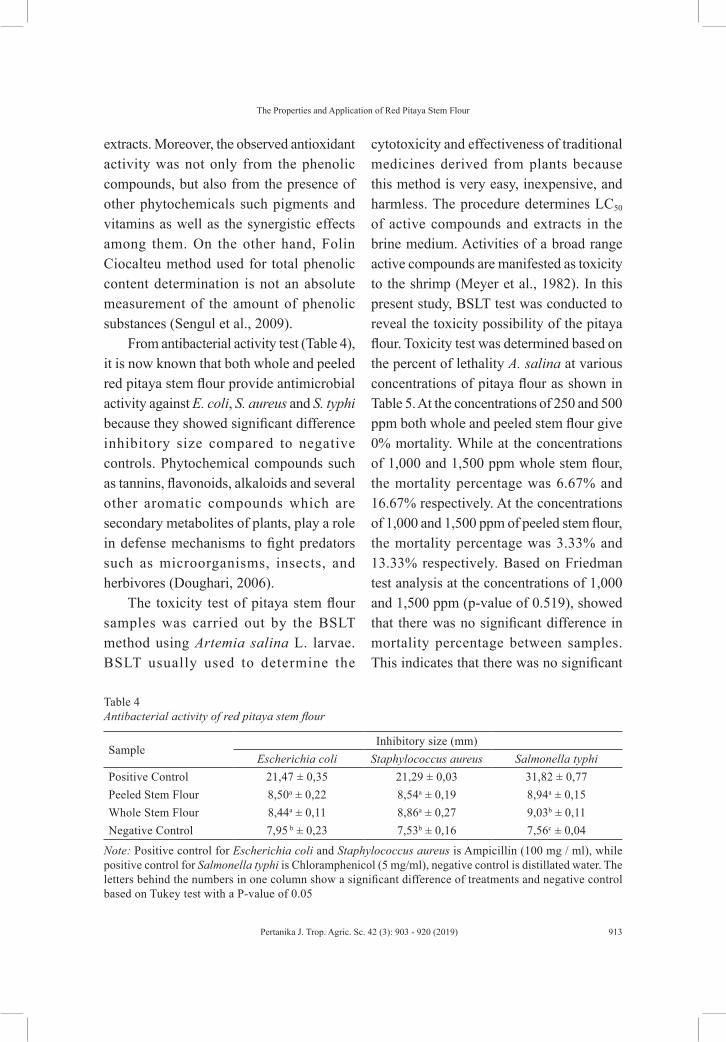
From antibacterial activity test (Table 4), it is now known that both whole and peeled red pitaya stem flour provide antimicrobial activity against E. coli, S. aureus and S. typhi because they showed significant difference inhibitory size compared to negative controls. Phytochemical compounds such as tannins, flavonoids, alkaloids and several other aromatic compounds which are secondary metabolites of plants, play a role in defense mechanisms to fight predators such as microorganisms, insects, and herbivores (Doughari, 2006).
The toxicity test of pitaya stem flour samples was carried out by the BSLT method using Artemia salina L. larvae. BSLT usually used to determine the
cytotoxicity and effectiveness of traditional medicines derived from plants because this method is very easy, inexpensive, and harmless. The procedure determines LC50
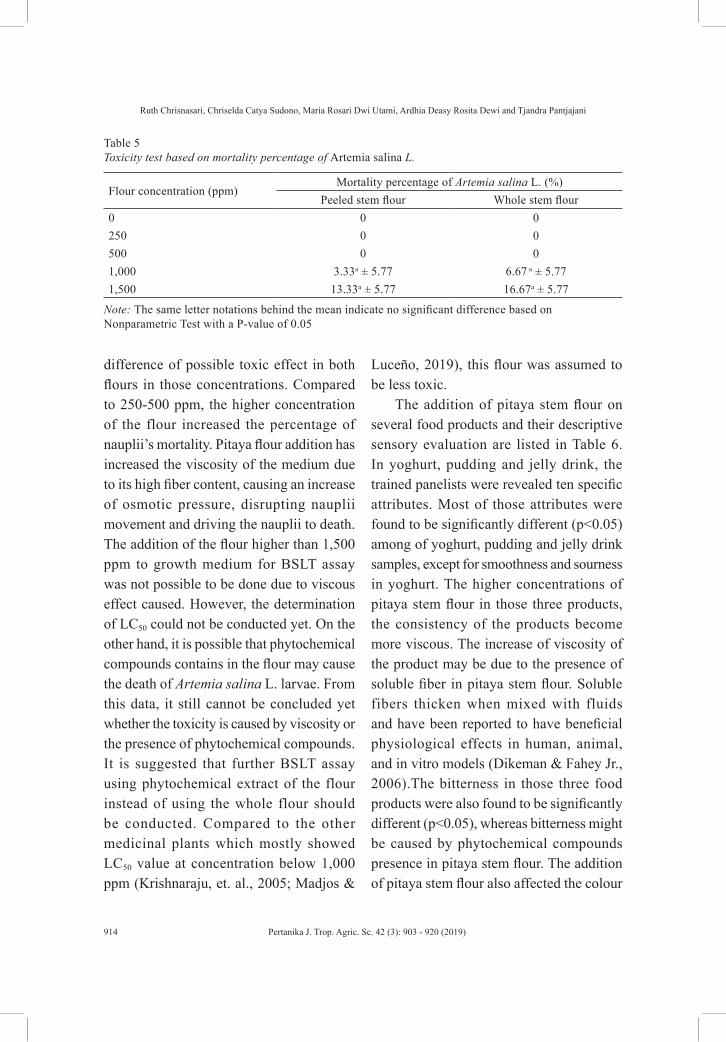
of active compounds and extracts in the brine medium. Activities of a broad range active compounds are manifested as toxicity to the shrimp (Meyer et al., 1982). In this present study, BSLT test was conducted to reveal the toxicity possibility of the pitaya flour. Toxicity test was determined based on the percent of lethality A. salina at various concentrations of pitaya flour as shown in Table 5. At the concentrations of 250 and 500 ppm both whole and peeled stem flour give 0% mortality. While at the concentrations of 1,000 and 1,500 ppm whole stem flour, the mortality percentage was 6.67% and 16.67% respectively. At the concentrations of 1,000 and 1,500 ppm of peeled stem flour, the mortality percentage was 3.33% and 13.33% respectively. Based on Friedman test analysis at the concentrations of 1,000 and 1,500 ppm (p-value of 0.519), showed that there was no significant difference in mortality percentage between samples. This indicates that there was no significant
Table 4Antibacterial activity of red pitaya stem flour
SampleInhibitory size (mm)
Escherichia coli Staphylococcus aureus Salmonella typhiPositive Control 21,47 ± 0,35 21,29 ± 0,03 31,82 ± 0,77Peeled Stem Flour 8,50a ± 0,22 8,54a ± 0,19 8,94a ± 0,15Whole Stem Flour 8,44a ± 0,11 8,86a ± 0,27 9,03b ± 0,11Negative Control 7,95 b ± 0,23 7,53b ± 0,16 7,56c ± 0,04
Note: Positive control for Escherichia coli and Staphylococcus aureus is Ampicillin (100 mg / ml), while positive control for Salmonella typhi is Chloramphenicol (5 mg/ml), negative control is distillated water. The letters behind the numbers in one column show a significant difference of treatments and negative control based on Tukey test with a P-value of 0.05
Ruth Chrisnasari, Chriselda Catya Sudono, Maria Rosari Dwi Utami, Ardhia Deasy Rosita Dewi and Tjandra Pantjajani
914 Pertanika J. Trop. Agric. Sc. 42 (3): 903 - 920 (2019)
Table 5Toxicity test based on mortality percentage of Artemia salina L.
Flour concentration (ppm)Mortality percentage of Artemia salina L. (%)
Peeled stem flour Whole stem flour0 0 0250 0 0500 0 01,000 3.33a ± 5.77 6.67 a ± 5.771,500 13.33a ± 5.77 16.67a ± 5.77
Note: The same letter notations behind the mean indicate no significant difference based on Nonparametric Test with a P-value of 0.05
difference of possible toxic effect in both flours in those concentrations. Compared to 250-500 ppm, the higher concentration of the flour increased the percentage of nauplii’s mortality. Pitaya flour addition has increased the viscosity of the medium due to its high fiber content, causing an increase of osmotic pressure, disrupting nauplii movement and driving the nauplii to death. The addition of the flour higher than 1,500 ppm to growth medium for BSLT assay was not possible to be done due to viscous effect caused. However, the determination of LC50 could not be conducted yet. On the other hand, it is possible that phytochemical compounds contains in the flour may cause the death of Artemia salina L. larvae. From this data, it still cannot be concluded yet whether the toxicity is caused by viscosity or the presence of phytochemical compounds. It is suggested that further BSLT assay using phytochemical extract of the flour instead of using the whole flour should be conducted. Compared to the other medicinal plants which mostly showed LC50 value at concentration below 1,000 ppm (Krishnaraju, et. al., 2005; Madjos &
Luceño, 2019), this flour was assumed to be less toxic.
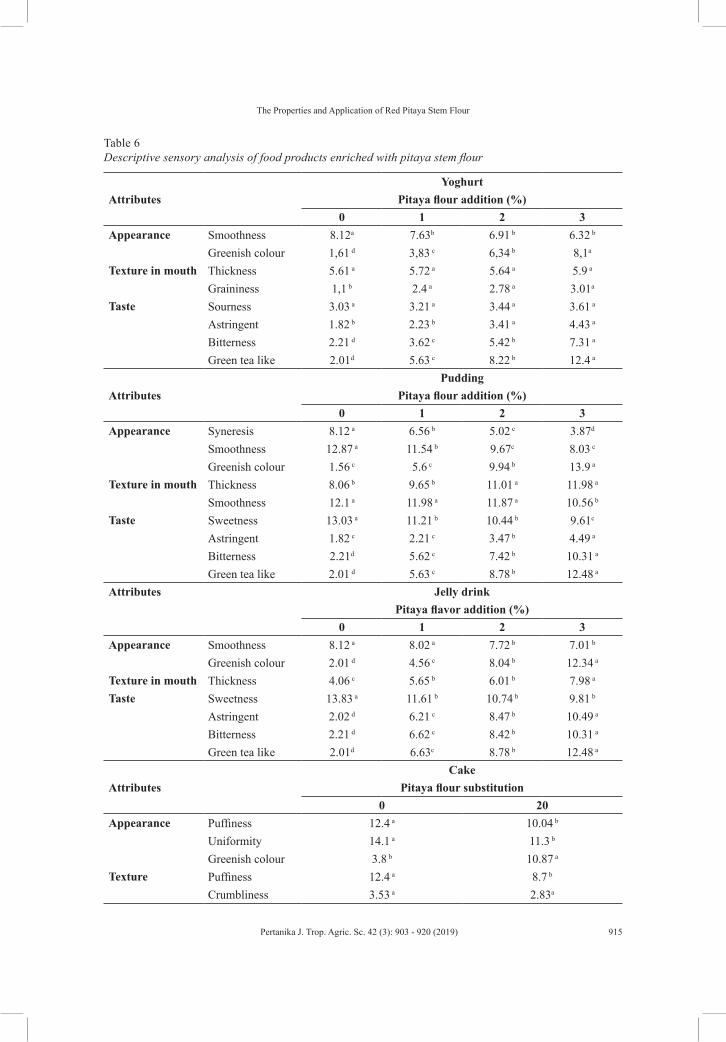
The addition of pitaya stem flour on several food products and their descriptive sensory evaluation are listed in Table 6. In yoghurt, pudding and jelly drink, the trained panelists were revealed ten specific attributes. Most of those attributes were found to be significantly different (p<0.05) among of yoghurt, pudding and jelly drink samples, except for smoothness and sourness in yoghurt. The higher concentrations of pitaya stem flour in those three products, the consistency of the products become more viscous. The increase of viscosity of the product may be due to the presence of soluble fiber in pitaya stem flour. Soluble fibers thicken when mixed with fluids and have been reported to have beneficial physiological effects in human, animal, and in vitro models (Dikeman & Fahey Jr., 2006).The bitterness in those three food products were also found to be significantly different (p<0.05), whereas bitterness might be caused by phytochemical compounds presence in pitaya stem flour. The addition of pitaya stem flour also affected the colour
The Properties and Application of Red Pitaya Stem Flour
915Pertanika J. Trop. Agric. Sc. 42 (3): 903 - 920 (2019)
Table 6Descriptive sensory analysis of food products enriched with pitaya stem flour
AttributesYoghurt
Pitaya flour addition (%)0 1 2 3
Appearance Smoothness 8.12a 7.63b 6.91 b 6.32 b
Greenish colour 1,61 d 3,83 c 6,34 b 8,1a
Texture in mouth Thickness 5.61 a 5.72 a 5.64 a 5.9 a
Graininess 1,1 b 2.4 a 2.78 a 3.01a
Taste Sourness 3.03 a 3.21 a 3.44 a 3.61 a
Astringent 1.82 b 2.23 b 3.41 a 4.43 a
Bitterness 2.21 d 3.62 c 5.42 b 7.31 a
Green tea like 2.01d 5.63 c 8.22 b 12.4 a
AttributesPudding
Pitaya flour addition (%)0 1 2 3
Appearance Syneresis 8.12 a 6.56 b 5.02 c 3.87d
Smoothness 12.87 a 11.54 b 9.67c 8.03 c
Greenish colour 1.56 c 5.6 c 9.94 b 13.9 a
Texture in mouth Thickness 8.06 b 9.65 b 11.01 a 11.98 a
Smoothness 12.1 a 11.98 a 11.87 a 10.56 b
Taste Sweetness 13.03 a 11.21 b 10.44 b 9.61c
Astringent 1.82 c 2.21 c 3.47 b 4.49 a
Bitterness 2.21d 5.62 c 7.42 b 10.31 a
Green tea like 2.01 d 5.63 c 8.78 b 12.48 a
Attributes Jelly drinkPitaya flavor addition (%)
0 1 2 3Appearance Smoothness 8.12 a 8.02 a 7.72 b 7.01 b
Greenish colour 2.01 d 4.56 c 8.04 b 12.34 a
Texture in mouth Thickness 4.06 c 5.65 b 6.01 b 7.98 a
Taste Sweetness 13.83 a 11.61 b 10.74 b 9.81 b
Astringent 2.02 d 6.21 c 8.47 b 10.49 a
Bitterness 2.21 d 6.62 c 8.42 b 10.31 a
Green tea like 2.01d 6.63c 8.78 b 12.48 a
Attributes Cake
Pitaya flour substitution0 20
Appearance Puffiness 12.4 a 10.04 b
Uniformity 14.1 a 11.3 b
Greenish colour 3.8 b 10.87 a
Texture Puffiness 12.4 a 8.7 b
Crumbliness 3.53 a 2.83a
Ruth Chrisnasari, Chriselda Catya Sudono, Maria Rosari Dwi Utami, Ardhia Deasy Rosita Dewi and Tjandra Pantjajani
916 Pertanika J. Trop. Agric. Sc. 42 (3): 903 - 920 (2019)
Table 6 (continue)
Attributes Cake
Pitaya flour substitution0 20
Texture Softness 13.5 a 12.3 b
Taste Sweetness 11.3 a 10.2 b
Green tea like 2.1 b 12.2 a
Aroma Bitterness 1.8 b 4.23 a
Green tea like 2.1 b 12.2 a
Baked 14.52 a 14.1a
Grassy like 2.2 b 11.4 a
Attributes Noodle
Pitaya flour substitution (%)0 5 10 15
Appearance Smoothness 11.3 a 11.43 a 11.01 a 10.97 a
Firmness 12,41d 11.8 c 11.01 b 8,1 a
Greenish colour 2.03 d 3.03 c 5.21 b 10.03 a
Texture Elasticity 13.01 a 12.4 a 11.8 a 9.6 b
Softness 11,1 a 11.4 a 10.08 a 9.7a
Taste Starchy like 3.03 a 3.21 a 3.44 a 3.61 a
Grassy like 1.82 b 2.23 b 3.41 a 4.43 a
Green tea like 2.21d 3.62 c 5.44 b 7.31 a
Aroma Bitterness 1.1 b 1.5 b 1.7 b 1.86 a
Grassy like 1.3 a 1.7 a 1.9 a 2.01 a
Green tea like 1.5c 2.4 b 3.14 b 4.51 a
Attributes Cookies
Pitaya flour substation (%)0 25
Appearance Baked colour 12.1 a 10.5 b
Uniformity 13.1 a 13.1 a
Greenish colour 2.6 b 4.67 a
Texture Hardness 6.63 a 6.63 a
Crunchiness 10.03 a 9.1a
Softness 9.1 a 9.1 a
Taste Sweetness 12.01 a 12.01 a
Green tea like 2.6 b 9.2 a
Bitterness 3.3 b 6.23 a
Aroma Green tea like 3.3 b 8.65 a
Baked 12.4 a 10.3 b
Grassy like 2.1 b 5.3 a
Note: The scale ranging from 0 – 15 (low to high). Different letter notations behind the mean in each row indicate a significant difference based on Tukey test (P-value <0.05) and T-test (P-value <0.05) (only for cake and cookies data analysis)
The Properties and Application of Red Pitaya Stem Flour
917Pertanika J. Trop. Agric. Sc. 42 (3): 903 - 920 (2019)
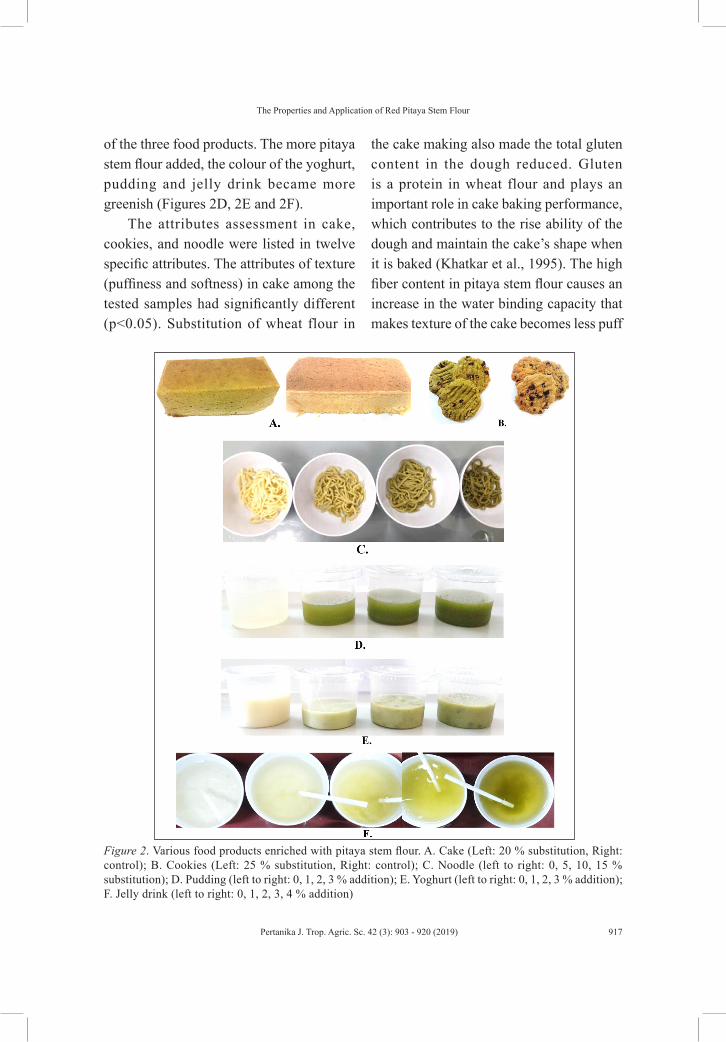
of the three food products. The more pitaya stem flour added, the colour of the yoghurt, pudding and jelly drink became more greenish (Figures 2D, 2E and 2F).
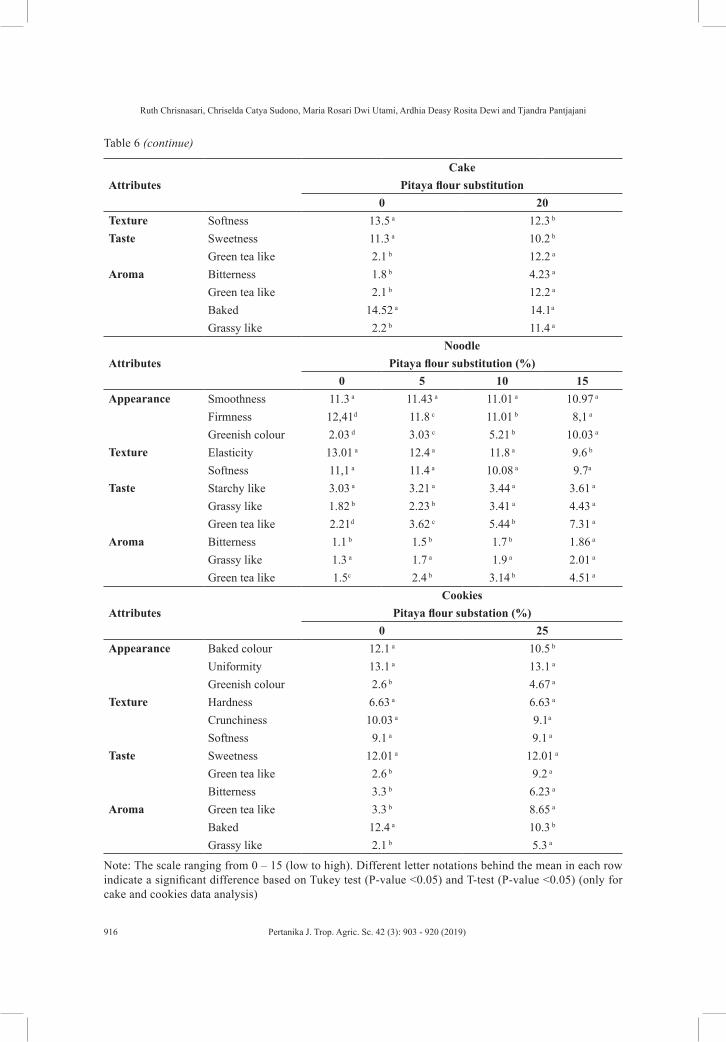
The attributes assessment in cake, cookies, and noodle were listed in twelve specific attributes. The attributes of texture (puffiness and softness) in cake among the tested samples had significantly different (p<0.05). Substitution of wheat flour in
the cake making also made the total gluten content in the dough reduced. Gluten is a protein in wheat flour and plays an important role in cake baking performance, which contributes to the rise ability of the dough and maintain the cake’s shape when it is baked (Khatkar et al., 1995). The high fiber content in pitaya stem flour causes an increase in the water binding capacity that makes texture of the cake becomes less puff
Figure 2. Various food products enriched with pitaya stem flour. A. Cake (Left: 20 % substitution, Right: control); B. Cookies (Left: 25 % substitution, Right: control); C. Noodle (left to right: 0, 5, 10, 15 % substitution); D. Pudding (left to right: 0, 1, 2, 3 % addition); E. Yoghurt (left to right: 0, 1, 2, 3 % addition); F. Jelly drink (left to right: 0, 1, 2, 3, 4 % addition)
Ruth Chrisnasari, Chriselda Catya Sudono, Maria Rosari Dwi Utami, Ardhia Deasy Rosita Dewi and Tjandra Pantjajani
918 Pertanika J. Trop. Agric. Sc. 42 (3): 903 - 920 (2019)
and soft (Yamazaki et al., 2005). Therefore, it is recommended to apply pitaya stem flour on cake products lower than 20%. In addition, substitution of wheat flour with pitaya stem flour made the colour of the cake more greenish (Figure 2A). In pitaya flour addition ranging from 5-15% were found to have no significantly different (p>0.05) among most of attributes in noodle samples, however elasticity, firmness, and greenish color given significantly different (p<0.05). The higher pitaya stem flour addition makes the color become more greenish (Figure 2C) and the texture less elastic. The elasticity is caused by gluten contained in wheat flour (Shewry et al., 1995). Substitution of wheat flour with pitaya stem flour reduced the gluten in the noodle so that the texture becomes less elastic. The appearance (baked and greenish color), taste (bitterness), and aroma attributes of cookies were found to be significantly different (p<0.05). The color of pitaya stem cookies represented in Figure 2B. However, the texture assessment in the cookies were found to have no significantly different (p>0.05) between the samples.
CONCLUSION
The red pitaya stem flour can be prepared using 60ºC drying temperature. This temperature can reduce the moisture content efficiently while the vitamin C content still preserved. The predominant component in whole stem flour was cellulose, followed by hemicellulose and protein. While the predominant component in peeled stem flour was hemicelluloses, followed by cellulose and protein. Both whole and peeled pitaya
stem flour can be used as functional food because it contains high vitamin C and phenolic compounds. Moreover it also shows antioxidant activity and antibacterial activity against Escherichia coli, Staphylococcus aureus as well as Salmonella typhi. The resulting flour has been successfully applied as substitute and additional ingredients to make fiber enriched food products.
ACKNOWLEDGMENT
The authors gratefully thank to Institute of Research and Community Service of the University of Surabaya (UBAYA)/Lembaga Penelitian dan Pengabdian Masyarakat (LPPM) for the research funding through the Competitive Grant with contract number 055/Lit/LPPM-01/FTB/XII/2016.
REFERENCESBajpai, M., Pande, A., Tewari, S. K., & Prakash, D.
(2005). Phenolic contents and antioxidant activity of some food and medicinal plants. International Journal of Food Sciences and Nutrition, 56(4), 287–291. doi: 10.1080/09637480500146606
Bergander, A., & Salmén, L. (2002). Cell wall properties and their effects on the mechanical properties of fibers. Journal of Materials Science, 37(1), 151–156.
Chang, J., Lu, J., & He, G. (2009). Regulation of polyphenols accumulation by combined express ion s i lenc ing key enzymes of phenylpropanoid pathway. Acta Biochimica et Biophysica Sinica, 41(2), 123–130.
Chen, G. C., Lu, D. B., Pang, Z., & Liu, Q. F. (2013). Vitamin C intake, circulating vitamin C and risk of stroke: A meta-analysis of prospective studies. Journal of the American Heart Association, 2(6), e000329.
The Properties and Application of Red Pitaya Stem Flour
919Pertanika J. Trop. Agric. Sc. 42 (3): 903 - 920 (2019)
Chesson, A. (1981). Effects of sodium hydroxide on cereal straws in relation to the enhanced degradation of structural polysaccharides by rumen microorganisms. Journal of the Science of Food and Agriculture, 32(8), 745–758.
Dahl, W. J., & Stewart, M. L. (2015). Position of the academy of nutrition and dietetics: Health implications of dietary fiber. Journal of the Academy of Nutrition and Dietetics, 115(11),1861–1870.
Dikeman, C. L., & Fahey Jr., G. C. (2006). Viscosity as related to dietary fiber: A review. Critical Reviews in Food Science and Nutrition, 46(8), 649–663.
Doughari, J. H. (2006). Antimicrobial activity of Tamarindus indica Linn. Tropical Journal of Pharmaceutical Research, 5(2), 597–603.
Dubois, M., Gilles, K. A., Hamilton, J. K., Rebers, P. A., & Smith, F. (1956). Colorimetric method for determination of sugars and related substances. Analytical Chemistry, 28(3), 350–356.
Dungani, R., Karina, M., Subyakto, Sulaeman, A., Hermawan, D., & Hadiyane A. (2016). Agricultural waste fibers towards sustainability and advanced utilization: A review. Asian Journal of Plant Sciences, 15(1–2), 42–55.
El-Ishaq, A., & Obirinakem, S. (2015). Effect of temperature and storage on vitamin C content in fruits juice. International Journal of Chemical Sciences, 1(2), 17–21.
Glimn-Lacy, J., & Kaufman, P. B. (2012). Botany illustrated: Introduction to plants, major groups, flowering plant families. New York, NY: Springer Publishing.
Ho, L. H., & Latif, N. W. A. (2016). Nutritional composition, physical properties, and sensory evaluation of cookies prepared from wheat flour and pitaya (Hylocereus undatus) peel flour blends. Cogent Food and Agriculture, 2(1), 11363–11369.
Jaafar, R. A., Rahman, A. R. B. A., Mahmod, N. Z. C., & Vasudevan, R. (2009). Proximate analysis of dragon fruit (Hylocereus polyrhizus). American Journal of Applied Sciences, 6(7), 1341–1346.
Jamilah, B. Shu, C. E., Kharidah, M., Dzulkily, M. A., & Noranizan, A. (2011). Physico-chemical characteristics of red pitaya (Hylocereus polyrhizus) peel. International Food Research Journal, 18(1), 279–286.
Javanmardi, J., Stushnoff, C., Locke E., & Vivanco, J. M. (2003). Antioxidant activity and total phenolic content of Iranian Ocimum accessions. Journal of Food Chemistry, 83(4), 574–550.
Khatkar, B. S., Bell, A. E., & Schofield, J. D. (1995). The dynamic rheological properties of glutens and gluten sub-fractions from wheats of good and poor bread making quality. Journal of Cereal Science, 22(1), 29–44. doi: 10.1016/S0733-5210(05)80005-0
Koch, F. C., & McMeekin, T. L. (1924). A new direct nesslerization micro-Kjeldahl method and a modification of the Nessler-Folin reagent for ammonia. Journal of the American Chemical Society, 46(9), 2066–2069.
Krishnaraju, A. V., Rao, T. V. N., Sundararaju, D., Vanisree, M., Tsay, H. S., & Subbaraju, G. V. (2005). Assessment of bioactivity of Indian medicinal plants using brine shrimp (Artemia salina) lethality assay. International Journal of Applied Science and Engineering, 3(2), 125-134.
Lanfer-Marquez, U. M., Barros, R. M. C., & Sinnecker, P. (2005). Antioxidant activity of chlorophylls and their derivatives. Food Research International, 38(8–9), 885-891.
Loganayaki, N., Siddhuraju, P., & Manian, S. (2013). Antioxidant activity and free radical scavenging capacity of phenolic extracts from Helicteres isora L. and Ceiba pentandra L. Journal of Food Science and Technology, 50(4), 687–695. doi: 10.1007/s13197-011-0389-x
Ruth Chrisnasari, Chriselda Catya Sudono, Maria Rosari Dwi Utami, Ardhia Deasy Rosita Dewi and Tjandra Pantjajani
920 Pertanika J. Trop. Agric. Sc. 42 (3): 903 - 920 (2019)
Madjos, G. G., & Luceño, A. M. (2019). Comparative cytotoxic properties of two varieties of Carica papaya leaf extracts from Mindanao, Philippines using Brine Shrimp Lethality Assay. Bulletin of Environment, Pharmacology and Life Sciences, 8(2), 113-118.
Mamti, G. E., Liang, Y., & Lu, J. (2006). Expression of basic genes involved in tea polyphenol synthesis in relation to accumulation of catechins and total tea polyphenols. Journal of the Science of Food and Agriculture, 86(3), 459–464.
Marques, M. R., Paz, D. D., Batista, L. P. R., Barbosa, C. O., Araújo, M. A. M., & Moreira-Araújo, R. S. R. (2012). An in vitro analysis of the total phenolic content, antioxidant power, physical, physicochemical, and chemical composition of Terminalia catappa Linn. fruits. Ciência e Tecnologia de Alimentos, 32(1), 209–213.
Meilgaard, M., Civille, G. V., & Carr, B. T. (1999). Sensory evaluation techniques (3rd ed.). Boca Raton, USA: CRC Press.
Meyer, B. N., Ferrigni, N. R., Putnam, J. E., Jacobson, L. B., Nichols, D. E., & McLaughlin, J. L. (1982). Brine shrimp: A convenient general bioassay for active plant constituents. Planta Medica, 45(5), 31–34.
Miller, G. L. (1959). Use of DNS reagent for determination of reducing sugars. Analytical Chemistry, 31(3), 426–428. doi: 10.1021/ac60147a030
Nićiforović, N., Mihailović, V., Mašković, P., Solujić, S., Stojković, A., & Muratspahić, D. P. (2010). Antioxidant activity of selected plant species; potential new sources of natural antioxidants. Food Chemistry and Toxicology, 48(11), 3125–3130. doi: 10.1016/j.fct.2010.08.007
Ong, T., Whong, W. Z., Stewart, J., & Brockman, H. E. (1986). Chlorophyllin: A potent antimutagen
against environmental and dietary complex mixtures. Mutation Research Letters, 173(2), 111–115.
Raven, P. H., Evert, R. F., & Curtis, H. (1981). Biology of plants. New York, NY: Worth Publishers.
Rebecca, O. P. S., Boyce, A. N., & Chandran, S. (2010). Pigment identification and antioxidant properties of red dragon fruit (Hylocereus polyrhizus). African Journal Biotechnology, 9(10), 1450–1454.
Sengul, M., Yildiz, H., Gungor, N., Cetin, B., Ezer, Z., & Ercisli, S. (2009). Total phenolic content, antioxidant and antimicrobial activities of some medicinal plants. Pakistan Journal of Pharmaceutical Sciences, 22(1), 102–106.
Shewry, P. R., Tatham, A. S., Barro, F., Barcelo P., & Lazzeri, P. (1995). Biotechnology of breadmaking: Unraveling and manipulating the multi-protein gluten complex. Nature Biotechnology, 13(11), 1185–1190.
Tenore, G. C., Novellino, E., & Basile, A. (2012). Nutraceutical potential and antioxidant benefits of red pitaya (Hylocereus polyrhizus) extracts. Journal of Functional Food, 4(1), 129–136.
Van Loey, A., Ooms, V., Weemaes, C., Van den Broeck, I., Ludikhuyze, L., Denys, S., & Hendrickx, M. (1998). Thermal and pressure-temperature degradation of chlorophyll in broccoli (Brassica oleracea L. italica) juice: A kinetic study. Journal of Agricultural and Food Chemistry, 46(12), 5289–5294.
Yamazaki, E., Murakami, K., & Kurita, O. (2005). Easy preparation of dietary fiber with the high water-holding capacity from food sources. Plant Foods for Human Nutrition, 60(1), 17–23.


![AVOCADO TOAST 9 morning - toutsuitehtx.com · aÇai / pitaya bowl* 9 [v] antioxidant-loaded super fruit blended aÇai or pitaya, house-made granola, fruit mix-ins .50 toppings .50](https://static.fdocuments.us/doc/165x107/5c5cb51609d3f245488bc382/avocado-toast-9-morning-acai-pitaya-bowl-9-v-antioxidant-loaded-super.jpg)