The Provision of Long-term Financing in the Transition ...econtv/transition_maturity.pdf · The...
33
The Provision of Long-term Financing in the Transition Economies by Nikola Tasić National Bank of Serbia and Neven Valev Georgia State University Abstract A new data set from the transition economies shows that the private sector has increasing access to long-term bank financing. In a few transition countries, credit has similar maturity structure to that in Western Europe, while in others credit remains mostly short- term. Several factors explain these differences: the political and institutional environment, bank privatization, the rate of inflation, the levels of economic and financial development, and the establishment of credit information sharing institutions. In contrast, the share of foreign owned banks and banking sector competition have no influence on credit maturity. Key words: financial development, credit maturity, liquidity, transition economies JEL Classification: G21, O16, P34 We would like to thank Thorsten Beck, Shiferaw Gurmu, Vassil Mihov, Felix Rioja, Sally Wallace as well as the participants in the SEA meetings in New Orleans and the EEA meetings in Boston for their helpful comments and suggestions. Tasić: Monetary Policy and Strategy Division, Economic Analyses and Research Department, National Bank of Serbia. E-mail: [email protected]. Valev: Department of Economics, Andrew Young School of Policy Studies, Georgia State University, Atlanta, GA 30303. Telephone: +1-404-413-0162. E-mail: [email protected]. The views expressed in this paper are those of the author, and do not necessarily represent the views of the National Bank of Serbia.
Transcript of The Provision of Long-term Financing in the Transition ...econtv/transition_maturity.pdf · The...

The Provision of Long-term Financing in the Transition Economies
by
Nikola Tasić National Bank of Serbia
and Neven Valev Georgia State University
Abstract
A new data set from the transition economies shows that the private sector has increasing access to long-term bank financing. In a few transition countries, credit has similar maturity structure to that in Western Europe, while in others credit remains mostly short-term. Several factors explain these differences: the political and institutional environment, bank privatization, the rate of inflation, the levels of economic and financial development, and the establishment of credit information sharing institutions. In contrast, the share of foreign owned banks and banking sector competition have no influence on credit maturity.
Key words: financial development, credit maturity, liquidity, transition economies JEL Classification: G21, O16, P34 We would like to thank Thorsten Beck, Shiferaw Gurmu, Vassil Mihov, Felix Rioja, Sally Wallace as well as the participants in the SEA meetings in New Orleans and the EEA meetings in Boston for their helpful comments and suggestions. Tasić: Monetary Policy and Strategy Division, Economic Analyses and Research Department, National Bank of Serbia. E-mail: [email protected]. Valev: Department of Economics, Andrew Young School of Policy Studies, Georgia State University, Atlanta, GA 30303. Telephone: +1-404-413-0162. E-mail: [email protected]. The views expressed in this paper are those of the author, and do not necessarily represent the views of the National Bank of Serbia.

1
The Provision of Long-term Financing in the Transition Economies
1. Introduction
Financing long-term capital investments is one of the important functions of the
financial system. Long-term investments usually have larger scale and incorporate
advanced technology that raises productivity and economic growth. However, these
investments require continuous infusion of funds for an extended period of time until
they reach gestation and generate high returns (Böhm-Bawerk, 1891, Cameron 1967, and
Kydland and Prescott 1982). Smaller, more liquid investments mature more rapidly but
yield smaller productivity gains. Bencivenga and Smith (1991) establish formally the
relationship between the availability of long-term financing and economic growth. In a
recent paper, Tasić and Valev (2008) provide supporting empirical evidence using data
from a broad sample of countries. They show that credit maturity matters for economic
growth: countries grow faster if their banking systems provide more long-term credit.
Given the importance of long-term financing, we wonder what factors influence
its availability. We address that question in the context of the transition economies. Our
focus on the transition countries is motivated by three factors. First, the financial systems
in these countries changed dramatically in a short period of time. Banks were privatized,
foreign ownership of banks increased, several countries implemented credit information
sharing, inflation declined, and institutions improved. We can investigate the effect of
these dynamics on credit maturity. Second, many transition countries have collected and
published data on credit maturity that are consistent across countries and show short-
term, medium-term, and long-term credit. Most other countries do not publish credit

2
maturity data and, if available, the data reveal only short-term credit. Third, the demand
for investment credit in the transition economies is fueled by the rapid creation of new
firms and the expansion of existing ones. In that environment, we can observe more
distinctly the demand and supply factors driving credit maturity.
Our analysis shows that credit maturity in the transition economies has lengthened
significantly over time. In a few transition countries, the maturity structure of bank credit
has become similar to the maturity of credit in advanced economies. Several factors have
aided this development, e.g. the improvements in institutions, the development of the
financial sectors, and bank privatizations. These and other factors discussed in the paper
also explain the large remaining differences among countries. For example, 54 percent of
bank credit in Lithuania is long-term, whereas in Albania only 17 percent of credit is
long-term. Interestingly, the share of foreign owned banks and banking sector
competition have no influence on credit maturity.
A number of papers have studied the availability of external financing for the
private sector in the transition countries (cite???). We add to this literature with a
distinction between credits with different maturity. The availability of long-term
financing has not been studied in the context of the transition economies. Qian and
Strahan (2007) and Demirgüç-Kunt and Maksimovic (1999) investigate the determinants
of credit maturity for publicly traded companies in samples of mostly developed
economies (true???). We stay close to their analysis in terms of the selection of
explanatory variables but we use data on lending to the entire private sector.
Furthermore, we investigate short-term, medium term, and long-term credit as opposed to
only short-term credit. We also incorporate additional explanatory variables that have

3
specific relevance for the sample of transition economies, e.g. government vs. private
ownership and domestic vs. foreign ownership of banks. We also investigate in detail the
roles of credit information sharing and a rich set of institutional variables.
The rest of the paper proceeds as follows. We describe the credit maturity data in
the following section. Section 3 draws empirical hypotheses from the literature and
Section 4 describes our empirical strategy. We present the results in Section 5 and
conclude in Section 6.
2. The maturity of bank credit – data and summary statistics
We use quarterly data on lending by commercial banks to the private sector in 14
transition countries. The sample covers the period from 1992 to 2006 (we have countries
with data until 2007???), depending on data availability with an average of 35
observations per country.1 The data were collected from reports issued by the central
banks of each individual county. Tables 1 and 2 present the definitions and the sources
for the variables as well as the time period for each country in the sample.
Table 2 shows large differences in terms of commercial bank credit to the private
sector as share of GDP, a frequently used measure of financial development. This
includes credits from all banks - government and private, as well as domestic and foreign
owned. In Albania, private credit is below 10 percent of GDP whereas in the Slovak
Republic it is over 200 percent of GDP.2 Credit increased over time in most, but not all,
countries. Figure 1 shows the credit to GDP ratio for eleven countries with at least ten 1 Although credit data are available for a few other transition countries, we could not include them in the sample because of missing explanatory variables. For example, although quarterly credit data for Bosnia and Herzegovina are available from 1997 to 2007, we were unable to obtain GDP data for the same period. 2 Note that we divide the stock of credit by quarterly, and not by yearly GDP, in order to preserve the consistency between the summary statistics discussed here and the estimations of the following sections. Therefore, the numbers are about four times greater compared to the commonly used measure.
4
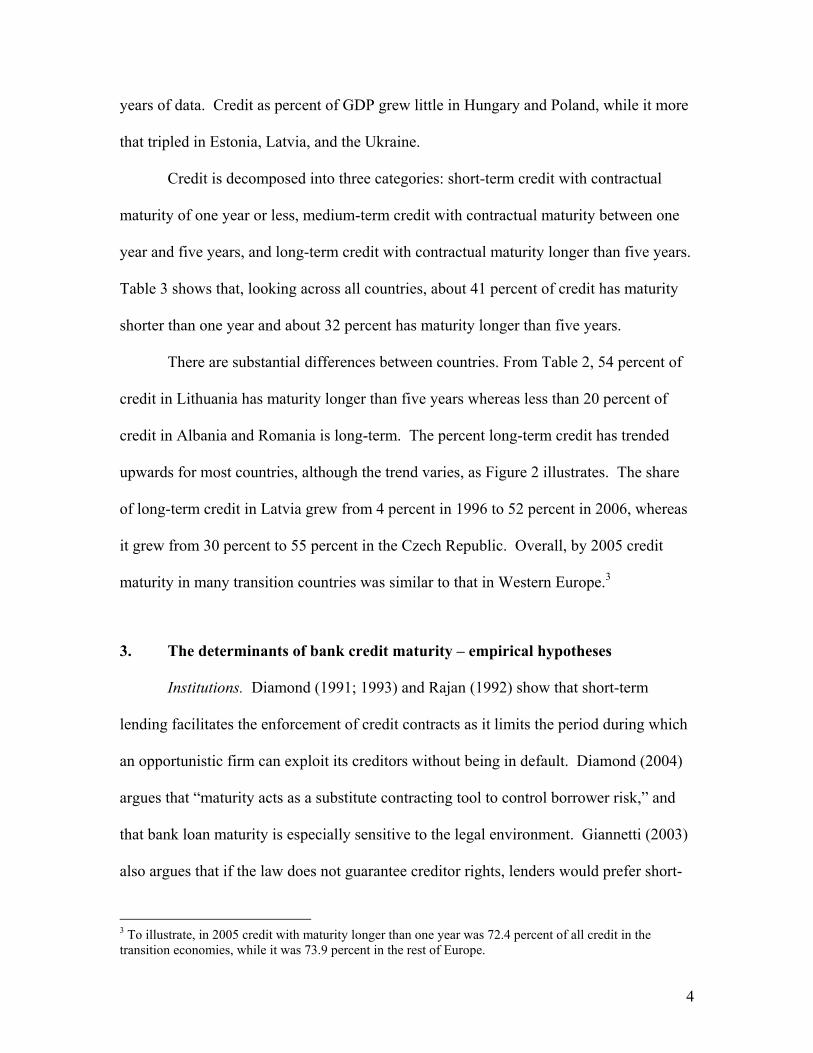
years of data. Credit as percent of GDP grew little in Hungary and Poland, while it more
that tripled in Estonia, Latvia, and the Ukraine.
Credit is decomposed into three categories: short-term credit with contractual
maturity of one year or less, medium-term credit with contractual maturity between one
year and five years, and long-term credit with contractual maturity longer than five years.
Table 3 shows that, looking across all countries, about 41 percent of credit has maturity
shorter than one year and about 32 percent has maturity longer than five years.
There are substantial differences between countries. From Table 2, 54 percent of
credit in Lithuania has maturity longer than five years whereas less than 20 percent of
credit in Albania and Romania is long-term. The percent long-term credit has trended
upwards for most countries, although the trend varies, as Figure 2 illustrates. The share
of long-term credit in Latvia grew from 4 percent in 1996 to 52 percent in 2006, whereas
it grew from 30 percent to 55 percent in the Czech Republic. Overall, by 2005 credit
maturity in many transition countries was similar to that in Western Europe.3
3. The determinants of bank credit maturity – empirical hypotheses
Institutions. Diamond (1991; 1993) and Rajan (1992) show that short-term
lending facilitates the enforcement of credit contracts as it limits the period during which
an opportunistic firm can exploit its creditors without being in default. Diamond (2004)
argues that “maturity acts as a substitute contracting tool to control borrower risk,” and
that bank loan maturity is especially sensitive to the legal environment. Giannetti (2003)
also argues that if the law does not guarantee creditor rights, lenders would prefer short-
3 To illustrate, in 2005 credit with maturity longer than one year was 72.4 percent of all credit in the transition economies, while it was 73.9 percent in the rest of Europe.

5
term debt to control entrepreneurs’ opportunistic behavior by using the threat of not
renewing their loans. In line with these theories, we expect to find that weak institutions
contribute to shorter credit maturity. We measure legal institutions using a Rule of Law
index described in Table 1. The index ranges from -1.14 in Serbia in 2000 to 1 in
Slovenia in 2002. As Table 3 shows, the rule of law is positively and significantly
correlated with the credit maturity measures.
State Ownership of Banks. Demirgüç-Kunt and Maksimovic (1999) note that the
government can promote long-term financial contracting by granting implicit loan
guarantees when it adopts a policy of subsidizing loss-generating firms. The authors find
that government subsidies to the corporate sector lengthen credit maturity. Furthermore,
La Porta, Lopez-de-Silanes, and Shleifer (2002) note that government ownership of
banks has an even stronger effect, as the government has more power to choose projects.
According to this view, the ownership of banks enables the government to direct funds
toward strategic long-term projects. However, the literature also shows that bank
privatization in the transition economies has raised banking efficiency and has increased
credit availability (cite???). From that perspective, the transfer of ownership into private
hands might improve information gathering and processing, and the monitoring of
borrowers. The improved functioning of banks may then lead to more long-term lending.
Foreign Ownership of Banks. Berglof and Bolton (2002) and Eller, Haiss, and
Steiner (2005) argue that foreign ownership leads to greater efficiency of the financial
sectors in the transition countries. Foreign banks enhance transparency and corporate
governance with a stronger commitment in these areas compared to domestic banks
(Naaborg et al. 2003). Foreign-owned banks also utilize greater risk management
6
expertise and can diversify risk across several countries (de Haas and van Lelyveld
2006). All of those contribute to greater availability of long-term credit. However,
foreign owned banks may also face difficulties gathering and evaluating information on
local borrowers, especially in the transition countries where few borrowers have credit
history.
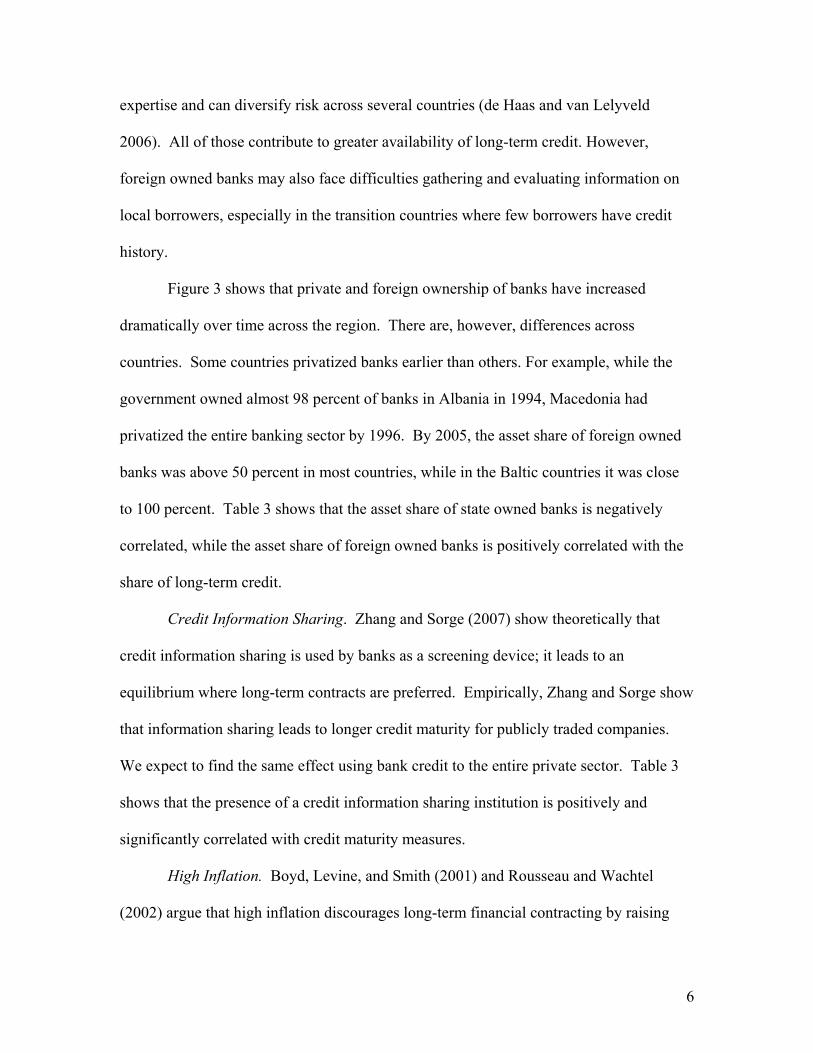
Figure 3 shows that private and foreign ownership of banks have increased
dramatically over time across the region. There are, however, differences across
countries. Some countries privatized banks earlier than others. For example, while the
government owned almost 98 percent of banks in Albania in 1994, Macedonia had
privatized the entire banking sector by 1996. By 2005, the asset share of foreign owned
banks was above 50 percent in most countries, while in the Baltic countries it was close
to 100 percent. Table 3 shows that the asset share of state owned banks is negatively
correlated, while the asset share of foreign owned banks is positively correlated with the
share of long-term credit.
Credit Information Sharing. Zhang and Sorge (2007) show theoretically that
credit information sharing is used by banks as a screening device; it leads to an
equilibrium where long-term contracts are preferred. Empirically, Zhang and Sorge show
that information sharing leads to longer credit maturity for publicly traded companies.
We expect to find the same effect using bank credit to the entire private sector. Table 3
shows that the presence of a credit information sharing institution is positively and
significantly correlated with credit maturity measures.
High Inflation. Boyd, Levine, and Smith (2001) and Rousseau and Wachtel
(2002) argue that high inflation discourages long-term financial contracting by raising
7
uncertainty about the real value of future nominal payments. Therefore, high inflation
should reduce the fraction of credits with long-term maturity. In our sample, inflation has
been moderate for most countries with a period average of 13.75. There are, however,
periods of very high inflation as in Latvia in 1992 (331.09 percent). Table 3 shows that
inflation is negatively and significantly correlated with both maturity measures.
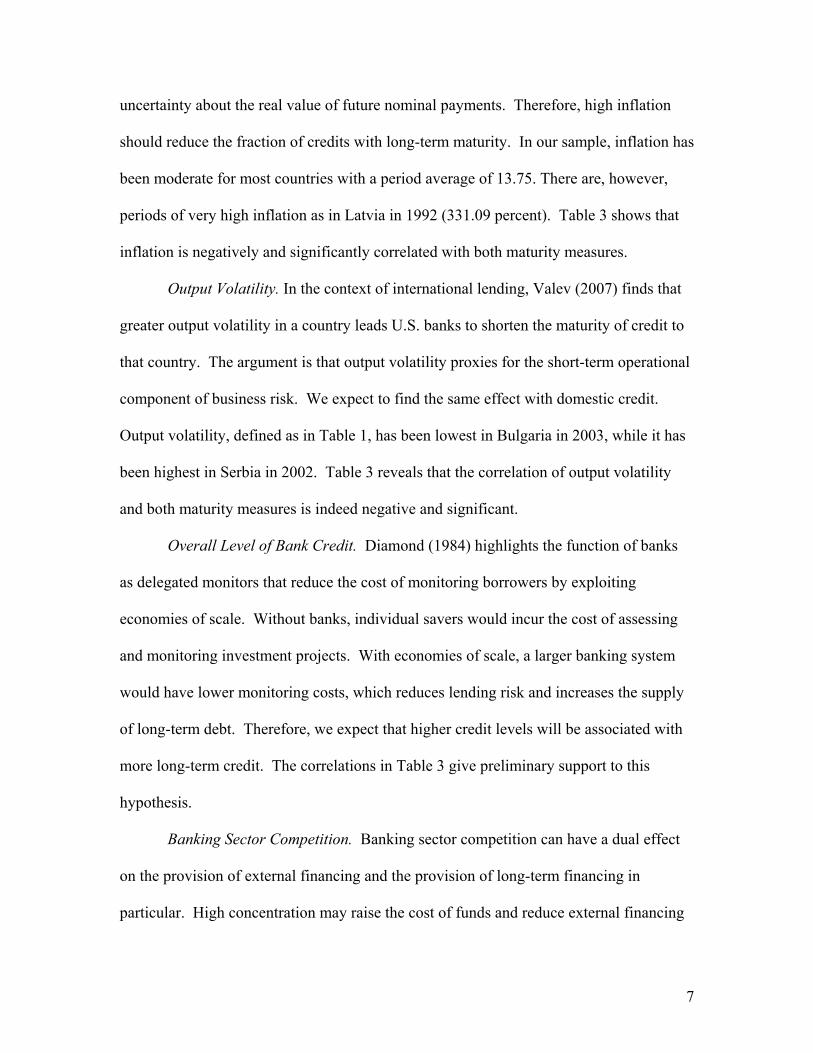
Output Volatility. In the context of international lending, Valev (2007) finds that
greater output volatility in a country leads U.S. banks to shorten the maturity of credit to
that country. The argument is that output volatility proxies for the short-term operational
component of business risk. We expect to find the same effect with domestic credit.
Output volatility, defined as in Table 1, has been lowest in Bulgaria in 2003, while it has
been highest in Serbia in 2002. Table 3 reveals that the correlation of output volatility
and both maturity measures is indeed negative and significant.
Overall Level of Bank Credit. Diamond (1984) highlights the function of banks
as delegated monitors that reduce the cost of monitoring borrowers by exploiting
economies of scale. Without banks, individual savers would incur the cost of assessing
and monitoring investment projects. With economies of scale, a larger banking system
would have lower monitoring costs, which reduces lending risk and increases the supply
of long-term debt. Therefore, we expect that higher credit levels will be associated with
more long-term credit. The correlations in Table 3 give preliminary support to this
hypothesis.
Banking Sector Competition. Banking sector competition can have a dual effect
on the provision of external financing and the provision of long-term financing in
particular. High concentration may raise the cost of funds and reduce external financing

8
(Pagano 1993). Alternatively, high concentration may foster close relationships between
banks and borrowers; this lowers information asymmetries and the cost of monitoring
borrowers (Mayer 1988; Mayer and Hubbard 1990; Petersen and Rajan 1995). Testing
the bank-firm relationship hypothesis Giannetti (2003) finds that, contrary to (her)
expectations, maturity is shorter in countries where the banking system is more
concentrated. Using the asset share of the three largest banks to measure concentration,
the least concentrated banking sector was that of Serbia in 2005 where the three largest
banks had a market share of 36 percent, while the most concentrated banking sectors
were in Estonia and Romania where the three largest banks owned all assets for a number
of years. In Table 3, banking industry concentration and the maturity measures are
positively correlated, i.e. more concentrated banking system are associated with longer
credit maturity.
Stock Market Development. Stock market development also has an ambiguous
effect on credit maturity. Diamond (1997) argues that developed stock markets cause the
banking sector to shrink, primarily through reduced holdings of long-term assets.
According to this view, selling equity is a substitute source of long-term financing;
therefore, stock market development reduces the demand for long-term bank credit. An
alternative view explains that stock markets reveal information about firms and this helps
them access long-term bank financing (Grossman 1976; Grossman and Stiglitz 1980).
The stock market turnover, which we use to measure stock market development, ranges
from 0 in Latvia in the first quarter of 1996 to 89 percent of GDP in Estonia in the first
quarter of 2005. In Table 3, the correlation of the stock market turnover with the fraction
of credit with maturity longer than five years is positive and significant.

9
Real Per Capita GDP. Ravid (1996) points to the “industry paradigm” of
matching maturities introduced by Morris (1976): firms with long-term assets should use
long-term debt. If debt maturity is longer than the asset life, borrowers will have to
identify new investment opportunities while having to continue servicing their debt. If
debt maturity is shorter than the asset life, then borrowers may become short on cash
when debt payments are due. Stohs and Mauer (1996) find evidence for maturity
matching on the firm level. Following Demirgüç-Kunt and Maksimovic (1999), we use
per capita GDP to proxy for the amount of fixed assets in a country, with richer countries
having a larger stock of long-term assets. Thus, higher GDP per capita is expected to be
associated with longer debt maturity. From Table 3, we see that the per capita GDP is
indeed positively and significantly correlated with both maturity measures.
Real Per Capita GDP Growth. Smith and Watts (1992) note that GDP growth
rates can proxy for investment opportunities: the demand for external financing would
increase in boom times and will recede in recession periods. It is not clear, however,
whether expansions would stimulate the demand for long-term and short-term credit in
different ways. Nonetheless, we follow the literature (Demirgüç-Kunt and Maksimovic
1999; Qian and Strahan 2007; Tasić and Valev 2008) and include real per capita GDP
growth in our estimations.
The literature (e.g., Fink, Haiss, and Mantler 2005; Fink, Haiss, and Vukšić 2004)
also points out that the stage of transition is important, with more advanced economies
having more developed financial sectors. We include a dummy variable for EU
membership as an indicator of transition progress. In summary, the empirical hypotheses
are as follows:
10
/
/
/
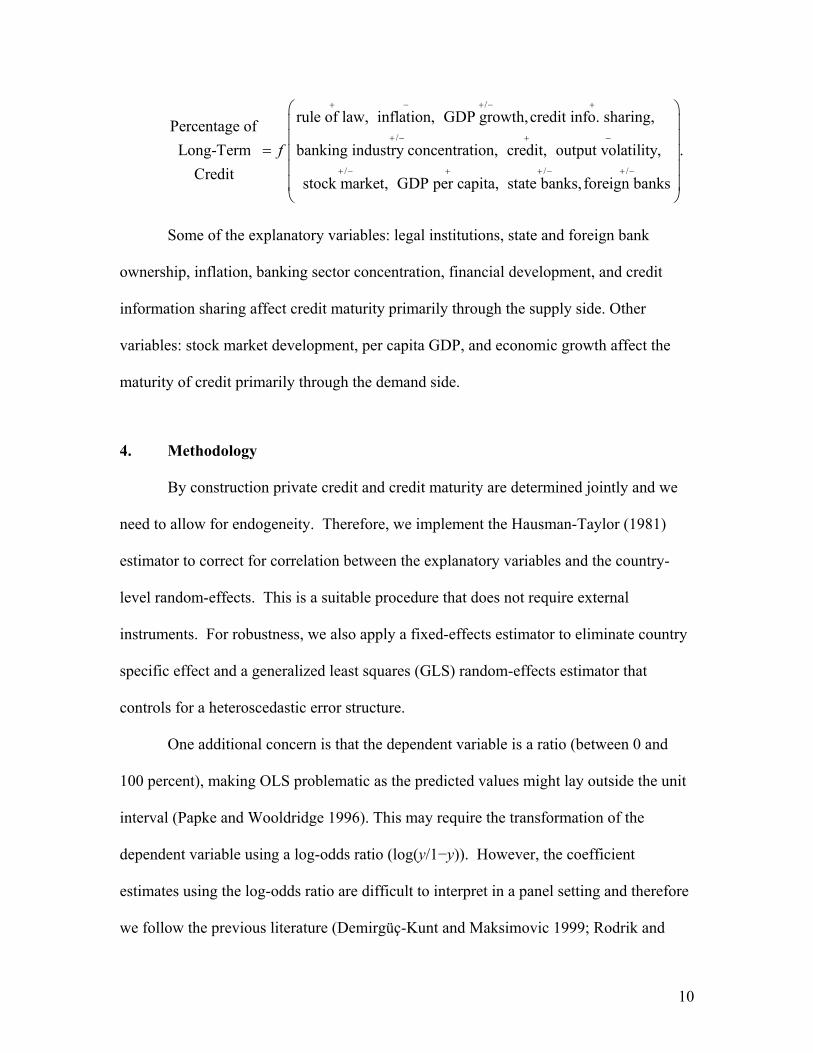
rule of law, inflation, GDP growth,credit info. sharing,Percentage ofLong-Term banking industry concentration, credit, output volatility,
Credit stock market, GDP per capita, state bank
f
+ − + − +
+ − + −
+ − +
=/ /
.
s, foreign banks+ − + −
⎛ ⎞⎜ ⎟⎜ ⎟⎜ ⎟⎜ ⎟⎜ ⎟⎝ ⎠
Some of the explanatory variables: legal institutions, state and foreign bank
ownership, inflation, banking sector concentration, financial development, and credit
information sharing affect credit maturity primarily through the supply side. Other
variables: stock market development, per capita GDP, and economic growth affect the
maturity of credit primarily through the demand side.
4. Methodology
By construction private credit and credit maturity are determined jointly and we
need to allow for endogeneity. Therefore, we implement the Hausman-Taylor (1981)
estimator to correct for correlation between the explanatory variables and the country-
level random-effects. This is a suitable procedure that does not require external
instruments. For robustness, we also apply a fixed-effects estimator to eliminate country
specific effect and a generalized least squares (GLS) random-effects estimator that
controls for a heteroscedastic error structure.
One additional concern is that the dependent variable is a ratio (between 0 and
100 percent), making OLS problematic as the predicted values might lay outside the unit
interval (Papke and Wooldridge 1996). This may require the transformation of the
dependent variable using a log-odds ratio (log(y/1−y)). However, the coefficient
estimates using the log-odds ratio are difficult to interpret in a panel setting and therefore
we follow the previous literature (Demirgüç-Kunt and Maksimovic 1999; Rodrik and

11
Velasco 1999; Tasić and Valev 2008; Valev 2006; 2007) and do not perform the
transformation. Furthermore, less than 1 percent of the predicted values from the models
are outside the unit interval.
5. Results
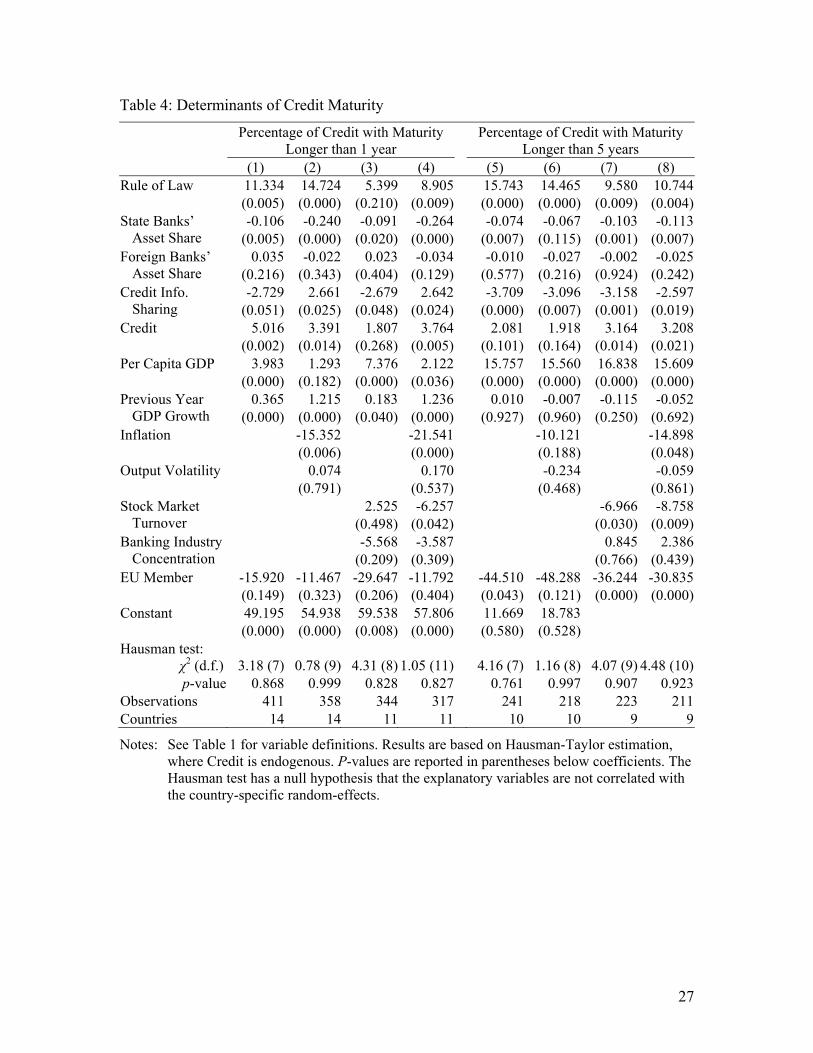
Table 4 presents the empirical results using the Hausman-Taylor estimation.4 We
begin with an equation that includes the rule of law index, GDP per capita and its growth,
credit information sharing, the credit to GDP ratio, and the bank ownership variables.
We then add inflation and output volatility, followed by the stock market turnover and
banking system concentration. In columns (4) and (8) we include all explanatory
variables. There are two dependent variables – the percentage of credit with maturity
longer than one year and the percentage of credit with maturity longer than five years.
Greater rule of law is associated with longer credit maturity in all specifications.
Furthermore, the coefficients using credit with maturity longer than five years are
generally greater than the coefficients using maturity longer than one year, i.e. weak rule
of law has a stronger negative effect over longer time horizons. Based on column (4), a
one standard deviation decrease in the rule of raw, e.g. from the level in Poland to the
level in Bulgaria, is associated with 5.16 percentage points (0.58*8.905) decrease in the
percent of credit with maturity longer than one year. The coefficient estimates in the
remaining columns predict an even stronger effect on the percent of credit with maturity
longer than five years.
4 Table A1 in the appendix presents the results from the fixed-effects and the GLS estimations, along with the Hausman-Taylor results. Table A2 presents the same results when the dependent variables are the portion of short-term credit and the portion of medium-term credit.

12
The asset share of state owned banks has a negative and statistically significant
effect on both measures of maturity. In contrast, the asset share of foreign owned banks
is not statistically significant in any of the specifications. In this set of countries, private
banks raise the provision of long-term financing regardless of their ownership – domestic
or foreign. Looking at the results in column (4), a one standard deviation decrease in the
asset share of state banks increases the portion of credit with maturity longer than one
year by 6.06 percentage points (22.96*0.264).
To test whether information sharing affects credit maturity, we follow Qian and
Strahan (2007) and include a dummy variable that equals 1 if a country had either a
public credit registry or a private credit bureau at the beginning of the year. Using credit
with maturity longer than one year produces two negative and statistically significant
coefficients and two positive ones depending on the set of controls. The effect of credit
with maturity longer than five years is unambiguously negative – credit information
sharing reduces the percent long-term debt. We revisit this surprising result in the next
section.
Credit as percent of GDP has a positive and, in most specifications, statistically
significant effect on both maturity measures. Countries with deeper financial markets
have a greater fraction of credit with longer maturity. The effect of economic
development is similar – countries with greater GDP per capita have longer credit
maturity. The effect is particularly strong for long-term credit with maturity longer than
five years. In terms of sizes of the effects, an increase in private credit from the level of
Macedonia (65.81 percent) to the level of Bulgaria (124.48 percent) is associated with a
2.21 percentage points increase in the fraction of credit with maturity longer than one
13
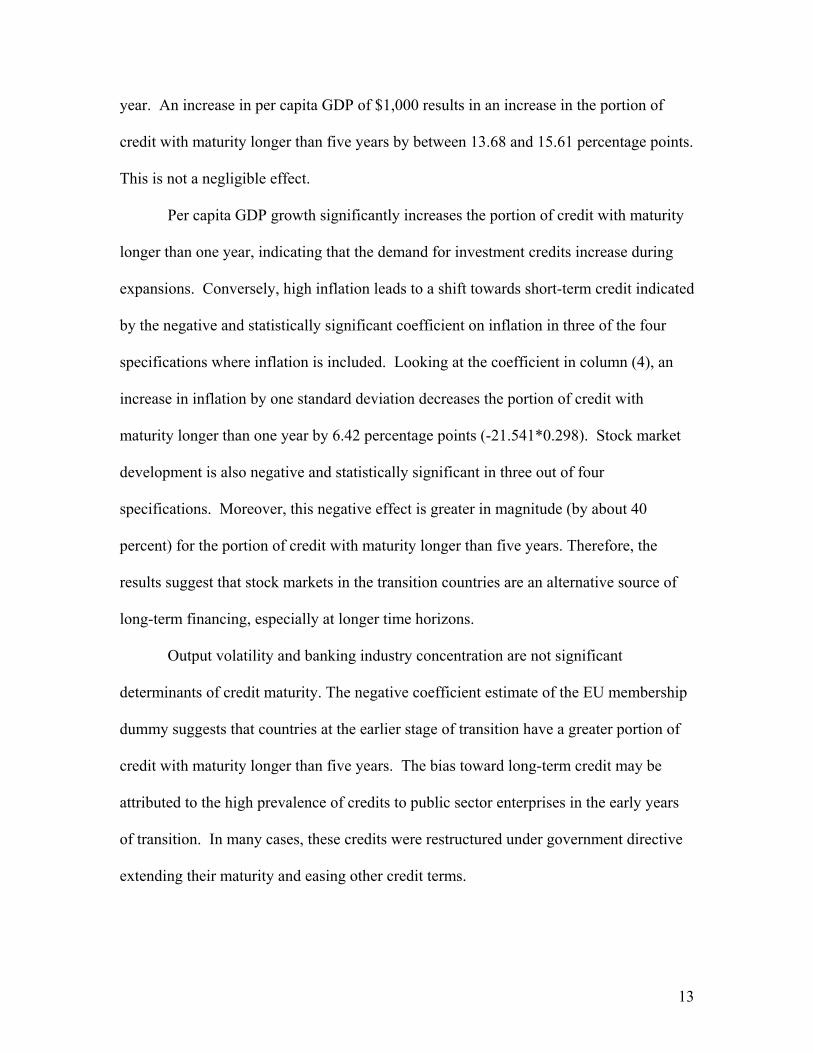
year. An increase in per capita GDP of $1,000 results in an increase in the portion of
credit with maturity longer than five years by between 13.68 and 15.61 percentage points.
This is not a negligible effect.
Per capita GDP growth significantly increases the portion of credit with maturity
longer than one year, indicating that the demand for investment credits increase during
expansions. Conversely, high inflation leads to a shift towards short-term credit indicated
by the negative and statistically significant coefficient on inflation in three of the four
specifications where inflation is included. Looking at the coefficient in column (4), an
increase in inflation by one standard deviation decreases the portion of credit with
maturity longer than one year by 6.42 percentage points (-21.541*0.298). Stock market
development is also negative and statistically significant in three out of four
specifications. Moreover, this negative effect is greater in magnitude (by about 40
percent) for the portion of credit with maturity longer than five years. Therefore, the
results suggest that stock markets in the transition countries are an alternative source of
long-term financing, especially at longer time horizons.
Output volatility and banking industry concentration are not significant
determinants of credit maturity. The negative coefficient estimate of the EU membership
dummy suggests that countries at the earlier stage of transition have a greater portion of
credit with maturity longer than five years. The bias toward long-term credit may be
attributed to the high prevalence of credits to public sector enterprises in the early years
of transition. In many cases, these credits were restructured under government directive
extending their maturity and easing other credit terms.

14
In summary, there are several supply-side factors explaining credit maturity in the
transition economies. Improved rule of law, greater levels of financial development,
bank privatization, and relatively low inflation rates have contributed to lengthening the
maturity of bank credit. Demand factors have played a role too. Stock market
development has reduced the demand for long-term bank financing but rapid economic
growth and increasing income levels have generated strong demand for long-term credit.
Overall, the results show that the changes associated with transition are contributing
factors for increasing the availability of long-term finance. Countries that have advanced
rapidly in terms of institutional and economic development have also enjoyed the greatest
gains in terms of long-term credit use.
5.1. Credit information sharing and credit maturity
For each country in this paper, Brown, Jappelli, and Pagano (2007) collected
information about the year when a public credit registry or a private credit bureau was
established. In addition, the authors identify whether these institutions collect
information on consumers and/or firms, positive and/or negative information, how long
the information is kept, and what is the minimum amount of loans for which data are
collected. We use this information to construct a quality index for both types of
institutions, similar to the one in Brown, Jappelli, and Pagano (2007). If the institution is
present, the index takes on a value of 1, and 0 otherwise. If the institution existed for at
least six consecutive quarters, an additional point is added to the index. If information is
kept on both firms and consumers, an additional point is added to the index. Similarly,
an additional point is added if both positive and negative information is reported. An
additional point is added if information is kept for at least two years. The final point is

15
added if the minimum amount of a loan for which the institution collects data is below
yearly per capita GDP (or if the threshold does not exist). Therefore, the quality index
for each type of institution ranges from 0 (if the institution does not exist) to 6 (if it meets
all criteria listed above). The quality index for the public credit registry and the private
credit bureau are added together to form an overall quality index.
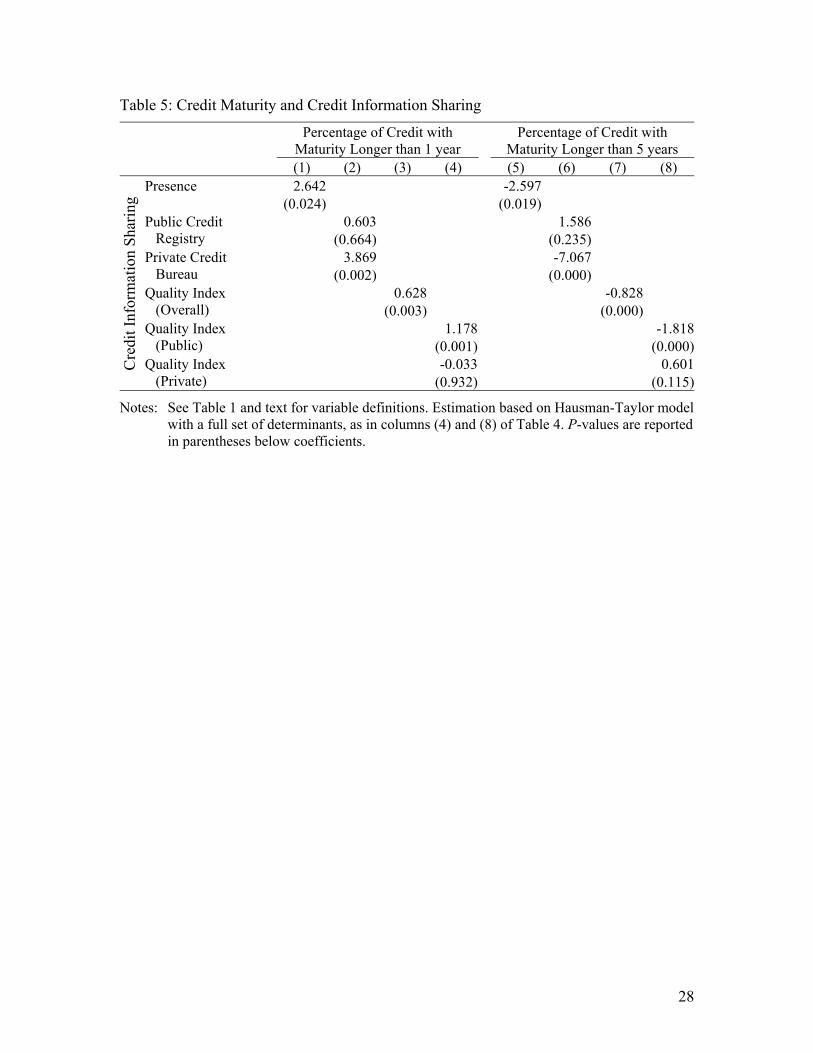
Table 5 presents the results when we estimate the impact of different measures of
credit information sharing on both maturity measures. The results are based on a full set
of determinants, but for brevity we do not report the coefficients of the other
determinants. Columns (1) and (5) correspond to the estimated coefficients from
columns (4) and (8) of Table 4. The presence of credit information sharing institutions
increases the portion of credit with maturity longer than one year, while it decreases the
portion of credit with maturity longer than five years. When we introduce separately
public and private credit institutions in columns (2) and (6), we see that the results are
driven by the presence of private credit bureaus. The presence of a public credit registry
does not have a significant influence on either maturity measure.
Similar results are obtained in columns (3) and (7) when we use the index of
overall quality, as defined above, instead of an indicator for the existence of an
institution. Greater quality of the information sharing mechanisms increases the portion
of credit with maturity longer than one year, while it decreases the portion of credit with
maturity longer than five years. When the overall quality index is decomposed into a
quality index of public credit registries and a quality index of private credit bureaus in
columns (4) and (8), we see that the results are driven by the quality of public credit

16
registries. The quality of private credit bureaus does not have a significant influence on
either measure of maturity.
In summary, the results suggest that private credit bureaus affect credit maturity;
public credit registries affect credit maturity as well, but only if they have enhanced
features. Yet, in either case, the effect of credit information sharing is to reduce short-
term and long-term credit and, by default, to increase the fraction of medium-term credit.
This result counters our empirical hypothesis that information sharing would lengthen
credit maturity across the board. One possible explanation for this finding can be found
in Diamond (1991). With asymmetric information, firms have incentives to borrow
short-term in order to signal the quality of their projects to lenders and to extract the
benefits of good news. They also have an incentive to borrow long-term to lower
liquidity risk. Therefore, the shares of short-term credit and long-term credit expand at
the expanse of medium-term credit. One can argue that credit information sharing
reduced information asymmetries and reverses this tendency: short-term and long-term
borrowing decline while medium-term borrowing increases.
5.2. Institutions and credit maturity
We introduce several additional variables to explore the effect of institutions in
greater detail: 1) an index of government effectiveness measuring the quality of public
services, the quality of the civil service and the degree of its independence from political
pressures; 2) political stability reflecting perceptions of the likelihood that the
government will be destabilized or overthrown by unconstitutional or violent means; 3)
control of corruption measuring the extent to which public power is exercised for private
gain; 4) regulatory power measuring the ability of the government to formulate and

17
implement sound policies and regulations that permit and promote private sector
development; and 5) an EBRD index of banking reform and interest rate liberalization.
The first four indexes are from Kaufmann, Kraay, and Mastruzzi (2007) and range from -
2.5 to 2.5. The EBRD index ranges from 1 to 5.
Table 6 presents the estimation results when we substitute the rule of law index
with different institutional measures. The results are based on a full set of determinants,
but for brevity we do not report the coefficients of the other determinants. The
statistically significant coefficients in almost all specifications confirm the importance of
institutions and provide a few additional interesting observations. For example, political
instability is only a long-term concern affecting only credit with maturity longer than five
years. The remaining institutional effects work at medium and long-term horizons.
6. Conclusion
A new data set from the transition economies reveals that the maturity of bank
credit to the private sector has lengthened substantially over time. Several factors
contribute to this trend: the improvements in the political and institutional environment,
the privatization of banks, the sustained low to moderate inflation, and the increasing
levels of economic and financial development. By 2005 (is that the right year for
comparison???), credit in several transition countries had maturity structure similar to
that in Western Europe. Yet, credit in other transition countries remains mostly short-
term.
Several factors that are not significant determinants of credit maturity are worth
mentioning. The growing share of foreign owned banks has not contributed to longer
credit maturity. Similarly, we find no evidence that competition in the banking system

18
contributes to longer credit maturity. Output volatility is also not significant which
brings up an interesting comparison with the effect of institutions – our results suggest
that credit maturity is affected by political and institutional uncertainty more so than by
economic uncertainty.
There are various ways to build on this analysis. Future research can explore in
more detail the effect of banking sector competition. We use market concentration but
there are other measures that can be used to investigate the role of competition in making
long-term finance available. Similarly, future research can investigate the role of state
owned versus private banks in broader samples. The “developmental view” argues that
government banks increase the provision of long-term financing in strategic areas. Our
results suggest that private banks accomplish this task more effectively. Whether this
result holds in broader samples has important implications for the desirability of
government development banks. Similarly, whether competition matters for long-term
finance has important implications for banking policy and regulations.

19
References
Beck, Thorsten, Asli Demirgüç-Kunt, and Ross Levine. 2000. A new database on financial development and structure. World Bank Economic Review 14, no. 3: 597-605.
Bencivenga, Valerie R. and Bruce D. Smith. 1991. Financial intermediation and endogenous growth. Review of Economic Studies 58, no. 2: 195-209.
Berglof, E. and P. Bolton. 2002. The great divide and beyond: Financial architecture in transition. Journal of Economic Perspectives 16, no. 1: 77-100.
Boyd, John H., Ross Levine, and Bruce D. Smith. 2001. The impact of inflation on financial sector performance. Journal of Monetary Economics 47, no. 2: 221-248.
Brown, Martin, Tullio Jappelli, and Marco Pagano. 2007. Information sharing and credit: Firm-level evidence from transition countries: C.E.P.R. Discussion Papers, CEPR Discussion Papers: 6313.
de Haas, Ralph and Iman van Lelyveld. 2006. Foreign banks and credit stability in central and eastern Europe: A panel data analysis. Journal of Banking and Finance 30, no. 7: 1927-1952.
Demirgüç-Kunt, Asli and Vojislav Maksimovic. 1999. Institutions, financial markets, and firm debt maturity. Journal of Financial Economics 54, no. 3: 295-336.
Diamond, Douglas W. 1984. Financial intermediation and delegated monitoring. Review of Economic Studies 51, no. 3: 393-414.
________. 1991. Debt maturity structure and liquidity risk. The Quarterly Journal of Economics 106, no. 3: 709-737.
________. 1993. Seniority and maturity of debt contracts. Journal of Financial Economics 33, no. 3: 341-368.
________. 1997. Liquidity, banks, and markets. Journal of Political Economy 105, no. 5: 928-956.
________. 2004. Presidential address, committing to commit: Short-term debt when enforcement is costly. Journal of Finance 59, no. 4: 1447-1479.
Eller, M., P. Haiss, and K. Steiner. 2005. Foreign direct investment in the financial sector: The engine of growth for central and eastern Europe? Vienna: EUROPAINSTITUT.
Fink, G., P. Haiss, and H. C. Mantler. 2005. The finance-growth nexus: Market economies vs. Transition countries. Vienna.: EUROPAINSTITUT.

20
Fink, G., P. Haiss, and G. Vukšić. 2004. Changing importance of financial sectors for growth from transition to cohesion and European integration. Vienna: EUROPAINSTITUT.
Giannetti, Mariassunta. 2003. Do better institutions mitigate agency problems? Evidence from corporate finance choices. Journal of Financial and Quantitative Analysis 38, no. 1: 185-212.
Grossman, Sanford J. 1976. On the efficiency of competitive stock markets where trades have diverse information. Journal of Finance 31, no. 2: 573-585.
Grossman, Sanford J. and Joseph E. Stiglitz. 1980. On the impossibility of informationally efficient markets. American Economic Review 70, no. 3: 393-408.
Hausman, Jerry A. and William E. Taylor. 1981. Panel data and unobservable individual effects. Econometrica 49, no. 6: 1377-1398.
Kaufmann, Daniel, Aart Kraay, and Massimo Mastruzzi. 2007. Governance matters VI: Aggregate and individual governance indicators for 1996-2006: The World Bank, Policy Research Working Paper Series: 4280.
La Porta, Rafael, Florencio López-de-Silanes, and Andrei Shleifer. 2002. Government ownership of banks. Journal of Finance 57, no. 1: 265-301.
Mayer, Colin. 1988. New issues in corporate finance. European Economic Review 32, no. 5: 1167-1183.
Mayer, Colin and R. Glenn Hubbard. 1990. Financial systems, corporate finance, and economic development. In Asymmetric information, corporate finance, and investment:307-332. Chicago and London: University of Chicago Press.
Morris, James R. 1976. On corporate debt maturity strategies. Journal of Finance 31, no. 1: 29-37.
Naaborg, I., B. Scholtens, J. De Haan, H. Bol, and R. De Haas. 2003. How important are foreign banks in the financial development of European transition countries? In CESifo Working Paper: CESifo.
Pagano, Marco. 1993. Financial markets and growth: An overview. European Economic Review 37, no. 2-3: 613-622.
Papke, Leslie E. and Jeffrey M. Wooldridge. 1996. Econometric methods for fractional response variables with an application to 401(k) plan participation rates. Journal of Applied Econometrics 11, no. 6: 619-632.
Petersen, M. A. and R. G. Rajan. 1995. The effect of credit market competition on lending relationships. Quarterly Journal of Economics 110, no. 2: 407-443.

21
Qian, Jun and Philip E. Strahan. 2007. How law and institutions shape financial contracts: The case of bank loans. Journal of Finance: forthcoming.
Rajan, Raghuram G. 1992. Insiders and outsiders: The choice between informed and arm's-length debt. Journal of Finance 47, no. 4: 1367-1400.
Ravid, S. Abraham. 1996. Debt maturity--a survey. Financial Markets, Institutions and Instruments 5, no. 3: 1-69.
Rodrik, Dani and Andres Velasco. 1999. Short-term capital flows: National Bureau of Economic Research, Inc, NBER Working Papers: 7364.
Rousseau, Peter L. and Paul Wachtel. 2002. Inflation thresholds and the finance-growth nexus. Journal of International Money and Finance 21, no. 6: 777-793.
Smith, Clifford W., Jr. and Ross L. Watts. 1992. The investment opportunity set and corporate financing, dividend, and compensation policies. Journal of Financial Economics 32, no. 3: 263-292.
Stohs, Mark Hoven and David C. Mauer. 1996. The determinants of corporate debt maturity structure. Journal of Business 69, no. 3: 279-312.
Tasić, Nikola and Neven T. Valev. 2008. The maturity structure of bank credit: Determinants and effects on economic growth. In Andrew Young School of Policy Studies Research Paper Series no. 08-12.
Valev, Neven T. 2006. Institutional uncertainty and the maturity of international loans. Journal of International Money and Finance 25, no. 5: 780-794.
________. 2007. Uncertainty and international debt maturity. Journal of International Financial Markets, Institutions and Money 17, no. 4: 372-386.
Zhang, Chendi and Marco Sorge. 2007. Credit information quality and corporate debt maturity: Theory and evidence: The World Bank, Policy Research Working Paper Series: 4239.

22
Appendix. Additional Estimation Results
Table A1: Additional Estimators
Percentage of Credit with Maturity
Longer than 1 year Percentage of Credit with Maturity
Longer than 5 years
Fixed
Effects GLS Hausman-
Taylor Fixed
Effects GLS Hausman-
Taylor Rule of Law 8.663 13.757 8.905 10.508 16.573 10.744
(0.015) (0.000) (0.009) (0.009) (0.000) (0.004)Inflation -20.679 -53.893 -21.541 -15.085 -18.562 -14.898
(0.061) (0.000) (0.000) (0.066) (0.086) (0.048)Previous Year GDP
Growth 1.213 1.535 1.236 -0.080 0.786 -0.052
(0.000) (0.000) (0.000) (0.429) (0.000) (0.692)Credit 3.312 9.605 3.764 2.572 7.423 3.208
(0.039) (0.000) (0.005) (0.135) (0.000) (0.021)Per Capita GDP 2.690 -1.412 2.122 16.551 3.496 15.609
(0.045) (0.001) (0.036) (0.000) (0.000) (0.000)Credit Information
Sharing 2.536 -0.128 2.642 -3.030 5.513 -2.597
(0.010) (0.907) (0.024) (0.004) (0.000) (0.019)Banking Industry
Concentration -4.134 4.680 -3.587 1.870 6.347 2.386
(0.259) (0.153) (0.309) (0.535) (0.073) (0.439)Stock Market
Turnover -5.823 -21.639 -6.257 -8.744 -1.646 -8.758
(0.009) (0.000) (0.042) (0.007) (0.767) (0.009)Output Volatility 0.119 1.258 0.170 -0.032 -0.029 -0.059
(0.682) (0.001) (0.537) (0.918) (0.950) (0.861)State Banks’ Asset
Share -0.254 -0.404 -0.264 -0.109 -0.095 -0.113
(0.000) (0.000) (0.000) (0.014) (0.023) (0.007)Foreign Banks’ Asset
Share -0.036 -0.087 -0.034 -0.030 0.002 -0.025
(0.095) (0.001) (0.129) (0.174) (0.951) (0.242)EU Member -5.148 -11.792 -5.722 -30.835
(0.180) (0.404) (0.123) (0.000)Constant 47.115 63.263 57.806 -33.942
(0.000) (0.000) (0.000) (0.000)Hausman test: χ2 (d.f.) 8.99 (11) 1.05 (11) 201.14 (11) 0.37 (11)
p-value 0.6232 0.827 0.000 1.000Observations 317 317 317 211 211 211Countries 11 11 11 9 9 9
Notes: See Table 1 for variable definitions. P-values are reported in parentheses below coefficients. In the Hausman-Taylor estimation Credit is endogenous. The Hausman test has a null hypothesis that the explanatory variables are not correlated with the country-specific random-effects. Per Capita GDP is in thousands of USD.

23
Table A2: Alternative Measures of Credit Maturity
Percentage of Credit with Maturity
of 1 year or Less Percentage of Credit with Maturity
from 1 year to 5 years
Fixed
Effects GLS Hausman-
Taylor Fixed
Effects GLS Hausman-
Taylor Rule of Law -8.663 -13.757 -8.905 -10.568 5.235 -10.348
(0.015) (0.000) (0.009) (0.000) (0.028) (0.002)Inflation 20.679 53.893 21.541 -51.884 -95.924 -52.583
(0.061) (0.000) (0.000) (0.000) (0.000) (0.000)Previous Year GDP
Growth -1.213 -1.535 -1.236 0.406 0.319 0.384
(0.000) (0.000) (0.000) (0.001) (0.026) (0.001)Credit -3.312 -9.605 -3.764 -2.215 -2.533 -2.836
(0.039) (0.000) (0.005) (0.066) (0.000) (0.015)Per Capita GDP -2.690 1.412 -2.122 -7.475 -5.906 -6.640
(0.045) (0.001) (0.036) (0.000) (0.000) (0.000)Credit Information
Sharing -2.536 0.128 -2.642 3.696 -2.984 3.238
(0.010) (0.907) (0.024) (0.000) (0.001) (0.001)Banking Industry
Concentration 4.134 -4.680 3.587 -2.064 -4.137 -2.491
(0.259) (0.153) (0.309) (0.376) (0.117) (0.349)Stock Market
Turnover 5.823 21.639 6.257 2.624 5.414 2.733
(0.009) (0.000) (0.042) (0.322) (0.201) (0.346)Output Volatility -0.119 -1.258 -0.170 0.407 2.202 0.457
(0.682) (0.001) (0.537) (0.218) (0.000) (0.118)State Banks’ Asset
Share 0.254 0.404 0.264 -0.158 -0.391 -0.158
(0.000) (0.000) (0.000) (0.000) (0.000) (0.000)Foreign Banks’ Asset
Share 0.036 0.087 0.034 -0.117 -0.241 -0.124
(0.095) (0.001) (0.129) (0.000) (0.000) (0.000)EU Member 5.148 11.792 84.248 74.932
(0.180) (0.404) (0.000) (0.000)Constant 52.885 36.737 42.194 79.467
(0.000) (0.000) (0.002) (0.000)Hausman test: χ2 (d.f.) 537.00 (9) 5.10 (6) 118.12 (8) 3.95 (7)
p-value 0.000 0.5316 0.000 0.785Observations 317 317 317 211 211 211Countries 11 11 11 9 9 9
Notes: See Table 7 for variable definitions. P-values are reported in parentheses below coefficients. In the Hausman-Taylor estimation Credit is endogenous. The Hausman test has a null hypothesis that the explanatory variables are not correlated with the country-specific random-effects. Per Capita GDP is in thousands of USD.

24
Table 1: Variable Definitions and Sources
Variable Definition Sources Credit / GDP Credit by deposit money banks and other
financial institutions to the private sector divided by quarterly GDP.
Central bank of the corresponding country. Consulted were the official publications and websites.
Percent of Credit with Maturity Longer than One Year
Credit with original contractual maturity longer than one year divided by total credit.
Percent of Credit with Maturity Longer than Five Years
Credit with original contractual maturity longer than five years divided by total credit.
Real Per Capita GDP Growth
Percent increase in real per capita GDP during the previous year.
The official statistical institute or the central bank of the corresponding country. Data were cross checked with IMF’s IFS, Eurostat, and OECD’s quarterly national accounts.
Per Capita GDP Real per capita GDP in US dollars at the beginning of a year.
Inflation Percent increase in the CPI from the previous quarter.
Rule of Law Index that measures “the extent to which agents have confidence in and abide by the rules of society, and in particular the quality of contract enforcement.”
Kaufmann, Kraay, and Mastruzzi (2007).
Banking Industry Concentration
The assets of the three largest banks as a share of the assets of all commercial banks.
Beck, Demirgüç-Kunt, and Levine (2000).
Credit Information Sharing
Dummy taking 1 if public credit registry or private credit bureau operates in a country during a year, 0 otherwise.
Author constructed from Brown, Japelli, and Pagano (2007).
State Banks’ Asset Share
Share of majority state-owned banks’ assets in total bank sector assets.
EBRD “Structural change indicators.” Foreign Banks’ Asset
Share Share of total bank sector assets in banks
with foreign ownership exceeding 50 percent.
Stock Market Turnover Stock Market volume traded during a quarter divided by quarterly GDP.
Official stock exchange of corresponding country.
Output Volatility Root mean squared errors from yt = α + εt, using data from the preceding 10 quarters, where y is Real GDP growth.
Author constructed from data on Real GDP growth.

25
Table 2: Bank Credit and Bank Credit Maturity by Country
Country
Country Average Values for the Available Quarters Coverage
Credit as Share of Quarterly
GDP
Percent of Credit with Maturity
From To over 1 year over 5 years
Albania 9.32 52.03 17.42 Q3/2003 Q1/2006 Bulgaria 124.48 62.95 20.96 Q4/1999 Q1/2007 Czech Republic 195.96 64.46 39.64 Q1/1993 Q1/2007 Estonia 151.02 80.93 42.79 Q1/1994 Q1/2007 Hungary 85.73 52.60 34.40 Q4/1995 Q1/2007 Latvia 105.13 62.80 22.30 Q4/1992 Q1/2007 Lithuania 71.53 60.66 53.55 Q1/1995 Q4/2004 Macedonia, FYR 65.81 52.87 - Q4/2000 Q4/2006 Poland 101.12 63.28 34.80 Q4/1996 Q1/2007 Romania 57.61 44.41 15.41 Q4/1997 Q1/2007 Serbia, Republic of 100.80 56.09 - Q1/1999 Q1/2007 Slovak Republic 210.14 41.49 25.52 Q4/2002 Q2/2007 Slovenia 120.37 59.83 - Q1/1992 Q1/2006 Ukraine 89.23 39.73 - Q4/1996 Q2/2007 Sample 112.32 59.02 31.59
Notes: For variable definitions, please see Table 1.

Table 3: Summary Statistics
Credit /
GDP
Credit w/ Maturity over 1
year(%)
Credit w/ Maturity over 5
years(%)
Real Per cap.
GDP Growth
Per Capita GDP
Rule of Law Inflation
Credit Info.
Sharing
State Banks’ Asset Share
Foreign Banks’ Asset Share
Banking Industry Conc.
Output Volatility
Stock Market
Turnover Panel A: Descriptive Statistics Mean 112.32 59.02 31.59 3.92 3,903 0.18 13.75 0.69 22.16 50.45 0.71 2.66 0.10Minimum 6.14 4.12 1.04 -31.34 590 -1.14 -1.65 0 0 0 0.36 0.44 0Maximum 371.55 92.95 69.50 37.13 11,382 1 331.09 1 90.90 99.40 1 13.09 0.89Std. Dev. 66.46 17.22 17.10 5.71 2,323 0.58 29.82 0.46 22.96 31.16 0.18 2.19 0.14Panel B: Correlations Credit / GDP 1.00* Maturity over 1 year (%)
0.47* 1.00*
Maturity over 5 years (%)
0.66* 0.81* 1.00*
Growth 0.17* 0.42* 0.40* 1.00*Per Capita GDP 0.43* 0.33* 0.75* 0.00* 1.00*Rule of Law 0.48* 0.46* 0.72* 0.07* 0.82* 1.00*Inflation -0.20* -0.29* -0.40* -0.45* -0.07* -0.35* 1.00*Credit Info. Sharing
0.08* 0.23* 0.38* 0.18* 0.27* 0.36* -0.26* 1.00*
State Banks 0.06* -0.29* -0.24* -0.31* 0.04* -0.23* 0.51* -0.30* 1.00*Foreign Banks 0.09* 0.40* 0.41* 0.24* -0.09* 0.28* -0.43* 0.26* -0.62* 1.00*Bank. Ind. Conc. 0.13* 0.11* 0.18* -0.16* 0.04* 0.15* 0.16* 0.19* 0.10* 0.09* 1.00*Output Volatility -0.33* -0.24* -0.36* 0.20* -0.45* -0.53* 0.55* -0.11* 0.46* -0.19* 0.12* 1.00*Stock Market 0.02* 0.02* 0.26* 0.04* 0.04* 0.24* -0.07* 0.16* -0.2* 0.17* 0.16* -0.13* 1.00*EU membership 0.24* 0.26* 0.16* -0.02* 0.56* 0.82* 0.00* 0.24* 0.00* 0.23* 0.22* -0.33* 0.10*
Notes: * denotes significance at the 5 percent. For variable definitions, please see Table 1. 26
27
Table 4: Determinants of Credit Maturity
Percentage of Credit with Maturity
Longer than 1 year Percentage of Credit with Maturity
Longer than 5 years (1) (2) (3) (4) (5) (6) (7) (8) Rule of Law 11.334 14.724 5.399 8.905 15.743 14.465 9.580 10.744
(0.005) (0.000) (0.210) (0.009) (0.000) (0.000) (0.009) (0.004)State Banks’
Asset Share -0.106 -0.240 -0.091 -0.264 -0.074 -0.067 -0.103 -0.113
(0.005) (0.000) (0.020) (0.000) (0.007) (0.115) (0.001) (0.007)Foreign Banks’
Asset Share 0.035 -0.022 0.023 -0.034 -0.010 -0.027 -0.002 -0.025
(0.216) (0.343) (0.404) (0.129) (0.577) (0.216) (0.924) (0.242)Credit Info.
Sharing -2.729 2.661 -2.679 2.642 -3.709 -3.096 -3.158 -2.597
(0.051) (0.025) (0.048) (0.024) (0.000) (0.007) (0.001) (0.019)Credit 5.016 3.391 1.807 3.764 2.081 1.918 3.164 3.208
(0.002) (0.014) (0.268) (0.005) (0.101) (0.164) (0.014) (0.021)Per Capita GDP 3.983 1.293 7.376 2.122 15.757 15.560 16.838 15.609
(0.000) (0.182) (0.000) (0.036) (0.000) (0.000) (0.000) (0.000)Previous Year
GDP Growth 0.365 1.215 0.183 1.236 0.010 -0.007 -0.115 -0.052
(0.000) (0.000) (0.040) (0.000) (0.927) (0.960) (0.250) (0.692)Inflation -15.352 -21.541 -10.121 -14.898
(0.006) (0.000) (0.188) (0.048)Output Volatility 0.074 0.170 -0.234 -0.059
(0.791) (0.537) (0.468) (0.861)Stock Market
Turnover 2.525 -6.257 -6.966 -8.758 (0.498) (0.042) (0.030) (0.009)
Banking Industry Concentration
-5.568 -3.587 0.845 2.386 (0.209) (0.309) (0.766) (0.439)
EU Member -15.920 -11.467 -29.647 -11.792 -44.510 -48.288 -36.244 -30.835(0.149) (0.323) (0.206) (0.404) (0.043) (0.121) (0.000) (0.000)
Constant 49.195 54.938 59.538 57.806 11.669 18.783 (0.000) (0.000) (0.008) (0.000) (0.580) (0.528)
Hausman test: χ2 (d.f.) 3.18 (7) 0.78 (9) 4.31 (8) 1.05 (11) 4.16 (7) 1.16 (8) 4.07 (9) 4.48 (10)
p-value 0.868 0.999 0.828 0.827 0.761 0.997 0.907 0.923Observations 411 358 344 317 241 218 223 211Countries 14 14 11 11 10 10 9 9
Notes: See Table 1 for variable definitions. Results are based on Hausman-Taylor estimation, where Credit is endogenous. P-values are reported in parentheses below coefficients. The Hausman test has a null hypothesis that the explanatory variables are not correlated with the country-specific random-effects.
28
Table 5: Credit Maturity and Credit Information Sharing
Percentage of Credit with Maturity Longer than 1 year
Percentage of Credit with Maturity Longer than 5 years
(1) (2) (3) (4) (5) (6) (7) (8)
Cre
dit I
nfor
mat
ion
Shar
ing
Presence 2.642 -2.597 (0.024) (0.019)
Public Credit Registry
0.603 1.586 (0.664) (0.235)
Private Credit Bureau
3.869 -7.067 (0.002) (0.000)
Quality Index (Overall)
0.628 -0.828 (0.003) (0.000)
Quality Index (Public)
1.178 -1.818 (0.001) (0.000)
Quality Index (Private)
-0.033 0.601 (0.932) (0.115)
Notes: See Table 1 and text for variable definitions. Estimation based on Hausman-Taylor model with a full set of determinants, as in columns (4) and (8) of Table 4. P-values are reported in parentheses below coefficients.

29
Table 6: Credit Maturity and Alternative Institutional Measures
Dependent Variable Rule of
Law Government Effectiveness
Political Stability
Control of Corruption
Regulatory Power
EBRD Reform Index
Percentage of Credit with Maturity Longer than 1 year
8.905 17.026 2.909 16.171 10.101 11.061(0.009) (0.000) (0.160) (0.000) (0.000) (0.000)
Percentage of Credit with Maturity Longer than 5 years
10.744 14.024 9.556 14.648 3.671 7.767(0.004) (0.000) (0.000) (0.000) (0.217) (0.000)
Notes: See Table 1 for variable definitions. Estimation based on Hausman-Taylor model with a full set of determinants, as in columns (4) and (8) of Table 4. P-values are reported in parentheses below coefficients.

30
1996 1997 1998 1999 2000 2001 2002 2003 2004 2005 2006Estonia Hungary Latvia Poland Slovenia Ukraine
Figure 1: Credit as a Share of GDP.
Presented are yearly average values of credit divided by quarterly GDP for selected countries and time periods.

31
0%
10%
20%
30%
40%
50%
60%
70%
1996 1997 1998 1999 2000 2001 2002 2003 2004 2005 2006
Czech Republic Estonia Romania Latvia
Figure 2: Percent Long-Term Credit.
Presented are yearly average values of the credit with maturity longer than 5 years as a share of total credit for selected countries and time periods.

32
0%
10%
20%
30%
40%
50%
60%
70%
80%
1996 1997 1998 1999 2000 2001 2002 2003 2004 2005
Asset Share of State Owned Banks Asset Share of Foreign Owned Banks
Figure 3: State and Foreign Ownership of Banks.
Presented are assets owned by each type of banks as a share of all bank assets. These are averages across countries.