The progress of school education in India Review of Economic Policy, Volume 23, Number 2, 2007,...
28
Oxford Review of Economic Policy, Volume 23, Number 2, 2007, pp.168–195 The progress of school education in India Geeta Gandhi Kingdon ∗ Abstract This paper provides an overview of school education in India. First, it places India’s educational achievements in international perspective, particularly against countries with which it is now increasingly compared, especially China. Second, the paper examines schooling access in terms of enrolment and school attendance rates, and schooling quality in terms of literacy rates, learning achievement levels, school resources, and teacher inputs. Third, the paper investigates the role of private schooling in India, examining the extent of growth of private schooling and surveying evidence on the relative effectiveness and unit costs of private and public schools. Last, the paper discusses some major public education initiatives. The concluding section suggests a future research agenda and appeals for rigorous evaluation of the impacts and costs of the numerous existing educational interventions, in order to learn about their relative cost-effectiveness for evidence-based policy-making. Key words: school education, India JEL classification: I20, I21 I. Introduction India’s recent economic growth rates have generated much optimism about its general social and economic development. But has there been accompanying progress in indicators of educational outcomes? How good are Indian educational achievements in relation to China’s, the country with which it is increasingly compared? What are the most significant developments in Indian school education and what has been the impact of various education policy initiatives? This paper presents a critical overview of the school education sector in India using newly released data and a survey of existing studies. The story of India’s educational achievements is one of mixed success. On the down side, India has 22 per cent of the world’s population, but 46 per cent of the world’s illiterates, and is home to a high proportion of the world’s out-of-school children and youth. On the positive side, it has made encouraging recent progress in raising schooling participation. While the ∗ Department of Economics, University of Oxford, e-mail: [email protected] doi: 10.1093/icb/grm015 The Author 2007. Published by Oxford University Press. For permissions please e-mail: [email protected]
-
Upload
trinhkhanh -
Category
Documents
-
view
213 -
download
0
Transcript of The progress of school education in India Review of Economic Policy, Volume 23, Number 2, 2007,...

Oxford Review of Economic Policy, Volume 23, Number 2, 2007, pp.168–195
The progress of school education in India
Geeta Gandhi Kingdon∗
Abstract This paper provides an overview of school education in India. First, it places India’s educationalachievements in international perspective, particularly against countries with which it is now increasinglycompared, especially China. Second, the paper examines schooling access in terms of enrolment and schoolattendance rates, and schooling quality in terms of literacy rates, learning achievement levels, school resources,and teacher inputs. Third, the paper investigates the role of private schooling in India, examining the extentof growth of private schooling and surveying evidence on the relative effectiveness and unit costs of privateand public schools. Last, the paper discusses some major public education initiatives. The concluding sectionsuggests a future research agenda and appeals for rigorous evaluation of the impacts and costs of the numerousexisting educational interventions, in order to learn about their relative cost-effectiveness for evidence-basedpolicy-making.
Key words: school education, India
JEL classification: I20, I21
I. Introduction
India’s recent economic growth rates have generated much optimism about its generalsocial and economic development. But has there been accompanying progress in indicatorsof educational outcomes? How good are Indian educational achievements in relation toChina’s, the country with which it is increasingly compared? What are the most significantdevelopments in Indian school education and what has been the impact of various educationpolicy initiatives? This paper presents a critical overview of the school education sector inIndia using newly released data and a survey of existing studies.
The story of India’s educational achievements is one of mixed success. On the down side,India has 22 per cent of the world’s population, but 46 per cent of the world’s illiterates, andis home to a high proportion of the world’s out-of-school children and youth. On the positiveside, it has made encouraging recent progress in raising schooling participation. While the
∗Department of Economics, University of Oxford, e-mail: [email protected]: 10.1093/icb/grm015 The Author 2007. Published by Oxford University Press.For permissions please e-mail: [email protected]

The progress of school education in India 169
Table 1: Adult and youth literacy rates
Adult literacy rates(15+ year olds)
Youth Literacy rates(15–24 year olds)
Total Male Female Total Male Female
Bangladesh 42.6 51.7 33.1 51.5 59.4 43.1Pakistan 49.9 63.0 36.0 65.5 75.8 54.7Sri Lanka 90.7 92.3 89.1 95.6 95.1 96.1India 61.0 73.4 47.8 76.4 84.2 67.7China 90.9 95.1 86.5 98.9 99.2 98.5Brazil 88.6 88.4 88.8 96.8 95.8 97.9Russian Federation 99.4 99.7 99.2 99.7 99.7 99.8World 82.2 87.2 77.3 87.3 90.5 84.1Developing countries 76.8 83.5 70.1 84.8 88.6 80.9Sub-Saharan Africa 61.2 69.5 53.3 72.9 77.8 68.3
Source: 2000–4 data from the Education for All Global Monitoring Report (UNESCO, 2006).
base of India’s education pyramid may be weak, it has emerged as an important player in theworldwide information technology revolution on the back of substantial (absolute) numbersof well-educated computer-science and other graduates. This paper provides an assessmentof the current situation and recent progress of school education.
II. Indian educational achievements in internationalperspective
Table 1 presents India’s adult and youth literacy rates alongside equivalent figures for itsregional neighbours, as well as for countries in the BRIC grouping (Brazil, Russian Feder-ation, India and China)—countries with which India is increasingly compared. While Indiadoes well compared to Bangladesh and Pakistan, it lags substantially behind all the otherBRIC countries and Sri Lanka, and is also behind the average for ‘developing countries’.Indeed, it is striking that its overall adult literacy rate is similar to—and female adult literacyrate lower than—that of Sub-Saharan Africa. The comparison with China is of particularinterest and it shows India to be at a considerable educational disadvantage: India’s adultliteracy in the early 2000s was wholly 30 percentage points below that of China. Evenfocusing more narrowly on only the youth literacy rates, India’s disadvantage with respect toChina is a large 22.5 percentage points.
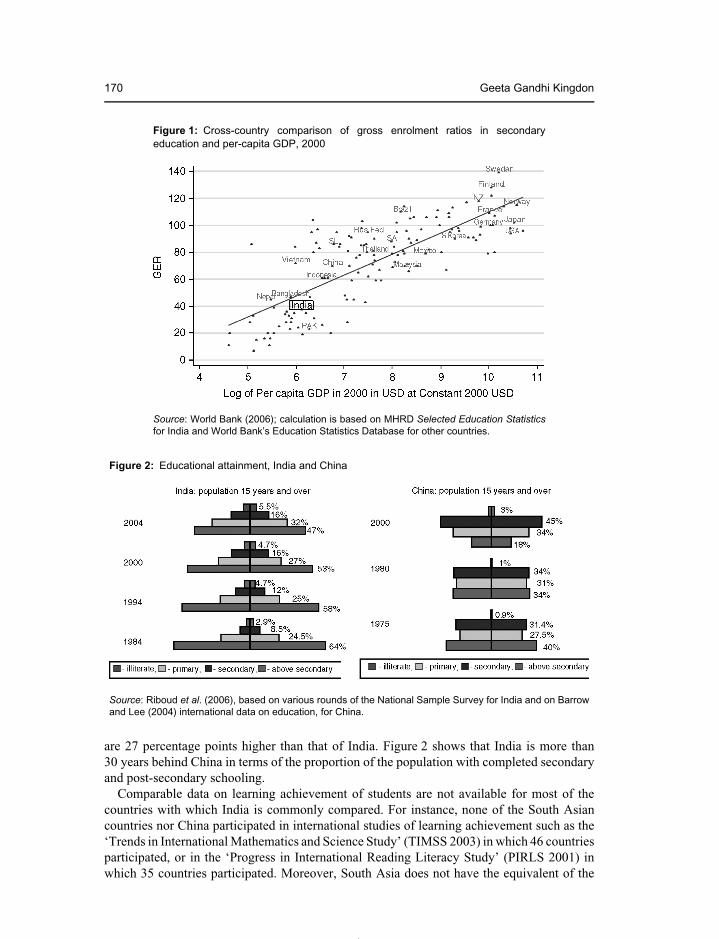
India’s disadvantage vis-a-vis other countries in primary school participation rates isnow much smaller compared to that for youth literacy rates, since 93.4 per cent of Indianelementary school age children were enrolled in school in 2006 according to the AnnualSurvey of Education Report (ASER) (Pratham, 2007).1 However, as Figure 1 shows, at thesecondary school level, India is again at a large disadvantage with respect to all three otherBRIC countries where secondary enrolment rates are far above those predicted for countriesat their levels of per-capita GDP. Brazilian and Russian secondary school net enrolment rates
1 Though see section III(ii) on India’s current school attendance rates.
170 Geeta Gandhi Kingdon
Figure 1: Cross-country comparison of gross enrolment ratios in secondaryeducation and per-capita GDP, 2000
Source: World Bank (2006); calculation is based on MHRD Selected Education Statisticsfor India and World Bank’s Education Statistics Database for other countries.
Figure 2: Educational attainment, India and China
Source: Riboud et al. (2006), based on various rounds of the National Sample Survey for India and on Barrowand Lee (2004) international data on education, for China.
are 27 percentage points higher than that of India. Figure 2 shows that India is more than30 years behind China in terms of the proportion of the population with completed secondaryand post-secondary schooling.
Comparable data on learning achievement of students are not available for most of thecountries with which India is commonly compared. For instance, none of the South Asiancountries nor China participated in international studies of learning achievement such as the‘Trends in International Mathematics and Science Study’ (TIMSS 2003) in which 46 countriesparticipated, or in the ‘Progress in International Reading Literacy Study’ (PIRLS 2001) inwhich 35 countries participated. Moreover, South Asia does not have the equivalent of the

The progress of school education in India 171
Southern and Eastern Africa Consortium for Monitoring Educational Quality (SACMEQ)study, which is a regional inter-country comparative study of achievement levels in 14African countries.2 However, World Bank (2006) applied the TIMSS questions to secondaryschool students in the Indian states of Rajasthan and Orissa, with the permission of the IndianMinistry of Human Resource Development. The findings show that the international meanachievement in the maths test was 52 per cent for grade 8 students but the average scoresof Rajasthan and Orissa students on the same test were 34 and 37 per cent, respectively.Similarly, the international mean of achievement was 57 per cent for grade 12 studentsbut the corresponding scores for Indian students were 44 and 38 per cent in Rajasthan andOrissa, respectively.3 However, the high international average percentage mark from the 46TIMSS countries included both high- and low-income countries. When India did participatein international studies of learning achievement in the early 1970s, the performance ofIndian children was poor relative to most participating developing countries, according to theInternational Association for the Evaluation of Educational Achievement (IEA).4
III. Schooling access and quality
At independence, India inherited a legacy of large-scale illiteracy and lack of proper provisionfor education. At the first post-independence census of 1951, only 9 per cent of women and27 per cent of men were literate. It was resolved by the framers of the constitution that thenew Indian state would endeavour to provide free and compulsory education to all childrenup to age 14 by 1960. This goal turned out to be elusive and the deadline for its achievementhas been put back repeatedly in the past 55 years. While even today this goal remainsunfulfilled, there has been very encouraging progress in schooling participation and othereducational outcome indicators in recent times. We consider several educational access andquality indicators next.
(i) Primary and secondary enrolment rates
The ASER2006 survey (Pratham, 2007) provides the latest picture of schooling participationin India. It finds that 93.4 per cent of all elementary-school-age children (6–14 year olds) were
2 For TIMSS, see http://nces.ed.gov/timss/; for PIRLS see http://timss.bc.edu/pirls2001.html; for SACMEQ seehttp://www.sacmeq.org/
3 There are certain caveats about the direct comparability of the Indian and international results (see World Bank(2006, p. 58) for details). In particular, internationally the tests were administered to students of grades 8 and 12,but in India they were applied to students of grades 9 and 11 for logistical reasons (e.g. there was a desire not todisturb students of grade 12 who were close to their board examinations). The more difficult items in the originalTIMSS intended for grade 8 were selected for grade 9 and the easier items originally intended for grade 12 wereapplied to grade 11. The selected items were shown to state officials, teachers, and students to ensure that they werea reasonable choice in relation to the curriculum.
4 International comparison of achievement among school-going 14-year-olds across 25 high- and low-incomecountries, using IEA data collected in the early 1970s, showed that the mean science test score of Indian studentswas the second lowest. Iran was behind India by a small margin. Mean scores of students in Bolivia, Thailand,Colombia, Peru, Mexico, Brazil, Chile, and Paraguay were all higher than those of Indian students; the mean scoreof Japanese students was twice as high as that of Indian students. The results were similar in (own-language) readingcomprehension: median reading score was 26 points, Chile’s mean was 14 points, Iran’s 8 points, and India’s thelowest at 5 points (Kingdon, 1994, p. 8).

172 Geeta Gandhi Kingdon
enrolled in school—an encouraging statistic, reflecting a good deal of progress compared toenrolments in the early 1990s.5 Among children aged 11–14 years, enrolment was lower: 10.3per cent of girls and 7.7 per cent of boys were out of school (either never enrolled in school ordropped out). Among 15–16 years olds, the corresponding out-of-school figures rose steeplyto 22.7 per cent and 20.2 per cent, respectively, for girls and boys. The distinction betweenenrolment and current school attendance is important and we discuss current attendance insection (ii) below. Dreze and Kingdon (2001) find that both demand- and supply-side factorsare important in explaining schooling participation in India.
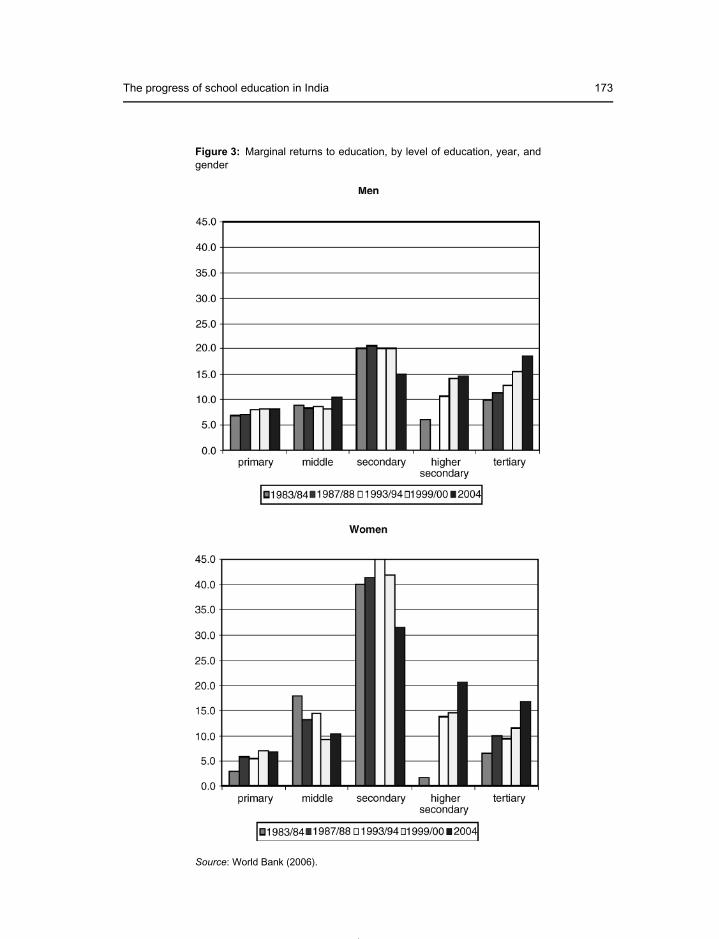
Figure 1 shows a gross enrolment rate in secondary education of 47 per cent. While belowthe level predicted for a country of India’s per-capita income level, secondary enrolmentrates have risen impressively in India (World Bank, 2006). Demand for secondary educationhas risen (partly via increase in private schooling) because it is a lucrative level of educationto acquire. Kingdon (1998) and Kingdon and Unni (2001) find, using sample selectivity-corrected earnings equations, that the education–wage relationship is convex in India, i.e.returns to secondary and higher education are significantly greater than to primary and middlelevels of education.6 Estimation of wage functions using National Sample Survey data alsoconfirms that wage returns to education increase with education level: the coefficient on thequadratic term in ‘years of education’ is large, positive, and statistically significant in almostevery state for both genders (Kingdon, 2007). Moreover, Figure 3 shows that for both menand women, the returns to higher secondary and tertiary education have risen consistentlyover time. For women, the return to primary education has fallen, but for men it has remainedstatic. These findings are based on National Sample Survey data analysed by Duraisamy(2002), Vasudeva-Datta (2006), and World Bank (2006).
The high returns to secondary education raise the puzzle of why secondary schoolparticipation is not higher in India. Schooling participation depends on both the extent ofdemand for and the availability of supply of schooling. It seems there are some supply-sidebarriers. According to the Seventh All India Education Survey (NCERT, 2006b), in 2002,there were only one-fifth as many secondary schools (those with grade 10 classes) as thenumber of primary schools. Thus, it seems likely that secondary school enrolment rates arelow partly because of the lack of supply of nearby secondary schools. A demand-side factorthat likely militates against higher secondary school participation is parents’ perceived futilityof educating girls, since many families adhere to traditional gender roles and do not envisagedaughters’ participation in the labour market. Conservatism and concern for safety may also
5 Though the figure seems high in relation to the Government of India’s ‘Selected Education Statistics’ for2002/3, where gross enrolment rate in middle-level education (grades 6–8) was only 61 per cent, even though it was95.4 per cent in primary education (grades 1–5). The great progress in basic education participation is consistentwith an increase in both the demand for and supply of education. The PROBE report (Probe Team, 1999, p. 19)reported a broad-based surge in educational aspirations in the 1990s. Demand for education also increased owingto the well-documented reductions in poverty since the early 1990s, which made it possible for the poor to realizetheir educational aspirations. It may also have risen partly due to reduction in fertility levels if there is a trade-offbetween the number of children and the education of each child within the family: total fertility rate for India as awhole fell from 3.4 to 2.7 in the period between 1993 and 2005 (National Family Health Survey, 2007). Finally,demand for education may also have increased if the perceived benefits of education—its private economic rates ofreturn—increased.
6 While education is endogenous in an earnings function, Card (2001) finds that estimates of the coefficient onschooling made using an instrumental variable strategy are not far different from (and, indeed, typically larger than)corresponding OLS estimates.
The progress of school education in India 173
Figure 3: Marginal returns to education, by level of education, year, andgender
Source: World Bank (2006).
174 Geeta Gandhi Kingdon
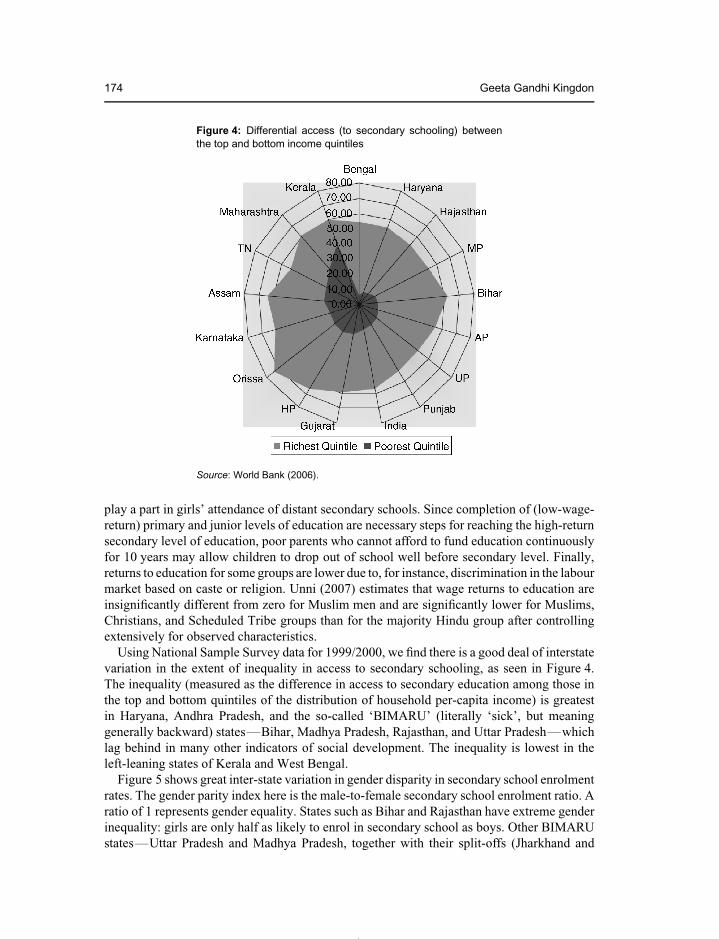
Figure 4: Differential access (to secondary schooling) betweenthe top and bottom income quintiles
Source: World Bank (2006).
play a part in girls’ attendance of distant secondary schools. Since completion of (low-wage-return) primary and junior levels of education are necessary steps for reaching the high-returnsecondary level of education, poor parents who cannot afford to fund education continuouslyfor 10 years may allow children to drop out of school well before secondary level. Finally,returns to education for some groups are lower due to, for instance, discrimination in the labourmarket based on caste or religion. Unni (2007) estimates that wage returns to education areinsignificantly different from zero for Muslim men and are significantly lower for Muslims,Christians, and Scheduled Tribe groups than for the majority Hindu group after controllingextensively for observed characteristics.
Using National Sample Survey data for 1999/2000, we find there is a good deal of interstatevariation in the extent of inequality in access to secondary schooling, as seen in Figure 4.The inequality (measured as the difference in access to secondary education among those inthe top and bottom quintiles of the distribution of household per-capita income) is greatestin Haryana, Andhra Pradesh, and the so-called ‘BIMARU’ (literally ‘sick’, but meaninggenerally backward) states—Bihar, Madhya Pradesh, Rajasthan, and Uttar Pradesh—whichlag behind in many other indicators of social development. The inequality is lowest in theleft-leaning states of Kerala and West Bengal.
Figure 5 shows great inter-state variation in gender disparity in secondary school enrolmentrates. The gender parity index here is the male-to-female secondary school enrolment ratio. Aratio of 1 represents gender equality. States such as Bihar and Rajasthan have extreme genderinequality: girls are only half as likely to enrol in secondary school as boys. Other BIMARUstates—Uttar Pradesh and Madhya Pradesh, together with their split-offs (Jharkhand and

The progress of school education in India 175
Figure 5: Gender parity index in secondary gross enrolment ratio
Sources: World Bank (2006), based on enrolment figures in MHRD (2003).
Chattisgarh)—also have very high gender inequality,7 but on the bright side, many stateshave gender parity or even slightly pro-female secondary enrolment rates, e.g. Kerala andTamil Nadu. Kingdon (2005) finds that an important part of the reason for gender inequalityis to be found within the household, as opposed to institutional explanations (indeed, policypromotes girls’ enrolment by instituting tuition-free schooling for girls). Using householdfixed effects equations, she finds strong within-household bias against daughters in terms ofschool enrolment and household educational expenditure.
(ii) School attendance rates
Current attendance rates are a more reliable indicator of schooling participation thanenrolment rates, since large enrolment rates measured at the start of the school year canmask non-attendance and/or drop-out later in the school year. Table 2 shows current schoolattendance rates from the National Family Health Surveys (NFHS) of 1993 and 1999(NFHS 2005 data are not available yet). In this short 6-year period, school attendanceamong rural 6–10-year-old girls and boys increased by 20 and 12 percentage points,respectively; these are very substantial increases. In the rural 11–14 year age group,increases were more modest but still large, especially for girls, at 13.7 per cent. Urban
7 Jharkhand split off from Bihar, and Chattisgarh from Madhya Pradesh in 2001 to form independent new states.

176 Geeta Gandhi Kingdon
Tab
le2:
Incr
ease
incu
rren
tsch
oola
ttend
ance
inru
ralI
ndia
,by
stat
ean
dge
nder
Mal
esF
emal
es
Ag
e6
–10
Ag
e11
–14
Ag
e6
–10
Ag
e11
–14
1993
1999
Incr
ease
1993
1999
Incr
ease
1993
1999
Incr
ease
1993
1999
Incr
ease
And
hra
Pra
desh
6986
1764
695
5279
2737
4710
Bih
ar57
6811
6572
734
5319
3349
16G
ujar
at79
845
7974
−564
7511
5855
−3H
arya
na86
937
8688
372
8917
6677
12K
arna
taka
7685
867
725
6582
1746
6114
Ker
ala
9597
295
961
9598
394
963
Mad
hya
Pra
desh
6180
1970
756
4774
2745
5510
Mah
aras
htra
8591
681
865
7889
1156
7822
Oris
sa76
8510
7380
763
8118
5365
12P
unja
b84
939
7787
1078
9315
6880
12R
ajas
than
7087
1875
838
3666
3029
4516
Tam
ilN
adu
9196
578
836
8495
1163
7614
Utta
rP
rade
sh70
8314
7580
545
7126
3857
19W
estB
enga
l69
8311
6875
764
8117
5567
12A
llIn
dia
7183
1273
795
5575
2048
6214
Not
es:H
imac
halP
rade
shfig
ures
are
not
avai
labl
efr
omN
FH
S.D
ata
oncu
rren
tsc
hool
atte
ndan
cefr
omth
e20
05/6
FH
S-3
surv
eyha
veno
tbe
enre
leas
edas
ofsp
ring
2007
.S
ourc
es:N
FH
S-1
and
NF
HS
-2st
ate
and
all-I
ndia
repo
rts.
The progress of school education in India 177
Figure 6: Literacy rates, by gender, 1961–2001
Source: Census of India, various years (downloadable from Censuswebsite).
increases (not shown) were smaller. Andhra Pradesh, Madhya Pradesh, Rajasthan, and UttarPradesh made very large improvements in their current school attendance rates, particularlyin rural areas, where, in each of these four states, attendance rates rose by over 25 percentagepoints in the 6-year period. Overall, nearly 80 per cent of all 6–14-year-olds were attendingschool in 1999.8 One of the best ways to measure school attendance rates is to observe astudent’s attendance in class at several points in time throughout the school year. A recentstudy using this method shows that attendance varied from 43 per cent in Bihar and 59 percent in Uttar Pradesh, to very high rates (in the 90s per cent) in the more educationallyprogressive states (MHRD, 2007).
(iii) Literacy rates
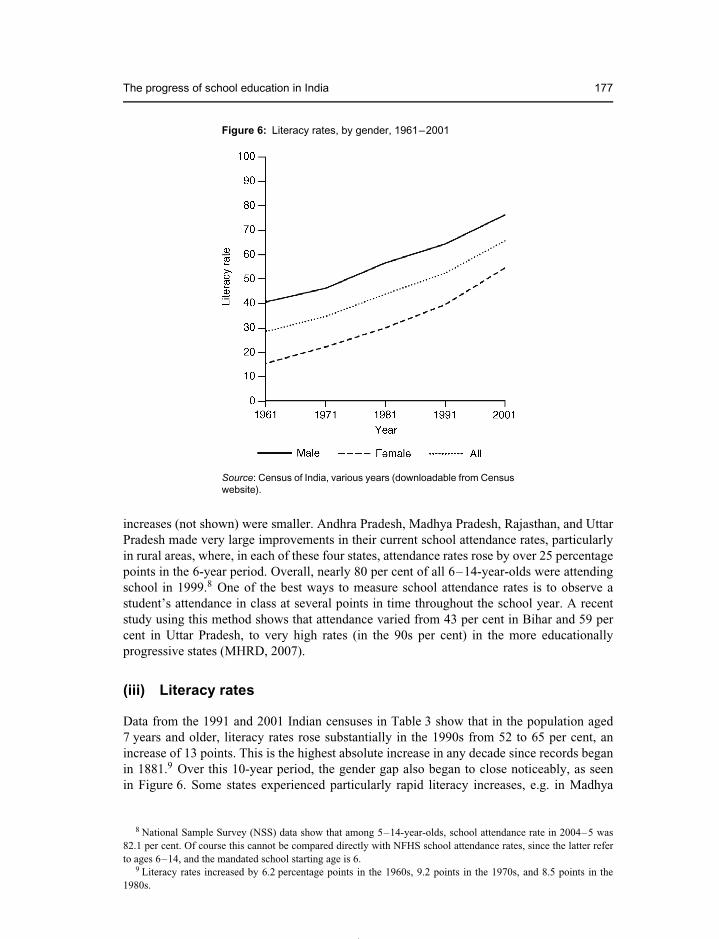
Data from the 1991 and 2001 Indian censuses in Table 3 show that in the population aged7 years and older, literacy rates rose substantially in the 1990s from 52 to 65 per cent, anincrease of 13 points. This is the highest absolute increase in any decade since records beganin 1881.9 Over this 10-year period, the gender gap also began to close noticeably, as seenin Figure 6. Some states experienced particularly rapid literacy increases, e.g. in Madhya
8 National Sample Survey (NSS) data show that among 5–14-year-olds, school attendance rate in 2004–5 was82.1 per cent. Of course this cannot be compared directly with NFHS school attendance rates, since the latter referto ages 6–14, and the mandated school starting age is 6.
9 Literacy rates increased by 6.2 percentage points in the 1960s, 9.2 points in the 1970s, and 8.5 points in the1980s.

178 Geeta Gandhi Kingdon
Table 3: Literacy rates by state, area, and gender, census data
Male Female Persons
1991 2001 Increase 1991 2001 Increase 1991 2001 Increase
Andhra Pradesh 55.1 70.9 15.8 32.7 51.2 18.5 44.1 61.1 17.0Bihar 52.5 62.2 9.7 22.9 35.2 12.3 38.5 49.2 10.7Gujarat 73.1 76.5 3.4 48.6 55.6 7.0 61.3 66.4 5.1Haryana 69.1 79.3 10.2 40.5 56.3 15.8 55.9 68.6 12.7Himachal Pradesh 75.4 84.6 9.2 52.1 67.1 15.0 63.9 75.9 12.0Karnataka 67.3 76.3 9.0 44.3 57.5 13.2 56.0 67.0 11.0Kerala 93.6 94.2 0.6 86.1 87.9 1.8 89.8 90.9 1.1Madhya Pradesh 58.4 77.0 18.6 28.9 51.0 22.1 44.2 64.4 20.2Maharashtra 76.6 86.3 9.7 52.3 67.5 15.2 64.9 77.3 12.4Orissa 63.1 76.0 12.9 34.7 51.0 16.3 49.1 63.6 14.5Punjab 65.7 75.6 9.9 50.4 63.6 13.2 58.5 70.0 11.5Rajasthan 55.0 76.5 21.5 20.4 44.3 23.9 38.6 61.0 22.4Tamil Nadu 73.8 82.3 8.5 51.3 64.6 13.3 62.7 73.5 10.8Uttar Pradesh 55.7 70.9 15.2 25.3 43.9 18.6 41.6 58.1 16.5West Bengal 67.8 77.6 9.8 46.6 60.2 13.6 57.7 69.2 11.5India 64.1 75.6 11.5 39.3 54.0 14.7 52.2 65.2 13.0
Note: The old boundaries of Bihar, Madhya Pradesh, and Uttar Pradesh have been used for 2001—i.e. includingJharkhand, Chhattisgarh, and Uttaranchal, respectively.Sources: Census 1991; Census 2001.
Pradesh and Rajasthan, literacy rates rose by 20 and 22 percentage points, respectively. Theincrease in female literacy was also large in these states, as well as in Uttar Pradesh andAndhra Pradesh. However, Bihar and Gujarat made poor progress. Latest NSS data show thatin the population aged 7 years and older, in 2004–5, the literacy rate was 77 per cent amongmales, 57 per cent among females, and 67.3 per cent overall (NSS, 2006).
Unfortunately, age-specific literacy data were not available from the 2001 Indian censuseven in early 2007. However, such data from the NFHS of 1993 and 1999 show encouragingtrends.10 Table 4 shows that during the short 6-year period from 1993 to 1999, literacy ratesin the young age groups rose rapidly for girls: taking rural and urban areas together, femaleliteracy in the youngest age group, 6–10, rose by nearly 14 percentage points. For rural girlsaged 6–19, literacy rates rose by about 15 points. Overall, the national literacy rate for malesand females aged 6–19 years increased by about 10 percentage points.
Any major improvement in national literacy in the future will depend crucially on itsprogress among young persons in the four large north-Indian BIMARU states, which havelagged behind particularly seriously in the past. Examining recent progress in these statesis perhaps the most informative statistic when attempting to foresee the future of literacy inIndia. Table 5 shows marked acceleration over time in literacy rates among 10–14-year-oldsin these states. Whereas the literacy rate among the young increased by only 6 percentagepoints in each of the two decades, the 1960s and 1970s, it increased by 14 points in the 1980sand by 18 points in the 1990s.
10 Corresponding data from NFHS 2005/6 are not available yet.

The progress of school education in India 179
Table 4: Increase in age-specific literacy rates, by area and gender
Rural Urban Total
1993 1999 Increase 1993 1999 Increase 1993 1999 Increase
MalesAge 6–9 59.8 70.0 10.2 77.5 83.8 6.3 64.0 73.1 9.1Age 10–14 79.1 85.0 5.9 90.5 93.0 2.5 82.1 87.0 4.9Age 15–19 77.0 83.0 6.0 89.7 91.2 1.5 80.5 85.3 4.8FemalesAge 6–9 47.1 63.6 16.5 74.9 80.3 5.4 53.6 67.4 13.8Age 10–14 57.1 71.4 14.3 84.3 90.7 6.4 64.1 76.1 12.0Age 15–19 47.2 61.3 14.1 80.8 86.6 5.8 56.2 68.2 12.0TotalAge 6–9 53.7 66.9 13.2 76.2 82.1 5.9 59.0 70.4 11.4Age 10–14 68.5 78.5 10.0 87.5 91.8 4.3 73.4 81.8 8.4Age 15–19 61.8 72.2 10.4 85.2 89.0 3.8 68.1 76.9 8.8
Sources: Compiled from NFHS-1 (Table 3.8) and NFHS-2 (Table 2.7), National Final Reports (IIPS and ORCMacro, 1995, 2000). Figures for NFHS-3 data from 2005/6 have not been released as of early 2007.
Table 5: Literacy rates in the 10–14 age group, 1961–99 (Bihar, MadhyaPradesh, Rajasthan, and Uttar Pradesh)
Year Average literacyrate (10–14-year-olds)
Percentagepoint increaseover previous
decade
Annualpercentage
increase overprevious decade
(%)
1961 31 — —1971 37 6 1.81981 43 6 1.51991 57 14 2.91999 75 18 3.5
Notes: The figures for 1961–91 are calculations from census data; 1999 figures arefrom state reports of the NFHS-2, (IIPS and ORC Macro, 2000). For any given year,the literacy rate figure in the first column is the simple mean of the literacy rates for thefour states in that year. It is not weighted by the respective populations of the states.Source: Kingdon et al. (2004).
(iv) Learning achievement levels in primary education
A large body of evidence suggests that workers’ productivity and earnings depend notonly on years of education acquired, but also on what is learnt at school. This literature issummarized in Hanushek (2005). He cites three US studies as showing quite consistently thata one-standard-deviation increase in mathematics test performance at the end of high schoolin the USA translates into 12 per cent higher annual earnings. He also cites three studies fromthe UK and Canada showing strong productivity returns to both numeracy and literacy skills.Substantial returns to cognitive skills also hold across the developing countries for whichstudies have been carried out, i.e. in Ghana, Kenya, Tanzania, Morocco, Pakistan, and SouthAfrica. Hanushek and Zhang (2006) confirm significant economic returns to literacy for 13
180 Geeta Gandhi Kingdon
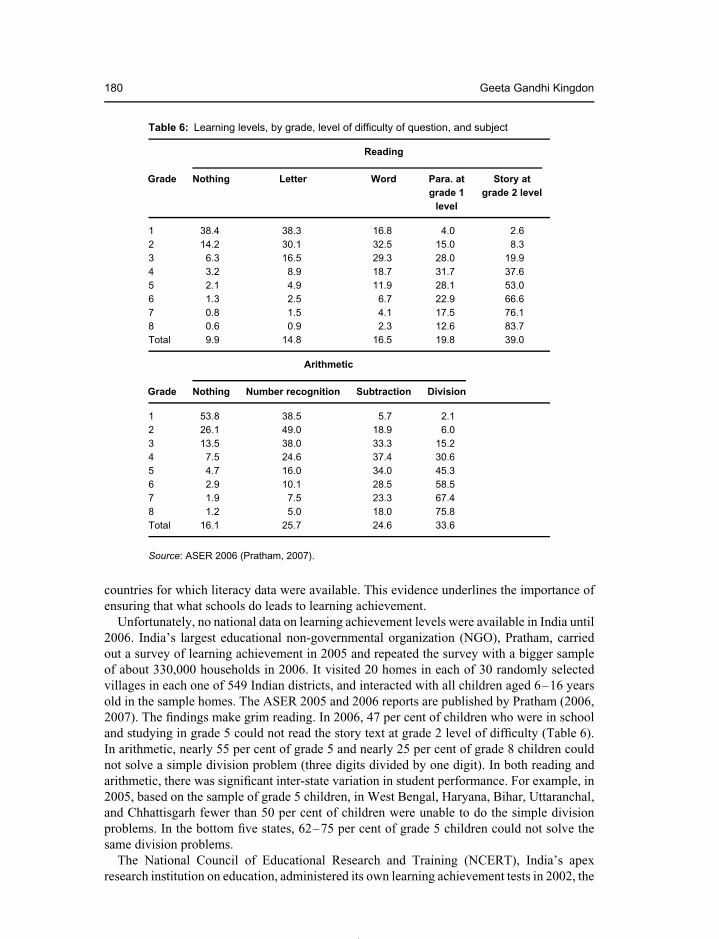
Table 6: Learning levels, by grade, level of difficulty of question, and subject
Reading
Grade Nothing Letter Word Para. at Story atgrade 1 grade 2 level
level
1 38.4 38.3 16.8 4.0 2.62 14.2 30.1 32.5 15.0 8.33 6.3 16.5 29.3 28.0 19.94 3.2 8.9 18.7 31.7 37.65 2.1 4.9 11.9 28.1 53.06 1.3 2.5 6.7 22.9 66.67 0.8 1.5 4.1 17.5 76.18 0.6 0.9 2.3 12.6 83.7Total 9.9 14.8 16.5 19.8 39.0
Arithmetic
Grade Nothing Number recognition Subtraction Division
1 53.8 38.5 5.7 2.12 26.1 49.0 18.9 6.03 13.5 38.0 33.3 15.24 7.5 24.6 37.4 30.65 4.7 16.0 34.0 45.36 2.9 10.1 28.5 58.57 1.9 7.5 23.3 67.48 1.2 5.0 18.0 75.8Total 16.1 25.7 24.6 33.6
Source: ASER 2006 (Pratham, 2007).
countries for which literacy data were available. This evidence underlines the importance ofensuring that what schools do leads to learning achievement.
Unfortunately, no national data on learning achievement levels were available in India until2006. India’s largest educational non-governmental organization (NGO), Pratham, carriedout a survey of learning achievement in 2005 and repeated the survey with a bigger sampleof about 330,000 households in 2006. It visited 20 homes in each of 30 randomly selectedvillages in each one of 549 Indian districts, and interacted with all children aged 6–16 yearsold in the sample homes. The ASER 2005 and 2006 reports are published by Pratham (2006,2007). The findings make grim reading. In 2006, 47 per cent of children who were in schooland studying in grade 5 could not read the story text at grade 2 level of difficulty (Table 6).In arithmetic, nearly 55 per cent of grade 5 and nearly 25 per cent of grade 8 children couldnot solve a simple division problem (three digits divided by one digit). In both reading andarithmetic, there was significant inter-state variation in student performance. For example, in2005, based on the sample of grade 5 children, in West Bengal, Haryana, Bihar, Uttaranchal,and Chhattisgarh fewer than 50 per cent of children were unable to do the simple divisionproblems. In the bottom five states, 62–75 per cent of grade 5 children could not solve thesame division problems.
The National Council of Educational Research and Training (NCERT), India’s apexresearch institution on education, administered its own learning achievement tests in 2002, the

The progress of school education in India 181
results of which were published in 2006, soon after the release of the ASER survey. This firstofficial effort to collect national achievement level data tested about 90,000 students of grade 5(age 10–11). Standardized tests of competency in language, mathematics, and environmentalscience were administered and each student’s marks were recorded in percentage terms. Theaverage percentage mark for India as a whole was 50.3 per cent in science, 46.5 per cent inmaths, and 58.6 per cent in language (Kingdon, 2007). While it is not clear how to interpretthese data, they appear to confirm ASER’s findings of low learning levels.
(v) Learning achievement levels in secondary education
Given the weak base of learning at the primary level, it is to be expected that learning levels insecondary education will also be poor. We have already seen that, in cross-country compar-isons, achievement levels of Indian students appear to be well below the international average,though the latter category does include developed countries. While each Indian state examina-tion board sets its own curricula and examinations and there are no national-level data basedon a common standardized achievement test in India, the Council of Boards of SecondaryEducation provides pass rates in the high school and intermediate (senior secondary) exam-inations in different states. 2004 pass rates in the high school exam varied from 37 per centin Manipur to 80 per cent in Andhra Pradesh, but such inter-state comparison is meaninglesssince curricula, exam papers, passing requirements, etc. all differ from state to state.
In any case, the high school pass rates cannot be taken at face value as they are muchinflated owing to the phenomenon of widespread cheating, if we can generalize from theexperience of Uttar Pradesh. While the true levels of learning achievements in secondaryeducation are generally hidden, fortuitously they became visible one year in Uttar Pradesh.Table 7 shows that when the Kalyan Singh government brought in an anti-cheating rule andinstalled police at all examination centres in 1992 to prevent the mass-cheating that routinelytakes place at board examinations in Uttar Pradesh, the pass rate in the high school examfell from 57 per cent in 1991 to a pitiful 14.7 per cent in 1992 (17 per cent among regularcandidates and 9 per cent among candidates who appear for exams ‘privately’, i.e. throughself-study, without attending any school). This is when the bar for passing is set very low,i.e. a student only needs on average 33 per cent marks in their various subjects in order topass high school. This suggests the true extent of the problem of low achievement levels insecondary education, though it is possible that achievement levels in Uttar Pradesh are lowerthan in other states. Moreover, students rely on ‘guess papers’ which are sold a few weeks
Table 7: Pass rates in exams of the Uttar Pradesh High School ExamBoard
Year Percentage of exam-takers who passedRegular candidates Private candidates Total
1988 49.6 40.6 46.61989 47.6 39.4 44.81990 46.4 40.4 44.21991 61.2 52.2 57.01992 17.3 9.0 14.7
Source: Kingdon and Muzammil (2003). Taken from Swatantra Bharat (HighSchool Exam Results Supplement), 15 July 1992, p. 3.
182 Geeta Gandhi Kingdon
before the exams. These attempt to anticipate exam questions and are often remarkably closeto them. There is frequent leaking of papers in advance of examinations.
(vi) School quality
The impact of cognitive achievement on earnings, productivity, and economic growthhighlights the importance of school quality. How is India doing in terms of the commonmeasures of schooling quality, namely school facilities and teacher effort? The Public Reporton Basic Education (Probe Team, 1999) was the first serious evidence-based study of thestate of primary schooling quality in India, based on a survey of schooling facilities in 242villages across five north Indian states—Bihar, Madhya Pradesh, Rajasthan, Uttar Pradesh,and Himachal Pradesh—in 1996. Probe found very poor school infrastructure, e.g. 26 percent of schools did not have a blackboard in every classroom, 52 per cent had no playground,59 per cent no drinking water, 89 per cent no toilet, 59 per cent no maps or charts, 75 percent no toys, 77 per cent no library, and 85 per cent no musical instruments (Probe Team,1999, p. 42). Nine years later, the ASER 2005 report (Pratham, 2006) found that 66 per centof primary schools had water (up from 41 per cent in 1996) and 42 per cent had functioningtoilets (up from only 11 per cent in the Probe survey of 1996). These improvements inschool infrastructure are explained at least in part by the massive educational intervention‘District Primary Education Project’ (DPEP) which started with donor assistance in themid-1990s in districts with below national mean literacy rates. One of the explicit objectivesof DPEP was to construct schooling facilities and upgrade school infrastructures. WhileDPEP and its successor programme Sarva Shiksha Abhiyan (Campaign for Education forAll) have obviously helped, the current state of school facilities is nevertheless clearly farfrom satisfactory, with substantial proportions of primary schools still without the most basicessentials, such as drinking water, toilets, furniture, teaching aids, and books, let alone moreadvanced resources such as fans, playgrounds, musical instruments, computers, etc.
While inputs are clearly low, arguably a factor that matters more is incentives (Hanushek,2003). There is clear evidence of teacher negligence in schools. First, teacher absence ratesare high. Kremer et al.’s (2005) survey of teacher absence in rural India in 2003 made threeunannounced visits to each of 3,700 schools in 20 major states of India. They found that, onaverage, 25 per cent of teachers in government primary schools were absent from school ona given day.11 Second, even among teachers who were present, only about half were foundengaged in teaching (Kremer et al., 2005). The Probe survey had similar findings of lowlevels of teaching activity in schools. The Probe Team (1999) states that the extreme cases ofteacher negligence were less devastating than the quiet inertia of the majority of teachers. . . .In half of the sample schools, there was no teaching activity at the time of the investigators’visit. . . . Inactive teachers were found engaged in a variety of pastimes such as sipping tea,reading comics, or eating peanuts, when they were not just sitting idle. Generally speaking,teaching activity has been reduced to a minimum in terms of both time and effort. And thispattern is not confined to a minority of irresponsible teachers—it has become a way of lifein the profession. (Probe Team, 1999, p. 63) The ASER2005 report also found a teacherabsence rate of 25 per cent, as in Kremer et al. (2005).
11 Absence rates varied from 15 per cent in Maharashtra to 42 per cent in Jharkhand, with higher rates concentratedin the poorer states. They also found that in a village fixed-effects equation of teacher absence, private-schoolteachers were 8 percentage points less likely to be absent than public-school teachers in the same village.
The progress of school education in India 183
IV. Role of private schooling
Poorly resourced public schools which suffer from high rates of teacher absenteeism mayhave encouraged the rapid growth of private (unaided) schooling in India, particularly inurban areas. Private schools divide into two types:12 recognized and unrecognized schools.Government ‘recognition’ is an official stamp of approval and for this a private schoolis required to fulfil a number of conditions, though hardly any private schools that get‘recognition’ actually fulfil all the conditions of recognition.13 The emergence of largenumbers of unrecognized primary schools suggests that schools and parents do not takegovernment recognition as a stamp of quality.
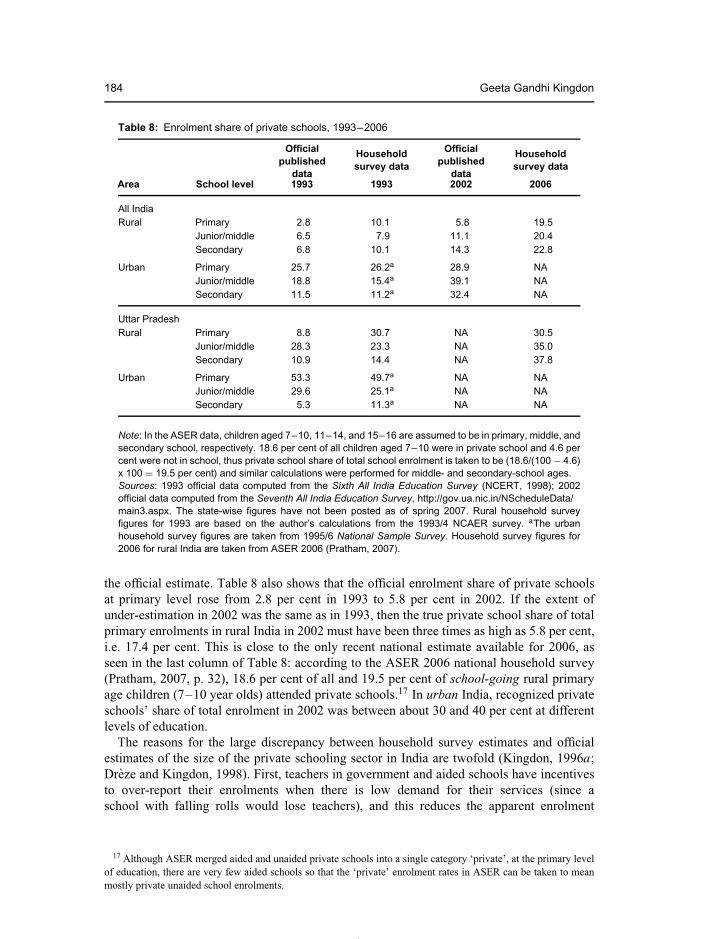
(i) Private schooling share according to official and household data
Despite data deficiencies, it is clear that there is a substantial fee-charging private schoolingsector in India.14 Table 8 shows the enrolment share of private schools in rural and urbanIndia, according to both official school returns data from 1993 and 2002 and householdsurvey data from 1993 and 2006. The bottom half of the table shows corresponding figuresfor Uttar Pradesh, India’s largest state, with high levels of private school participation. Thelatest official data on enrolment by school type are for 2002 from the Seventh All IndiaEducation Survey, though only the national figures are available.15
Table 8 shows that the true size of the private sector in India is more than three timesthat shown in official statistics. According to official statistics for 1993, only 2.8 per cent ofall rural primary school students were attending private schools, but according to householdsurvey data for the same year, 10.1 per cent were.16 In rural Uttar Pradesh the correspondingfigures were 8.8 and 30.7 per cent—again, the survey estimate being more than three times
12 We do not include the so-called ‘private aided’ schools in the category of private schools. Aided schools are runby private management but funded largely by government grants-in-aid and are very similar to government schoolsin many respects. They charge the same fee levels as government schools (now mandated to be nil) and, followingcentralizing legislation in the early 1970s, their teachers are paid directly from the state government treasury at thestate teacher salary rates. Schools run by private management without state aid are ‘private unaided’. These runentirely on fee revenues and have virtually no state involvement. Unaided schools are, thus, the genuinely privateschools and henceforth we refer to these simply as ‘private’ and refer to private aided schools simply as ‘aided’.
13 Indeed, some of the conditions are, or have over time become, mutually inconsistent. For instance, the conditionto charge only government-school tuition-fee rates is now incompatible with the condition to pay the government-prescribed salary rates to teachers, since government school fee rates have been cut consistently since the 1960s andwere abolished altogether in the early 1990s in all elementary schools, and since government-prescribed minimumsalaries to teachers have risen inexorably over time: Kingdon and Muzammil (2003, ch. 13) estimate that averageteacher salary rates rose by a remarkably high rate of 5 per cent per annum in real terms in the 22-year periodbetween 1974 and 1996.
14 See Kingdon (1996a) for an early challenge to the notion, based on official published data, that the size of theprivate sector in primary education was ‘infinitesimally small’ or ‘negligibly small’.
15 Only national figures are available in spring 2007. The latest figures for the year 2004/5 from the DistrictInformation System for Education (DISE) are not shown because of its incomplete coverage. Similarly, findingsfrom the ASER household survey are not shown as it does not distinguish between aided and unaided schools, andmerges them together into a single ‘private’ category.
16 The two sources are not exactly comparable since it is possible that some school-going 6–10-year-olds mayattend pre-primary or upper primary classes. However, it is unlikely that many 6–10-year-olds would be in upperprimary classes. Overall, 9.8 per cent of all 6–14-year-old rural Indian school-goers went to private schools (Shariff,1999).
184 Geeta Gandhi Kingdon
Table 8: Enrolment share of private schools, 1993–2006
Officialpublished
data
Householdsurvey data
Officialpublished
data
Householdsurvey data
Area School level 1993 1993 2002 2006
All IndiaRural Primary 2.8 10.1 5.8 19.5
Junior/middle 6.5 7.9 11.1 20.4Secondary 6.8 10.1 14.3 22.8
Urban Primary 25.7 26.2a 28.9 NAJunior/middle 18.8 15.4a 39.1 NASecondary 11.5 11.2a 32.4 NA
Uttar PradeshRural Primary 8.8 30.7 NA 30.5
Junior/middle 28.3 23.3 NA 35.0Secondary 10.9 14.4 NA 37.8
Urban Primary 53.3 49.7a NA NAJunior/middle 29.6 25.1a NA NASecondary 5.3 11.3a NA NA
Note: In the ASER data, children aged 7–10, 11–14, and 15–16 are assumed to be in primary, middle, andsecondary school, respectively. 18.6 per cent of all children aged 7–10 were in private school and 4.6 percent were not in school, thus private school share of total school enrolment is taken to be (18.6/(100 − 4.6)x 100 = 19.5 per cent) and similar calculations were performed for middle- and secondary-school ages.Sources: 1993 official data computed from the Sixth All India Education Survey (NCERT, 1998); 2002official data computed from the Seventh All India Education Survey, http://gov.ua.nic.in/NScheduleData/main3.aspx. The state-wise figures have not been posted as of spring 2007. Rural household surveyfigures for 1993 are based on the author’s calculations from the 1993/4 NCAER survey. aThe urbanhousehold survey figures are taken from 1995/6 National Sample Survey. Household survey figures for2006 for rural India are taken from ASER 2006 (Pratham, 2007).
the official estimate. Table 8 also shows that the official enrolment share of private schoolsat primary level rose from 2.8 per cent in 1993 to 5.8 per cent in 2002. If the extent ofunder-estimation in 2002 was the same as in 1993, then the true private school share of totalprimary enrolments in rural India in 2002 must have been three times as high as 5.8 per cent,i.e. 17.4 per cent. This is close to the only recent national estimate available for 2006, asseen in the last column of Table 8: according to the ASER 2006 national household survey(Pratham, 2007, p. 32), 18.6 per cent of all and 19.5 per cent of school-going rural primaryage children (7–10 year olds) attended private schools.17 In urban India, recognized privateschools’ share of total enrolment in 2002 was between about 30 and 40 per cent at differentlevels of education.
The reasons for the large discrepancy between household survey estimates and officialestimates of the size of the private schooling sector in India are twofold (Kingdon, 1996a;Dreze and Kingdon, 1998). First, teachers in government and aided schools have incentivesto over-report their enrolments when there is low demand for their services (since aschool with falling rolls would lose teachers), and this reduces the apparent enrolment
17 Although ASER merged aided and unaided private schools into a single category ‘private’, at the primary levelof education, there are very few aided schools so that the ‘private’ enrolment rates in ASER can be taken to meanmostly private unaided school enrolments.
The progress of school education in India 185
share of private schools. Second, all official school ‘censuses’ are carried out only inthe government-recognized schools and a high proportion of private primary schools areunrecognized.18
The true size of the private schooling sector is greatly underestimated in official data dueto enumerating only the recognized schools. Household survey data give a picture far closerto the truth than official statistics, since parents have no incentives to over-report enrolmentin publicly funded schools or to report enrolment in recognized schools only. Householdsurvey data in Table 8 suggest the extent to which the enrolment share of private schools inprimary education is underestimated in official data—i.e. under-estimation by about 67 percent in rural areas. Muralidharan and Kremer (2006) find that in their national survey of 20states, 51 per cent of all private rural primary schools were unrecognized. This accords withevidence from individual states in other studies. These find that between 41 and 86 per centof all primary private schools were unrecognized in different parts of India.19
Private schooling is used even among the poor in India. Findings from the national MIMAPsurvey, reported in Pradhan and Subramaniam (2000), show that, of all enrolled childrenaged 5–10 living below the poverty line, 14.8 per cent attended private schools (8 per centin rural and 36 per cent in urban India). The corresponding figures for ages 11–14 (juniorschool age) and 15–17 (secondary school age) were 13.8 and 7 per cent, respectively. Thatprivate schools are used by poor families is also found in five north Indian states (ProbeTeam, 1999) and by Tooley and Dixon (2005) in Delhi.
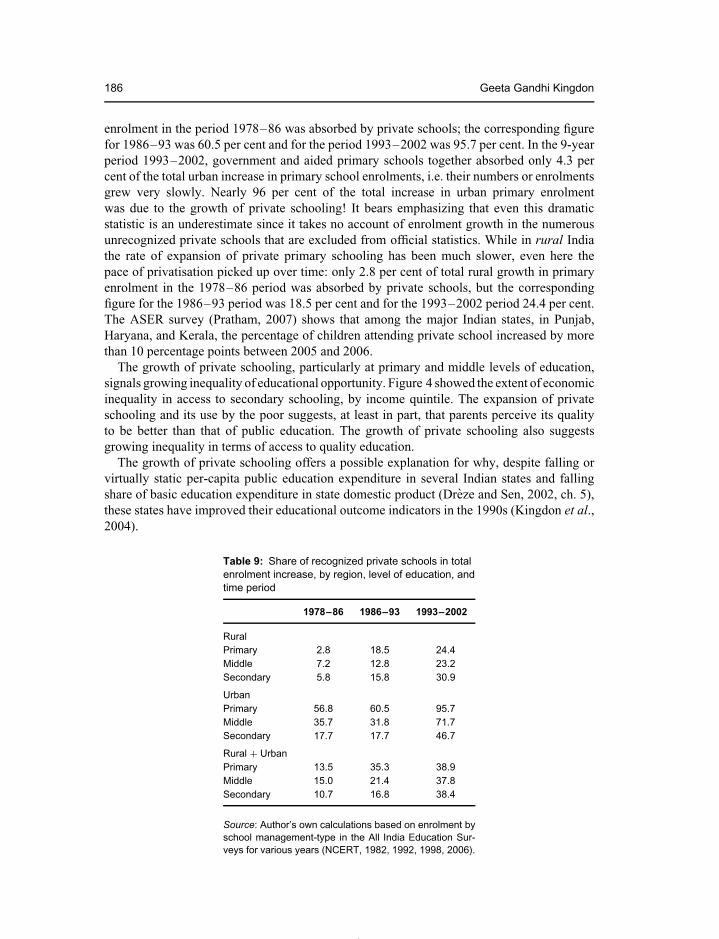
(ii) Growth in private schooling
The most telling statistic, however, is not the share of private schooling in the stock oftotal school enrolment but, rather, its share in the total recent increase in school enrolment.This shows the growth of private schooling in India, relative to the growth of governmentand aided schooling. Table 9 presents the proportion of the total enrolment increase (overtime) that is absorbed by private schools. It is constructed from underlying numbers that arepresented in Kingdon (2007). Even though official statistics exclude unrecognized schools,even recognized private school growth numbers are telling. We learn two things from Table 9:first, that growth of private schooling has dramatically accelerated over time, particularly inurban areas; second, that in urban areas, the growth of private schooling has consistentlybeen the greatest at the primary level and progressively smaller at the middle and secondaryschool levels, something perverse from the equity point of view, since children of the poorare most well represented at the primary schooling level.
Table 9 shows that the recent growth of private primary schooling in urban India has beennothing short of massive and that the pace of privatization has accelerated over time in bothurban and rural India. In urban India, 56.8 per cent of all the increase in total primary school
18 It seems that rural private schools, in particular, do not easily obtain government recognition, for which manyconditions need to be shown to be satisfied. As Kingdon (1996a) says, given the exacting conditions for and scantrewards of recognition, it is not surprising that most private primary schools remain unrecognized.
19 Aggarwal (2000) found that in his four surveyed districts of Haryana in 1999, there were 2,120 private primaryschools, of which 41 per cent were unrecognized. The Probe survey of 1996 in five north-Indian states did a completecensus of all schools in 188 sample villages. It found 41 private schools, of which 63 per cent were unrecognized.Mehta (2005) found that in seven districts of Punjab, there were 3,058 private elementary (primary plus junior)schools, of which 86 per cent were unrecognized. For more detailed evidence on this based on various data sources,see Kingdon (2006).
186 Geeta Gandhi Kingdon
enrolment in the period 1978–86 was absorbed by private schools; the corresponding figurefor 1986–93 was 60.5 per cent and for the period 1993–2002 was 95.7 per cent. In the 9-yearperiod 1993–2002, government and aided primary schools together absorbed only 4.3 percent of the total urban increase in primary school enrolments, i.e. their numbers or enrolmentsgrew very slowly. Nearly 96 per cent of the total increase in urban primary enrolmentwas due to the growth of private schooling! It bears emphasizing that even this dramaticstatistic is an underestimate since it takes no account of enrolment growth in the numerousunrecognized private schools that are excluded from official statistics. While in rural Indiathe rate of expansion of private primary schooling has been much slower, even here thepace of privatisation picked up over time: only 2.8 per cent of total rural growth in primaryenrolment in the 1978–86 period was absorbed by private schools, but the correspondingfigure for the 1986–93 period was 18.5 per cent and for the 1993–2002 period 24.4 per cent.The ASER survey (Pratham, 2007) shows that among the major Indian states, in Punjab,Haryana, and Kerala, the percentage of children attending private school increased by morethan 10 percentage points between 2005 and 2006.
The growth of private schooling, particularly at primary and middle levels of education,signals growing inequality of educational opportunity. Figure 4 showed the extent of economicinequality in access to secondary schooling, by income quintile. The expansion of privateschooling and its use by the poor suggests, at least in part, that parents perceive its qualityto be better than that of public education. The growth of private schooling also suggestsgrowing inequality in terms of access to quality education.
The growth of private schooling offers a possible explanation for why, despite falling orvirtually static per-capita public education expenditure in several Indian states and fallingshare of basic education expenditure in state domestic product (Dreze and Sen, 2002, ch. 5),these states have improved their educational outcome indicators in the 1990s (Kingdon et al.,2004).
Table 9: Share of recognized private schools in totalenrolment increase, by region, level of education, andtime period
1978–86 1986–93 1993–2002
RuralPrimary 2.8 18.5 24.4Middle 7.2 12.8 23.2Secondary 5.8 15.8 30.9
UrbanPrimary 56.8 60.5 95.7Middle 35.7 31.8 71.7Secondary 17.7 17.7 46.7
Rural + UrbanPrimary 13.5 35.3 38.9Middle 15.0 21.4 37.8Secondary 10.7 16.8 38.4
Source: Author’s own calculations based on enrolment byschool management-type in the All India Education Sur-veys for various years (NCERT, 1982, 1992, 1998, 2006).

The progress of school education in India 187
(iii) Relative effectiveness of private and public schools
Why has private schooling been growing rapidly in recent times? Muralidharan and Kremer(2006) present an OLS regression of the presence of a private school in a village. Controllingfor village population, village per-capita income, pupil–teacher ratio in public schools in thevillage, and state fixed effects, they find that private schools are significantly more likelyto exist in villages with a high mean level of teacher absence in the public schools. Theirfinding that private schools are disproportionately located in areas with poorly performingpublic schools supports the qualitative reflections of the Probe Report which asserts that,in explaining the increased popularity of private education, the breakdown of governmentschools is often more decisive than parental ability to pay.
National data on learning achievement levels in ASER 2005 (Pratham, 2006) found thatprivate school students of grades 2–5 were 37.4 per cent more likely than government schoolstudents to be able to read a text of grade 2 standard. They were also 50 per cent more likelyto be able to solve a division problem (three digits divided by one digit). Of course, these areraw figures and private school students typically come from more privileged homes. There isa small literature examining the relative effectiveness of private and public schooling aftercontrolling for the differing student intakes of private and government schools. Studies of therelative effectiveness of public and private schools in India have had to rely on achievementtests carried out by the researchers themselves, typically in small samples of schools (Govindaand Varghese, 1993; Bashir, 1994; Kingdon, 1994, 1996b; Tooley and Dixon, 2003). Thesestudies have been carried out in different parts of India (Tamil Nadu, Madhya Pradesh, UttarPradesh, and Andhra Pradesh) and differ in several respects,20 but they share the commonconclusion that private-school students generally outperform their public-school counterpartsin learning achievement, even after controlling for schools’ student intakes.
Muralidharan and Kremer (2006) corroborate the findings of earlier studies but withnationally representative data on rural primary schools. In their study, private-school students’achievement was 0.41 standard deviations higher than that of government-school studentsin the same village (i.e. using a village fixed-effects achievement production function), aftercontrolling for observed school characteristics and pupils’ home background. While mostof these studies did not test the possibility that the private-school ‘effect’ may be driven byunobserved heterogeneity, i.e. more-able or more-motivated students systematically selectinginto private schools, Kingdon (1996b) corrected for sample selectivity bias which greatlyreduced, but did not eliminate, the private-school advantage over government and aidedschools in the teaching of numeracy skills.
(iv) Relative costs of private and public schools
Apart from being more effective according to the cited studies, private schools also havemuch lower unit costs than publicly funded (i.e. government and aided) schools. This is
20 While Kingdon’s study is based on students in the final year of upper primary education (grade 8), the otherstudies are based on students in the final year of lower primary schooling (grades 4 or 5). The methods used differed,too. Bashir used hierarchical linear modelling, Govinda and Varghese used OLS regression, and Kingdon usedsample selectivity correction models. The extent of controls for home background differed across the studies, too,as well as whether school and teacher characteristics were included in the achievement equations. Finally, the costsof private and public schooling were calculated differently in the different studies.
188 Geeta Gandhi Kingdon
due largely to teacher salaries in private schools being only a fraction of those in publiclyfunded schools. Findings from five different states summarized in Kingdon (2006) show thatin the early to mid-1990s, private-school teachers’ monthly pay was about 40–50 per centof government teachers’ pay, but that, by 2002, this ratio had fallen to only about 20 percent. Muralidharan and Kremer (2006), based on their 2003 national survey of rural schoolsin 20 Indian states, conclude: ‘even conservatively, rural private school teacher salaries aretypically around one fifth that of regular government teacher salaries and they are often aslow as one tenth the salaries of regular government teachers’. Such massive private–publicsegmentation in the teacher labour market can exist because of excess supply of educatedindividuals and because, while the private sector pays market wages, government and aidedschool salaries are bureaucratically set minimum wages. Clearly there are huge economicrents in the salaries of government school teachers. Kingdon and Muzammil (2003, ch. 13)estimate that the impact of the Government of India’s ‘Fifth Pay Commission’ in UttarPradesh in the late 1990s was to hike, overnight, a high school principal’s monthly payby 43 per cent and assistant teachers’ pay by between 26 and 55 per cent, depending onteacher category. The authors show the central role of teacher unions in securing these salaryincreases.21
V. Government and NGO education initiatives
While the data presented above on student learning levels, teacher absenteeism, and schoolfacilities paint a somewhat grim picture of the state of schooling quality in India, there areseveral reasons for more optimism about the progress of school education in the future. First, anumber of recent fiscally demanding public initiatives suggest that India has begun in earnestto give greater priority to improving school education. Second, a number of educationalNGOs have emerged—such as Pratham, Digantar, Azim Premji, the MV Foundation, andothers—and some have acquired substantial stature both in terms of their contributions toeducational improvements in a number of dimensions, as well as in terms of their influence,advocacy voice, public/media profile, research capacity, and ability to mobilize funds foreducation, both from individual donors in India and abroad and from the Indian corporatesector. Below we consider some of the important initiatives and their impact on educationaloutcomes.
(i) Sarva Shiksha Abhiyan
The Sarva Shiksha Abhiyan (SSA)—literally ‘Campaign for Universal Education’—isIndia’s flagship programme to universalize elementary education (grades 1–8) by the year2010. It is a scheme sponsored by the central government and funded out of revenues froma new cess, equal to 2 per cent of all taxes, introduced in 2004 (increased to 3 per centin March 2007). SSA provides additional funding to states to enrol out-of-school childrenand to improve school quality. It funds civil works, salaries of additional teachers to reducethe pupil–teacher ratio to 40:1, establishment of alternative schools and education guarantee
21 See the section entitled ‘Fifth Pay Commission related strikes (1997–2001)’ in ch. 10 and also see ch. 13, ofKingdon and Muzammil (2003). The pay increase came into effect retrospectively from 1 January 1996.

The progress of school education in India 189
scheme (EGS) schools in small habitations, establishment of block and cluster level resourcecentres, establishment of ‘bridge courses’ for drop-outs, in-service training for teachers,and grants for teaching materials. As well as these supply-side interventions, SSA includesdemand-side measures to close caste and gender gaps in education. These include freetextbooks to all female and low-caste students, special facilities for girls, and grants todistricts to support students with disabilities. SSA also funds a national component coveringcapacity building, technical support, financial management, monitoring and evaluation, etc.
To this author’s knowledge, there is no rigorous evaluation of the impact of this massiveintervention or its individual components so far. Two recent impact evaluations of the DistrictPrimary Education Project (DPEP)—the predecessor to SSA and quite similar to it—areby Schmid (2006) who uses a treatment intensity approach, and Jalan and Glinskaya (1999)who use a propensity score matching approach. The treatment intensity of a certain agegroup in a specific district depended on the years DPEP was in place and on the number ofyears that the group was at school-going age during this time period. While both studies findsubstantial programme impacts and find that impacts were greater for low-caste children,Schmid finds that effects were stronger for girls, but Jalan and Glinskaya find they werenegligible, although the latter evaluated the impact of only the first phase of the DPEP, whileSchmid evaluated the impact of all three phases.
(ii) Mid-day meal scheme
In late 2001, the Indian Supreme Court directed all states ‘to implement the Mid-Day Meal[MDM] Scheme by providing every child in every government and government assistedprimary school with a prepared mid-day meal with a minimum content of 300 calories and8–12 grams of protein each day of school for a minimum of 200 days’. By 2006, the MDMscheme was near universal in all states, following public mobilization efforts to encouragestates to act. This is a centrally funded scheme in that the central government provides grains,funds transportation, and also pays food preparation costs, though the state government isresponsible for providing the physical infrastructure for cooking the meals. Though it is notyet free of problems of quality and corruption, ‘the fact that mid-day meals have become apart of the daily routine in most primary schools across the country is a major achievement’(Khera, 2006). The scheme provides lunch to about 120m children every school day and, assuch, is the largest school meal scheme in the world. Certain states have gone beyond themandated scope of the scheme—for instance, in Kerala and Tamil Nadu, the destitute andthe aged are allowed to take the MDM and in Gujarat the scheme covers children from grades1–7 rather than only in the primary grades (1–5).
Although there are no rigorous evaluations (such as randomized experiment studies) of theimpact of this scheme on children’s school enrolment and attendance and on nutritional andhealth status, several micro studies suggest major increases in enrolment immediately afterthe introduction of MDMs, e.g. 23 per cent in Barmer district of Rajasthan, 36 per cent inMadhya Pradesh, and other large increases in Karnataka. However, Deaton and Dreze (2006)note that the consumption of MDMs in primary schools appears to be heavily under-recordedin the National Sample Survey (NSS) data, making it hard to verify the impact of MDMs onschool attendance from NSS surveys.
190 Geeta Gandhi Kingdon
(iii) Para-teacher schemes
From the mid-1990s, several states began using low-cost untrained teachers known variouslyas shiksha karmis, shiksha mitras, vidya volunteers, etc. By 2002, about 220,000 such ‘para-teachers’ had been appointed, and by 2004 their number had risen to about 500,000 (Govindaand Josephine, 2004). The schemes have been expanding rapidly since 2002 because, fromthat year, states could appoint contract teachers with central government grants. Under theseschemes, persons with educational qualification requirements below those of governmentprimary school regular teachers are employed on salaries that are one-fifth to one-half ofgovernment teacher salaries, in order (i) to expand schooling in a low-cost way to smallhamlets which are unserved by regular government schools, (ii) to increase the number ofinstructors in single-teacher schools, and (iii) to reduce high pupil–teacher ratios. Althoughthe model varies from state to state, the para-teacher jobs are typically tenable for 10 monthsper year, but are annually renewable.
Para-teacher schemes have raised a number of concerns about the ethical, legal, andpolitical difficulties of sustaining two different standards of employment between regularteachers and contract teachers. Some authors have also raised concerns about the qualityof teaching provided by these less-qualified instructors. Others have pointed out that para-teachers may exhibit greater accountability owing to closer community involvement in theirrecruitment and dismissal and because of the impermanence of their job contracts. Dreze andSen (2002) believe that the contribution of these low-cost schemes so far is uncertain and thatit is premature either to applaud or dismiss them. We are not aware of any serious evaluationsof these schemes, though several micro studies find that learning achievements of childrentaught by para-teachers and regular teachers are no different (Leclercq, 2002; Pratichi Trust,2002; Govinda and Josephine, 2004).
(iv) Public–private partnerships in education
A substantial public–private partnership (PPP) system does operate in India, at least at thesecondary and higher levels of education. This is the system of government grant-in-aidto privately managed schools, known as ‘aided’ schools. In 1995/6 the percentage shareof aided schools in total schools was 34 and 44.3 per cent, respectively, at the secondaryand higher secondary levels, though at the primary and middle levels, it was only 3.4 and10.1 per cent, respectively (Bashir, 2005). However, over time, largely due to successivegovernments conceding teacher union demands, aided schools have become more and morelike government schools: their teachers are now paid directly by the state government treasuryat the same uniform salary rates as for government school teachers, and are recruited bya government-appointed selection committee rather than by the school. Aided schools alsohave the same fee policy as in government schools. Learning achievements in aided schoolsare often close to those in government schools and significantly lower than in private schools.
The current draft ‘Right to Education’ Bill under consideration in India proposes toestablish a new form of PPP in education, requiring all private schools to give 25 per cent oftheir places to government-funded students from disadvantaged homes. This measure doesnot propose to give money to the disadvantaged students to attend a school of their choice,but rather proposes to give money directly to the private schools that accept the students.In recent years, increased advocacy in favour of PPPs in education in various countrieshas been associated with introduction of school choice by parents, typically by means of
The progress of school education in India 191
school vouchers. The recommendations for decentralizing reform in India, including thecurrent draft ‘Right to Education’ Bill, have not included consideration of the possibility ofproviding school vouchers as a way of improving the accountability of schools and teacherstowards students and parents. This is unlike the situation in Chile, Colombia, New Zealand,the USA, the UK, and some other countries, where there has been vigorous debate aboutand experimentation with alternatives to public schools, such as school choice and otherforms of PPPs. There are several potential explanations for this difference and also someconcerns about school voucher schemes, such as their potentially adverse equity effects(Kingdon, 2006). Vouchers would be a radical reform of teacher and school incentives, andone reason why they have not been debated in India could be because of their perceivedpolitical infeasibility as they would be powerfully resisted by vested-interest groups.
(v) NGO education work
Widespread education-related work by a large number of NGOs in India is a relatively newphenomenon, but one which has grown rapidly. Their important contribution has been notonly in grassroots educational work, but also in terms of successful advocacy for education atthe macro level by contributing to national educational debates and helping to make educationaccess and quality prominent public issues. For instance, the role of the NGO Right to FoodCampaign at both the micro and macro levels was critical in mobilizing public opinionand building pressure for the rapid implementation of the school MDM scheme in Indianstates. Similarly, Pratham—whose aim is to have ‘Every child in school. . . and learningwell’ did pioneering work in testing the learning achievements of elementary-school-agechildren in 509 Indian districts in 2005 and rapidly producing a public report in February2006. This brought the whole issue of low learning levels and low schooling quality to thefore in public and media discussion in India and also encouraged greater openness in thegovernment’s own educational research institutions. Finally, field experiments in educationare typically more readily facilitated by educational NGOs on a small scale rather than bygovernments and, as such, provide valuable opportunities to test the cost-effectiveness ofparticular educational interventions. They can thus inform education policy as to what typesof educational innovations give the greatest impacts at the lowest costs (Duflo, 2006). NGOs’other education activities are far too numerous to summarize, but include delivering bridgecourses that prepare drop-out children to re-join school; arranging for street children to settlewith foster parents and attend schools; organizing learning camps for girls and for workingchildren; and many other educational innovations.
Some of the latter have received prominent attention in recent times. For instance, Prathamruns a large scale ‘Bal Sakhi’ programme, which provides an assistant teacher for remedialteaching of weak children in government schools. A randomized evaluation of this schemein Gujarat and Mumbai by MIT’s Poverty Action Lab (Banerjee et al., 2005) showed that itdramatically increased learning by focusing on improving basic literacy and numeracy skills,and that it was very cost-effective. Another NGO, Seva Mandir, runs primary single-teacher,non-formal education centres in tribal villages in Rajasthan and faces the problem of highteacher absenteeism. Seva Mandir tried to incentivize teachers by introducing an attendance-contingent bonus which was a function of the number of days the teacher was present inschool. It selected 120 schools to participate in an experiment where teachers in 60 of theschools were given a camera with a tamper-proof date and time function and were instructedto take pictures of themselves with their students every day at school opening and closing

192 Geeta Gandhi Kingdon
time, to provide proof of presence. Duflo and Hanna (2005) found that the interventionresulted in an immediate and long-lasting improvement in teacher attendance: the absencerate was cut from 42 to 22 per cent. Owing to fewer absences, treatment schools taught theequivalent of 88 child-days more per month than comparator schools, resulting in a 0.17standard deviation increase in test scores after 1 year. NGO education activity is increasing,assisted by corporate and donor funding.
VI. Conclusions
This paper has sought to build a picture of school education in India. Section II placed India’seducational achievements in international perspective, noting that while it does relativelybetter than its South-Asian neighbours, Pakistan and Bangladesh, in certain educationalindicators, it lags seriously behind the other countries with which it is increasingly compared,such as BRIC economies in general and China in particular, especially in terms of secondary-school participation and youth literacy rates.
Section III examined schooling access and quality, finding that there are several positivesides to India’s educational development. Its primary school enrolment has come close tobeing universal and literacy rates have risen encouragingly in recent times. However, Indianachievements in other respects leave much to be desired. First, primary school attendance ratesare very low in the populous northern states of Bihar and Uttar Pradesh. Second, secondaryschool participation is still low and unequally distributed. Since economic incentives foracquiring secondary schooling are high, demand for secondary schooling is likely to bestrong, suggesting that greater participation is hindered by a combination of constrainedsupply of secondary schools, household credit-constraints, and conservatism about genderroles. Third, learning achievements in both primary and secondary schooling are very low,signalling poor-quality schooling. Last, and relatedly, school facilities/inputs are low andteacher absenteeism is high.
Section IV examined the role of the private schooling sector in India. The size of this sectoris greatly under-estimated in official published statistics, particularly at the primary level,owing to excluding ‘unrecognized’ schools, given that more than 50 per cent of all privateprimary schools are unrecognized. Even if we ignore the numerous unrecognized schools andlook instead at recognized schools only, it is clear that the private schooling sector is growingextremely rapidly in urban areas and more slowly in rural areas. Household data offer a truerpicture, and they show that private schooling has grown rapidly over time. It is clear thatprivate schooling is used by poor families, too. The literature on the relative effectivenessof private and public schools in India suggests that, controlling for student background,private schools are more effective in imparting learning and do so at a fraction of the unitcost of government schools. The major reason for private schools’ massive cost advantageover public schools is that they can pay market wages while government school teachers’bureaucratically set salaries have large rents in them which teacher unions have fought hardto secure. The spread of fee-charging private schooling represents growing inequality ofopportunity in education. Also, the pattern of growth of private schooling in urban areas(fastest at the primary level, slower at the middle and secondary levels) gives cause for equityconcerns, since the children of the poor are best represented at the primary level of educationand progressively less well represented at further levels.

The progress of school education in India 193
Lastly, section V looked at some public education initiatives. The Sarva Shiksha Abhiyan,MDM scheme, and the para-teacher scheme were each discussed briefly. Unfortunately, theimpacts of these massive interventions (or of their sub-components) on children’s schoolattendance and learning outcomes have not been rigorously evaluated. This is necessary ifdecision-makers are to hone future education policy-making in the light of knowledge aboutthe cost-effectiveness of alternative interventions. Moreover, radical measures to improveteacher and school incentives have not been considered in India, perhaps because they standto upset powerful vested interests. While the existence of fiscally demanding educationinitiatives and the introduction of the 3 per cent education cess to fund them testifies tothe Indian government’s increased commitment to school education and gives grounds foroptimism about the future, serious challenges remain.
The evidence available for India is mostly of a descriptive nature and rigorous analyses ofeducational issues are sparse. Though increasing very recently with the onset of randomizedevaluations, few studies so far have used methods that permit causal inferences. Although dataare becoming more readily available (Mehta, 2005), many expensively collected educationdata sets are not shared with researchers and there are inordinate delays in the compilationand release of official education data.
What should be the research and policy agendas for the future? The two are clearly relatedif policy-making is to be evidence based. A policy research agenda for the future can usefullyinclude systematic and methodologically sound analyses of the following.
(i) The impact, on children’s educational outcomes, of a variety of incentive-basededucational interventions for teachers and schools, such as the impact of performance-related pay and of performance-related tenure-conferment for teachers, the impactof public–private partnerships of different kinds, such as supply-side (per-studentaid) and demand-side (voucher) funded schools. The lack of good incentives forschools and teachers are issues that need to be addressed head-on by scholars andpolicy-makers.
(ii) Trends in inequality in access to and quality of education. Given the rapid spread ofprivate schooling, it is expected that economic inequality in education has risen overtime and education policy-makers need to be aware of the extent of this phenomenon.
(iii) The influence of political-economy factors in shaping public education policies andprocesses, so that attempts might be made to bring more rationality into educationaldecision-making.
(iv) Identifying the barriers to children’s learning. For example, is learning low because oflack of physical inputs (teacher absence, lack of learning materials), poor processes(lack of school timetable, lack of homework setting/marking policy), or teacherincompetence to deliver the curriculum, or a combination of these, and, if the last,which factors contribute the most?
(v) Evaluating the relative costs and relative impact, on educational outcomes, of thenumerous existing public education interventions under Sarva Shiksha Abhiyan, sincethere is little point in having initiatives to improve quantity or quality of education ifthere is no knowledge of their likely impacts and costs.

194 Geeta Gandhi Kingdon
References
Aggarwal, Y. (2000), Public and Private Partnership in Primary Education in India: A Study of UnregisteredSchools in Haryana, New Delhi, National Institute of Educational Planning and Administration.
Banerjee, A., Cole, S., Duflo, E., and Linden, L. (2005), ‘Remedying Education: Evidence from TwoRandomized Experiments in India’, NBER Working Paper No. 11904.
Barro, R. J., and Lee, J.-W. (2004), ‘International Data on Educational Attainment: Updates and Implications’,CID Working Paper No. 42, Harvard University.
Bashir, S. (1994), ‘Public versus Private in Primary Education: Comparisons of School Effectiveness andCosts in Tamil Nadu’, unpublished Ph.D. thesis, London School of Economics.
Card, D. (2001), ‘Estimating the Return to Schooling: Progress on Some Persistent Econometric Problems’,Econometrica, 69(5), 1127–60.
Deaton, A., and Dreze, J. (2006), ‘Tracking Mid-day Meals in Indian Schools’, draft notes, March, cited inKhera (2006).
Dreze, J., and Kingdon, G. G. (1998), ‘Biases in Education Statistics’, The Hindu, 6 March.— — (2001), ‘Schooling Participation in Rural India’, Review of Development Economics, 5(1), 1–24.— Sen, A. (2002), India: Development and Participation, Oxford and Delhi, Clarendon Press.Duflo, E. (2006), ‘Field Experiments in Development Economics’, Massachusetts Institute of Technology,
mimeo.— Hanna, R. (2005), ‘Improving Teacher Attendance in Rural India’, Massachusetts Institute of Technology,
Poverty Action Laboratory, mimeo.Duraisamy, P. (2002), ‘Changes in Returns to Education in India, 1983–94: By Gender, Age-cohort and
Location’, Economics of Education Review, 21, 609–22.Govinda, R. (2002), India Education Report: A Profile of Basic Education, New Delhi, Oxford University
Press.— Josephine, Y. (2004), ‘Para Teachers in India: A Review’, UNESCO draft report.— Varghese, N. V. (1993), Quality of Primary Schooling in India: A Case Study of Madhya Pradesh,
Paris, International Institute for Educational Planning, and New Delhi, National Institute of EducationalPlanning and Administration (NIEPA).
Hanushek, E. (2003), ‘The Failure of Input-Based Schooling Policies’, The Economic Journal, 113(485),F1–120.
— (2005), ‘The Economics of School Quality’, German Economic Review, 6(3), 269–86.— Zhang, L. (2006), ‘Quality-consistent Estimates of International Returns to Skill’, NBER Working Paper
12664, available at http://www.nber.org/papers/w12664Jalan, J., and Glinskaya, E. (1999), ‘Improving Primary School Education in India: An Impact Assessment of
DPEP-Phase I’, unpublished paper.Khera, R. (2006), ‘Mid-day Meals in Primary Schools: Achievements and Challenges’, Economic and
Political Weekly, 18 November.Kingdon, G. G. (1994), ‘An Economic Evaluation of School Management-types in India: A Case Study of
Uttar Pradesh’, unpublished D.Phil. thesis, Oxford University, Economics Department.— (1996a), ‘Private Schooling in India: Size, Nature and Equity Effects’, Economic and Political Weekly,
31(51), 3306–14.— (1996b), ‘The Quality and Efficiency of Public and Private Schools: A Case Study of Urban India’,
Oxford Bulletin of Economics and Statistics, 58(1), 55–80.— (1998), ‘Does the Labour Market Explain Lower Female Schooling in India?’, Journal of Development
Studies, 35(1), 39–65.— (2005), ‘Where has all the Bias Gone? Detecting Gender Bias in the Intra-household Allocation of
Educational Expenditure in Rural India’, Economic Development and Cultural Change, 53(2), 409–52.— (2006), ‘Private and Public Schooling: The Indian Experience’, Working Paper PEPG-05-15, Program
on Education Policy and Governance, Harvard University. Forthcoming in R. Chakrabarti and P. Peterson(2007), School Choice International: The Latest Evidence, Cambridge, MA, Harvard University Press.
— (2007), ‘School Education in India: Progress and Challenges’, Working Paper GPRG-WPS-071,Department of Economics, University of Oxford.

The progress of school education in India 195
Kingdon, G. G., and Unni, J. (2001), ‘Education and Women’s Labour Market Outcomes in India’, EducationEconomics, 9(2), 173–95.
— Muzammil, M. (2003), The Political Economy of Education in India: Teacher Politics in Uttar Pradesh,Delhi, Oxford University Press.
— Cassen, R., McNay, K., and Visaria, L. (2004), ‘Education and Literacy’, in T. Dyson, R. Cassen,and L. Visaria (eds), Twenty-first Century India—Population, Economy, Human Development and theEnvironment, Oxford, Oxford University Press.
Kremer, M., Chaudhury, N., Rogers, F. H., Muralidharan, K., and Hammer, J. (2005), ‘Teacher Absence inIndia: A Snapshot’, Journal of the European Economic Association 3(2–3), 658–67.
Leclercq, F. (2002), ‘The Impact of Education Policy Reforms on the Education System: A Field Study ofEGS and Other Primary Schools in Madhya Pradesh’, Delhi, Centre de Sciences Humaines.
Mehta, A. (2005), ‘Elementary Education in Unrecognized Schools in India: A Study of Punjab Based onDISE 2005 Data’, New Delhi, NIEPA.
MHRD (2003), Selected Education Statistics, 2002–03, New Delhi, Ministry of Human ResourceDevelopment.
— (2007), ‘Study of Student Attendance’, document presented to the Sixth Review Mission of Sarva ShikshaAbhiyan, July.
Muralidharan, K., and Kremer, M. (2006), ‘Private and Public Schools in Rural India’, Harvard University,mimeo.
NCERT (various years), All India Education Survey [Fourth, Fifth and Sixth], New Delhi, National Councilof Educational Research and Training.
— (2006a), ‘Learning Achievement of Students at the End of Class V’, Department of EducationalMeasurement and Evaluation, National Council of Educational Research and Training, New Delhi,available at http://ssa.nic.in/qualityedu/summ exec.asp.
— (2006b), Seventh All India Education Survey: 2002–03, New Delhi, National Council of EducationalResearch and Training, available at http://gov.ua.nic.in/NScheduleData/main3.aspx.
NSS (2006), ‘Status of Education and Vocational Training in India: 2004–05’, Report No. 517, New Delhi,National Sample Survey Organisation.
Pratham (2006), ‘ASER 2005—Annual Status of Education Report’, New Delhi, Pratham, February.— (2007), ‘ASER 2006—Annual Status of Education Report’, New Delhi, Pratham, January.Pratichi Trust (2002), The Delivery of Primary Education: A Study in West Bengal, Pratichi (India) Trust.Probe Team (1999), Public Report on Basic Education in India, New Delhi, Oxford University Press.Riboud, M., Savchenko, Y., and Tan, H. (2006), ‘The Knowledge Economy and Education and Training in
South Asia: A Mapping Exercise of Available Survey Data’, World Bank, mimeo.Schmid, J. P. (2006), ‘Was the District Primary Education Programme in India Effective?’, draft Ph.D. thesis
chapter, Zurich, Nadel ETH (Department for Humanities and Social Sciences, Swiss Federal Institute ofTechnology).
Shariff, A. (1999), India Human Development Report, Delhi, Oxford University Press.Tooley, J., and Dixon, P. (2003), ‘Private Schools for the Poor: A Case Study from India’, report written for
CfBT Research and Development, Reading.— — (2005), ‘Private Schools Serving the Poor: A Study from Delhi, India’, E.G. West Centre, University
of Newcastle upon Tyne, E.G. West Centre.Unni, J. (2007), ‘Earnings and Education among Social Groups’, in A. Shariff (ed.), State, Markets and
Inequalities: Human Development in Rural India, New Delhi, Orient Longman.Vasudeva-Dutta, P. (2006), ‘Returns to Education: New Evidence for India, 1983–1999’, Education
Economics, 14(4), 431–51.World Bank (2006), ‘Secondary Education in India: Investing in the Future’, Human Development Unit,
South Asia Region, World Bank, draft.


![Abundance of Small Carnivores in Nyika National Park, Malawi › radar › file › 24e0df8e-43... · IUCN (2019). Available from , [Accessed 21/3/2019]; Kingdon, J. (2015) The Kingdon](https://static.fdocuments.us/doc/165x107/5f0b8e317e708231d4311806/abundance-of-small-carnivores-in-nyika-national-park-malawi-a-radar-a-file.jpg)