The production of baltic cod larvae for restocking in the ... · DTU Aqua, Institut for Akvatiske...
84
The production of Baltic cod larvae for restocking in the eastern Baltic. RESTOCK 1. 2005-2007 J.G. Støttrup, J.L. Overton, S.R. Sørensen (Eds.) DTU Aqua, Institut for Akvatiske Ressourcer 2008 Project financed by the Directorate for Food, Fisheries and Agri Business ISBN: 978-87-7481-076-6 DTU Aqua-rapport nr.: 189-08
Transcript of The production of baltic cod larvae for restocking in the ... · DTU Aqua, Institut for Akvatiske...

The production of Baltic cod larvae for restocking in the eastern Baltic.
RESTOCK 1. 2005-2007J.G. Støttrup, J.L. Overton, S.R. Sørensen (Eds.)
DTU Aqua, Institut for Akvatiske Ressourcer 2008
Project financed by the Directorate for Food, Fisheries and Agri Business
ISBN: 978-87-7481-076-6 DTU Aqua-rapport nr.: 189-08
2
Table of contents
Dansk resumé.......................................................................................................................................5 English Summary.................................................................................................................................7 Chapter 1 Introduction .........................................................................................................................9
1.1 Short summary of the scientific background for the rationale for restocking ...........................9 1.1.1 Oxygen demands...............................................................................................................10 1.1.2 Predation ...........................................................................................................................10 1.1.3 Changes in the spawning season.......................................................................................10 1.1.4 Food sources .....................................................................................................................11 1.1.5 Release scenarios ..............................................................................................................11 1.1.6 Extension of the spawning season ....................................................................................12
1.2 References................................................................................................................................12 Chapter 2 Bornholms Lakseklækkeri.................................................................................................14
2.1 Location ...................................................................................................................................14 2.2 Quarantine facilities .................................................................................................................14 2.3 Broodstock facilities ................................................................................................................17 2.4 Egg incubation facilities...........................................................................................................17 2.5 Larval production facilities ......................................................................................................19 2.6 Live feed facilities....................................................................................................................19
Chapter 3 The broodstock ..................................................................................................................20 3.1 Background ..............................................................................................................................20 3.2 Collection of broodstock..........................................................................................................20
3.2.1. Method and location of collection ...................................................................................20 3.2.2. Size selection of fish ........................................................................................................22 3.2.3 Genetic determination of origin of broodstock. ................................................................23
3.3 Marking, sexing, prophylactic treatment .................................................................................23 3.3.1 Tagging .............................................................................................................................23 3.3.2 Sex determination .............................................................................................................24 3.3.3 Prophylatic treatment ........................................................................................................25
3.4 Broodstock husbandry..................................................................................................................26 3.4.1 Stocking density................................................................................................................26 3.4.1 Illumination.......................................................................................................................26 3.4.2 Water quality.....................................................................................................................26 3.4.3 Feed...................................................................................................................................28
3.5 Manipulation of spawning season............................................................................................28 3.6 Survival ....................................................................................................................................29 3.7 Recommendations....................................................................................................................30 3.8 References................................................................................................................................31
Chapter 4 Egg production ..................................................................................................................33 4.1 Broodstock egg production/year/broodstock ...........................................................................33
4.1.1 Egg production 2006.........................................................................................................33 4.1.2 Egg production 2007.........................................................................................................34
4.2 Egg quality ...............................................................................................................................36 4.2.1 Egg size .............................................................................................................................37 4.2.2 Egg weight ........................................................................................................................37 4.2.3. Egg buoyancy over the spawning period .........................................................................38 4.2.4 Effect of egg quality on buoyancy ....................................................................................39
3
4.3 Incubation techniques ..............................................................................................................41 4.3.1 Collection, disinfecting and transporting of eggs .............................................................41 4.3.2 Temperature ......................................................................................................................42 4.3.3 Water flow.........................................................................................................................42 4.3.4 Air supply..........................................................................................................................42 4.3.5 Oxygen..............................................................................................................................42 4.3.6 Light ..................................................................................................................................42 4.3.7 Salinity ..............................................................................................................................42 4.3.8 Hygiene .............................................................................................................................43
4.4 Hatching rates, success ............................................................................................................43 4.5 References................................................................................................................................44
Chapter 5 Larval production ..............................................................................................................46 5.1 First feeding, WOO..................................................................................................................46 5.2 Larval rearing techniques, conditioning...................................................................................48 5.3 Factors effecting larval growth, survival .................................................................................49
5.3.1 Buoyancy and salinity preference .....................................................................................49 5.3.2. Growth, survival, salinity and photoperiod......................................................................53
5.4 Larval marking.........................................................................................................................55 5.5 Larval transport ........................................................................................................................59 5.6 References................................................................................................................................61
Chapter 6 Larval releases...................................................................................................................62 6.1 Release methods.......................................................................................................................62 6.2 Release strategy........................................................................................................................64
6.2.1 The release localities.........................................................................................................64 6.2.2 The releases in 2007: ........................................................................................................66
6.3 References................................................................................................................................68 Chapter 7. BVP program A. Monitoring of bacteria and viruses in broodstock and disinfection of eggs ....................................................................................................................................................69
7.1. Occurrence of bacteria and viruses in broodstock of Baltic cod.............................................69 7.1.1 Introduction.......................................................................................................................69 7.1.2 Materials and methods ......................................................................................................69 7.1.3 Results...............................................................................................................................70 7.1.4 Discussion .........................................................................................................................71
7.2 Disinfection of eggs – bactericidal effect ................................................................................72 7.2.1 Introduction.......................................................................................................................72 7.2.2 Materials and methods ......................................................................................................72 7.2.3 Results...............................................................................................................................73 7.2.4 Discussion and conclusion................................................................................................73
7.3 References................................................................................................................................75 Chapter 8. BVP program B. Monitoring of parasites in broodstock of Baltic cod............................77
8.1 Introduction..............................................................................................................................77 8.2 Materials and methods .............................................................................................................77 8.3 Results......................................................................................................................................78 8.4 Discussion ................................................................................................................................79 8.5 References................................................................................................................................79
Chapter 9 Dissemination of results ....................................................................................................80 9.1 National and international presentations (chronological order)...............................................80 9.2 Publications in international peer-reviewed papers .................................................................80

4
9.3 Popular scientific paper and articles ........................................................................................80 9.4 Thesis reports ...........................................................................................................................81
Reference: Støttrup, J.G., Overton, J.L., Sørensen, S.R. 2008. The production of Baltic cod larvae for restocking in the eastern Baltic. RESTOCK I. 2005-2007. DTU Aqua-Report no. 189-08. 81 pp.

5
Dansk resumé Instituttet for Akvatiske Ressourcer (tidligere DIFRES) har i samarbejde med den lokale danske fiskeindustri undersøgt potentialet for genetablering af bestanden af den østlige Østersøtorsk (Gadus morhua L.). Netop denne torskepopulation har tilvænnet sig stærke lagdelte forhold i Østersøen med et saltindhold der varierer fra 7 psu i overfladen til 17 psu i de dybe bassiner. En kombination af dårlige miljøforhold og højt fiskeritryk har resulteret i en stærk reduktion af bestanden, som nu er på sit historisk laveste niveau. Udover de hydrografiske forhold, sild og brislingers prædation på æg og larver samt en forsinket gydning på 2-3 måneder i forhold til for 20-30 år siden har bidraget til det yderligere fald i rekrutteringen. Ved anvendelse af den ansvarlige tilgang blev der gennemført en evaluering af økologien, tekniske muligheder og de økonomiske forhold der skal til for en vellykket genetablering. Resultaterne, som er publiceret i DFU rapporten nr. 143-05 viste, at den mest sandsynlige metode vil være at udsætte 474 millioner fiskelarver årligt over en periode på 5 måneder, med det formål at øge den gennemsnitlige bestand af 2-årige rekrutter med omkring 10% og samtidig bidrage til at forøge gydebestanden mod en langsigtet løsning. På baggrund af denne evaluering blev projektet (RESTOCK) etableret, med basis på Bornholm. De første to et halvt år af projektet blev finansieret af FIUF programmet (Direktoratet for FødevareErhverv). Projektet blev delt op i 8 arbejdspakker, der omfatter alle aspekter af produktionen af fiskelarver samt deres udsætning i Bornholm Bassin. Disse arbejdspakker omfatter; etablering af faciliteter, indsamling og hold af moderfisk, ægproduktion og inkubering, vurdering af ved hvilken alder fiskelarver kan sættes ud, udvikling af mærkemetoder, samt udvikling af transport og udsætningsmetoder. Hertil er en arbejdspakke dedikeret til fiskesundhed for at følge produktion af potentielle patogener og indføre profylaktiske procedurer for at minimere sygdomsrisiko. Moderfisk Voksne fisk blev fanget og tilvænnet anlægget på land. Fiskene blev undersøgt for bakterier, vira og parasitter for at evaluere sundhedstilstanden af de fangede vilde fisk. Et vigtigt fiskepatogen Vibrio anguillarum serotype O2a blev fundet i de vilde fisk. Denne bakterie kunne, under stressende forhold, blive et potentielt problem. De lave tætheder, som fiskene holdes under, giver dog fiskene optimale forhold. Forekomsten af denne bakterie gør det dog nødvendigt fortsat at monitere fiskenes sundhedstilstand. Ingen af de virale stammer, som der blev testet for, blev fundet i nogen af de 32 undersøgte torsk. Forskellige protozoiske og metazoiske parasitter blev fundet i de undersøgte fisk, blandt dem nogle der er patogene og smitsomme, hvilket igen understreger nødvendigheden for regelmæssig monitering af fiskenes sundhedstilstand. Forekomsten af Ichthyodinium, en parasit der er almindeligt forekommende i naturen og som smittes direkte fra moderfisk til afkom, blev nøje moniteret i løbet af 2007. Udbredelsen varierede blandt moderfiskbestande, men der var ingen sammenhæng mellem udbredelsen i æg og ægdødelighed. De voksne torsk blev holdt i tre separate moderfiskekar. Gydeperioden for en af disse bestande blev ændret således at det blev muligt at producere æg over en seks måneders periode fra april til september.
6
Æg og larveproduktion I 2007 blev der produceret 273 liter æg fra 210 kg fisk (han og hun fisk). Monitering af æginkuberingen viste at omkring 38% overlevede til klækning. 70% af de æg, der overlevede til klækning blev til levedygtige larver. Første fødeindtagelse blev initieret 5-7 dage efter klækning alt afhængig af temperaturen. Fiskelarverne vil kunne udsættes over et tidsrum af fire dage, uafhængig af temperaturen for det temperaturområde, der blev undersøgt. Tidsrummet svarer til det stadie, hvor larverne øger deres aktivitet især hos spisende larver. De producerede larver var tolerante over for pludselige temperaturændringer (op til tre grader C) til både koldere og varmere temperaturer, og var i stand til at indtage føde i løbet af 24 timer efter temperaturændringen. Højere forskelle i temperaturændringer resulterede i lavere initiering af fødeindtagelse, hvilket tyder på negativ påvirkning. Mærkning og udsætning Det var muligt at mærke larverne med alizarin complexone og at genkende mærket efter 50 dage. Mere arbejde er dog nødvendigt på både mærkning og mærkegenkendelse af udsatte fisk. I samarbejde med lokale fiskere blev der udviklet en udsætningsanordning, der kan håndteres fra en fiskekutter. Anordningen blev testet og en halv million larver blev udsat i 2007. Larver, der blev udsat ved 28 m dybde i en større netpose med føde tilstede blev genfanget 12 timer efter udsætningen og fundet med mad i maven, hvilket tyder på at fiskelarverne var i stand til at spise kort tid efter udsætning. Fremtidige perspektiver Programmet sigter mod en opskalering til 1% udsætning (50 millioner larver om året) og undersøge metoder til at forudsige overlevelsen eller til at genfange de udsatte fiskeyngel. I løbet af de næste tre år vil arbejdet fokusere på at løse disse problemer, samt undersøge hvordan modellen kunne opskaleres til en fuldskala udsætning på 500 millioner fiskelarver, samt vurdere hvilke konsekvenser aktiviteten kunne have på den fremtidige fiskeriforvaltning af torskebestanden i den østlige Østersø.
7
English Summary The National Institute of Aquatic Resources (former DIFRES) in cooperation with the local Danish fishing industry examined the potential for restocking the Eastern stock of Baltic cod (Gadus morhua L.). This particular cod population has adapted to live in the stratified estuarine conditions of the Baltic where salinity varies from 7 psu at the surface layers to 17 psu in the deep water basins. A combination of adverse environmental conditions and high fishing pressure has resulted in a severe decline of the eastern Baltic cod stock, which is now at its historically lowest level. In addition to the hydrographical conditions, predation of eggs and larvae by herring and sprat plus a delay in spawning of 2-3 months from 20-30 years ago, has exacerbated the decline in recruitment. Using the responsible stocking approach, an evaluation was made of the ecology, technicality and economic ramifications to the success of restocking. The results, which were presented in DFU-report nr. 143-05, showed the most plausible method was to release annually 474 million first-feeding larvae over a 5-month period, aiming at enhancing the population of 2-year old recruits by 10% and enhancing the spawning stock biomass towards a more long-term solution. From this evaluation a 6 year pilot restocking project was established (RESTOCK), situated on Bornholm. The first two and a half years of the project were financed by the FIUF programme (Directorate of Food, Fisheries and Agribusiness). The project was divided into 8 work-packages covering all aspects of the production of first feeding larvae and releasing them into the Bornholm Basin. These work-packages included; establishing facilities, broodstock collection and maintenance, egg production and incubation, assessing the age at which the larvae could be released, development of tagging methods and transportation and release methods. In addition, a workpackage dedicated to fish health was established to monitor the production for potential pathogens and adopt prophylactic measures to minimise the risk of disease. The broodstock Adult fish were collected and successfully held in captive conditions. The fish were subjected to a BVP (Bacteria, viral, parasite) program, where random samples were taken to assess the health of the wild fish captured. An important fish pathogenic bacteria Vibrio anguillarum serotype O2a was found in the wild fish. This bacterium could, under stressful culture conditions, be a potential problem. However the low density conditions in the broodstock tanks provide optimal rearing conditions for the broodstock. The presence of this bacterium, however, stresses the importance of continually monitoring the health status of the fish. None of the viral strains tested for were found in any of the 32 cod examined. Different protozoan and metazoan parasites were found in the fish examined, some of which are pathogenic and infectious, again stressing the importance of monitoring the health status of the broodstock. The presence of Ichthyodinium, a parasite commonly found in the wild and which is transferred from the parent fish directly to the larvae was monitored closely during 2007. The prevalence varied among broodstock, but no correlation was found between prevalence in eggs and egg mortality. The mature cod were kept in three separate broodstock tanks. The spawning period for one of these three broodstocks was altered so that it was possible to produce eggs over 6 months from April until September.

8
Egg and larval production In 2007, 273 litres of eggs were produced from 210kg of fish (male and female). Monitoring of egg incubation revealed around 38% survival to hatching. 70% of the eggs that survived to hatching produced viable larvae. Feeding was initiated 5-7 days post-hatch depending on temperature. The window of opportunity for release was demonstrated to be about 4 days independent of holding temperature for the range of temperatures tested. This corresponded also to the time of increasing activity in larvae, especially in fed larvae. The larvae produced were highly tolerant to sudden temperature changes (up to 3ºC) to both colder and warmer temperatures, and were able to start feeding within 24 hours after the temperature change. Higher differences in temperature changes resulted in poorer feeding incidence indicating negative impacts. Marking and releases It was possible to mark the larvae with alizarin complexone and to recognise the mark after 50 days. However, more work needs to be performed on marking and recognition of released fish. In collaboration with local fishermen, a release devise that could be operated from a standard fishing vessel was developed and tested. Half a million larvae were released in 2007. Larvae that were released in a net bag with potential food items at 28m depth were retrieved after 12 hours and found to have food in their stomachs, indicating that they were able to feed soon after release. Future perspectives The programme now intends to scale up to 1% releases (50 million larvae per year) and explore methods for predicting survival or for obtaining recaptures. During the next three years, work will also focus on resolving issues on how this model could be expanded to produce the 500 million larvae necessary, and assess what implications this may have on fisheries management of the Baltic cod in the future.

9
Chapter 1 Introduction Josianne G. Støttrup, Senior Research Scientist, DTU Aqua The aim of this project (RESTOCK I) was to empirically examine the potential for restocking cod in the eastern Baltic. A pilot project aimed at examining the potential for restocking the eastern Baltic showed that there was theoretically a potential for restocking the eastern Baltic with cod larvae (Støttrup et al., 2005a; 2008). One of the conclusions was that it could be possible to enhance recruitment of 2-year-old cod by around 10% of an average year-class, being equivalent to around 17 million recruits. A single release would also result over a period of 8 years in the accruement of around 14,000 tons cod spawning biomass. Furthermore it was possible to produce these cod larvae in an existing hatchery; Bornholms Lakseklækkeri. The project should run in two phases: Phase I should include the start-up of the cod broodstock, implementation of egg incubation and rearing techniques, provide the information on larval development required for optimal release strategies and develop techniques for the marking, transport and release of cod larvae in Bornholm Basin. Phase II should be the upscaling of the project to full-scale. This report comprises the results for the first three years of Phase I. This phase was originally planned to run over six years, but since the funding programme (FIUF programme, Directorate of Food, Fisheries and Agribusiness) terminated in 2007, only the first three years (RESTOCK I) were funded through this programme. In this chapter a summary of the findings of the pilot project is presented, providing the background knowledge for RESTOCK I.
1.1 Short summary of the scientific background for the rationale for restocking A more complete description of relevant information on the biology of Baltic cod and the ecology of the eastern Baltic is published in Danish in ”Opdræt af torskeyngel til udsætning i Østersøen” (Støttrup et al. 2005a), and in the popular scientific article in “Fisk og Hav” (Støttrup et al. 2005b). In English, the rationale for restocking the eastern Baltic cod has been published in a peer-reviewed international journal ”Reviews in Fisheries Science” (Støttrup et al. 2008). The incentive for this project was the decline in cod landings on Bornholm, which motivated the local fishermen into appealing for more proactive measures rather than continued restrictions. Between 1999 and 2006, the catches declined from 24,000 tons with a value of 254 million Danish crowns to 9,500 tons and a value of 110 million Danish crowns. The cod fishery has constituted up to 80% of the value of the total landings of the Bornholm fishermen. Thus the decline in cod landings has had an economic impact on the island. In order to ensure a responsible approach to stocking, several criteria should be fulfilled (Støttrup and Sparrevohn 2007); the most important among them being that:
• There is a bottleneck for recruitment which is not solely due to fishery
10
• The released fish are of a size larger than that identified being a bottleneck for recruitment, and optimal for the relationship between cost of production and post-release survival
• There is ample habitat and food for the released fish The following aspects highlighted in the pilot project are summarised below.
1.1.1 Oxygen demands The cod in the eastern Baltic spawn in the deep basins east of the island of Bornholm; the Bornholm Basin, the Gotland Deep and the Gdansk Deep (Bagge et al. 1994). Only in the deeper water layers, is the salinity sufficiently high to maintain the eggs floating (Nissling and Westin 1997). Low oxygen content in these water layers prevent the eggs from developing normally and hatch to larvae. Thus the survival of cod eggs and early larvae is dependant on climatic conditions that ensure the delivery of oxygenated saline water from the North Sea to these basins in the eastern Baltic (Hinrichsen et al. 2002b). The lack of saltwater inflow in recent decades has resulted in poor oxygen conditions in the deep saline water layers where the cod spawn. Since the early 1990ies, ideal conditions for survival and normal development of cod eggs have only been found in the Bornholm Basin (MacKenzie et al. 2000). The combined salinity and oxygen levels that support normal egg development has been termed the “spawning volume”, and the magnitude of this volume determines the year-class strength of the eastern Baltic cod (Plikshs et al. 1993). Thus, the egg stage is the critical life-stage for cod in the eastern Baltic.
1.1.2 Predation Apart from the spawning volume limiting egg production in cod from the eastern Baltic, eggs and newly-hatched larvae are subject to predation pressure from herring and sprat (Köster and Möllmann 2000). This is well documented especially in the spawning area in Bornholm Basin. Cod egg predation is highest in the early part of the spawning season, with sprat as the primary predator. Later in the spawning season, herring predation becomes predominant, but since there are much fewer herring than sprat in the Baltic, predation pressure from herring is lower. The egg stage is therefore critical for survival of cod in the eastern Baltic. This is well documented in Köster et al. (2003), who summarised the results from two larger EU projects CORE (1995-1998; Baltic cod recruitment project) and STORE (Baltic cod and sprat stock recruitment project). There is therefore a good reason for considering restocking through rearing and releases of early larvae of cod.
1.1.3 Changes in the spawning season Since 1990, the cod spawning season has shifted from spring to summer (Wieland et al. 2000). Before this period spawning peaked during March-April, where it now tops around July-August. This means that the larvae hatch into a different environment and to a different prey availability. The reason for this shift in spawning season is unknown, but is believed to be due to changes in temperature and growth conditions of the adult fish (Wieland et al. 2000). The yolk sac stage lasts 7 to 10 days depending on the temperature. Towards the end of the yolk-sac stage, the larvae become more active and move towards surface layers, where they seek prey (Grønkjær and Wieland 1997). In the upper water layers larval survival is dependant upon prey encounter and therefore on whether or not there are sufficiently high concentrations of prey items (Hinrichsen et al. 2002a). All these
11
parameters emphasise the importance of the larvae being in the right place at the right time to improve their survival potential.
1.1.4 Food sources The most important prey item for cod larvae is the copepod Pseudocalanus sp., which occurs in highest concentrations during April-May in the eastern Baltic (Möllmann et al. 2000). These copepods reproduce in the deep basins in the Baltic and the nauplii seek towards the surface to feed on microplankton. Later on in the season, when Pseudocalanus ceases to reproduce, the naupliar concentrations fall. The low salinity during the past two decades has caused the population of Pseudocalanus to decline, and this food source to become limited for cod larvae (Möllmann et al. 2000). However, since the spawning period for cod has shifted from early to late summer, cod larvae are no longer dependant on this species for their survival, but on other species that do occur in late summer in the eastern Baltic. Acartia sp. and Temora longicornis are two copepod species that dominate during late summer and these have become the more important food source for cod larvae in the Baltic in recent decades, since the shift in the spawning period. Unlike Pseudocalanus, these copepod species reproduce in shallow waters, which in combination with local currents result in the highest concentrations forming around the edges of Bornholm Basin (Hansen et al. 2006). As the cod larvae hatch primarily in the deeper part of the basin, their presence near the surface may not always coincide with that of the copepods and their nauplii.
1.1.5 Release scenarios During the pilot project three release scenarios were tested. Each of these scenarios should have the same end result; that of supplementing the average year class of two-year-old cod within ICES subdivision 25 by 10%. These scenarios were evaluated with respect to ecological, technological and economical criteria. Scenario I: release of 3 month-old cod juveniles (4-5 g). The juveniles are beyond the stage of the recruitment bottle-neck for the eastern Baltic cod stock. An estimated 26 million juveniles should be released. Scenario II: release of 2-3 day old cod larvae. The problems with limiting spawning volume or high predation pressure from clupeids can be avoided by releasing first-feeding cod larvae. The magnitude was estimated to be 474 million cod larvae. Scenario III: release of cod eggs. The release magnitude was estimated to be 13 billion newly fertilised cod eggs. For each scenario the number of larvae or eggs required was estimated and from there the number of females required as broodstock to produce the required number of fertilised eggs. The male:female ratio was set at 1:2. The capacity of the rearing facility could then be estimated and the costs for establishing and running such a unit estimated. The results showed that Scenario II was clearly the optimal of the three scenarios. Once the larvae start feeding and are located in the upper water layers, they are no longer threatened by clupid predation, and they are at this stage not influenced by limitations on egg production from the magnitude of the spawning volume.

12
The rearing was planned to take place at Bornholms Lakseklækkeri. The costs of establishing and running the facility were least in scenario II. There was a need for fewer broodstock with scenario II and no requirement for rearing juveniles or to produce live feed for the larval cod stages, such as scenario I would have required. Relative to the existing facility on Bornholm, few changes would need to be made. Earlier attempts (1992-1994) to rear Baltic cod at Bornholms Lakseklækkeri showed that it was feasible to establish a broodstock and to double egg production from this broodstock within one year (Prince 1997). During that project there was a low survival of larvae. The cause for the high mortalities was not found but was attributed to poor water quality or to disease transfer from the parent fish. With existing technology, it will be possible to ensure good water quality, screen the broodstock for particular diseases and avoid disease transfer as well as disinfect eggs. Further, broodstock nutrition will be improved to improve egg and larval quality.
1.1.6 Extension of the spawning season It is necessary to release the larvae during the season with high concentrations of suitable prey. By maintaining two broodstocks, each with their particular spawning season; for example one broodstock that spawns around April to June and another from June to August, it will be possible to produce eggs and larvae for a period of five to six months. A portion of the produced larvae will be released during spring when the copepod Pseudocalanus sp. is abundant. Even though the population of this copepod species is reduced in recent years compared to before the 90’ies, there are practically no fish competitors for this prey item. Thus it would be possible to utilise a food resource the natural population no longer utilises due to the shift in spawning season in the wild population. The remaining fish larvae will be released during summer, corresponding the present-day spawning season and the larvae will be able to utilise the copepod species Acartia and Temora together with their wild counterparts. The wild population are dependent on being able to encounter high densities of prey, which are abundant around the edges of Bornholm Basin. The reared larvae will be released in the areas where the prey is abundant to increase the likelihood of successful first-feeding.
1.2 References Bagge, O., Thurow, F., Steffensen, E., Bay, J., 1994. The Baltic cod. Dana 10: 1-28.
Grønkjær, P., Wieland, K. 1997. Ontogenetic and environmental effects on vertical distribution of cod larvae in the Bornholm Basin, Baltic Sea. Mar. Ecol. Prog. Ser. 154: 91–105. Hansen, F.C., Möllmann, C., Schütz, U., Neumann, T. 2006. Spatiotemporal distribution and production of calanoid copepods in the Central Baltic Sea. J. Plankton Res. 28: 39–54. Hinrichsen, H.H., Möllmann, C., Voss, R., Köster, FW., Kornilovs. G. 2002a. Bio-physical modelling of larval Baltic cod (Gadus morhua) survival and growth. Can. J. Fish. Aquat. Sci. 59: 1958–1873.
13
Hinrichsen, H.H., St. John, M.A. Lehmann, A., MacKenzie, B.R., Köster F.W. 2002b. Resolving the impact of short-term variations in physical processes impacting on the spawning environment of eastern Baltic cod: Application of a 3-D hydrodynamic model. J. Mar. Sys. 32: 281–294. Köster, F.W., Möllmann, C. 2000. Trophodynamic control by clupeid predators on recruitment success in Baltic cod? ICES J. Mar. Sci. 57: 310–323. Köster, F.W., Hinrichsen, H.-H., Schnack, D., St. John, M.A., MacKenzie, B.R., Tomkiewicz, J., Möllmann, C., Kraus, G., Plikshs, M., Makarchouk, A. and Eero, A. 2003. Recruitment of Baltic cod and sprat stocks: identification of critical life stages and incorporation of environmental variability into stock-recruitment relationships. Sci. Mar. 67: 129-154. MacKenzie, B.R., Hinrichsen, H.-H., Plikshs, M., Wieland, K., Zezera, A.S. 2000. Quantifying environmental heterogeneity: estimating thesize of habitat for successful cod egg development in the Baltic Sea.Mar. Ecol. Prog. Ser. 193: 143–156. Möllmann, C., Kornilovs, G., Sidrevics, L. 2000. Long-term dynamics of main mesozooplankton species in the Central Baltic Sea. J. Plank.Res. 22: 2015–2038. Nissling, A., Westin, L. 1997. Salinity requirements for successful spawning of Baltic and Belt Sea cod and the potential for cod stock interactions in the Baltic Sea. Mar. Ecol. Prog. Ser. 152: 261–271. Prince, P. 1997. Large scale production of Baltic Sea cod Bornholm 1992-1994. DFU rapport nr. 47-97. Plikshs, M., Kalejs, M., Grauman. G. 1993. The influence of environmental conditions and spawning stock size on the year-class strength of the eastern Baltic cod. ICES CM 1993/J:22. Støttrup, J, G., Sparrevohn, C.R. 2007 Can stock enhancement enhance stocks? Journal of Sea Research 57: 104-113. Støttrup, J.G., Overton, J.L., Möllmann, C., Paulsen, H.E., Pedersen, P.B., Lauesen, P. 2005a. Opdræt af torskeyngel til udsætning i Østersøen. DFU-rapport 143-05. Støttrup, J.G., Overton, J.L., Paulsen, H., Möllmann, C., Tomkiewicz, J., Pedersen, P.B., Lauesen, P. 2008. Rationale for restocking the eastern Baltic. Reviews in Fisheries Science 16: 58-64. Støttrup, J.G., Tomkiewicz, J., Paulsen, H.E., Pedersen, P.B., Overton, J.L., Möllmann, C., Lauesen, P. 2005b. En hjælpende hånd til torsk i Østersøen. Fisk og Hav 58: 62-71. Wieland, K., Jarre-Teichmann, A., Horbowa, K. 2000. Changes in the timing of spawning of Baltic cod: Possible causes and implications for recruitment. ICES J. Mar. Sci. 57: 452–464.
14
Chapter 2 Bornholms Lakseklækkeri Julia Lynne Overton, Hatchery manager, Bornholms Laksekækkeri and project scientist, DTU Aqua
2.1 Location
The RESTOCK project was located at Bornholms Laksekækkeri (Bornholm’s Salmon Hatchery), in the town of Nexø on the eastern coast of Bornholm. This location had the following advantages for the RESTOCK project:
1. Nexø harbour has been the most influential Danish harbour in terms of the cod fishery in the eastern Baltic. A substantial part of the project RESTOCK is in cooperation with the local fishermen (i.e. collection of broodstock and release of the cod larvae). Nexø harbour was the natural choice logistically for local fishermen’s physical participation in the project.
2. Nexø is the most easterly Danish port and therefore has the shortest sail time to the area of interest for release of the cod larvae i.e. the Bornholm Basin.
3. In Nexø there is an already existing hatchery which had facilities and staff that could be utilised to produce cod larvae for release in the Baltic.
2.2 Quarantine facilities
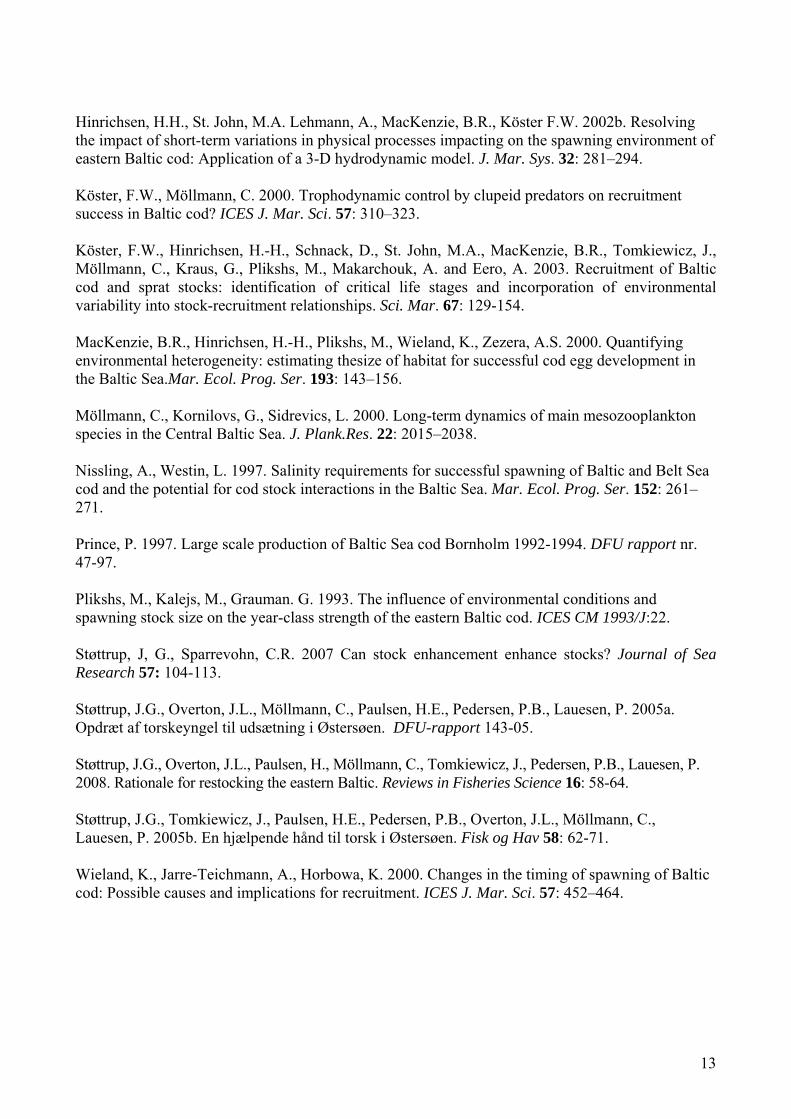
Bornholms Lakseklækkeri holds a veterinary approved virus free status for the viruses VHS (Viral Haemorrhagic Septicaemia) and IHN (Infectious Haematopoietic Necrosis). In order to maintain this status, broodstock collected from an offshore location must be maintained in quarantine for a prolonged period to meet the demands stated by the standing EU veterinary committee (EC Council directive 91/67/EEC article 14, paragraph 3C). In addition, it is always good husbandry practice to keep wild broodstock separated from egg and juvenile stages of fish to avoid pathogen transfer. Broodstock may be carriers of pathogens that can be lethal for eggs and larvae although no symptoms may be manifest in the broodstock. The quarantine facilities were established at a separate location in Nexø harbour, about 1 km from the hatchery (Fig.2.1). The quarantine was built in a former storage room with a controllable cooling system installed (Espersens, A/S). The building was formerly used to store fish prior to export. The desired water temperature could be maintained by cooling room temperature and due to the well insulated building this cooling was a more economic way than cooling the water directly.
Fig. 2.1. Nexø harbour showing the position of the hatchery and the quarantine facility.
15
An added advantage of air cooling was that any sampling or monitoring of eggs or larvae could be carried out in the room without any need for additional cooling equipment. The quarantine building had areas designated for changing clothes (in particular footwear), an egg disinfection room (for disinfection of eggs before transfer from the quarantine to the main hatchery) and a storage room for any experimental, monitoring equipment (Fig. 2.2).
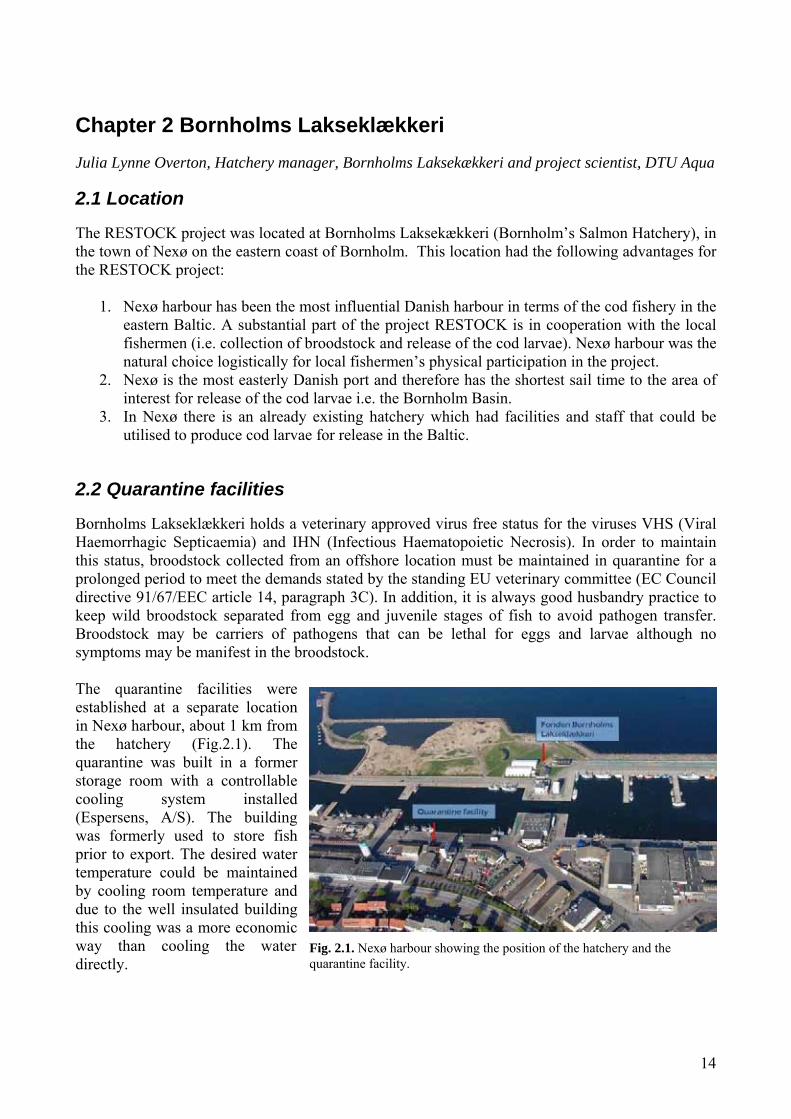
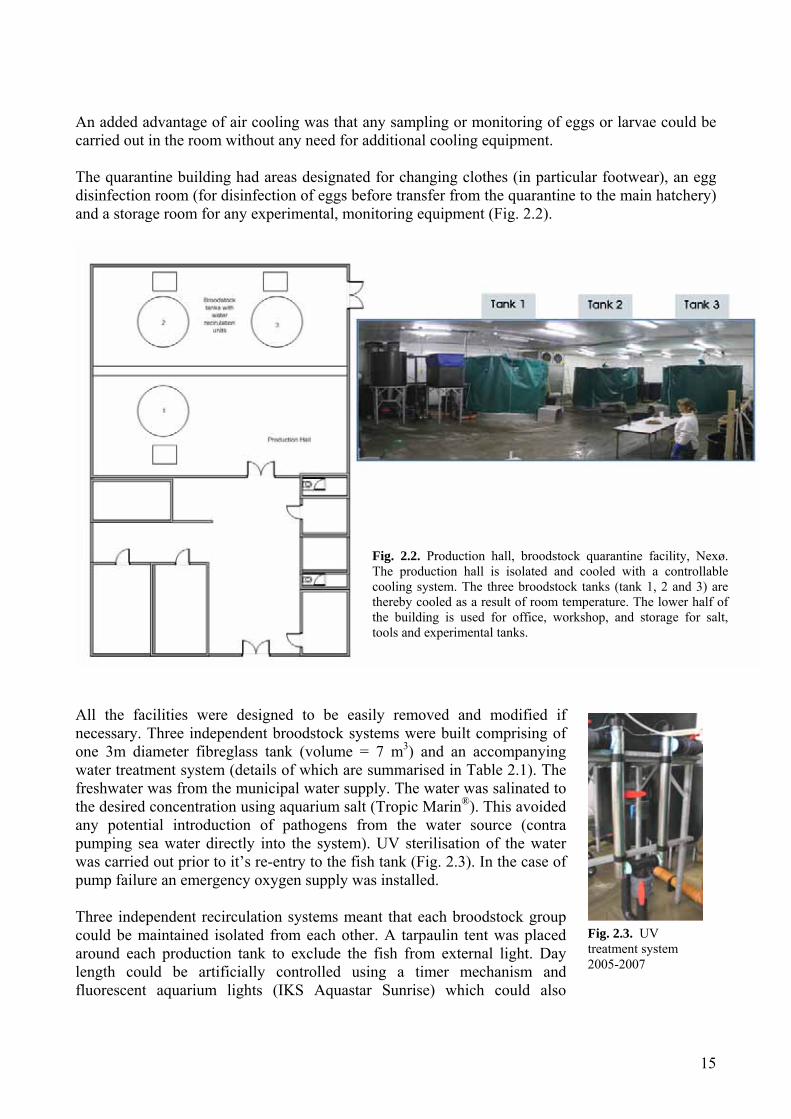
All the facilities were designed to be easily removed and modified if necessary. Three independent broodstock systems were built comprising of one 3m diameter fibreglass tank (volume = 7 m3) and an accompanying water treatment system (details of which are summarised in Table 2.1). The freshwater was from the municipal water supply. The water was salinated to the desired concentration using aquarium salt (Tropic Marin®). This avoided any potential introduction of pathogens from the water source (contra pumping sea water directly into the system). UV sterilisation of the water was carried out prior to it’s re-entry to the fish tank (Fig. 2.3). In the case of pump failure an emergency oxygen supply was installed. Three independent recirculation systems meant that each broodstock group could be maintained isolated from each other. A tarpaulin tent was placed around each production tank to exclude the fish from external light. Day length could be artificially controlled using a timer mechanism and fluorescent aquarium lights (IKS Aquastar Sunrise) which could also
Fig. 2.3. UV treatment system 2005-2007
Fig. 2.2. Production hall, broodstock quarantine facility, Nexø. The production hall is isolated and cooled with a controllable cooling system. The three broodstock tanks (tank 1, 2 and 3) are thereby cooled as a result of room temperature. The lower half of the building is used for office, workshop, and storage for salt, tools and experimental tanks.
16
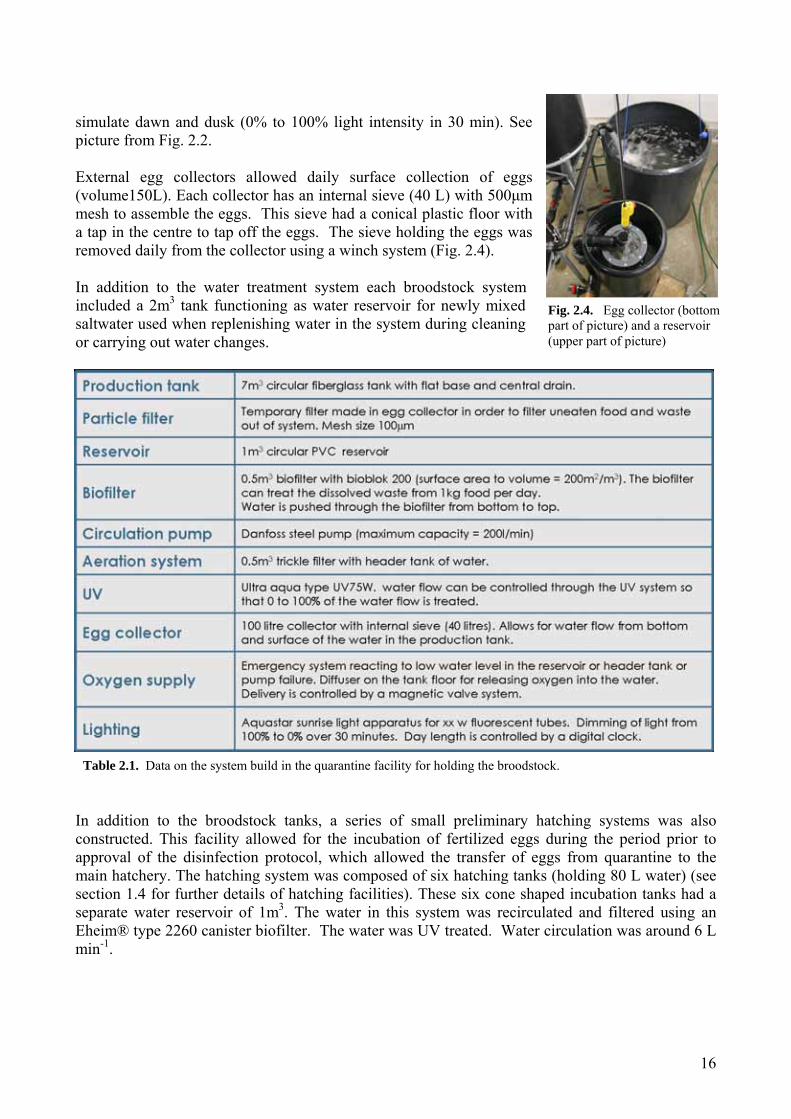
Fig. 2.4. Egg collector (bottom part of picture) and a reservoir (upper part of picture)
simulate dawn and dusk (0% to 100% light intensity in 30 min). See picture from Fig. 2.2. External egg collectors allowed daily surface collection of eggs (volume150L). Each collector has an internal sieve (40 L) with 500μm mesh to assemble the eggs. This sieve had a conical plastic floor with a tap in the centre to tap off the eggs. The sieve holding the eggs was removed daily from the collector using a winch system (Fig. 2.4). In addition to the water treatment system each broodstock system included a 2m3 tank functioning as water reservoir for newly mixed saltwater used when replenishing water in the system during cleaning or carrying out water changes.
In addition to the broodstock tanks, a series of small preliminary hatching systems was also constructed. This facility allowed for the incubation of fertilized eggs during the period prior to approval of the disinfection protocol, which allowed the transfer of eggs from quarantine to the main hatchery. The hatching system was composed of six hatching tanks (holding 80 L water) (see section 1.4 for further details of hatching facilities). These six cone shaped incubation tanks had a separate water reservoir of 1m3. The water in this system was recirculated and filtered using an Eheim® type 2260 canister biofilter. The water was UV treated. Water circulation was around 6 L min-1.
Table 2.1. Data on the system build in the quarantine facility for holding the broodstock.

17
2.3 Broodstock facilities
During RESTOCK-1 (2005-2007) the broodstock were held in quarantine (the technical details are described in section 2.2). The broodstock facilities within the main hatchery were therefore not deemed necessary for this project.
2.4 Egg incubation facilities
The egg incubation facilities were designed on the basis of that observed in Norway during a fact- finding visit in November 2005. The facilities are based on the hatching system used in the Norwegian Marine Research Institutes field station in Parisvattenet, Norway. The system was built in such a way that it could be dismantled and customised with relatively little effort. Incubation tanks were installed in section 2 of the main hatchery. Fig. 2.5 gives an overview of the main hatchery.
A string of 30 incubation tanks supported by stainless steel tables (three tanks per table) were connected to an already existing water treatment system in Section 2 of the main hatchery (Fig. 2.5). Each water treatment system in Section 2 could process approximately 6 L water sec-1. The biofilter (20.6m3) had capacity enough to process dissolved nitrogenous products from the shells of hatching larvae and other proteinaceous substances released during hatching. A trickle filter of
2B 2A
3B 3A
Sektion 1B
Tanks for pilot experimentswith first feedingand larvalRearing.
Incubators for cod eggs
= tanks for fish rearing
= Water treatment tanks
= Incubation tanks for Codlarvae
Color codes: = tanks for fish rearing
= Water treatment tanks
= Incubation tanks for Codlarvae
Color codes:
Sektion overview of the main hatchery
Fig. 2.5. This figure is a schematic overview of the main hatchery. The numbers 1A to 3B refers to Sections. Section 2 was used for the incubation of cod larvae and pilot investigations on first feeding in 2005-2007.

18
0.9m3 was used to aerate the water and gas off the carbon dioxide produced within the biofilter during the conversion of dissolved nitrogenous wastes. A drum filter of 0.6m3 with a filter mesh size of 60μm could filter out most algae and copepod stages used in experimental first feeding trials. The water reservoir holding 26m3 was kept at a constant 7ºC using a cooling system submerged in the reservoir itself. Temperature, pH and oxygen were monitored daily by computer. The system included an alarm function in case of system failure and has a back up generator in case of power failure. The hatching tanks were black cylindroconical tanks holding 80 L water volume (Fig. 2.6). A tap in the bottom of the tank allowed for removal of waste water. In 2006 the inflow was designed to produce thin jets of water in order to aerate the water and to push any oily film forming on the water surface to the edges of the tank. However, it was observed that the eggs experienced mechanical stress and an uneven flow of water in the tank meant that the eggs tended to clump together. In 2007 the inflow was changed so water entered the tank just below the water surface via a silicone hose. This gave a gentle flow and was easy to handle. In addition, flow meters were installed on all tanks enabling monitoring of flow rate. In the first year, the air supply was delivered via a glass pipe placed directly in the tank. During daily cleaning of the tanks it became apparent that this was not optimal, particularly as the air hoses were being handled daily (lifted in and out of the system) which could introduce potential pathogens from outside the tank into the water. In 2007 the air supply was connected to the outside the tanks to a valve attached to the bottom of the tank. In addition to better tank sanitation, the new air system gave a better flow in the incubation tank, maintaining the eggs in suspension and keeping the eggs well distributed in the tanks. To prevent the outflow from sucking out eggs a “drum-like” filter (350μm mesh and surface area of 350 cm²) was attached to a hose inside the tank. These filters could be easily removed and cleaned between egg incubation cycles. The revised hatching unit functioned well in 2007 with the highest survival of 75.000 newly hatched larvae recorded for one tank. Areas for improvement will be a method to increase the capacity of the incubators to hold a higher density of eggs. This could be for example placing various batches of 4-5 day old eggs (once the unfertilized/damaged eggs are removed) together to save space in the system.
AirWater in
Water out
AirWater in
Water out
Fig. 2.6. Cod incubation chamber, 2005-2007. Air inlet shown is the type modified in 2007.

19
2.5 Larval production facilities In order to verify the production of viable larvae, small-scale facilities were built to test their viability and also to examine which conditions were optimal for larval survival beyond first-feeding. Small-scale systems were applied to determine optimal conditions for feeding larvae, and results used for deciding on release strategies. These included testing for a) optimal temperatures, b) tolerance to sudden temperature changes c) optimal feeding densities, and d) optimal salinity for growth and survival (see chapter 4, for results of these experiments). Future work should focus on raising larvae that have been marked with Alizarin complexone (dye) so that the strength of this mark can be recorded as the fish get older, and to assess if there is a maximum time for visibility of the mark in terms of fish age. To do this a larval rearing system needs to be established.
2.6 Live feed facilities Although a facility to produce live feeds was not originally planned, it became apparent that to test first feeding, an appropriate live food type was necessary. The hatchery already has a room which was built for producing live feeds. Therefore, with some modification, this room was used to produce three different types of algae and the copepod, Acartia tonsa (Fig. 2.7). A reservoir and filtration system (10, 1 and 0.2 μm) was installed to filter 16psu artificial salt water (kept constant at 25ºC).
Fig. 2.7. A schematic overview of the live feed section used for producing algae and copepods for use in experiments with feeding larvae.
Section 4, live feed production
Algae production bags (species 1)Volumen per bag approx. 35 l
Algae production bags (species 2)Volumen per bag approx. 35 l
Algae stock culture(species 1)
Algae stock culture (species 2)
Arcartia sp.CultureTank volumen 150 l
Header tank with salinewater + filtration system
Light source

20
Chapter 3 The broodstock Julia Lynne Overton, Hatchery manager, Bornholms Laksekækkeri and project scientist, DTU Aqua
3.1 Background
The Baltic cod (Gadus morhua calliarias) is split into two different stocks; the western and eastern Baltic. The stock from the eastern Baltic is located from the eastern coast of Bornholm and in the lower Baltic basin up to 63ºN latitude. The western stock is distributed from the south western coast of Bornholm to the southern Kattegat (Bagge et al. 1994). These stocks are largely determined by their spawning grounds. For the stock originating from the eastern Baltic proper, these grounds are situated in the deep, salt water areas of the Bornholm Basin, Gdansk basin and the Gotland basin, but spawning has only been successful in Bornholm Basin the past couple of decades. The aim of the RESTOCK project was to improve the recruitment of the stock from the eastern Baltic. This required the collection of adult fish of reproductive age to form a broodstock from which larvae would be produced for release within ICES subdivision 25 (for exact location see map on www.ices.dk). It was imperative to be sure that the correct spawning stock was selected. This is most easily achieved just prior to the spawning season when the adult fish have already migrated to the spawning ground but have not yet spawned. However, due to the time needed for habitation of the broodstock to captive conditions prior to spawning (3 months minimum) the fish were collected as a rule in February-March. This means that the fish were not necessarily at the spawning grounds. Therefore the best estimate was made in terms of selection of broodstock during collection. This was carried out with advice from the local fishermen and DTU Aqua’s own experts on cod migration in the Baltic. The western Baltic broodstock spawn earlier than the eastern stock (from February –April). By collecting some fish from the western Baltic in the first year of the project, we could extend the spawning season and increase our experience with handling broodstock and eggs and larvae. The larvae from the western broodstock were used only for experimental purposes and the broodstock were removed from the system once spawning ceased.
3.2 Collection of broodstock
3.2.1. Method and location of collection Table 3.1 summaries the time, position, depth, number of fish captured, total weight of fish captured and numbers of mortalities for broodstock collected over the project period.
Eastern Baltic fish (2006). The broodstock was collected on the 7th March 2006 approximately 3 nautical miles from Nexø harbour, by a commercial fisherman from Nexø (R220 “Britta”). The fish were caught using a hook and long line. The fish were raised slowly from deep water in order to avoid barotrauma to the fish caused by the inability to decompress in time. During transportation from the catch site to the harbour, the fish were placed into a fish transport tank with seawater which was constantly replaced. Surface sea water temperature was between 0-1ºC, salinity was 8 psu and pH was 7.1.

21
The good weather conditions and short transport time (1½ -2 hours) resulted in the fish arriving at the quarantine facility in good condition. Table 3.1. Summary of data from collection of Baltic cod broodstock Date
Population
Position
Depth (m)
No. of fish
Weight (kg)
No. of Mortalities
07.03.06 Eastern N 55 02 00, E 15 12 50 40-45 17 22.4 1 N 55 03 00, E 15 11 50 30-35 23 34.2 0 N 55 01 50, E 15 14 00 35-40 18 34.5 1 N 55 01 00, E 15 11 50 27 30 50.1 0 05.04.06 Western N 54 56 40, E 12 28 40 14 38 73.4 1 26.02.07 Eastern N 55 09 73, E 16 24 41 60.3 143 150 3 N 55 12 28, E 16 24 87 60.3 N 55 14 42, E 16 25 28 58.5 03.04.07 Eastern N 55 01 00, E 15 12 00 25-35 43 61.0 5
Western Baltic fish (2006) The fish were collected on the 6th April 2006, approximately half a nautical mile southeast of Klintholm harbour, by a local fisherman from Møn. The fish were caught using a seine net at around 14 m depth. The fish were transferred to a pond with seawater that had continual water exchange. The water around Klintholm had a temperature of 4ºC and a salinity of 8 psu (Source: www.dmi.dk). The fish were then collected by the hatchery staff and transferred to Bornholm by road with a transport tank (volume 1m3). The total transport time was 9 hours.
Eastern Baltic fish (2007) In 2007 the fish were collected from two locations and by two methods. In order to ensure that we had broodstock from the Eastern Baltic, one tank of fish were collected from the eastern side of the Bornholm Basin. These broodstock were collected on 26th February 2007 using a commercial trawler (KR180 “Capricorn”). Three short trawls were made of 30 minutes (coordinates are shown in Table 3.1). Each trawl took place at around 60m depth. After each trawl the fish were raised slowly through the water column and the fish loaded onto the deck. They were subsequently sorted and placed into a 2m3 holding tank on the ships deck. 143 fish in total were collected and transported to the quarantine facility. From collection to arrival at the quarantine, the fish had a travelling time of around 9 hours from the first trawl. The salinity of the transport water was 9psu and had a temperature of around 3ºC. The remaining fish were collected on 3rd April 2007 by a commercial fisherman (R220 “Britta”) from the same location as in 2006. The fish were collected using line and hook from a depth of 25-35m. Water temperature was 4ºC. Transportation of fish to land was the same as described for 2006.
22
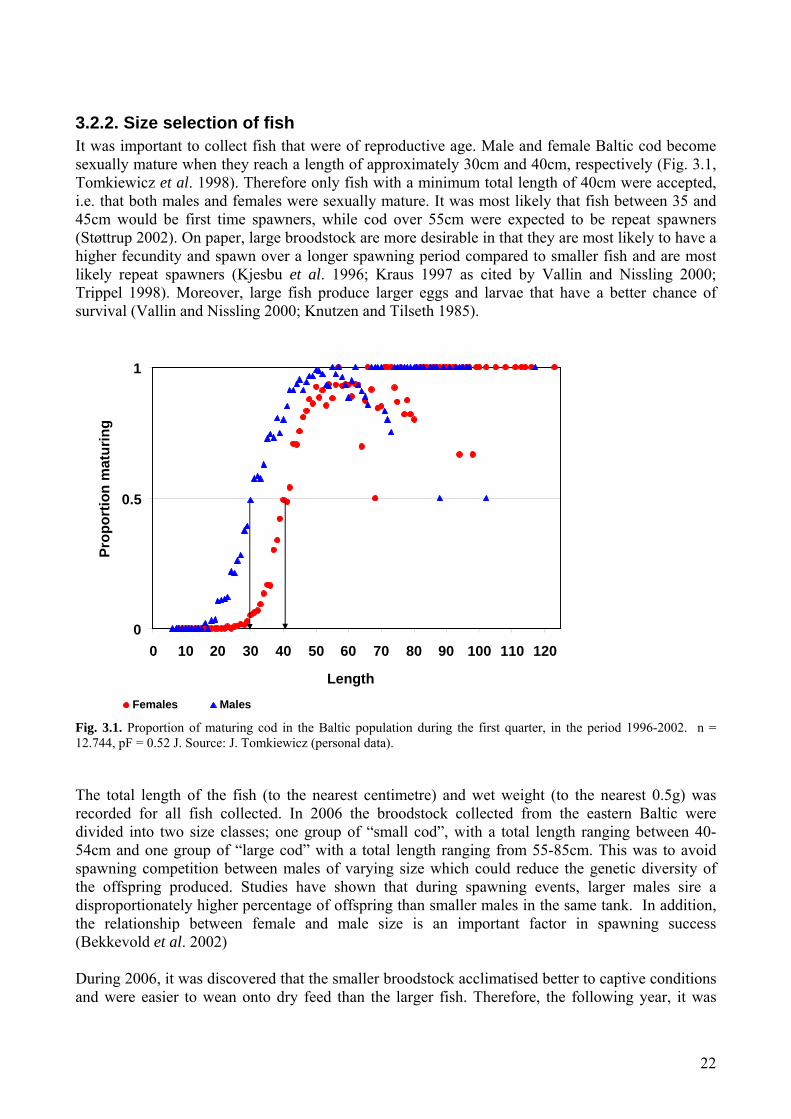
3.2.2. Size selection of fish It was important to collect fish that were of reproductive age. Male and female Baltic cod become sexually mature when they reach a length of approximately 30cm and 40cm, respectively (Fig. 3.1, Tomkiewicz et al. 1998). Therefore only fish with a minimum total length of 40cm were accepted, i.e. that both males and females were sexually mature. It was most likely that fish between 35 and 45cm would be first time spawners, while cod over 55cm were expected to be repeat spawners (Støttrup 2002). On paper, large broodstock are more desirable in that they are most likely to have a higher fecundity and spawn over a longer spawning period compared to smaller fish and are most likely repeat spawners (Kjesbu et al. 1996; Kraus 1997 as cited by Vallin and Nissling 2000; Trippel 1998). Moreover, large fish produce larger eggs and larvae that have a better chance of survival (Vallin and Nissling 2000; Knutzen and Tilseth 1985).
0
0.5
1
0 10 20 30 40 50 60 70 80 90 100 110 120
Length
Prop
ortio
n m
atur
ing
Females Males
Fig. 3.1. Proportion of maturing cod in the Baltic population during the first quarter, in the period 1996-2002. n = 12.744, pF = 0.52 J. Source: J. Tomkiewicz (personal data). The total length of the fish (to the nearest centimetre) and wet weight (to the nearest 0.5g) was recorded for all fish collected. In 2006 the broodstock collected from the eastern Baltic were divided into two size classes; one group of “small cod”, with a total length ranging between 40-54cm and one group of “large cod” with a total length ranging from 55-85cm. This was to avoid spawning competition between males of varying size which could reduce the genetic diversity of the offspring produced. Studies have shown that during spawning events, larger males sire a disproportionately higher percentage of offspring than smaller males in the same tank. In addition, the relationship between female and male size is an important factor in spawning success (Bekkevold et al. 2002) During 2006, it was discovered that the smaller broodstock acclimatised better to captive conditions and were easier to wean onto dry feed than the larger fish. Therefore, the following year, it was

23
Fig. 3.3. Tagging Baltic cod using external Floy tags.
Fig. 3.2. Cannibalistic broodstock cod preying on subordinate fish in the size range 40-50 cm. The tail tip of a newly ingested cod can be seen in the mouth. This fish was released again.
decided to collect small fish from the Baltic basin (40cm -57cm) plus some supplementary fish for the large broodstock. The supplementation of fish for the large broodstock proved to be a poor strategy. Territorial behaviour was expressed towards the newly introduced fish. This resulted in “subordinate” fish declining to feed and large fish injuring, and in some cases, preying on the subordinate fish (Fig. 3.2). In the end the larger fish were released again and new fish were collected to restock this tank. However, the size variation between these newly caught fish also resulted in injury due to hierarchical behaviour. Once the larger fish were removed, the remaining fish from the large group started to improve and feeding resumed, however, egg production was limited (see Chapter 4 for more details). It is very likely that such hierarchical behaviour could reduce spawning effort of the subordinate individuals in the tank. These behavioural interactions need to be investigated further.
3.2.3 Genetic determination of origin of broodstock It was important to have the fish collected genetically identified to confirm their origin. Presently the genetic baseline for eastern and western Baltic stocks from spawning populations is limited. The RESTOCK project sampled fish from the spawning grounds of both the western Baltic population (sampled in 2006) and Eastern Baltic population (sampled from the Bornholm basin in 2007). These samples could be used to strengthen the genetic baseline. In addition, those fish collected from the northeast coast of Bornholm were also sampled so that they could be matched against the baseline data. Sampling the broodstock fish required a biopsy of caudal fin tissue taken from all individuals collected during the preliminary weighing and measuring of the fish. Each tissue sample was stored in 98% ethanol in a labelled 1.5ml centrifuge tube. These samples were subsequently sent to the Department for Freshwater Fisheries, Silkeborg (DTU Aqua) for further genetic analysis. This was not a planned activity within this project but was initiated through cooperation and with other funding.
3.3 Marking, sexing, prophylactic
treatment
3.3.1 Tagging All broodstock were tagged in order to follow their individual development. In combination with sex determination, tagging allowed individual males and females to be identified. Two types of tag were used; an internal and external tag. In the event that the external tag was lost the internal

24
tag could identify the fish. Floytags® (TBA-1, Hallprint fish tags, Australia) were used to tag the fish externally. The tag was placed just below the anterior dorsal fin; between the first and second fin rays (Fig. 3.3). In addition, VI Alpha tags® (Northwast marine technology, Inc., USA), were inserted subcutaneously, posterior to the left eye. VI Alpha tags can be read with ultraviolet light. All needles used to tag the fish were sterilised between individuals to ensure that there was no transfer of foreign tissue under the skin which could cause infection. The external tags proved extremely useful for easy identification of individual fish without too much handling. External tag loss was minimal (under 2%) and was caused during netting and transfer of fish. The fish were sedated prior to tagging by immersing them in a solution of Ethyl 3-aminobensoate methansulfonate (MS-222) at a concentration of 75mg L-1 using artificial salt water (13psu) for approximately 2 minutes. The water temperature was around 4ºC. After tagging the fish were placed into clean saltwater to recover. No mortalities accrued due to sedation and tagging. The internal tagging proved to be time consuming and difficult when working in such cold temperatures. These internal tags were therefore not used after the first collection of fish.
3.3.2 Sex determination Sex determination of fish is an important tool both for aquaculture and stock enhancement. Sex determination in some fish species is only possible in sexually mature fish during spawning season where the female becomes swollen around the abdomen and male fish are spermiating. Sex determination in cod out of the spawning season and particularly in juvenile is not possible without post-mortem dissection. Immunochemical detection of female specific proteins or analysis of sex hormones is possible but only during sexual maturity. Catheterisation is also possible but is an invasive process which is not always optimal. Therefore a non invasive method such as ultrasonography, has potential to sex determine fish in the field. This method has been used to sex a range of commercially important fish species, including Atlantic cod (Karlsen and Holm 1994). The fish to be tested were small Baltic cod that were collected from the eastern Baltic in February 2007. In early spring it was predicted that the fish would be maturing so that it would be possible to see the gonads clearly but at the same time maturation is not so advanced that changes in the water levels in the gonads would make it difficult to distinguish males from females (as described by Martin-Robichaud and Rommens 2001). Scanning of the fish was carried out in cooperation with Copenhagen University. The scanning was carried out using an Aloka SSD -500 ultrasound machine, using a 7.5MHz linear array transducer (Japan). Penetration depth varied through out the day. The penetration depth of the two scanning pictures shown in Fig. 3.4a and b was 6cm. An initial ultrasound trial was carried out on eight fish. These fish were sedated using MS222 (75 mg L-1) and then measured and weighed. These fish were transferred to clean saline water. The fish were scanned using the ultrasound with the fish submerged. Cross sections were scanned of the fish gonads posterior to the gut region. In the initial trial the fish were subsequently sacrificed in order to build a reference data of sex and gonadal stage of development to the images recorded on the ultrasound monitor. Thereafter, 77 fish were scanned to determine their gender. Photographic images were taken of each scanning. In order to verify the results obtained from the ultrasound, a biopsy of the gonads was taken from 20 fish using a syringe placed left of the genital pore. The

25
tissue obtained from the biopsy was observed under a light dissecting microscope (25 x magnifications). All mortality of fish was recorded for the month following the procedure. It was revealed that the ultrasound gave 85% accuracy in sex determination. It was also determined that there was a 1.2:1 sex ratio of females to males in tank 3. The biopsy procedure did not invoke a higher mortality compared to those fish that were scanned only. This was not as high as the 95% success in distinguishing male from female Atlantic cod by Karlsen and Holm (1994). The female gonads were easily recognised as two ovoid spheres. The males were more difficult to distinguish although the small dense particles dispersed in the body cavity could be identified as the reticulated form of the testes. In general if the definitive form of the female ovaries were missing then the fish was most likely male. In two individuals, the fish were found to be hermaphroditic with both ova and spermatozoa in the gonad tissue.
a) Female cod b) Male cod Fig. 3.4. Ultrasound scanning of a) female and b) male broodstock cod. The fish is inverted thus the abdomen is in the upper part of the picture. The females gonads are fairly compact and form ”globe” like forms on the scanning. The male gonads in comparison are grainy with loose structure in the abdomen. Photos courtesy F. Mc Evoy, Copenhagen University. Overall, this method was found to be very reliable and posed minimal stress and handling of the fish compared to other more invasive methods. In addition, taking a biopsy was possible to confirm the ultrasound without any adverse effects to the fish.
3.3.3 Prophylatic treatment Wild broodstock are known to be carrying a whole range of potential pathogens that could build up in a system where the water is recirculated. In addition, the captive fish are more vulnerable to these pathogens in the period of acclimatisation to their new surroundings. Therefore the fish were disinfected to remove ectoparasites, particularly from the skin and gills (see Chapter 8, for more precise details of the parasites found on the wild broodstock prior to treatment). After the fish were tagged, they were treated with 50mg L-1 formalin for one hour (2x2m tank, volume = 2.72 m3, 13psu artificial salt water at 3.6ºC). There were no mortalities during or directly after formalin treatment.
26
3.4 Broodstock husbandry In the pre-evaluation of the project (Støttrup et al. 2005) the following conditions for cod broodstock under captive conditions were recommended:
• Stocking density of 7-10kg m-3 • Water flow should be sufficient to ensure over 80% oxygen saturation • Ambient water salinity or 7-10psu • Water temperature should be maintained between 5 and 9ºC • Light intensity should be around 35 μE
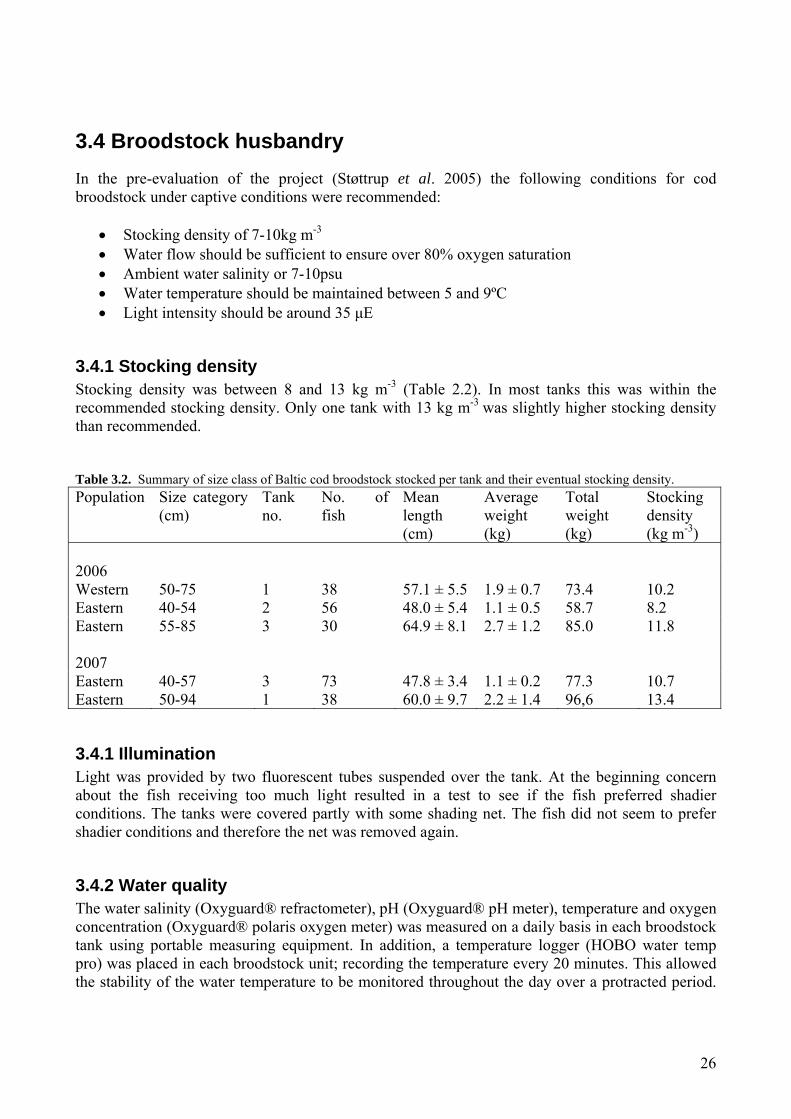
3.4.1 Stocking density Stocking density was between 8 and 13 kg m-3 (Table 2.2). In most tanks this was within the recommended stocking density. Only one tank with 13 kg m-3 was slightly higher stocking density than recommended. Table 3.2. Summary of size class of Baltic cod broodstock stocked per tank and their eventual stocking density. Population Size category
(cm) Tank no.
No. of fish
Mean length (cm)
Average weight (kg)
Total weight (kg)
Stocking density (kg m-3)
2006 Western 50-75 1 38 57.1 ± 5.5 1.9 ± 0.7 73.4 10.2 Eastern 40-54 2 56 48.0 ± 5.4 1.1 ± 0.5 58.7 8.2 Eastern 55-85 3 30 64.9 ± 8.1 2.7 ± 1.2 85.0 11.8 2007 Eastern 40-57 3 73 47.8 ± 3.4 1.1 ± 0.2 77.3 10.7 Eastern 50-94 1 38 60.0 ± 9.7 2.2 ± 1.4 96,6 13.4
3.4.1 Illumination Light was provided by two fluorescent tubes suspended over the tank. At the beginning concern about the fish receiving too much light resulted in a test to see if the fish preferred shadier conditions. The tanks were covered partly with some shading net. The fish did not seem to prefer shadier conditions and therefore the net was removed again.
3.4.2 Water quality The water salinity (Oxyguard® refractometer), pH (Oxyguard® pH meter), temperature and oxygen concentration (Oxyguard® polaris oxygen meter) was measured on a daily basis in each broodstock tank using portable measuring equipment. In addition, a temperature logger (HOBO water temp pro) was placed in each broodstock unit; recording the temperature every 20 minutes. This allowed the stability of the water temperature to be monitored throughout the day over a protracted period.
27
Dissolved ammonia (ionised and unionised), nitrite and nitrate concentrations were measured three times weekly using hatch field testing kits (Hach Lange A/S). Temperature At the beginning of 2006 the water temperature was equilibrated with ambient water temperature in order to prevent a temperature shock to the fish (3-5ºC). The water temperature was subsequently maintained between 6-8ºC during the entire spawning period. After the spawning period the temperature was raised to 12-13ºC in order to prime the biofilters. Increasing the temperature also increased the appetite of the broodstock after spawning, reducing the likelihood of post spawning anorexia. The temperature was then reduced again to 7ºC in March 2007 prior to spawning of the cod in April 2007. This temperature was maintained for the rest of the project period. Salinity Baltic cod are known to have adapted to low salinities (salinities are as low as 7.5psu at the surface layers in the southern Baltic region down to 17psu in deeper waters, Tomkiewicz et al., 1998), although the distribution of cod within the Baltic is more associated with oxygen concentrations. The initial salinity for the broodstock tanks was determined by the minimum salinity required for sperm motility and egg buoyancy (i.e. 11 -12psu, Nissling and Westin, 1997). Thereafter the salinity was raised to an optimum salinity decided by the neutral buoyancy of the cod eggs observed spawned in the tanks (16psu, see Chapter 4). The critical salinity was at the concentration where spawned, fertilized eggs were positively buoyant and could therefore be collected from the water surface. At the beginning of the season the salinity was raised to 17psu, and thereafter held constant over the spawning season. Thereafter the salinity was raised to 20psu from 10th September 2006. This was in part to use the buffering capacity of the salt ions to control the toxity of the nitrite ions that had started building up in the system as soon as the temperature was raised to 12 ºC and the biofilter had a chance to prime itself. A salinity of 19psu was maintained throughout 2007. pH The pH ranged from 6.5 to 8.5, although over the majority of the period, the pH was held within 7 to 7.5. It was discovered that if the pH became any higher than 8.0 the fish started to look stressed, became dark in colour and lost appetite. Therefore it was vital to keep the pH within the ranges of 7 to 7.5. A decrease in pH is usually associated with the chemical transformation from ammonia to nitrites and finally to nitrates, as an aerobic reaction takes place resulting in carbon dioxide being released. It is commonly observed therefore, that the pH will reduce in a biofilter which is priming itself. This was not observed during the period from March to September 2006. Instead a raise in pH associated with high ammonia levels were observed. This was a sure indication that the biofilter had not primed itself properly. After the biofilter was allowed to prime itself the pH remained constant between 7.0 and 7.5, Ammonia, nitrites and nitrates In order to have a fully functioning recirculation system the biofilter must be “primed”, i.e. the bacterial growth is such that there is an optimum concentration of Nitrosoma spp. (the group pf bacteria that oxidise ammonia to nitrites) and Nitrobacta spp. (those bacteria that oxidise nitrites to nitrates, the latter being much less toxic to fish). In order to prime a biofilter there must be the right bacteria types and concentration, an ammonia source and enough oxygen for the chemical conversion (not less than 5mg L-1). In addition, the growth of these bacteria is temperature-dependant, with an optimal temperature of around 30ºC (Lekang and Fjera, 1997). Due to the delay for construction of the broodstock facility (due to shipment delays and a change of location), and

28
the need to start the collection of broodstock in March to keep the project on schedule, the “priming” period was somewhat reduced than what is necessary to have a fully primed biofilter. Moreover, the low temperatures required in the broodstock tanks during spawning for egg survival (under 9ºC) limited any bacterial growth within the biofilter. It was therefore only after spawning season, when the water temperature could be raised to 12ºC that the filter started to prime itself. There is very little information in the literature on the performance of cod in recirculated systems, in particular the tolerance levels of cod to ammonia and nitrite concentrations. In this particular project, the cod have been exposed to very high, though fluctuating levels of both total ammonia and nitrite during priming of the biolfilter ( 30.5 mg L-1 and 44 mg L-1, respectively), with very little effect on survival. In fact, the fish have not lost appetite and have put on weight post spawning. It seems that Baltic cod is an extremely robust species. Water quality trials on juvenile Altantic cod have revealed a threshold concentration of total ammonia of 1mg l-1 affecting growth (Björnsson and Ólafsdóttir, 2006). Once priming was completed the ionised ammonia levels remained below 0.8 mg L-1 and nitrite levels below 0.6 mg L-1. Unionised ammonia was recorded at 0.001-0.005 mg L-1.
3.4.3 Feed After collection, the broodstock were given an adjustment period of 4-5 days to become acclimatised before feeding commenced. During the first five weeks the cod were fed shrimp and crayfish tails by hand and were observed. During the last two weeks of this five week period dry food was also introduced. Two broodstock dry feeds were tested; Vitalis repro Cod 17mm (Skretting AS) and Dan Ex-1758, 15mm (Danafeed A/S). After some weeks it was observed that the broodstock found the Vitalis diet most palatable. The problems of the broodstock accepting hard pelleted, inert diets were overcome by coating the feed in gelatine. This softened the texture of the diet and as a result improved food intake. This practice has been continued throughout the project. The broodstock were fed ad libitum according to appetite. Mean feeding was calculated at around 0.5% body weight per day (calculated from the start weight during collection of the fish). The fish were fed throughout the spawning season. After spawning the amount of food fed was raised to approx. 1-1.5% body weight per day for 4 weeks before returning to 0.5% body weight. The cod were always fed by hand to allow an assessment of their condition and their appetite.
3.5 Manipulation of spawning season
It has been observed that the spawning season for Eastern Baltic cod has altered from April - June in the 1980s to July –August by the 1990s (Støttrup et al. 2005). Presently Baltic cod are observed to be in spawning condition well into September and in some individual fish into November (J. Pikova, pers. comm.). The reasons for this shift in spawning season are unknown. The result of this delayed spawning is the production of larvae that have missed the peak in zooplankton production, which could result in starvation of these larvae and future low recruitment levels. One of the objectives of the project was to produce larvae where zooplankton production and composition is at it’s optimal in order to ensure a better larval survival rate and to harness a naturally available food source which is not currently being utilised by cod larval stages. To achieve this, one group of captive broodstock were seasonally manipulated in order to obtain spawning fish from April –

29
September, i.e. six months of spawning with spawning starting one and a half months ahead of the observed spawning period. As with most temperate aquatic species, maturation and spawning in cod is controlled primarily by day length, and to a lesser degree temperature (Kjørsvik and Holmefjord 1995). It has already been demonstrated that spawning in cod can be manipulated by photoperiod alone (e.g. Hansen et al. 2001; Norberg et al. 2004). During 2006, the fish were allowed to spawn naturally to observe their season for spawning under captive condition with a photoperiod that matched the natural day length. From this information a day length regime was made to compress the following “winter” and “spring” so that one group of fish would spawn ahead of the natural spawning event in 2007. Fig. 3.5 shows the regime of day length used for the seasonally altered fish compared to normal day length. Results of spawning period and fecundity are provided in Chapter 4.
Fig. 3.5. Photoperiod regime for Baltic cod. The altered broodstock have been exposed to a compressed seasonal photoperiod regime to shift the spawning period forward by six weeks.
3.6 Survival Survival of the broodstock fish has been relatively low. Calculating all mortalities from day of collection to present day, around 37% to 57.5 % mortality has been observed. The highest mortality was observed for the small fish collected using a trawl. In general, the majority of mortality took place within the first few weeks after capture and post spawning, where the fish were emaciated as all energy had been placed into reproduction. These fish can experience a post spawning anorexia, where they have expended so much energy they are unable to feed again. The fish that died in most cases were extremely thin (unable to feed) or had physical injury (from capture or from territorial behaviour from other fish). The following observations were made which should be taken into consideration in the future;
• Large fish do not survive from handling out of water. Therefore transport in water and minimal netting during transfer is advisable.
Week
0 20 40 60 80 100 120
Hou
rs d
aylig
ht
06:00:00
10:00:00
14:00:00
18:00:00
Natural photoperiodAltered photoperiod
30
• Physical damage can be reduced by using line and hook instead of trawl methods to collect broodstock.
• Small fish are easier to wean onto dry feed and adapt to tank conditions easily. However, many do not survive the first spawning season, possibly due the lack of energy stored prior to spawning. This could be a natural phenomena or something provoked by captive conditions.
• The broodstock were observed to be territorial. Supplementation of new fish to an already established group results in energy being expended to re-establish the hierarchy in the tank, resulting in loss in spawning performance, and in worst case mortality.
• Size sorting is important from the start. Size variation provokes hierarchical behaviour, possibly for food resources or competing for a mate.
3.7 Recommendations The following recommendations are made from the experiences gained with respect to collection and maintenance of cod broodstock in order to produce optimal production of fertilized eggs.
1. Two aspects of broodstock collection were important for successful spawning during the first year; the method of collection and the time of collection with regards to their stage of gonadal maturation.
a. Method of collection is important with regards to physical damage to the fish and stress during capture and handling. Line and hook method of collection is recommended in order to reduce surface contusions to the fish and to raise the fish slowly from deep waters to avoid barometric trauma.
b. Time of collection should be no later than 3 months before spawning. Any stress of capture or handling after this point may seriously hamper the production of good quality eggs.
2. Transportation time for transportation of wild fish from capture to holding facilities should be kept at a minimum.
3. Treatment of broodstock to remove surface parasites prior to entry into holding facilities is recommended in order to reduce the chances of cross infection between stressed fish. Continued prophylactic treatment during the first weeks will reduce the chances of an infestation. This is particularly applicable to recirculated water systems.
4. Screening for pathogens is vital in order to plan the required husbandry during quarantine, and if possible, treat any infections.
5. As broodstock, the fish require space to spawn. A maximum stocking density of 10kg m3 is recommended.
6. Fish should be sorted into approximate size classes in order to reduce dominance by one male fertilising all eggs due to competition associated with size of males.
7. Although large (older) fish have a high fecundity and produce larger eggs and therefore larger larvae, they are more difficult to wean on to dry feed and are not robust to handling. Therefore it is recommended that smaller fish are introduced (40-50cm) so that they can acclimatise to captive conditions.
8. Free spawning in tanks is more preferential than stripping of fish. It is less labour intensive and eliminates handling stress.
9. In order to collect eggs from the surface of the water, the water salinity should be higher than 17psu during the spawning period for Baltic cod.
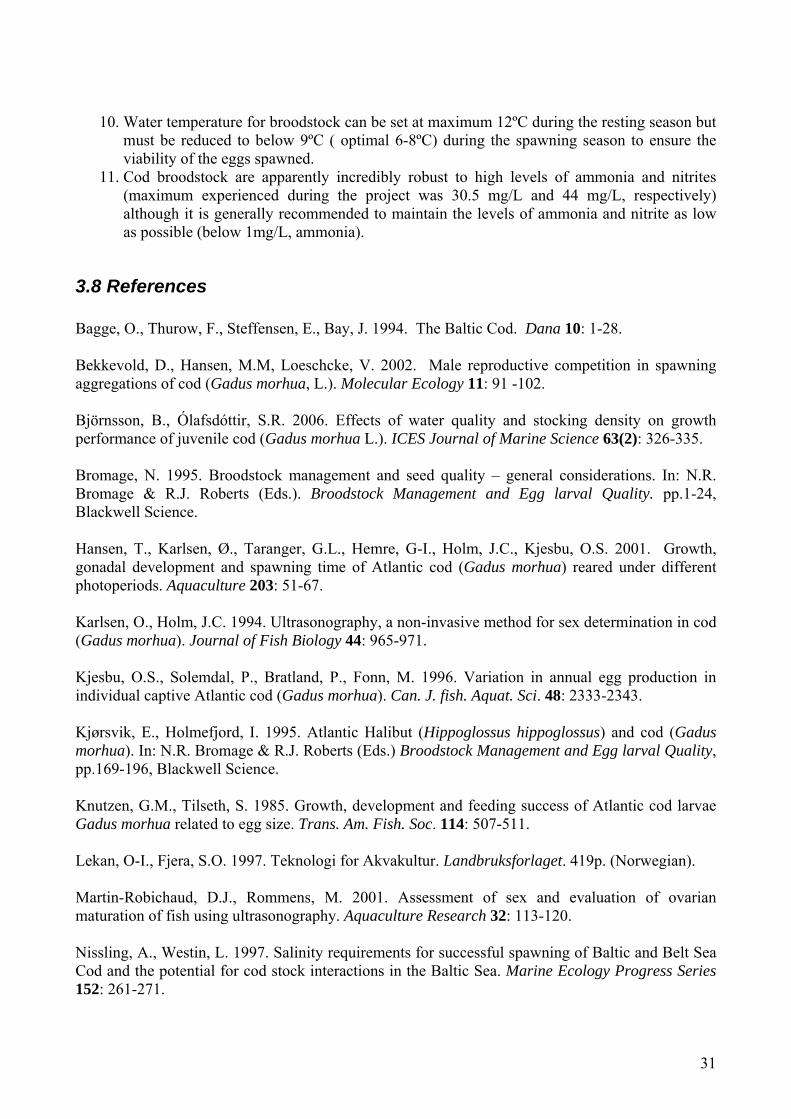
31
10. Water temperature for broodstock can be set at maximum 12ºC during the resting season but must be reduced to below 9ºC ( optimal 6-8ºC) during the spawning season to ensure the viability of the eggs spawned.
11. Cod broodstock are apparently incredibly robust to high levels of ammonia and nitrites (maximum experienced during the project was 30.5 mg/L and 44 mg/L, respectively) although it is generally recommended to maintain the levels of ammonia and nitrite as low as possible (below 1mg/L, ammonia).
3.8 References Bagge, O., Thurow, F., Steffensen, E., Bay, J. 1994. The Baltic Cod. Dana 10: 1-28. Bekkevold, D., Hansen, M.M, Loeschcke, V. 2002. Male reproductive competition in spawning aggregations of cod (Gadus morhua, L.). Molecular Ecology 11: 91 -102. Björnsson, B., Ólafsdóttir, S.R. 2006. Effects of water quality and stocking density on growth performance of juvenile cod (Gadus morhua L.). ICES Journal of Marine Science 63(2): 326-335. Bromage, N. 1995. Broodstock management and seed quality – general considerations. In: N.R. Bromage & R.J. Roberts (Eds.). Broodstock Management and Egg larval Quality. pp.1-24, Blackwell Science. Hansen, T., Karlsen, Ø., Taranger, G.L., Hemre, G-I., Holm, J.C., Kjesbu, O.S. 2001. Growth, gonadal development and spawning time of Atlantic cod (Gadus morhua) reared under different photoperiods. Aquaculture 203: 51-67. Karlsen, O., Holm, J.C. 1994. Ultrasonography, a non-invasive method for sex determination in cod (Gadus morhua). Journal of Fish Biology 44: 965-971. Kjesbu, O.S., Solemdal, P., Bratland, P., Fonn, M. 1996. Variation in annual egg production in individual captive Atlantic cod (Gadus morhua). Can. J. fish. Aquat. Sci. 48: 2333-2343. Kjørsvik, E., Holmefjord, I. 1995. Atlantic Halibut (Hippoglossus hippoglossus) and cod (Gadus morhua). In: N.R. Bromage & R.J. Roberts (Eds.) Broodstock Management and Egg larval Quality, pp.169-196, Blackwell Science. Knutzen, G.M., Tilseth, S. 1985. Growth, development and feeding success of Atlantic cod larvae Gadus morhua related to egg size. Trans. Am. Fish. Soc. 114: 507-511. Lekan, O-I., Fjera, S.O. 1997. Teknologi for Akvakultur. Landbruksforlaget. 419p. (Norwegian). Martin-Robichaud, D.J., Rommens, M. 2001. Assessment of sex and evaluation of ovarian maturation of fish using ultrasonography. Aquaculture Research 32: 113-120. Nissling, A., Westin, L. 1997. Salinity requirements for successful spawning of Baltic and Belt Sea Cod and the potential for cod stock interactions in the Baltic Sea. Marine Ecology Progress Series 152: 261-271.
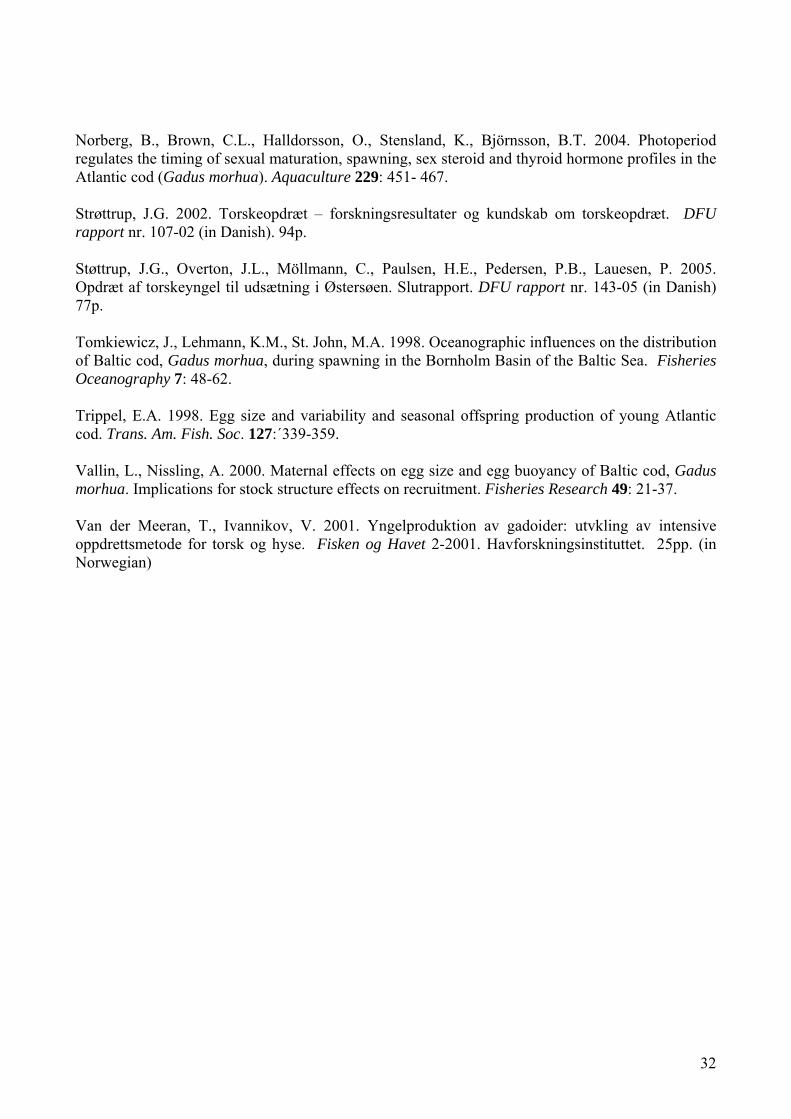
32
Norberg, B., Brown, C.L., Halldorsson, O., Stensland, K., Björnsson, B.T. 2004. Photoperiod regulates the timing of sexual maturation, spawning, sex steroid and thyroid hormone profiles in the Atlantic cod (Gadus morhua). Aquaculture 229: 451- 467. Strøttrup, J.G. 2002. Torskeopdræt – forskningsresultater og kundskab om torskeopdræt. DFU rapport nr. 107-02 (in Danish). 94p. Støttrup, J.G., Overton, J.L., Möllmann, C., Paulsen, H.E., Pedersen, P.B., Lauesen, P. 2005. Opdræt af torskeyngel til udsætning i Østersøen. Slutrapport. DFU rapport nr. 143-05 (in Danish) 77p. Tomkiewicz, J., Lehmann, K.M., St. John, M.A. 1998. Oceanographic influences on the distribution of Baltic cod, Gadus morhua, during spawning in the Bornholm Basin of the Baltic Sea. Fisheries Oceanography 7: 48-62. Trippel, E.A. 1998. Egg size and variability and seasonal offspring production of young Atlantic cod. Trans. Am. Fish. Soc. 127:´339-359. Vallin, L., Nissling, A. 2000. Maternal effects on egg size and egg buoyancy of Baltic cod, Gadus morhua. Implications for stock structure effects on recruitment. Fisheries Research 49: 21-37. Van der Meeran, T., Ivannikov, V. 2001. Yngelproduktion av gadoider: utvkling av intensive oppdrettsmetode for torsk og hyse. Fisken og Havet 2-2001. Havforskningsinstituttet. 25pp. (in Norwegian)

33
Chapter 4 Egg production Helge Paulsen, Senior research scientist, Sune Riis Sørensen, Research assistant, Josianne G. Støttrup, Senior research scientist, DTU Aqua. Julia Lynne Overton, Hatchery manager, Bornholms Laksekækkeri and project scientist, DTU Aqua. Céline Marochin, Bachelor thesis student, University of Caen, France. Egg production and egg quality were monitored daily during the spawning season and a protocol was drawn up for this monitoring. In addition, experiments were performed to investigate parameters that determine egg quality. A student from University of Caen, France participated in this work as part of her bachelor thesis (Marochin, 2007).
4.1 Broodstock egg production/year/broodstock
Cod is a so-called "batch spawner" which spawns every 2-3 days for a period of 2-3 months. Daily egg production is therefore variable being dependent on the individual spawning rhythm of the broodstock fish.
4.1.1 Egg production 2006 Cod from the Western Baltic broodstock (Fig. 4.1) spawned from 9th April 2006 to 24th May 2006. Western Baltic cod spawned in the same period as do cod from the Kattegat and Danish Belt sea area (January to May), while Eastern Baltic cod spawn during the summer. The fish were therefore collected near the end of the spawning season. This may explain the small and erratic egg production obtained. The broodstock from the Eastern Baltic (Fig. 4.2 a and b) spawned from 31st May 2006 to 13th August 2006 with a peak period from 14th to 19th June. Spawning commenced almost 3 months after capture. Egg production was on average 1.478 L kg-1 fish in the group of small cod and 1.702 L kg-1 fish in the group of large fish. Total volume of eggs was registered and proportion of sinking and floating eggs assessed. From the floating egg portion, the fertilization rate was estimated from visual observations of normally developing eggs. On average 65.8% of the eggs were fertilized.
0
100
200
300
400
500
600
700
800
9 11 13 15 17 19 21 23 25 27 29 31 33 35
Week
Volu
mn
(mL)
Floating
Sinking
Fig. 4.1. Egg production during the spawning period of Western Baltic Cod, Bornholms Lakseklækkeri, 2006.

34
0
2000
4000
6000
8000
10000
12000
14000
16000
18000
9 11 13 15 17 19 21 23 25 27 29 31 33 35
Week
Volu
mn
(mL)
Floating
Sinking
0
2000
4000
6000
8000
10000
12000
14000
16000
18000
9 11 13 15 17 19 21 23 25 27 29 31 33 35
Week
Volu
me
(mL)
Floating
Sinking
Fig. 4.2. Spawning frequency for a) small and b) large Baltic cod from the eastern Baltic, Bornholms Lakseklækkeri, Nexø , 2006.
4.1.2 Egg production 2007 The total egg production in 2007 was 273.2 L from a total 210 kg cod of both sexes. Eggs were separated just after collection into floating (those eggs that remained at the surface in 17psu water) and sunken (those eggs that sank to the bottom in 17psu water). Floating eggs were generally fertilized eggs, whereas sunken eggs were generally non-fertilized or dead eggs. 45% of the eggs produced during 2007 were fertilized. Assuming equal distribution of males and females the total egg production was 2.60 L kg-1 female fish and production of fertilized eggs 1.17 L kg-1 female fish. In broodstock tank 1, total egg production was 51.8 L of which 39% were fertilized. This tank consisted of larger cod (average total length: 60 cm, average weight: 2.2 kg; Table 3.2) collected during april 2007. Non-fertilized eggs were produced in weeks 10-11 (Fig. 4.3). Fertilized eggs were produced in the period week 20 to week 32 with peak production in week 27 where 6.3 L eggs were produced. The reproduction season was short (only 12 weeks) with a low production and low fertilization rate. Egg production averaged 0.54 L kg-1 fish for this group.
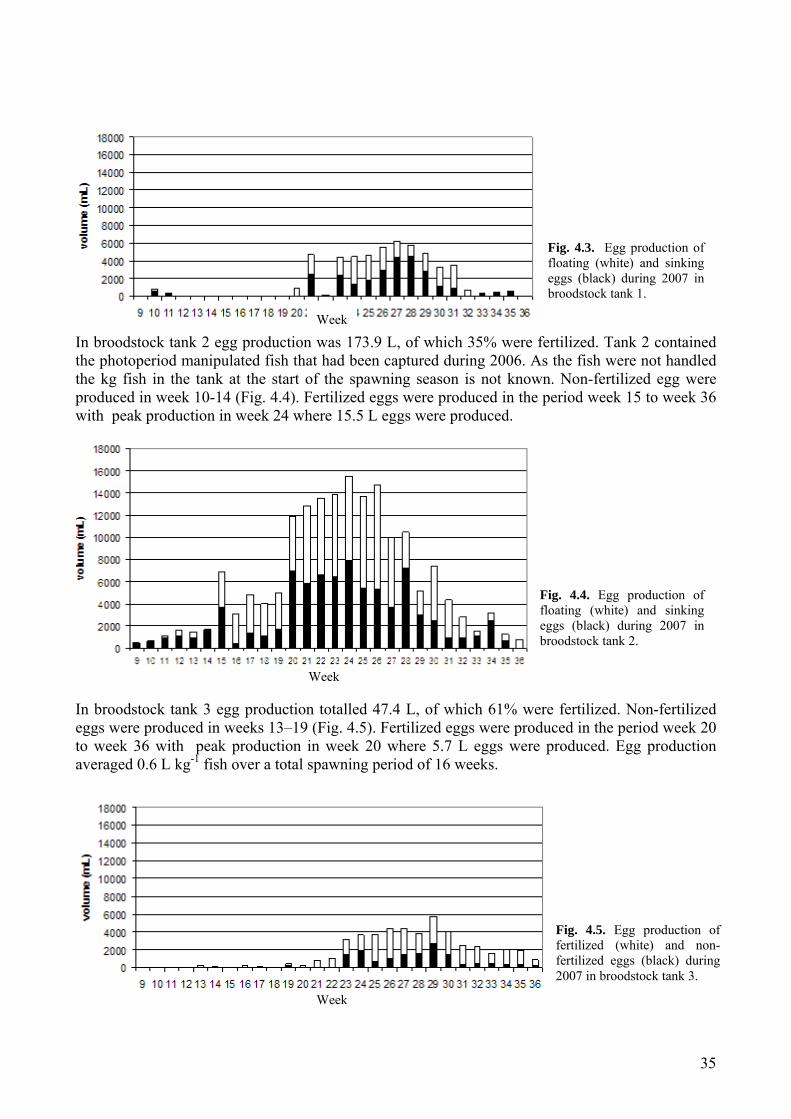
35
Week
Week
Week
In broodstock tank 2 egg production was 173.9 L, of which 35% were fertilized. Tank 2 contained the photoperiod manipulated fish that had been captured during 2006. As the fish were not handled the kg fish in the tank at the start of the spawning season is not known. Non-fertilized egg were produced in week 10-14 (Fig. 4.4). Fertilized eggs were produced in the period week 15 to week 36 with peak production in week 24 where 15.5 L eggs were produced. In broodstock tank 3 egg production totalled 47.4 L, of which 61% were fertilized. Non-fertilized eggs were produced in weeks 13–19 (Fig. 4.5). Fertilized eggs were produced in the period week 20 to week 36 with peak production in week 20 where 5.7 L eggs were produced. Egg production averaged 0.6 L kg-1 fish over a total spawning period of 16 weeks.
Fig. 4.3. Egg production of floating (white) and sinking eggs (black) during 2007 in broodstock tank 1.
Fig. 4.4. Egg production of floating (white) and sinking eggs (black) during 2007 in broodstock tank 2.
Fig. 4.5. Egg production of fertilized (white) and non-fertilized eggs (black) during 2007 in broodstock tank 3.

36
In 2006, larger and smaller fish were kept in separate tanks and a slightly higher egg production per kg fish was observed. This observation was expected and confirmed earlier findings that older fish produce more eggs than younger fish (Vallin and Nissling 2000). However, this did not hold true in 2007. Fish in tank 1 (2007) performed poorly and their production was lower than that from the smaller fish in tank 3 (2007). Also egg quality in terms of fertilization rate was comparatively also very poor. Larger fish were slower than smaller fish to adapt to captive conditions and were more difficult to wean to dry feed (own observations) and the larger fish in 2007 were caught just two months before the spawning season. These factors may have contributed to the poor results from the larger broodstock in 2007 (tank 1). Egg production from fish caught within the same year of spawning in captivity was observed to be lower in 2007 than in 2006 but may be due to a number of factors. The production output from fish in tank 3 in 2006 may be compared to that from tank 1 in 2007 since in both tanks larger fish were used as broodstock (Average total length and weight: 65 cm and 2.7 kg in 2006, 60 cm and 2.2 kg in 2007). In 2006 the fish were caught in March, whereas in 2007 they were caught in April. The closer proximity of capture of the 2007 breeders to the spawning season may have been stressful compromising the reproductive output and ultimately egg quality. Young cod captured the same year of production seem to perform well. Cod in tank 2 (2006) and tank 3 (2007) were similar in average length and weight. Fish in 2007 produced fewer eggs per kg fish, but this may be due to uneven sexual ratios in the tanks. Despite a lower production, eggs produced from the broodstock in tank 3 (2007) were of high quality. Fertilization rate was highest (61%) in these eggs and resulted in higher hatching rates. The advantages may be related to their lower vulnerability to handling and improved ability to adjust to culture conditions than larger fish. Fish in tank 2 were caught during 2006 and photoperiod manipulated to reproduce three months earlier in 2007. It is not possible to compare the reproductive output over the two years, as these fish were not measured between spawning seasons. In 2007 these fish produced the larger part of the total egg production contributing to 64% of the total egg production. However egg quality in terms of percentage fertilized eggs was poor (35%) and lower than in tank 3 (2007 fish). A possible explanation may be the compression of the restitution and maturation period enforced on the broodstock by the applied photoperiod manipulation to advance the spawning season. This may have compromised quality but not production. Another possible explanation may be the feed quality. Broodstock cod in tank 2 were fed commercially available broodstock diets for cod, but since this feed was developed for North Atlantic cod populations, it may be suboptimal for Baltic cod broodstock.
4.2 Egg quality
Egg quality was investigated using objective criteria such as egg size, dry weight and buoyancy. Baltic cod eggs differ from eggs produced by cod from other geographical areas by being larger, floating at lower salinities (Nissling & Westin, 1997) and having a thinner egg shell (Vallin & Nissling 2000; Nissling et al., 1994; Kjesbu et al., 1992). Vallin & Nissling (2000) relate egg size and buoyancy, whereas Nissling et al. (1994) showed a significant relationship between chorion thickness and buoyancy. The relationship between egg size and other quality parameters was therefore investigated.
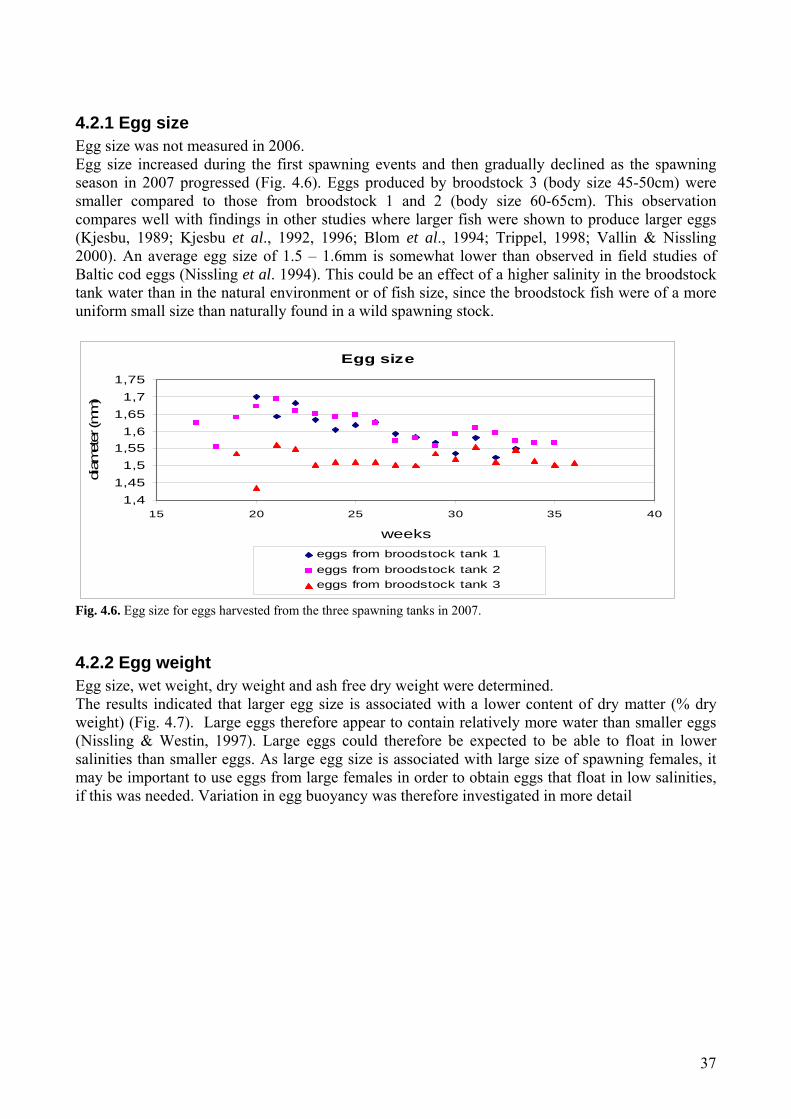
37
4.2.1 Egg size Egg size was not measured in 2006. Egg size increased during the first spawning events and then gradually declined as the spawning season in 2007 progressed (Fig. 4.6). Eggs produced by broodstock 3 (body size 45-50cm) were smaller compared to those from broodstock 1 and 2 (body size 60-65cm). This observation compares well with findings in other studies where larger fish were shown to produce larger eggs (Kjesbu, 1989; Kjesbu et al., 1992, 1996; Blom et al., 1994; Trippel, 1998; Vallin & Nissling 2000). An average egg size of 1.5 – 1.6mm is somewhat lower than observed in field studies of Baltic cod eggs (Nissling et al. 1994). This could be an effect of a higher salinity in the broodstock tank water than in the natural environment or of fish size, since the broodstock fish were of a more uniform small size than naturally found in a wild spawning stock.
Egg size
1,41,45
1,51,55
1,61,65
1,71,75
15 20 25 30 35 40
weeks
diam
eter
(mm
)
eggs from broodstock tank 1eggs from broodstock tank 2eggs from broodstock tank 3
Fig. 4.6. Egg size for eggs harvested from the three spawning tanks in 2007.
4.2.2 Egg weight Egg size, wet weight, dry weight and ash free dry weight were determined. The results indicated that larger egg size is associated with a lower content of dry matter (% dry weight) (Fig. 4.7). Large eggs therefore appear to contain relatively more water than smaller eggs (Nissling & Westin, 1997). Large eggs could therefore be expected to be able to float in lower salinities than smaller eggs. As large egg size is associated with large size of spawning females, it may be important to use eggs from large females in order to obtain eggs that float in low salinities, if this was needed. Variation in egg buoyancy was therefore investigated in more detail
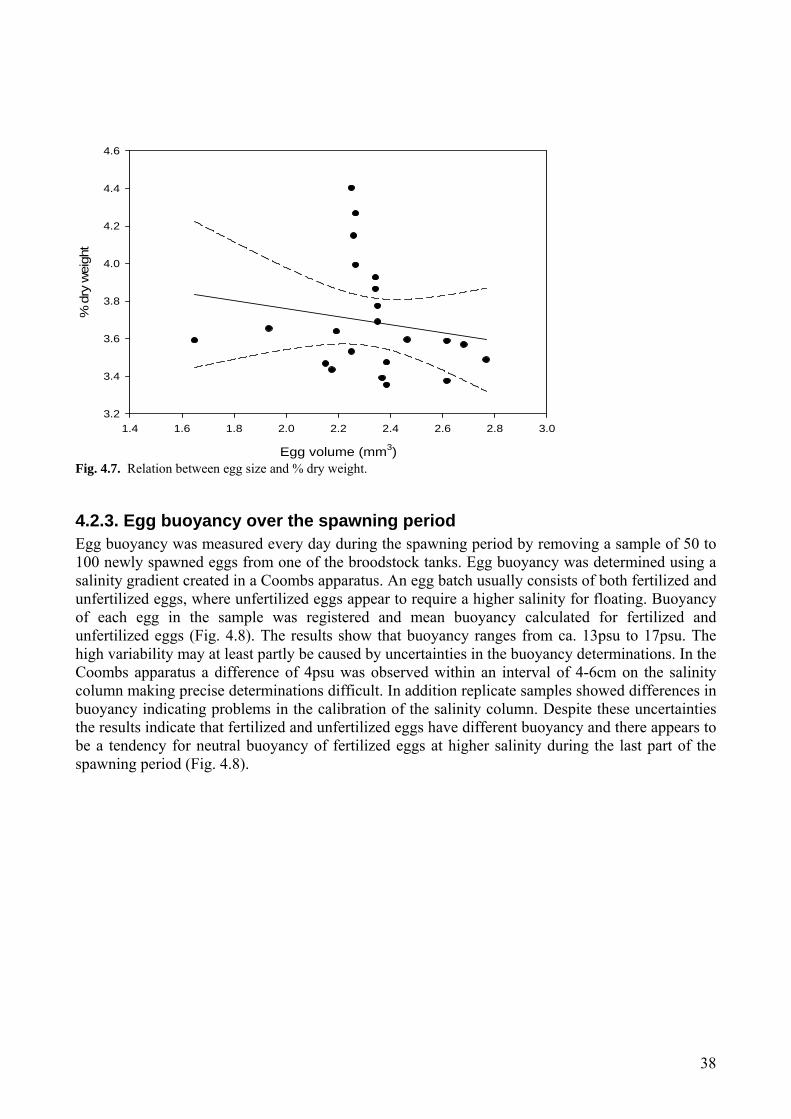
38
Egg volume (mm3)
1.4 1.6 1.8 2.0 2.2 2.4 2.6 2.8 3.0
% d
ry w
eigh
t
3.2
3.4
3.6
3.8
4.0
4.2
4.4
4.6
Fig. 4.7. Relation between egg size and % dry weight.
4.2.3. Egg buoyancy over the spawning period Egg buoyancy was measured every day during the spawning period by removing a sample of 50 to 100 newly spawned eggs from one of the broodstock tanks. Egg buoyancy was determined using a salinity gradient created in a Coombs apparatus. An egg batch usually consists of both fertilized and unfertilized eggs, where unfertilized eggs appear to require a higher salinity for floating. Buoyancy of each egg in the sample was registered and mean buoyancy calculated for fertilized and unfertilized eggs (Fig. 4.8). The results show that buoyancy ranges from ca. 13psu to 17psu. The high variability may at least partly be caused by uncertainties in the buoyancy determinations. In the Coombs apparatus a difference of 4psu was observed within an interval of 4-6cm on the salinity column making precise determinations difficult. In addition replicate samples showed differences in buoyancy indicating problems in the calibration of the salinity column. Despite these uncertainties the results indicate that fertilized and unfertilized eggs have different buoyancy and there appears to be a tendency for neutral buoyancy of fertilized eggs at higher salinity during the last part of the spawning period (Fig. 4.8).
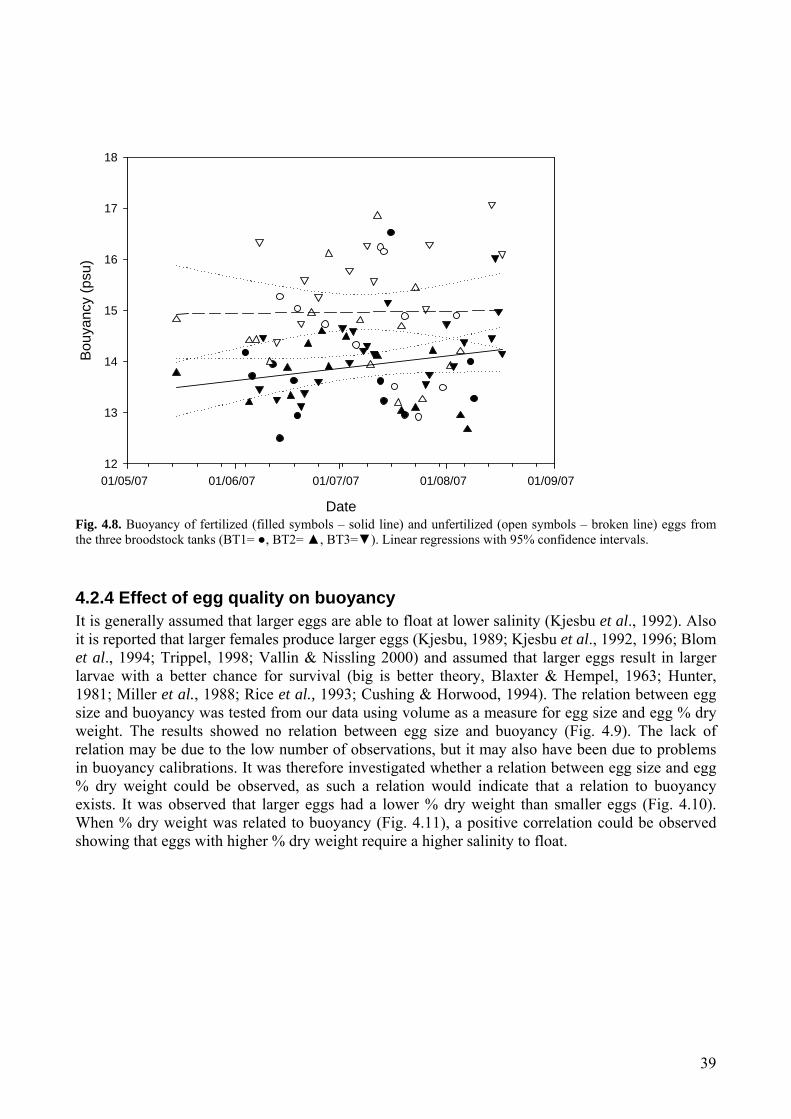
39
Date
01/05/07 01/06/07 01/07/07 01/08/07 01/09/07
Bouy
ancy
(psu
)
12
13
14
15
16
17
18
Fig. 4.8. Buoyancy of fertilized (filled symbols – solid line) and unfertilized (open symbols – broken line) eggs from the three broodstock tanks (BT1= ●, BT2= ▲, BT3=▼). Linear regressions with 95% confidence intervals.
4.2.4 Effect of egg quality on buoyancy It is generally assumed that larger eggs are able to float at lower salinity (Kjesbu et al., 1992). Also it is reported that larger females produce larger eggs (Kjesbu, 1989; Kjesbu et al., 1992, 1996; Blom et al., 1994; Trippel, 1998; Vallin & Nissling 2000) and assumed that larger eggs result in larger larvae with a better chance for survival (big is better theory, Blaxter & Hempel, 1963; Hunter, 1981; Miller et al., 1988; Rice et al., 1993; Cushing & Horwood, 1994). The relation between egg size and buoyancy was tested from our data using volume as a measure for egg size and egg % dry weight. The results showed no relation between egg size and buoyancy (Fig. 4.9). The lack of relation may be due to the low number of observations, but it may also have been due to problems in buoyancy calibrations. It was therefore investigated whether a relation between egg size and egg % dry weight could be observed, as such a relation would indicate that a relation to buoyancy exists. It was observed that larger eggs had a lower % dry weight than smaller eggs (Fig. 4.10). When % dry weight was related to buoyancy (Fig. 4.11), a positive correlation could be observed showing that eggs with higher % dry weight require a higher salinity to float.

40
Fig. 4.9. Relation between egg size and buoyancy.
Fig. 4.10. Relation between egg size and egg % dry weight.
Fig. 4.11. Relation between egg % dry weight and buoyancy.
Buoyancy function of egg% dry weight
12.40
12.60
12.80
13.00
13.20
13.40
13.60
13.80
14.00
3.3 3.4 3.5 3.6 3.7 3.8 3.9 4
E gg % dry w eight
Buo
yanc
y
EGG Dry weight % v ersus egg size (v olum e)
3
3.2
3.4
3.6
3.8
4
4.2
4.4
4.6
4.8
5
1.5 1.7 1.9 2.1 2.3 2.5 2.7 2.9
Volume
% d
ry w
eigh
t
Volum e - buoyancy
12.00
12.50
13.00
13.50
14.00
14.50
15.00
1.500 1.700 1.900 2.100 2.300 2.500 2.700
Volume (mm3)
Buo
yanc
y

41
4.3 Incubation techniques
During the past two years, there has been a substantial improvement in the success and efficiency of egg incubation. The first attempts of egg incubation took place in the quarantine facility without use of disinfection. After an efficient disinfection protocol was introduced, a substantial improvement in the survival to hatching was observed. Good hygiene has been adopted as a key element in the incubation process. In the second year of the project, dedicated manpower was allocated to take responsibility for egg incubation, egg disinfection and transfer from quarantine to the main hatchery. This resulted in a more constant larval production and increased hatching success.
4.3.1 Collection, disinfecting and transporting of eggs After collecting the eggs from the broodstock tanks they were disinfected for 10 minutes using 1.6 ml L-1 25% Glutaraldehyde. Due to veterinary criteria which required the broodstock to be kept in quarantine, only disinfected eggs could be transferred to the main hatchery. Prior to egg disinfection a sampling of the eggs was done to determine the hatching percent and general quality of the eggs. Egg batches showing a poor fertilization percent or high proportion of malformations were discarded. The decision whether to discard a batch or not was based on the quality and amount of eggs. As a rule of thumb a minimum of 200 ml “good” eggs had to be incubated meaning that 200 ml had to be remaining after subtracting the volume of malformed or unfertilized eggs. The following daily monitoring and tank cleaning routine was introduced that would ensure the best survival of eggs until hatching. Daily routines:
• Removal of dead eggs. In the first two days the dead eggs are removed twice daily. • One sampling of eggs for assessing egg density and thereby monitoring the mortality during
the incubation period. • Monitoring and adjustment of water inflow rate to the incubation tanks maintaining the flow
so that it is sufficient to keep eggs well and homogenously distributed in the tank (avoiding or minimising contact between eggs) and thereby reducing the chance of infection from egg to egg.
• Regulation of aeration to keep eggs well dispersed in the egg incubators. • Monitoring of individual incubator temperature in the morning and afternoon. • Monitoring of oxygen in incubation tanks once a day. • Disinfection and washing of equipment used to clean the tanks and monitor the eggs.
Periodic routines:
• Adjusting the inflow of water during hatching of the larvae. • The incubators are covered to create dark conditions during hatching and during the first
days after hatching. • Ammonia nitrite and nitrate are monitored weekly • After release of larvae, the incubators are cleaned, disinfected and dried before reuse.

42
4.3.2 Temperature One of the key factors that affect egg incubation time is temperature. According to Buchmann (1994) temperature for incubation of Baltic cod eggs should be kept below 12 ˚C, with the optimum temperature being around 8˚C. Nissling (2004) reports no significant effect on number of viable hatched larvae of Baltic cod in the temperature range 3 to 9˚C (Nissling 2004). However, the number of malformed cod larvae from Atlantic cod has been found to increase significantly as egg incubation temperature increases from 6˚C to 11˚C (Fitzimmons and Perutz 2006). Based on this information, an incubation temperature of 7˚C was chosen. Incubation at this temperature would allow a margin for temperature deviations of up to 2-3 degrees without resulting in egg fatalities. At 7 ˚C, incubation time from spawning to hatch was 12 days.
4.3.3 Water flow Water circulation was found to be very important, not directly in terms of survival or hatching success, but rather as a method to keep all eggs well suspended and making sure the eggs did not clump together. Air flow in the tanks could also be used for this, but the air bubbles were observed to have a negative effect on survival when the air flow was too high. The optimum water flow rate was found to be 60-70 L hour-1 in an 80 litre conical incubation tank. A higher flow rate enhanced the risk of eggs clumping together on the mesh covering the outflow (see Fig. 2.6). A low flow rate resulted in eggs rising to the water surface and clumping. All clumping of eggs has to be avoided in order to keep potential horizontal infection to a minimum.
4.3.4 Air supply Bubbling air in the water was used mainly to keep the eggs suspended and homogeneously distributed. The air supply was held at a moderate level (approximately 4-5 bubbles per second) but once the larvae started hatching, the air supply was reduced as the larvae were found to be less tolerant to high turbidity.
4.3.5 Oxygen Oxygen was monitored daily. It was not a problem to keep the water well saturated (10-12.5 mg/L oxygen). In all incubations oxygen level was far above the lower threshold of 5 ml L-1, which has been demonstrated to compromise the survival of Baltic cod eggs (Wieland et al. 1994)
4.3.6 Light A constant light regime with18 hours light (20-50 lux) and 6 hours dark was used. Once the larvae started hatching, the incubation tanks were covered with lids to minimise stress for the newly hatched larvae.
4.3.7 Salinity The minimum water salinity used for incubation was determined by the egg’s neutral buoyancy. The incubation system is dependent on having a salinity where dead eggs and shells can be easily separated from living viable eggs. At the right salinity dead eggs and shells sinks to the bottom of the tank and can be removed relatively easily by siphoning, whereas living eggs will float and remain in the tank after cleaning. The incubation salinity in the first year’s production was maintained at 21 ‰. During the second year (2007) the salinity was lowered to 16 ‰. It was decided that lower incubation salinity was necessary, particularly for the newly hatched larvae, in order to be as close to the natural spawning salinity as found in the Bornholm basin. Several articles have indicated that there is a positive relationship between ambient water salinity within the
43
broodstock tanks and the salinity of neutral buoyancy of resulting larvae produced (Vallin and Nissling 2000). Therefore both the optimal salinity in the broodstock tanks and the incubation tanks need to be further investigated.
4.3.8 Hygiene To keep incubation mortality at a low level, a very high level of hygiene was imposed, when working with the incubation of eggs. Virkon S® (2% solution) was used to disinfect cleaning tools and to clean the tanks between incubations. One dedicated person was in charge of taking care of the incubation system in order to reduce the chances of cross infection from other locations in the hatchery.
4.4 Hatching rates, success
In nature, only a very small proportion of eggs spawned survive to hatch. Wieland et al. (2000) estimated a natural survival from egg to hatch to be only 0.1% in Bornholm Basin. In the laboratory in the absence of predators and with the possibility of providing optimal hydrographical conditions a higher survival can be obtained. Several parameters were monitored during incubation to asses the quality and identify problem stages in the developing embryos. Fertilization rate was registered in 36 egg batches in 2006 and 62 egg batches in 2007. On average 66% were fertilized in 2006 and 50% fertilized in 2007. Mortality during the egg stage was monitored in 16 egg batches in 2006 and 28 egg batches in 2007. On average 38% of the fertilized eggs survived until time of hatching based on the results for 2007. In 2006, the mean hatching percent was 23% based on the number hatching relative to number fertilized eggs during 6 incubations. Some eggs do not hatch. On average 70% of the eggs surviving to time of hatching actually hatched to be larvae. Larval mortality was monitored. Survival until day 3 after hatching was monitored in 12 batches, which had an average survival 53% from hatching. Total survival from spawning to day 3 after hatching was on average 8%, a figure lower than usually observed for marine fish species and reflecting the particular vulnerability of Baltic cod. An example of cumulative mortality during egg and larval phases is given in Fig. 4.5a. Clearly, more work needs to be carried out to improve efficiency for the mass-production of Baltic cod larvae.

44
Date
16-04-07 23-04-07 30-04-07 07-05-07 14-05-07
Dai
ly m
orta
lity
(%)
0
20
40
60
80
100
Fig. 4.12. Daily mortality (%; y-axis) of eggs and larvae from egg-batch 14 April 2007. The points are based on daily assessments of number eggs/larvae remaining in the tank relative to start number.
4.5 References
Blaxter, J.H.S., Hempel, G. 1963. The influence of egg size on herring larvae. Journal du Conseil, Conseil Permanent International pour l'Exploration de la Mer 28 : 211-240. Blom, G., Svåsand, T., Jørstad, K.E., Otterå, H. Paulsen, O.I., Holm, J.C. 1994. Comparative survival and growth of two strains of Atlantic cod (Gadus morhua) through the early life stages in a marine pond. Canadian Journal of Fisheries and Aquatic Sciences 51: 1012-1023. Cushing, D.H., Horwood, J.W. 1994. The growth and death of fish larvae. Journal of Plankton Research 16: 291-300. Fitzsimmons, S.D., Perutz, M. 2006. Effects of egg incubation temperature on survival, prevalence and types of malformations in vertebral column of Atlantic cod (Gadus morhua) larvae. Bulletin of the European Association of Fish Pathologists 26: 80-86. Hunter, J.R. 1981. Feeding ecology and predation of marine fish larvae. In Marine Fish Larvae, morphology, ecology and relation to fisheries p.32-77. (Lasker, R. ed) Seattle WA, USA: University of Washington Press. Marochin C. 2007. Suivi quantitative et qualitative de la production et du développement d’oefs de morue baltique Gadus morhua. Masters thesis, Caen University, France.

45
Kjesbu, O.S. 1989. The spawning activity of cod Gadus morhua L. Journal of Fish Biology 52: 1241-1258. Kjesbu, O.S., Kryvi, H., Sundby, S., Solemdal, P. 1992. Buoyancy variations in eggs of Atlantic cod (Gadus morhua L.) in relation to chorion thickness and egg size: theory and observations. J. Fish. Biol. 41: 581-599. Kjesbu, O.S., Solemdal, P., Bratland, P., Fonn, M. 1996. Variation in annual egg production in individual captive Atlantic cod (Gadus morhua). Canadian Journal of Fisheries and Aquatic Sciences 53: 610-620. Miller, T.J., Crowder, L.B., Rice, J.A., Marshall, E.A. 1988. Larval size and recruitment mechanisms infishes: toward a conceptual framework. Canadian Journal of Fisheries and Aquatic Sciences 45: 1657-1670. Nissling, A. 2004. Effects of temperature on egg and larval survival of cod (Gadus morhua) and sprat (Sprattus sprattus) in the Baltic Sea - implications for stock development. Hydrobiologia 514: 115-123. Nissling, A., Kryvi, H., Vallin, L. 1994. Variation in egg buoyancy of Baltic cod Gadus morhua and its implications for egg survival in prevailing conditions in the Baltic Sea. Mar. Ecol. Prog. Ser. 110: 67-74. Nissling, A., Westin, L. 1997. Salinity requirements for successful spawning of Baltic and Belt Sea cod and the potential for cod stock interactions in the Baltic Sea. Mar. Ecol. Prog. Ser. 152: 261-271. Rice, J.A., Miller, T.J., Rose. K.A., Crowder, L.B., Marshall, E.A., Trebitz, A.S., De Angelis, D.L. 1993. Growth rate variation and larval survival: inferences from an individual-based size-dependent predation model. Canadian Journal of Fisheries and Aquatic Science 50: 133-142. Trippel, E.A. 1998. Egg size and viability and seasonal offspring production of young Atlantic cod. Transactions of the American Fisheries Society 127: 339-359. Vallin, L., Nissling, A. 2000. Maternal effects on egg size and egg buoyancy of Baltic cod, Gadus morhua Implications for stock structure effects on recruitment. Fisheries Research 49: 21-37. Wieland, K., Waller, U., Schnack, D. 1994. Development of Baltic cod eggs at different levels of temperature and oxygen content. Dana 10: 163-177.

46
Chapter 5 Larval production Josianne G. Støttrup Senior Research Scientist, Maria C. Røjbek, Research assistant, Sune Riis Sørensen, Research assistant, DTU Aqua. Niko Janke Masters thesis student, Myron Peck, associated professor, University of Hamburg, Germany.
5.1 First feeding, WOO
In Atlantic cod, a functional jaw develops day 4-6 after hatching at 5ºC (Ellertsen et al. 1980; Fossum 1986). First-feeding (FF) occurred day 5 and point-of-no-return (PNR) day 11 at 5ºC (Yin and Blaxter 1987a). Examination of gut flora revealed that PNR might happen earlier since the gut epithelia already were obviously degenerated by day 9 after hatching (Kjörsvik et al. 1991). Similar studies have not been conducted on Baltic cod, but the relationship between age and developmental stage was similar to that in Atlantic cod larvae (Grønkjær and Wieland 1997). Development and survival in cod larvae is effected by water temperature. Optimal temperatures for growth and development in Baltic cod larvae are between 3 and 9ºC (Nissling 2004). Larval tolerance to higher temperatures seems to decrease as the yolk is absorbed and the effects of starvation increase (Yin and Blaxter 1987b). The objective for these set of experiments was therefore, to pin-point the Window of Opportunity (WOO; Fig. 5.1) for releasing first-feeding larvae. This should be at a time when it was not too early for feeding and not too late that the larvae have become too moribund to initiate feeding.
Fig. 5.1. A theoretical curve for first-feeding (FF) and point-of-no-return (PNR) in larvae. The period between FF and PNR is termed WOO releases of first-feeding larvae should be undertaken within this timeframe. The experiments were conducted in triplicate, but due to constriction of space they had to be conducted on different batches of larvae. For this purpose 7ºC treatment was used as reference and repeated in both experiments. Larvae from holding tanks at the experimental temperatures were transferred daily to the experimental tanks where they were fed live copepod nauplii for a period of four hours. At the end of the feeding period the larvae were examined for feeding.

47
01020304050607080
2 3 4 5 6 7 8 9 10 11 12 13
DAH
% F
F 7 deg13 deg15 deg
01020304050607080
2 3 4 5 6 7 8 9 10 11 12 13DAH
%FF
7deg ii9 deg11 deg
Fig. 5.2. First-feeding (FF) at different temperatures. DAH is days after hatch. At 7ºC feeding was not initiated before 6-7 days after hatching and FF occurred on day 9 in both bathes although the percentage of feeding in general was not very high in the second experiment (Fig. 5.2). Judging by the results of the first experiment the WOO was about 4 days at 7ºC. At the higher temperatures the larvae develop faster and start to feed already on day 2 although FF was initiated day 3 for larvae kept at 15ºC and day 4 at 13ºC. The WOO period was also around 4 days, although feeding was slightly lower than 50% in several of the tanks. First feeding period was around one day longer for larvae kept at 11ºC. Feeding was initiated day 5 (11ºC) and 6 (9ºC) and 5 and 4 days respectively. Temperature influences the rate of development in the larvae and the timing of FF. In most cases the WOO is around 4 days, but is delayed from day 9-12 at 7ºC, whereas larvae could be released on day 5-9 if kept at a temperature of 11ºC.
48
5.2 Larval rearing techniques, conditioning
Once the larvae hatch they remain in the incubation tanks until they are marked and concentrated for release. In 2006 and 2007 the temperature in the incubation unit was kept at 7ºC. The larvae should ideally be released at the water depth where the temperature is similar to the larval rearing temperature, but preferably in the water layer above 45 m, since feeding cod larvae usually stay around 20-40 m (Grønkjær and Wieland, 1997; Grønkjær et al., 1997), where the abundance of copepod nauplii is high. In the spring this is not an issue as the temperature in the upper layers is around 4-6ºC in May and 4-8ºC or 9ºC in June (Grønkjær and Wieland 1997), but as the salinity is low (7psu) the larvae need to be active to remain in the upper photic zone. The halocline occurs at around 45 m and neutral buoyancy can be first achieved at around 60 m where temperature is around 3ºC, and where oxygen levels may lower than above the halocline (Grønkjær and Wieland 1997). In July the temperature increases at the surface but is cooler with depth. In July average profiles from 40 years of data showed temperatures of 9ºC at 20m depth falling to 4ºC at 50 m, where the halocline was generally found (Neuenfeldt and Beyer 2003). A temperature of around 7ºC is in July found above the halocline at around 25m (Neuenfeldt and Beyer 2003) or down to 35-40 m (Grønkjær and Wieland 1997). As the season progresses, however, it may be necessary to release larvae in warmer waters or to release them below the halocline. It is therefore important to know what tolerance larvae have for sudden temperature shifts and also how a sudden temperature shift may influence the initiation of first-feeding. The objective of these set of experiments was therefore to examine the larval tolerance to sudden exposure to higher or lower temperature and how this affected first-feeding. The experimental setup was similar to that described under section 5.1, except that the larvae were kept in the incubation tanks at 7ºC throughout the experiments. Each day 20 larvae were transferred to triplicate treatments at different temperatures from 3 to 15ºC with 2ºC intervals. The larvae were fed nauplii of the copepod Acartia tonsa for 24 h, whereupon both survival and feeding was examined. Survival was generally good and Baltic cod larvae seem highly tolerant to a sudden temperature change to both colder and warmer temperatures within the range examined. Feeding was initiated between day 5 and 6 after hatching when transferred to 5, 7 or 9ºC until day 11 (Fig. 5.3). On the other hand when transferred directly to higher temperatures (>11ºC), feeding incidence was low and in only a few replicates did 50% or more of the larvae initiated feeding.

49
0
20
40
60
80
100
5 6 7 8 9 10 11 12
DAH
% F
eedi
ng
3579111315
Fig. 5.3. First feeding in larvae that were transferred directly from 7ºC to test tanks with different temperatures ranging from 3ºC to 15ºC and fed A. tonsa nauplii for 24 h. DAH refers to days after hatch. The results indicated that release into temperatures more than 2ºC higher may impact first feeding incidence. The larvae were still alive and it is possible that with more time they may have commenced feeding, but they may also be placed at a disadvantage and therefore the releases should be made at water temperatures as close to the rearing temperatures as possible. Since larvae are able to feed well at 11ºC (Fig. 5.2), they would need to be adapted to ambient temperatures prior to release if the ambient temperature is different to the larval rearing temperature.
5.3 Factors effecting larval growth, survival Cod in the eastern Baltic Sea live in stratified brackish water conditions with a salinity of 7psu at the surface and approximately 17psu at the bottom. In Bornholm Basin the salinity is between 7 psu and 10 psu in the first 50-60 meters. Beyond this depth a halocline separates this low saline water from the heavy saltwater below with salinities of 11psu to 17psu (Tomkiewicz et al. 1998). Apart from changes in salinity, the larvae experience different photoperiods relative to the time of spawning. These parameters together with temperature as discussed in sections 4.1 and 4.2 affect larval growth and survival which are important for the outcome of larval releases. In the following a series of experiments are described examining the impact of these parameters with the aim of developing an integrated strategy for releasing larvae.
5.3.1 Buoyancy and salinity preference The eggs of the Baltic cod are neutrally buoyant at depth below 55 m and here they develop and hatch. Once the larvae hatch, they start utilizing their yolk sac and during this stage they need to move up into the upper photic zone in order to be able to find and catch food. The larvae are hyper-osmotic in comparison to the upper layers and the upwards migration probably demands an active swimming behaviour as described by Grønkjær and Wieland (1997). This migration into hyper-saline water requires the larvae to be in good condition and with a well functioning osmoregulative system. In order to understand this process and define the problems the larvae face, it is vital to know how they react to sudden changes in salinity and to these hyper- osmotic environments. This is very important when designing an optimal release strategy for first feeding larvae in the Baltic.

50
The objective for this experiment was to show the preferred salinity and the buoyancy of the cod larvae in the period after hatch. It was also of great interest to find the time at which the larvae were actively swimming as this information was vital in determining the right age for release. The larvae were exposed to a salinity gradient and the positions in this gradient were noted as the preferred salinity. A comparison was made between the passive neutral buoyancy, measured on sedated larvae, and the preferred salinity in active larvae. In 2006, the experiment was carried out on starved larvae and positions noted after 10, 30 and 60 minutes. In 2007 the same experiment was repeated using a comparative approach with both starved and fed larvae. The positions were noted after 10 and 40 mins. For the determination of buoyancy and salinity preferences a salinity column was used. The column was similar to that described by Coombs (1981), in which saline water is slowly added to freshwater at a constant rate where it is mixed and released into the bottom of a tall column container, thus building the gradient. Fig. 5.4 is a schematic diagram of the system used. The column used in 2006 was slightly smaller (6L) than the one used in 2007 (10L).
Ten fed and unfed larvae were transferred daily to the salinity gradient column. In order to sedate the larvae, 25 mg L-1 Ethyl 3-aminobenzoate methansulfonate (MS222) was added to the salinity column (Sclafani et al., 1997). After reading larval positions within the column, the clearing basket was activated emptying the column. Triplicate measurements were made for each treatment daily. All the experiments in both 2006 and 2007 were performed at 7ºC.
f
gh
d
e
b45 ‰
a
ab
c
f
g
Cirkulation pump
Fig. 5.4. The set up for producing a salinity gradient. A container with high salinity water (f) constantly supplies a round flask, containing fresh water (d), with high saline water. A magnet stirrer (e) mixes this water and the pump (b) delivers the water with a constant flow and increasing salinity down the bottom of the column, c. The salinity in the gradient is indicated using specially calibrated density floats, h, where each ball has a specified salinity making it possible to calculate the salinity at various positions in the column. The machine, a, is used for pulling a basket up or down through the column, allowing the removal of measured objects and calibration floats without disturbing the gradient. This clearing basket is made from a thin acrylic frame holding a 500 µm mesh to filter out larvae. When the clearing basket is pulled up at a speed of 30 mm per minute the linearity and precision of the gradient are not affected.

51
The results in 2007 showed no or minimal differences in larval positioning after 10 or 40 minutes and for this reason only results from 40 minutes are presented here (Fig. 5.6). There seems to be a difference in salinity between the two experiments (2006 vs. 2007) (Fig. 5.5 vs 5.6) and the larvae from 2006 seem heavier because they start at 15 psu day 0 to 3 and rising to 20 psu at day 4 and the buoyancy decreases to 25-30 psu on day 10 and 11. In comparison, the larvae from 2007 started at
Fig. 5.5. 2006 results from observing sedated larvae in a salinity gradient column are shown on the left. The salinity curve is derived from the mean of three readings (after 10, 30 and 60 minutes) and each salinity is the median salinity of 30 larvae (3 x 10) tested. The X-axis is days post hatch and the Y-axis salinity. To the right the same type of results are shown but with active larvae. None of the larvae were fed during the experiment and the salinity curves include standard deviation.
Sedated Larvae
0
5
10
15
20
25
30
35
40
0 1 2 3 4 5 6 7 8 9 10 11Day aft. hatch
salinity Active larva (no food)
0
5
10
15
20
25
30
35
40
1 2 3 4 5 6 7 8 9 10 11 12Day aft. hatch
Salinity
Fig. 5.6. Median salinity preference in ‰ of fed (black curve) and starved larvae (gray curve) 40 minutes after introduction to the density gradient column. The curves are shown with +SD. The % proportion of larvae found above 8 psu after 40 minutes is plotted against the secondary value axis. Eight psu represents in situ salinities above the halocline in Bornholm Basin. This experiment was conducted in 2007.
Salinitypreference of fed and starved larvae (±SD)
5
7
9
11
13
15
17
19
21
23
25
dag 0 dag 1 dag 2 dag 3 dag 4 dag 5 dag 6 dag 7 dag 8 dag 9 dag 10 dag 11
Salinity (‰)
0
5
10
15
20
25
30
35
40% larvae lighter than 8 ppt
Fed larvae salinity pref.
Starved larvae salinity pref.
% starved above 8 ppt"
% fed above 8 ppt
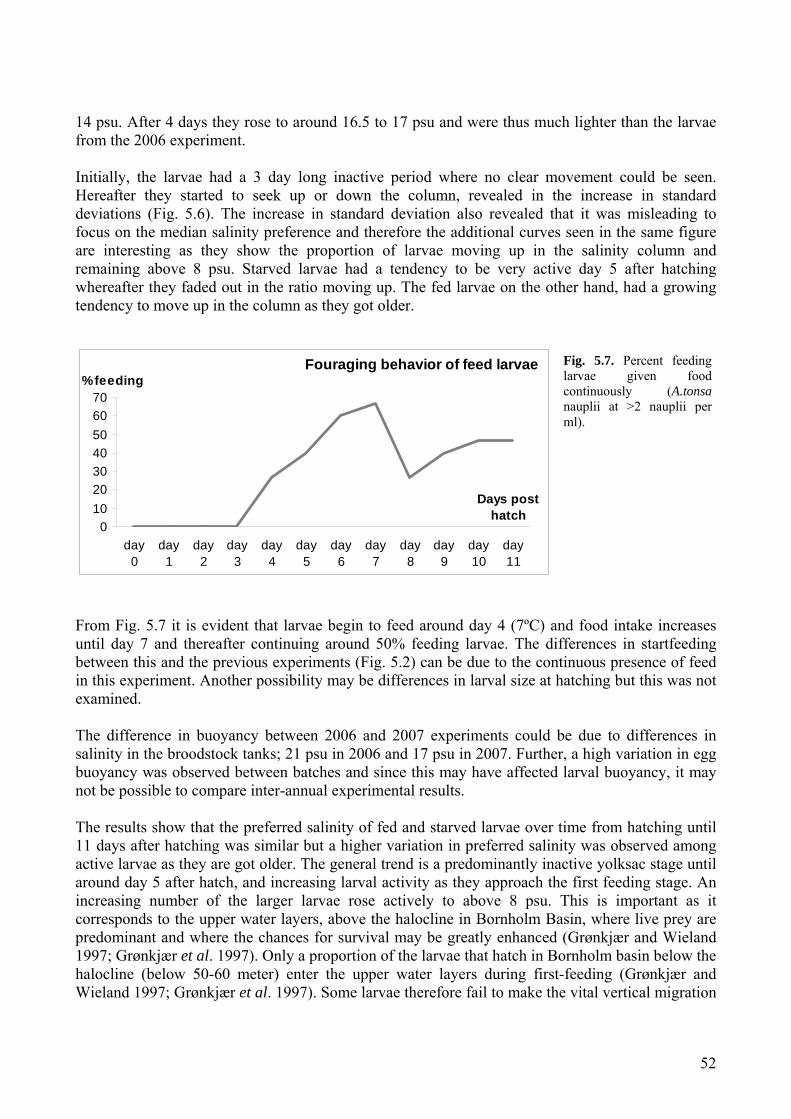
52
14 psu. After 4 days they rose to around 16.5 to 17 psu and were thus much lighter than the larvae from the 2006 experiment. Initially, the larvae had a 3 day long inactive period where no clear movement could be seen. Hereafter they started to seek up or down the column, revealed in the increase in standard deviations (Fig. 5.6). The increase in standard deviation also revealed that it was misleading to focus on the median salinity preference and therefore the additional curves seen in the same figure are interesting as they show the proportion of larvae moving up in the salinity column and remaining above 8 psu. Starved larvae had a tendency to be very active day 5 after hatching whereafter they faded out in the ratio moving up. The fed larvae on the other hand, had a growing tendency to move up in the column as they got older.
From Fig. 5.7 it is evident that larvae begin to feed around day 4 (7ºC) and food intake increases until day 7 and thereafter continuing around 50% feeding larvae. The differences in startfeeding between this and the previous experiments (Fig. 5.2) can be due to the continuous presence of feed in this experiment. Another possibility may be differences in larval size at hatching but this was not examined. The difference in buoyancy between 2006 and 2007 experiments could be due to differences in salinity in the broodstock tanks; 21 psu in 2006 and 17 psu in 2007. Further, a high variation in egg buoyancy was observed between batches and since this may have affected larval buoyancy, it may not be possible to compare inter-annual experimental results. The results show that the preferred salinity of fed and starved larvae over time from hatching until 11 days after hatching was similar but a higher variation in preferred salinity was observed among active larvae as they are got older. The general trend is a predominantly inactive yolksac stage until around day 5 after hatch, and increasing larval activity as they approach the first feeding stage. An increasing number of the larger larvae rose actively to above 8 psu. This is important as it corresponds to the upper water layers, above the halocline in Bornholm Basin, where live prey are predominant and where the chances for survival may be greatly enhanced (Grønkjær and Wieland 1997; Grønkjær et al. 1997). Only a proportion of the larvae that hatch in Bornholm basin below the halocline (below 50-60 meter) enter the upper water layers during first-feeding (Grønkjær and Wieland 1997; Grønkjær et al. 1997). Some larvae therefore fail to make the vital vertical migration
Fouraging behavior of feed larvae
010203040506070
day0
day1
day2
day3
day4
day5
day6
day7
day8
day9
day10
day11
% feeding
Days post hatch
Fig. 5.7. Percent feeding larvae given food continuously (A.tonsa nauplii at >2 nauplii per ml).
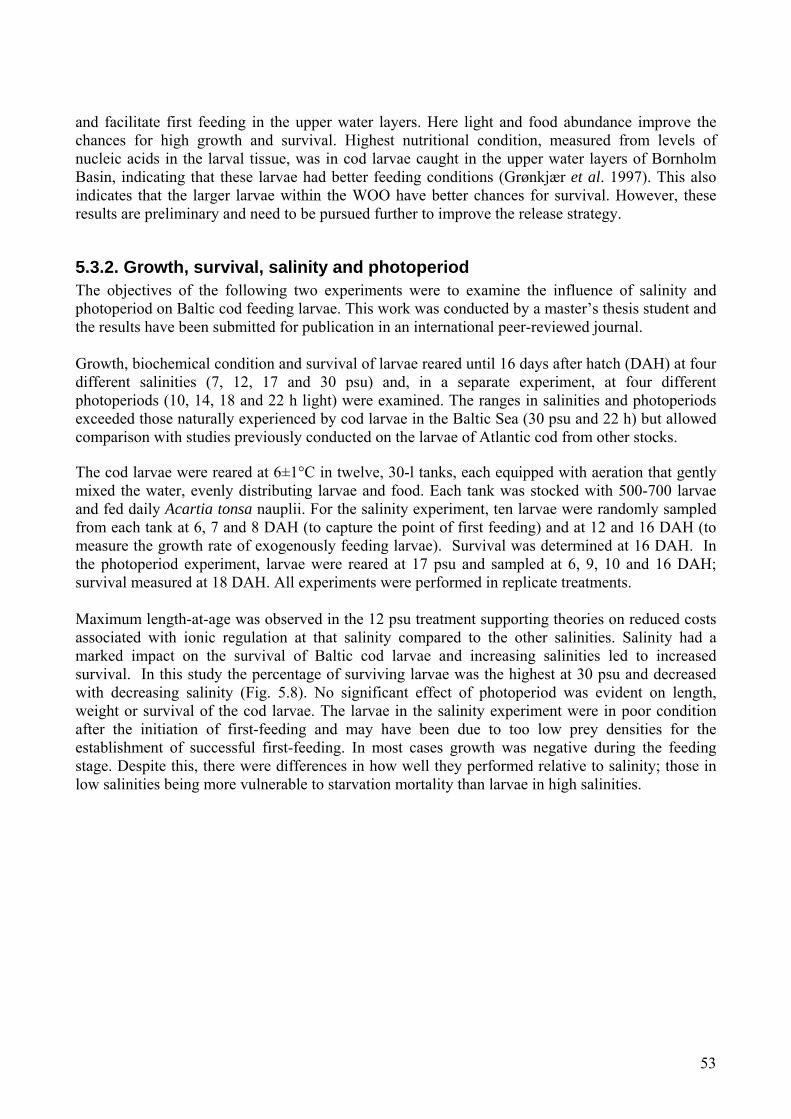
53
and facilitate first feeding in the upper water layers. Here light and food abundance improve the chances for high growth and survival. Highest nutritional condition, measured from levels of nucleic acids in the larval tissue, was in cod larvae caught in the upper water layers of Bornholm Basin, indicating that these larvae had better feeding conditions (Grønkjær et al. 1997). This also indicates that the larger larvae within the WOO have better chances for survival. However, these results are preliminary and need to be pursued further to improve the release strategy.
5.3.2. Growth, survival, salinity and photoperiod The objectives of the following two experiments were to examine the influence of salinity and photoperiod on Baltic cod feeding larvae. This work was conducted by a master’s thesis student and the results have been submitted for publication in an international peer-reviewed journal. Growth, biochemical condition and survival of larvae reared until 16 days after hatch (DAH) at four different salinities (7, 12, 17 and 30 psu) and, in a separate experiment, at four different photoperiods (10, 14, 18 and 22 h light) were examined. The ranges in salinities and photoperiods exceeded those naturally experienced by cod larvae in the Baltic Sea (30 psu and 22 h) but allowed comparison with studies previously conducted on the larvae of Atlantic cod from other stocks. The cod larvae were reared at 6±1°C in twelve, 30-l tanks, each equipped with aeration that gently mixed the water, evenly distributing larvae and food. Each tank was stocked with 500-700 larvae and fed daily Acartia tonsa nauplii. For the salinity experiment, ten larvae were randomly sampled from each tank at 6, 7 and 8 DAH (to capture the point of first feeding) and at 12 and 16 DAH (to measure the growth rate of exogenously feeding larvae). Survival was determined at 16 DAH. In the photoperiod experiment, larvae were reared at 17 psu and sampled at 6, 9, 10 and 16 DAH; survival measured at 18 DAH. All experiments were performed in replicate treatments. Maximum length-at-age was observed in the 12 psu treatment supporting theories on reduced costs associated with ionic regulation at that salinity compared to the other salinities. Salinity had a marked impact on the survival of Baltic cod larvae and increasing salinities led to increased survival. In this study the percentage of surviving larvae was the highest at 30 psu and decreased with decreasing salinity (Fig. 5.8). No significant effect of photoperiod was evident on length, weight or survival of the cod larvae. The larvae in the salinity experiment were in poor condition after the initiation of first-feeding and may have been due to too low prey densities for the establishment of successful first-feeding. In most cases growth was negative during the feeding stage. Despite this, there were differences in how well they performed relative to salinity; those in low salinities being more vulnerable to starvation mortality than larvae in high salinities.
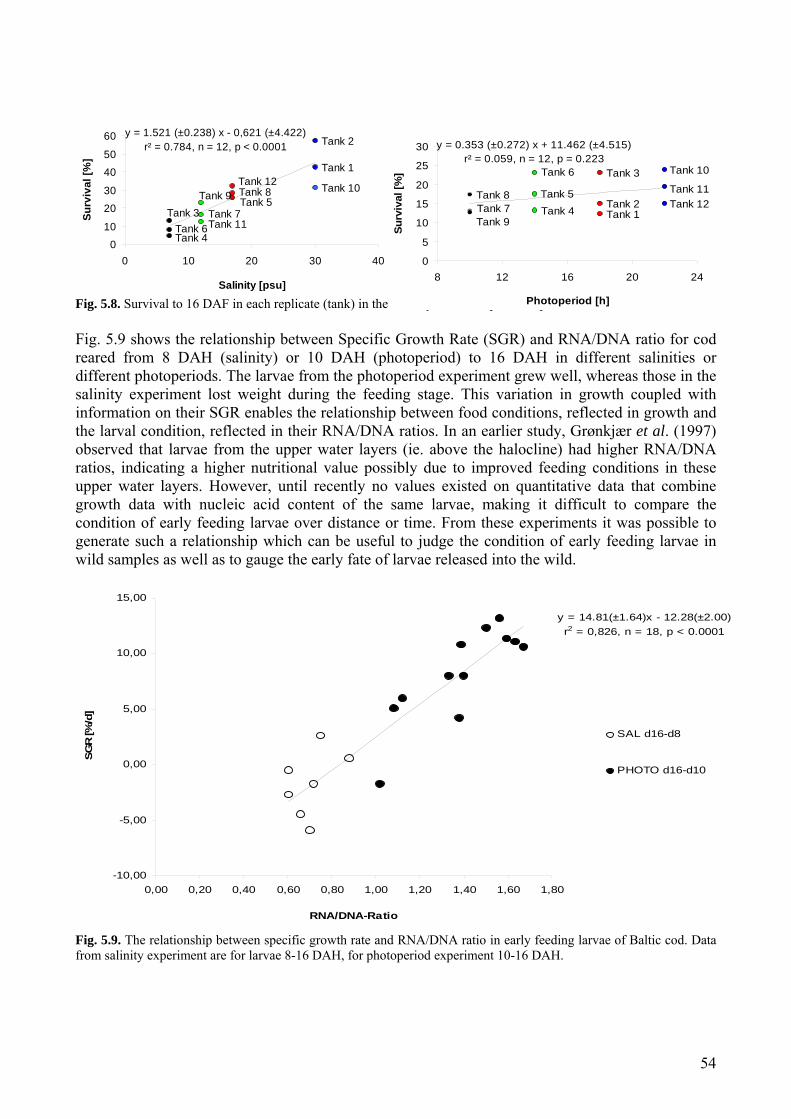
54
Fig. 5.8. Survival to 16 DAF in each replicate (tank) in the Salinity and Photoperiod experiment. Fig. 5.9 shows the relationship between Specific Growth Rate (SGR) and RNA/DNA ratio for cod reared from 8 DAH (salinity) or 10 DAH (photoperiod) to 16 DAH in different salinities or different photoperiods. The larvae from the photoperiod experiment grew well, whereas those in the salinity experiment lost weight during the feeding stage. This variation in growth coupled with information on their SGR enables the relationship between food conditions, reflected in growth and the larval condition, reflected in their RNA/DNA ratios. In an earlier study, Grønkjær et al. (1997) observed that larvae from the upper water layers (ie. above the halocline) had higher RNA/DNA ratios, indicating a higher nutritional value possibly due to improved feeding conditions in these upper water layers. However, until recently no values existed on quantitative data that combine growth data with nucleic acid content of the same larvae, making it difficult to compare the condition of early feeding larvae over distance or time. From these experiments it was possible to generate such a relationship which can be useful to judge the condition of early feeding larvae in wild samples as well as to gauge the early fate of larvae released into the wild. Fig. 5.9. The relationship between specific growth rate and RNA/DNA ratio in early feeding larvae of Baltic cod. Data from salinity experiment are for larvae 8-16 DAH, for photoperiod experiment 10-16 DAH.
Tank 6Tank 4
Tank 3Tank 11
Tank 9
Tank 7
Tank 12Tank 8Tank 5
Tank 10
Tank 2
Tank 1
y = 1.521 (±0.238) x - 0,621 (±4.422)r² = 0.784, n = 12, p < 0.0001
0
10
20
30
40
50
60
0 10 20 30 40
Salinity [psu]
Surv
ival
[%]
Tank 12Tank 11
Tank 10
Tank 9
Tank 8Tank 7
Tank 6
Tank 5Tank 4
Tank 3
Tank 2Tank 1
y = 0.353 (±0.272) x + 11.462 (±4.515)r² = 0.059, n = 12, p = 0.223
0
5
10
15
20
25
30
8 12 16 20 24
Photoperiod [h]
Surv
ival
[%]
y = 14.81(±1.64)x - 12.28(±2.00)r2 = 0,826, n = 18, p < 0.0001
-10,00
-5,00
0,00
5,00
10,00
15,00
0,00 0,20 0,40 0,60 0,80 1,00 1,20 1,40 1,60 1,80
RNA/DNA-Ratio
SGR
[%/d
]
SAL d16-d8
PHOTO d16-d10

55
5.4 Larval marking
In order to evaluate the success of the releases of cod larvae it was necessary to evolve a technique that enabled us to recognise the larvae during recapture sampling. The goal was therefore to find a suitable technique that provided a strong, durable mark and which did not effect larval growth and survival. Based on the available knowledge there were several potential methods available. External tags were ruled out because of the small size of the larvae (4mm). The use of immersion marking in dye or of rearing broodstock in enriched isotopes seemed to be the best options. Marking with Alizarin Complexone and Alizarin Red are well described methods (Iglesias and Ojea 1997; Svåsand 1995; Blom et al. 1994; Tsukamoto 1988; Lagardére et al. 2000). Both of these chemicals bind to the calcium in the otoliths and can be visibly detectable by using a UV light microscope. These methods are good for mass tagging and have a relative low cost per fish. The cheaper dye Alizarin Red was not an ideal choice due to higher mortality rates described by Blom et al. (1994) and elemental tagging using enriched isotopes was also not an ideal choice due to high costs for analysis after recapture. A set of experiments were conducted in order to find a suitable marking concentration. There is no reported result on tagging cod larvae originating from the Baltic Sea, therefore the published papers on tagging of Atlantic cod were used as a template for the setup of these tagging experiments. Svåsand (1995) found that bathing the larvae in a solution containing 100 mg L-1 Alizarin Complexone for 24 hours gave a visible mark on the otolith. The objectives of the following experiments were therefore to test a series of concentrations ranging from 25 to 250 mg L-1 to find the strongest possible tagging concentration without loss of larvae. Also examined was the best time for marking; ie. egg or larval stage. In addition to concentrations of Alizarin it was of interest to see if the stage of development had any interaction with the strength of the marking. This issue was addressed with an experiment on marking of both eggs and larvae and furthermore, in order to see if a repeated marking made any improvements in the marking strength, the experiment was combined with a subsequent re-marking of larvae originating from marked eggs. The eggs were treated with 1% Aktomar prior to incubation. The incubation salinity and temperature was 19‰ and 7 ˚C, respectively. Four concentrations were tested using 3 different methods (outlined below). Each treatment were conducted using 2 replicates and with a treatment time of 24 hours (exp. B2 with 3 replicates). A control (0 mg L-1) was treated in a manner similar to those being treated with Alizarin. The following three experiments were conducted:
A. Egg marking with 0, 50, 100 and 200 mg L-1 alizarine complexone. After 24 hours immersed in alizarin the eggs were gently moved to clean incubation water and hatched. Hatched larvae were transferred in to 96% alcohol for later tag mark recognition.
B. Larval marking using 0, 50, 100 and 200 mg L-1 alizarine complexone (this experiment was repeated twice; B1 and B2, and with triplicates). Larvae were taken 2 days after 50% hatch.

56
Exp.1 Cum. hatching aft. treatment (2 rep. pr. treat. ±SD)
0102030405060708090
100
0 1 2 3 4 5 6 7Day aft. treat.
% hatch
kontrol50 mg/L100 mg/L200 mg/L
Fig. 5.10. The cumulated hatch percent for Baltic cod larvae hatching from eggs marked with three different concentrations of alizarin complexone and the unmarked control group. Two replicates per treatment; ± SD
Exp. 1: Cum. egg mortality aft. treatm. (2 rep. pr. treat. ±SD)
0102030405060708090
100
0 1 2 3 4 5 6 7Day aft. treat.
% dead
kontrol50 mg/L100 mg/L200 mg/L
Fig. 5.11. Cumulated mortality of eggs after marking with different concentration of alizarin complexone. The curves terminate at the time of hatching.
C. Multiple marking with 0, 50, 100 and 200 mg L-1 alizarine complexone. 100 eggs were randomly sorted out and re-marked 2 days post 50% hatching. The larval otoliths were examined for marks after 5 days in clean water.
For all series all dead eggs were sorted out daily to prevent fungal or bacterial build up. Series A (egg marking): Hatching in marked eggs was strongly inhibited and the extent of inhibition was more or less proportional to the alizarin concentration used (Fig. 5.10). From Fig. 5.11 it is evident that many of the unhatched eggs remain alive but do not hatch. Approximately 50% of the eggs died as a result of the treatment.
Series B (larval marking): Fig. 5.12 shows that there is no clear effect of marking with alizarin complexone on survival as long as the concentration is below 100 mg/L.

57
Fig. 5.13 shows no post-marking effect of marking larvae with alizarin independent of the concentrations used. The duration of the experiment was to the end of the yolk-sac stage and the larvae were not provided food.
Figure 5.14 shows that there is a higher vulnerability associated with repetitive marking of the larvae. Day 11 at the end of the experiment, the larvae are day 7 post hatch.
Fig. 5.14. Cumulated mortality after marking eggs and subsequent re-marking of larvae at day 2 DAH. From day 4 to 8 mortality was not monitored.
Exp. 2: Egg tagging & subseq. retagging of hatched larvae
0
10
20
30
40
50
60
0 1 2 3 4 5 6 7 8 9 10 11Days aft. 1. tagging
% dead
Control50 mg/L100 mg/L200 mg/L
Exp. 4: Cumm. mortality aft. treatment (3 rep. pr. treat.)
0,0
20,0
40,0
60,0
80,0
100,0
1 2 3 4 5 6 7 8 9Day aft. treat.
% dead
kontrol50 mg/L100 mg/L200 mg/L
Fig. 5.13. Cumulated mortality of larvae marked with different concentrations of alizarin complexone. The x-axis shows Days after treatment which is + 2 DAH.
Exp. 3: Cumm. mortality aft. treatment (2 rep. pr. treat.)
0
20
40
60
80
100
0 1 2 3 4 5Day aft. treat.
% deadkontrol50 mg/L100 mg/L200 mg/L
Fig. 5.12. Cumulated mortality (%) of larvae after marking with different concentrations of alizarin.
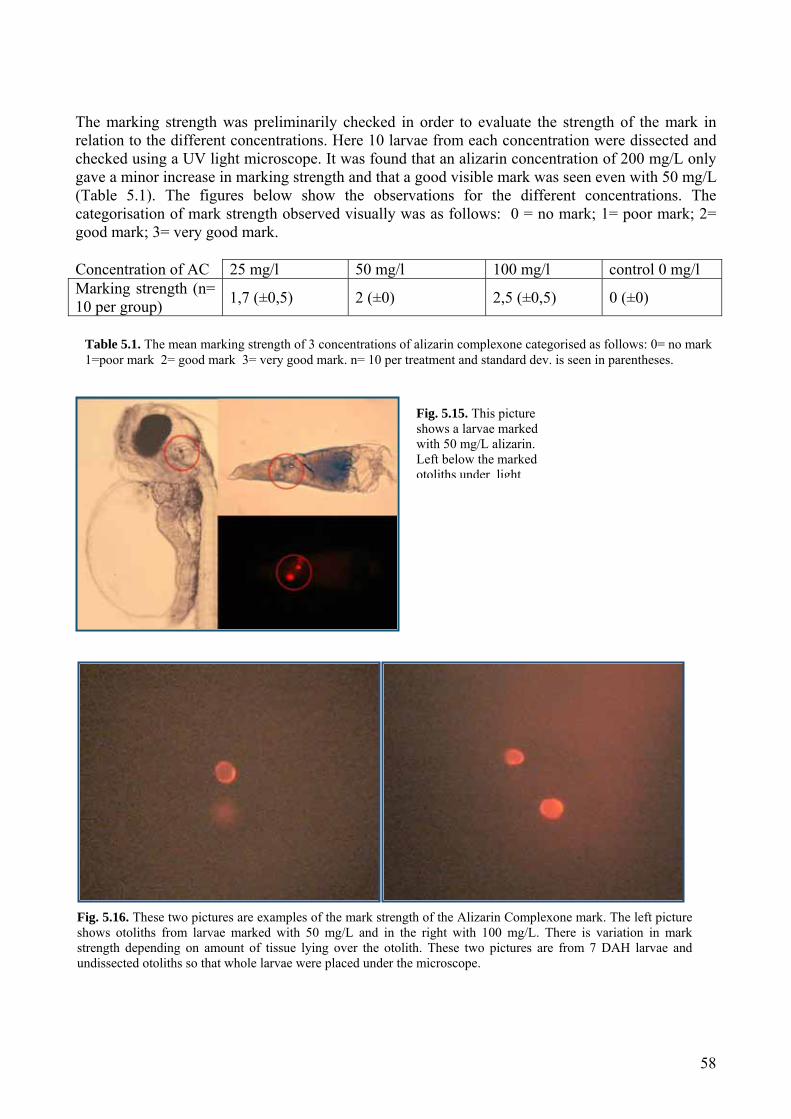
58
Fig. 5.15. This picture shows a larvae marked with 50 mg/L alizarin. Left below the marked otoliths under light
Fig. 5.16. These two pictures are examples of the mark strength of the Alizarin Complexone mark. The left picture shows otoliths from larvae marked with 50 mg/L and in the right with 100 mg/L. There is variation in mark strength depending on amount of tissue lying over the otolith. These two pictures are from 7 DAH larvae and undissected otoliths so that whole larvae were placed under the microscope.
The marking strength was preliminarily checked in order to evaluate the strength of the mark in relation to the different concentrations. Here 10 larvae from each concentration were dissected and checked using a UV light microscope. It was found that an alizarin concentration of 200 mg/L only gave a minor increase in marking strength and that a good visible mark was seen even with 50 mg/L (Table 5.1). The figures below show the observations for the different concentrations. The categorisation of mark strength observed visually was as follows: 0 = no mark; 1= poor mark; 2= good mark; 3= very good mark. Concentration of AC 25 mg/l 50 mg/l 100 mg/l control 0 mg/l Marking strength (n= 10 per group) 1,7 (±0,5) 2 (±0) 2,5 (±0,5) 0 (±0)
Table 5.1. The mean marking strength of 3 concentrations of alizarin complexone categorised as follows: 0= no mark 1=poor mark 2= good mark 3= very good mark. n= 10 per treatment and standard dev. is seen in parentheses.

59
Besides these marking experiments, an attempt was made to rear a batch of larvae that had been tagged with alizarin in order to establish the duration of the mark recognition. Cod larvae have a relatively big lapillus in their early larval life stage (0-25 days post hatch). Hereafter, the sagitta grows at a higher rate than the lapillus and is much bigger than the lapillus for the rest of the cod’s life. It was therefore important to examine whether this could be advantageous for mark recognition at later life stages in cod. Rearing cod was not a goal for RESTOCK-I project, so only a small trial was set up in order to gain knowledge on mark strength in 1-2 month old larva.
Fig. 5.17 shows a visible mark after a period of 50 days. It also indicates the benefit of focusing on the lapillus rather than sagitta, as the target couple of otoliths since the lapillus grow less in size as the fish grow and the mark may thus still be visible in juvenile fish. In the sagitta, new calcium layers may cause the mark to become less visible or not visible unless polished to the core, which would be a time consuming, labour intensive process. Since recognition of released juveniles is an important aspect of RESTOCK more work needs to be carried out on this subject area.
5.5 Larval transport
To maintain release costs at a reasonable level it is important to examine maximum densities attainable for larval transport prior to release without impacting their survival potential To examine maximum larval densities for transport, high quantities of larvae hatching simultaneously are required. Since the hatchery in this phase was not geared to mass rearing and hatching, such numbers were not available. Therefore the simulated transport chamber was a 30 ml beaker. It was necessary to use such a small beaker in order to conduct a whole experiment using only one batch of larvae, thus avoiding variation arising from batch differences. To simulate the transport of larvae, all larvae were first concentrated to a density of 40.000 L-1. Different concentrate portions of larva were transferred to the transport beakers in the required
Fig. 5.17. These two pictures show the same set of otoliths from a 50 days old cod larvae. The left picture is the otolith seen in normal light plus UV light and the right picture is the same just with UV light. The left otolith in both pictures is the lapillus and the right is the sagitta. Note that Lapillus gives a stronger mark than sagitta.

60
concentrations. The beakers were topped with air or oxygen, and stored with cooling blocks in an insulated box also containing a temperature logger (HOBO® Water Temp Pro by Onset). The box imitating transport was shipped with a local fisherman on his daily fishing trip. This trip had a duration time of 8 hours and corresponded to a “worst case scenario” of duration time for a release, as the normal time of transport for a release would be 4-5 h. The box with larvae undergoing no transport was left in a cooling room ensuring a constant temperature at 7˚C.
Survival was, as expected, higher when the transport chambers were topped with oxygen instead of plain air (Figs 5.18 and 5.19). The results in Fig. 5.18 show that an oxygen dependent mortality is a likely explanation for the decrease in survival with increasing density. Also, there was a higher mortality when larvae were actually transported than when not transported. This is likely due to increase in oxygen consumption, which is expected to occur in relation to the transport treatment. Whether this is stress related or simply due to more swimming behaviour in the chambers is unclear. The values for oxygen consumption by larvae found in the literature correspond well with
Larval survival when topped with OXYGEN
0
20
40
60
80
100
10000 20000 40000Stocking density (larv. per L)
% survival
Fig. 5.19. Survival rate (%) in both transport chambers topped with pure oxygen corresponding to 15% of release chamber’s volume.
Larval survival when release chamber topped with AIR
0
20
40
60
80
100
10000 20000 40000Stocking density (larv. per L)
% survival no transp.
transp.
Fig. 5.18. Survival rate (%) in the two transport treatments provided air corresponding to 15% of the transport chamber’s volume.

61
the results found here. There are therefore no problems involved in transporting up to 40.000 larvae per litre to a release site as long as the oxygen requirements are met.
5.6 References
Bloom, G., Nordeide, J.T.; Svåsand, T., Borge, A. 1994. Application of two chemicals, alizarin complexone and alizarin red S, to mark otoliths of Atlantic cod, Gadus morhua L. Aquaculture and Fisheries Management 25: 229-243. Iglesian, J., Rodríguez-Ojea, G. 1997. The use of alizarin complexone for immersion marking of the otoliths of embryos and larvae of the turbot, Scophtalmus maximus (L): dosage and treatment time. Fisheries Management and Ecology 4: 405-417. Grønkjær, P., Wieland, K. 1997. Ontogenetic and environmental effects on vertical distribution of cod larvae in the Bornholm Basin, Baltic Sea. Mar. Ecol. Prog Ser. 154: 91-105. Grønkjær, P., Clemmesen, C., St. John, M. 1997. Nutritional condition and vertical distribution of Baltic cod larvae. Journal of Fish Biology 51: 352-369. Lagardére, F., Thibaudeau, K., Bégout A., M.L. 2000 Feasibility of otolith markings in large juvenile turbot, Scophthalmus maximus, using immersion in alizarin-red S solution. ICES Journal of Marine Science 57: 1175-1181. McCarthy, E.L. 1934. Mariotte's Bottle. Science, 80: 100. Neuenfeldt, S., Beyer, J. 2003. Oxygen and salinity characteristics of predator-prey distributional overlaps shown by predatory Baltic cod during spawning. Journal of Fish Biology 62: 168-183. Sclafani, M., Stirling, G., Legget, W.C. 1997. Osmoregulation, nutritional effects and buoyancy of marine larval fish: a bioassay for assessing density changes during the earliest life-history stages. Mar. Biol. 129: 1–9. Svåsand, T. 1995. (Ed.) Massemerking av tidlig livsstadier av torsk med alizarin. TemaNord report 540: Nordisk Ministerråd, København. Tomkiewicz, J., Lehmann, K.M., St.John, M.A. 1998. Oceanographic influences on the distribution of Baltic cod, Gadus morhua, during spawning in the Bornholm Basin of the Baltic Sea. Fisheries Oceanography 7: 48-62. Tsukamoto, K. 1988. Otolith Tagging of Ayu Embryo with Fluorescent Substances. Nippon Suisan Gakkaishi 54: 1289-1295. Vallin, L., Nissling, A. 2000. Maternal effects on egg size and egg buoyancy of Baltic cod Gadus morhua Implications for stock structure effects on recruitment. Fisheries Research 49: 21-37.

62
Chapter 6 Larval releases Sune Riis Sørensen, Research assistant, DTU Aqua. 6.1 Release methods
The release of cod larvae is one of the main goals in the Restock project and therefore it is vital to secure that the actual release is providing the larvae the best opportunity to survive, start feeding and grow. The aim of the release method was to be able to release the larvae at whatever depth needed to fulfil the tolerance levels in terms of sensibility to temperature chocks. It is also vital for the success of the project that the method developed for the release is suitable for a future operation by fishermen. It was therefore important to involve fishermen, technicians and scientific staff in order to develop a robust and practical solution for this work. The focus in this work was the following capabilities:
• Capacity to release at least 30 litres of water and flexibility in release volume. • Low cost and easy replicating if more containers are needed. • Robustness and easy handling. • Remote release in different depth layers. • Design that can be released from a commercial fishing vessel with no or little rebuilding
prior to the release. • Efficient clearance of the larvae chamber after release, making sure all larvae are released.
An investigation of the common equipment on board the local fleet was done and the work on the design could start. The apparent limitation was the demand for lifting possibilities and power on board a typical commercial vessel and a compartment for holding the release container on ice avoiding temperature rise during the transport. With these limitations the institute engineer was consulted on the design. A usable design showed to be the water sampler formerly used on the Galatea 3 expedition the previous year. This water sampler was built for bringing up water samples from specific depths at large depths. It uses a simple, yet reliable, mechanical mechanism for closing the chamber and allows for collection of water without leakage. The principle of this container used on the Galathea 3 expedition was reversed for the RESTOCK project in order to allow for the release of cod larvae at specified depths. Apart from the release chamber, there was a need for on-line monitoring of the environmental hydrodynamic parameters in order to evaluate in situ the ideal depth for release. The parameters of interest were temperature, oxygen and depth and these were measured using a CTD (Conductivity, Temperatur, Density probe) mounted beneath the release container. This was supplied with power from a separate wire. The materials used were chosen with respect to weight and durability. The butterfly valves sealing the container are also used in industrial food industries and therefore very suited for the release container due to non-toxic materials. A schematic diagram of the release container is seen below:
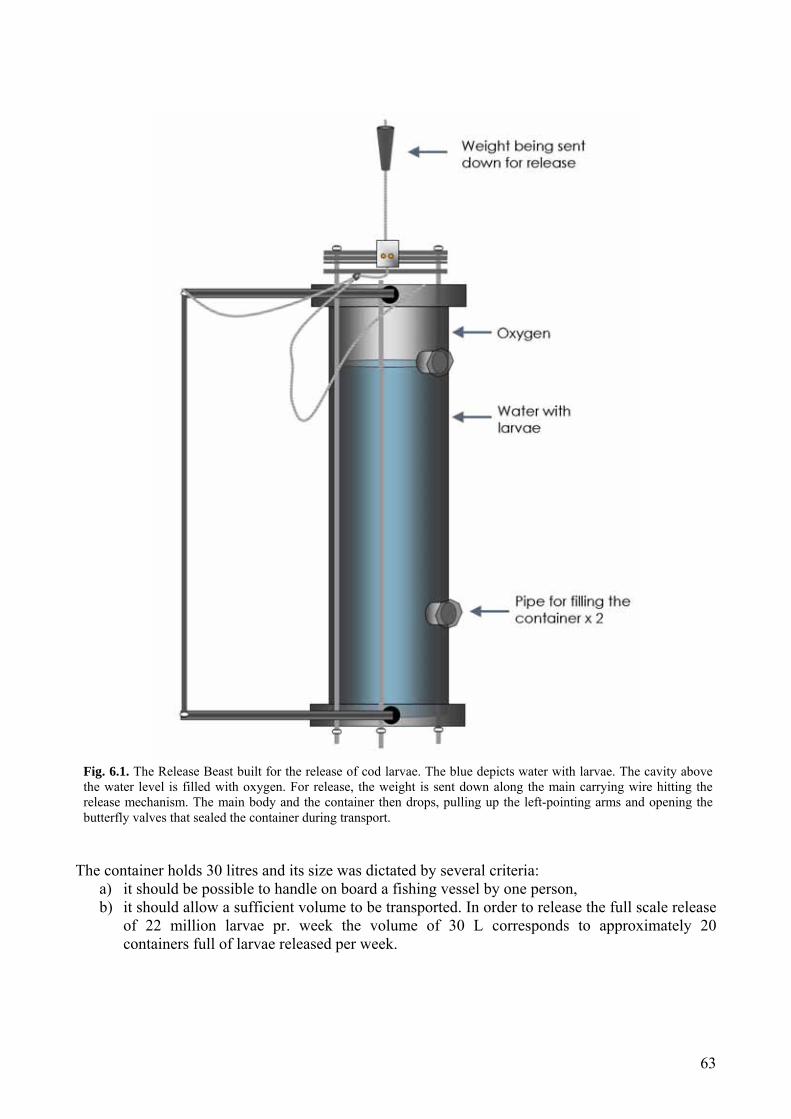
63
The container holds 30 litres and its size was dictated by several criteria:
a) it should be possible to handle on board a fishing vessel by one person, b) it should allow a sufficient volume to be transported. In order to release the full scale release
of 22 million larvae pr. week the volume of 30 L corresponds to approximately 20 containers full of larvae released per week.
Fig. 6.1. The Release Beast built for the release of cod larvae. The blue depicts water with larvae. The cavity above the water level is filled with oxygen. For release, the weight is sent down along the main carrying wire hitting the release mechanism. The main body and the container then drops, pulling up the left-pointing arms and opening the butterfly valves that sealed the container during transport.

64
When the cod larvae are ready for release the release container is tilted down in a horizontal position and the larvae are loaded through one of the two holes in the side of the tank (se Fig. 6.1). This loading takes approximately 5 minutes after which the container is driven directly on board the release vessel. The vessel used should have a central compartment in the bottom of the ship which can hold ice to keep the release container cool. Normally the transport takes 3-5 hours since the target areas were primarily the boarder areas of Bornholm Basin. 6.2 Release strategy
6.2.1 The release localities As described in background information for the project provided by the pilot project (Støttrup et al., 2004), there is plenty of food available in the border and more shallow areas of Bornholm basin. The spawning shift of the Baltic cod towards a late summer spawning season has created a mismatch between larvae and prey, such that the larvae appear in the central regions of the basin whereas the food concentrates in the boarder areas. In collaboration with IFM-Geomar in Kiel, a plan for the release of larvae is made in order to make sure that the larvae are released in areas with high probability of survival and good food availability. Hinrichssen et al (2002) predict the survival probability of cod larvae throughout Bornholm basin using a model that describes combined drift and climate. In general, larval survival is predicted to be poor in the central region of the basin and high in the more coastal areas of the basin. This is summarised in Fig. 6.2. The outcome of this model is of particular importance for RESTOCK releases and tells us that we should avoid releasing the larvae in areas and depth that result in a drift into areas characterised with low survival probability. The hydrodynamics in the area change greatly over the season driven by weather conditions. A program available at www.fvr.dk The Royal Danish Administration of Navigation and Hydrography, and based on continuous monitoring by SMHI (Swedish Meteorological and Hydrological Institute) provides information on currents and temperature in the area at the time of release and provide prognoses for these hydrodynamic data. These prognoses, showing currents and temperatures in Bornholm basin will form the basis for decision on where to release the larvae. In Fig. 6.3 is shown an example of the data on currents to be considered just before a release is to be done.
Fig. 6.2. Map of Bornholm basin with the average (1986-1999) horizontal distribution of mean larval survival probability. These probabilities are obtained using simulations of larval dispersion without Pseudocalanus elongates and without turbulence data. The depth in and around the basin is also shown. Hinrichsen et al. (2002).
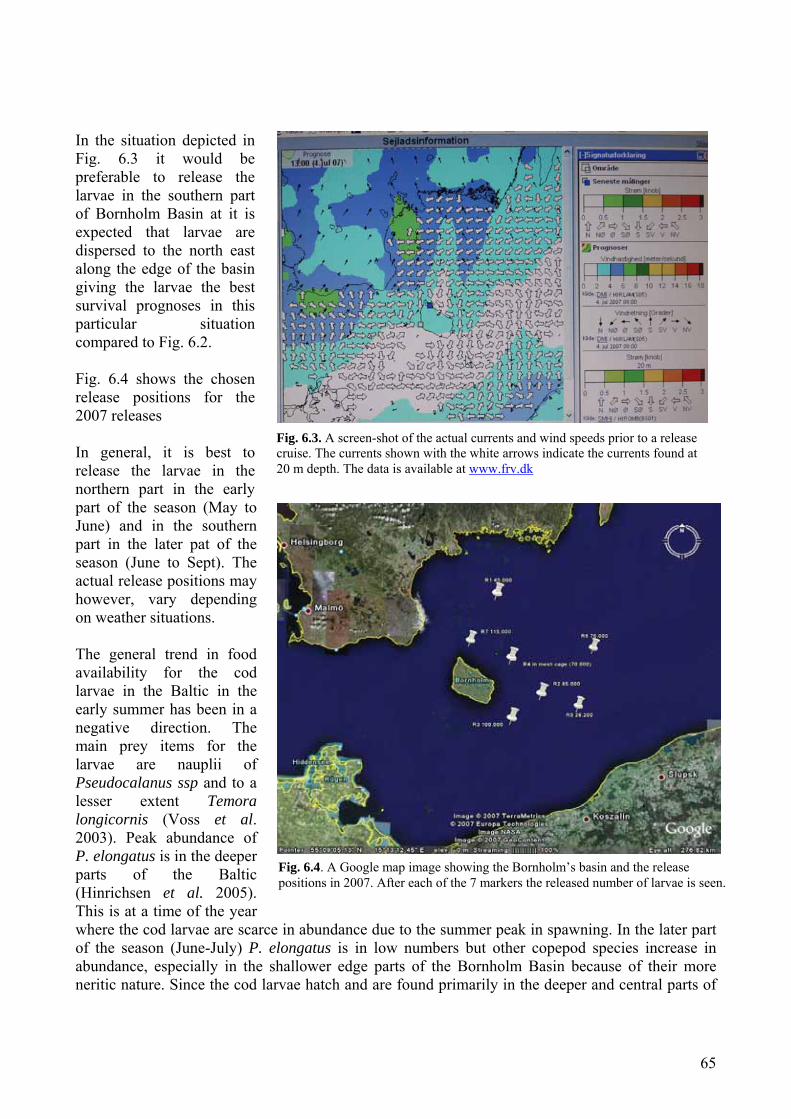
65
In the situation depicted in Fig. 6.3 it would be preferable to release the larvae in the southern part of Bornholm Basin at it is expected that larvae are dispersed to the north east along the edge of the basin giving the larvae the best survival prognoses in this particular situation compared to Fig. 6.2. Fig. 6.4 shows the chosen release positions for the 2007 releases In general, it is best to release the larvae in the northern part in the early part of the season (May to June) and in the southern part in the later pat of the season (June to Sept). The actual release positions may however, vary depending on weather situations. The general trend in food availability for the cod larvae in the Baltic in the early summer has been in a negative direction. The main prey items for the larvae are nauplii of Pseudocalanus ssp and to a lesser extent Temora longicornis (Voss et al. 2003). Peak abundance of P. elongatus is in the deeper parts of the Baltic (Hinrichsen et al. 2005). This is at a time of the year where the cod larvae are scarce in abundance due to the summer peak in spawning. In the later part of the season (June-July) P. elongatus is in low numbers but other copepod species increase in abundance, especially in the shallower edge parts of the Bornholm Basin because of their more neritic nature. Since the cod larvae hatch and are found primarily in the deeper and central parts of
Fig. 6.3. A screen-shot of the actual currents and wind speeds prior to a release cruise. The currents shown with the white arrows indicate the currents found at 20 m depth. The data is available at www.frv.dk
Fig. 6.4. A Google map image showing the Bornholm’s basin and the release positions in 2007. After each of the 7 markers the released number of larvae is seen.

66
the basin in the late part of the season there is high probability for a mismatch of distribution of cod and their prey. As the larvae grow bigger (above 5 mm) the amount of copepodite stages in the diet grow and so the relatively large amount of copepods in the later part of the season is a potential food source (Voss et al. 2003). At release the larvae measure around 4 mm in total length and special attention should be paid to find the optimal areas with the best availability of appropriate food. In general the best food sources are not found in the central part of the basin but in the shallower areas at the edge of the basin and the calculated predator-prey overlap is best here in the late part of the season (June-September) (Hinrichsen et al. 2005). In order to increase the likeliness of survival after release some general principles were formed about the basis of the decision on where to release the larvae.
o The larvae should not be released in the central part of the basin under the current hydrodynamic conditions.
o The larvae should be released at a depth corresponding to the temperature of the release chamber. o Early summer release scenario. If the temperature in the surface
layers is so warm that the release depth should be near but not at the thermocline, the larvae should be released a couple of meters above the thermocline, where conditions are relatively stable and food is available. If the temperature is more than 2ºC, but less than 5 ºC different to that in the chamber, they should be acclimated for 1 hour. This may generally be the case in the early summer season.
o Late summer release scenario. Larvae should be released below the thermocline if the temperature above the thermocline is more than around 12º, as this may have consequence for their subsequent survival. This may be more generally the case in the summer/late-summer season.
o The larvae should not be released in a thermocline which could potentially expose them to large temperature variations within a short time.
More work is needed to improve the release strategy including in situ experiments, the results of which may help form a release strategy. Especially decisions on optimal temperatures may need adjusting, since older larvae may be less vulnerable to higher temperatures.
6.2.2 The releases in 2007 Seven releases were conducted in 2007 with great emphasis on method development. Therefore the form of the output data from the CTD (Conductivity, temperature, density measurement) varies slightly from cruise to cruise. Fig. 6.5 shows a profile resulting from the CTD probe measurements. The particular example shows the dilemma of releasing larvae at the “right” temperature to prevent exposing the larvae to highly different temperatures at release. In Fig. 6.2.4 the larvae were released at a depth of 23 meters

67
corresponding to a colder ambient temperature than inside the release container. If the release had been carried out in the same temperature as inside the release chamber (9.7 ˚C) the larvae would have been introduced to an environment with high varying temperature and likely stressed even more.
Due to the hypo-osmotic environment at this depth (7-8 ‰) the larvae (14-15 ‰) would sink unless actively swimming upwards. This may be an argument for releasing just under the thermocline instead of just above. In this way the larvae will be introduced in a more stable environment and if it sinks further, the temperature will remain fairly stable. On the other hand, it may choose to remain in this environment by becoming more active especially if this is combined with the initiation of feeding. Several papers deal with the migration of cod larvae in the basin and due to the fact that dial migration pattern is observed (Grønkjær & Wieland 1997) and in depths holding a clear thermocline the larvae must be able to cope with this factor when doing it as part of their natural vertical migration. The results from this Restock project show that up to 40% of the larvae tested in the salinity gradient showed the expected behavioural response whereby they sought what corresponded to the upper layers in the Bornholm Basin. This behaviour was initiated around day 5 after hatching and especially the starved larvae show a large peak in upwards swimming. When reviewing the 7 releases from 2007 it is apparent that the release method varied, mainly due to the developmental nature of the work. Several technical problems were encountered involving a computer which failed to operate, too rough weather conditions and simply inexperience. However many solutions have evolved and experience gained. The method developed can be scaled up by increasing the number of containers for release. But generally, more work needs to be done to further improve the release method and release strategy.
Fig. 6.5. An example of the data obtained with the CTD probe send down with the release container. The release in this particular example was performed at 22 meter depth. This corresponds to a temperature of 12 deg., salinity at 7.5 ‰ and a oxygen level at 8.0 ml/l. The red curve is oxygen in ml/l, the dark gray is temperature in degrees Celsius, the green is salinity in ‰, and the light gray is time used during the release.

68
6.3 References
Grønkjær, P., Wieland K. 1997. Ontogenic and environmental effects on vertical distribution in the Bornholm Basin, Baltic Sea. Mar Ecol. Prog. Ser. 154: 91-105. Hinrichsen, H.-H., Möllmann, C., Voss, R., Kornilovs, G. 2002. Biophysical modelling of larval Baltic cod (Gadus morhua) growth and survival. Can. J. Fish. Aquat. Sci. 59: 1858-1873. Hinrichsen, H.H., Schmidt, J.O., Petereit, Möllmann, C. 2005. Survival probability of Baltic larval cod in relation to spatial overlap patterns with their prey obtained from drift model studies. ICES Journal of Marine Science 62: 878-885. Støttrup, J.G., Overton, J.L., Möllmann, C., Paulsen, H.E., Pedersen, P.B., Lauersen, P. 2004. Opdræt af torskeyngel til udsætning i Østersøen. DFU-Rapport nr 143-05. Voss, R. Köster, F.W, Dickmann, M. 2003. Comparing the feeding habits of co-occurring sprat (Sprattus sprattus) and cod (Gadus morhua) larvae in the Bornholm Basin, Baltic Sea. Fish. Res. 63: 97-111 Voss, R., Hinrichsen, H.H. Wieland, K. 2001. Model-supported estimation of mortality rates in Baltic cod (Gadus morhua callarias L.) larvae: the varying impact of critical periods’ BMC Ecology 1: 4.
69
Chapter 7. BVP program A. Monitoring of bacteria and viruses in broodstock and disinfection of eggs Inger Dalsgaard Senior research Scientist, Fish Disease Laboratory, DTU Aqua. Morten Sichlau Bruun Research scientist, Fish Disease Laboratory DTU Aqua. Julia Lynne Overton, Hatchery manager, Bornholms Laksekækkeri and project scientist, DTU Aqua.
7.1. Occurrence of bacteria and viruses in broodstock of Baltic cod
7.1.1 Introduction Diseases of cod from the Baltic Sea have earlier been the subject of several investigations (see Buchmann, Larsen and Dalsgaard 1993) and after cod were introduced into aquaculture an increased focus has been on the potential disease risks associated with this species (Bricknell et al. 2006; Samuelsen et al. 2006). Vibriosis has long been the most important bacterial disease in cod, with Vibrio anguillarum dominant among pathogenic isolates. Other bacterial pathogens that have been found in wild and cultured cod are Aeromonas salmonicida and Francisella. Well-known viruses such as the nodavirus that causes viral nervous necrosis (VNN), infectious pancreatic necrosis virus (IPNV) and viral haemorrhagic septicaemia virus (VHSV) have been isolated from Atlantic cod and can be a potential problem under rearing conditions. The knowledge of gadoid parasites is extensive and therefore this subject will be dealt with in a separate chapter (Chapter 8).
7.1.2 Materials and methods Two batches of broodstock were examined at landing and at increased mortality. Batch 1: Broodstock caught from the western part of the Baltic Sea in March 2006, 10 cod were examined for virus and bacteria just after landing and 2 cod examined after being maintained 10 months in the recirculated system. Batch 2: Broodstock collected from the eastern Baltic Sea in March 2007, 10 cod were examined for virus and bacteria just after landing and 10 cod were examined after being maintained 1.5 months in the recirculated system. These broodstock were maintained in captive conditions at Bornholm’s Salmon Hatchery, Nexø, Denmark, in a fully recirculated system using artificial salt water. The broodstock were fed a commercial diet (Skretting Vitalis pro, Skretting, Norway). Water temperature was maintained at 7ºC (±1ºC) and salinity was maintained at 19psu (±1psu). Broodfish were examined bacteriologically from skin, gills, brain, kidney, spleen, and if present ulcers or other pathological changes. The samples were inoculated on blood agar (Blood agar base (Difco) with 5% citrated calf blood) and incubated at 20°C for up to 1 week before any samples were considered as being negative. Only dominant colonies were identified with biochemical and serological tests. Virus samples were taken from the same individual fish as examined for bacterial infections. The samples were from kidney, spleen, heart and brain, the internal organs were pooled from each of the fish. In addition an independent sample was taken from the gonads. An extra pooled sample of brain and eye was taken from each of the 20 eastern Baltic cod examined. The tissue samples have been inoculated on the following cell cultures BF-2, EPC, CHSE-214 and SNN-1. (The broodstock were examined for: VHS/ IHN/ IPN/ VNN and ISA. Eggs and gonads examined for VHS/ IHN/ IPN).

70
7.1.3 Results The total number of cod examined was 32 and the length of the cod was between 42-66 cm. Examination of 10 cod from western Baltic showed that 3 had minor skin lesions and haemorrhages in the head region and one had abdominal distension (Fig. 7.1). Samples from gill and skin showed mixed bacterial flora from where the dominant bacteria were identified as different Vibrio spp. No bacteria were isolated from the internal organs except from the gonads of 4 fish, where mixed flora was isolated with the dominant bacteria belonging to different Vibrio spp. After 9-10 months under farmed condition some of the cod showed abnormal behaviour and had multiple dermal or subdermal lesions. One of the two cods examined had also subcapsular haemorrhage in the eyes (Fig. 7.2). From the eyes a pure culture of haemolytic bacteria was isolated and identified as Vibrio anguillarum serotype O2a. Mixed bacterial flora was isolated from the skin lesions and the dominant bacteria were identified as different Vibrio spp.
Fig. 7.1. Cod from western Baltic sea with haemorrhage in the skin and abdominal distension. Examination of 10 cod without disease signs from eastern Baltic showed different Vibrio-like bacteria in the skin and gills. Further identification has not been possible so far. No bacteria were found in the brain and spleen of all 10 cod, and in only 2 out of the 10 cod kidneys examined was Vibrio spp. found. After 1.5 months in the recirculated system 10 cod were examined. 2 cod did not show any clinical signs, whereas the remaining 8 cod all had eye damages, exophthalmus with haemorrhages, and one of the 8 also had an ulcer on the lower jaw. Vibrio anguillarum serotype O2a was isolated from two of the cod, from skin of one and both from ulcer and gills from the other. No bacteria or very few colonies were found in the internal organs. Different Vibrio-like bacteria were found in the skin and gills. The cod was not examined for Francisella sp., where the gross pathological changes are white nodules in the internal organs (Olsen et al. 2006). Despite some of the fish showed eye damages and skin ulcers, external signs of infection with Francisella, no white nodules were seen. No viruses were found by examination of the 32 cod.

71
Fig. 7.2. Cod from western Baltic sea with haemorrhages on the upper jaw and severe haemorrhage in the eye.
7.1.4 Discussion A major concern for maintaining broodstock under farmed conditions is the impact of diseases as cod in culture are known to suffer from a variety of infectious diseases. The cod were obtained from a wild source and might carry pathogens. In this study concerning the occurrence of bacteria and viruses only one pathogen was isolated. It is well-known that stocking of fish is associated with stress and outbreak of disease might occur. The low stocking densities in the recirculated systems and the low number of cod examined might explain that only the pathogen Vibrio anguillarum was found. The cod were often found to have cutaneous haemorrhage and it might be damage caused by capture and not potential pathologies, which also is supported by the findings of the different Vibrio spp. Vibrio anguillarum causes vibriosis, which is a fatal haemorhagisk septicaemia affecting several marine fish species. Several serotypes have been described, and serotypes O1, O2 and O3 are pathogenic to fish (Larsen et al. 1994). Serotype O2 affects both salmonids and marine fish species, and this serotype can be subdivided into two serological distinct subtypes O2a and O2b, which both can be isolated from cod. Vibrio anguillarum serotype O2a was isolated from 3 of the 32 cod, mainly from the skin and gills. The occurrence of this pathogen might be a threat to the maintenance of broodstock, and it is necessary to have a management strategy to prevent diseases. The strategy might be withdrawal of fish with external lesions, implementation of high hygiene measures, low stocking density, and if necessary vaccination. Vibrio anguillarum serotype O2b and atypical Aeromonas salmonicida are currently the two bacterial pathogens posing the greatest risk to cod farming (Larsen et al. 1994; Wiklund & Dalsgaard 1998). Other potential bacterial pathogens of concern include different Mycobacterium and Francisella spp. (Dalsgaard et al. 1992; Olsen et al. 2006).

72
In conclusion, our findings demonstrate the presence of the important fish pathogenic bacterium Vibrio anguillarum serotype O2a, which shows that it is important to monitor the health status of fish in culture. In addition, if it is necessary to vaccinate broodstock against vibriosis, the efficacy of the commercial vaccines needs to be evaluated. Studies in Norway have shown that vibriosis vaccines for cod should contain additional sero-subtypes than vaccines used for salmonids (Mikkelsen et al. 2007). Possible variation of virulence factors of the cod isolates compared with isolates from salmonids should be studied further.
7.2 Disinfection of eggs – bactericidal effect
7.2.1 Introduction Surface disinfection of eggs is used in cod aquaculture and has been shown to improve hatchability and survival of the eggs/larvae (Salvesen and Vadstein 1995). The egg surface is a good substrate for bacterial growth and eggs are covered with a dense bacterial population when examined by scanning electron microscopy (Morrison et al. 1999) A heavy bacterial load might influence the survival of eggs and the hatchability due to suffocation, toxin production or presence of specific pathogens (Olafsen 2001). Disinfectants used in marine hatcheries include glutaraldehyde (Morehead and Hart 2003), iodophor (Bergh and Jelmert 1996; Hirazawa et al. 1999), bronopol (Treasurer et al. 2005), peracetic acid, chlorine based disinfectants, hydrogen peroxide, iodine, and sodium hypochlorite (Tendencia 2003; Peck et al. 2004). In this study two methods were used to evaluate the bactericidal effect at different concentrations of the disinfectants Actomar® K30 and glutaraldehyde.
7.2.2 Materials and methods Four batches of eggs were used (batch A, B, C and D). Batch A was stripped from Western Baltic cod broodstock at sea and fertilized artificially using the “dry method”. Batches B, C and D were from broodstock collected from the Eastern Baltic. The eggs were disinfected between 1 and 4 days after spawning. Three control groups; a) where eggs were sampled directly from the egg incubator, with little handling (con 1); b) where handling was simulated using process water (con 1b) and c) where the eggs were washed in clean salt water (con 2) before sampling were assigned in the first year ( batches A and B). The con 1b treatment was dropped the following year (batches C and D). For all batches, Two disinfectants were tested, Actomar® K30 (an iodophor-based disinfectant used to disinfect salmonid eggs) and glutaraldehyde (25% buffered solution). Actomar K30 was tested at four concentrations; 0.1%, 0.5%, 1.0% and 1.5% solutions. Glutaraldehyde was tested at five concentrations; 0.1%, 0.2%, 0.4% and 0.6% active component. All solutions were made to concentration using 16psu artificial saltwater that was filtered (0.2 μm) and sterilised. Approximately 25 ml (Batch C and D) to 50 ml (Batch A and B) floating eggs were used per treatment. The eggs were transferred into a custom made plastic container with a mesh floor (mesh size = 500 μm) that was submerged into a plastic container with 500ml of disinfection solution. The eggs remained in the disinfectant for 10 minutes, with gentle agitation to ensure full surface contact with the disinfectant. Thereafter the eggs were rinsed with 1litre of sterile filtered salt water. Due to the fragility of the eggs, handling was kept to a minimum.

73
Batches B, C and D were spawned freely by the broodstock in the tank and fertilized eggs were collected from the water surface via an egg collector. Eggs were transferred to a five litre plastic jug, and the dead eggs sank to the bottom and could be removed. The viable eggs were then transferred to an egg incubator until the disinfection experiment took place. Two methods were used for counting the bacterial flora on the eggs before and after disinfection. The following media were used; blood agar (BA: Blood Agar Base (Oxoid) with 5% citrated calf blood) and marine agar (MA: Marine Agar 2216 (Difco)). Ten-fold dilutions of the different samples of eggs were prepared, and 0.1ml of appropriate dilutions was spread onto MA and BA. The number of colony forming units (CFU) was counted after incubation. The agar assay used followed the method described by Salvesen and Vadstein (1995). 30 holes, each with a diameter approximately as the diameter of one egg, were made in large agar plates (MA and BA) using a sterile pipette. One egg was transferred to each hole using a sterile plastic inoculation needle. The number of eggs/holes with visible bacterial growth was recorded. All plates were incubated at 20ºC for 72 hours.
7.2.3 Results In general, comparing the used culture media similar bactericidal effect of the disinfectants was seen but the percentage of eggs with bacterial growth as well as bacterial counts (CFU) were significantly higher on MA compared to BA (Fig. 7.3 shows data from one batch) with few exceptions. All the control groups showed 97-100% bacterial growth with the agar assay method and the concentration of the total counts ranged between 2.4 x 10³ and 3.0 x 10⁷ cfu/ml. In Fig. 7.3 a relation between the results obtained from the two methods can be seen. The bactericidal effect of Actomar (iodophor) treatments varied between the four different batches of eggs. Actomar showed only minor bactericidal effect in batch A and B and with the best effect after disinfection with 1% Actomar. A more pronounced effect was seen in batch C and D. The effect of Actomar was improved by increasing the concentration to 1.5%. Treatment with glutaraldehyde showed an obvious difference in bactericidal effect in batch A and B compared to batch C and D. The results obtained from disinfection with 0.4% glutaraldehyde, showed that no growth was seen around the 30 eggs in batch C and D, but in batch A and B the growth on BA ranged between 17-27% and 47-87% on MA, respectively. The total bacterial counts were between 1.6 x 101 to 2.4 x 10³ cfu/ml on BA and 6.0 x 101 to 5.2 x 10³ cfu/ml on MA in batch A and B, respectively and 1 cfu/ml to 1.1 x 101 cfu/ml on BA and 5 cfu/ml to 1.1 x 101 cfu/ml on MA in batch C and D, respectively. These differences in CFU after disinfection cannot be ascribed to differences in the initial bacterial load, as the ratio of CFU from control groups/disinfected eggs are much higher in batch C and D compared to A and B.
7.2.4 Discussion and conclusion A protocol for egg disinfection was made, but disinfection procedure might vary in key factors like contact time, density of eggs at disinfection and at what egg development stage treatment is initiated.
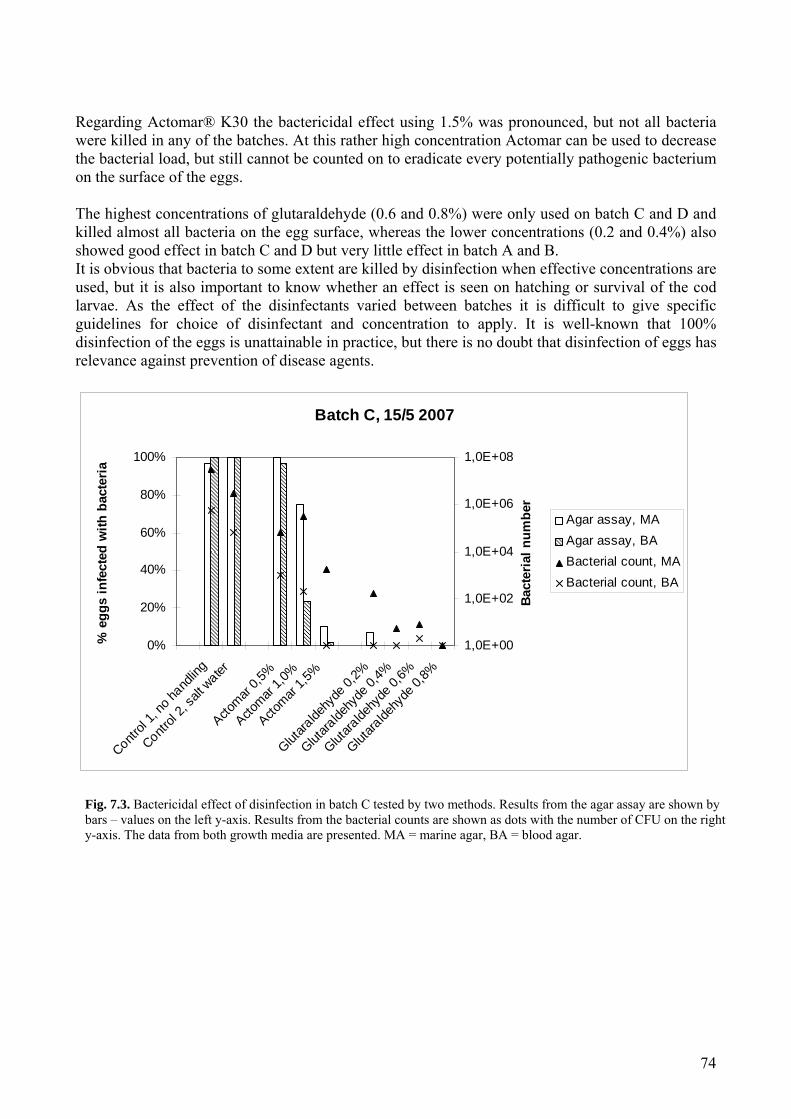
74
Regarding Actomar® K30 the bactericidal effect using 1.5% was pronounced, but not all bacteria were killed in any of the batches. At this rather high concentration Actomar can be used to decrease the bacterial load, but still cannot be counted on to eradicate every potentially pathogenic bacterium on the surface of the eggs. The highest concentrations of glutaraldehyde (0.6 and 0.8%) were only used on batch C and D and killed almost all bacteria on the egg surface, whereas the lower concentrations (0.2 and 0.4%) also showed good effect in batch C and D but very little effect in batch A and B. It is obvious that bacteria to some extent are killed by disinfection when effective concentrations are used, but it is also important to know whether an effect is seen on hatching or survival of the cod larvae. As the effect of the disinfectants varied between batches it is difficult to give specific guidelines for choice of disinfectant and concentration to apply. It is well-known that 100% disinfection of the eggs is unattainable in practice, but there is no doubt that disinfection of eggs has relevance against prevention of disease agents.
Batch C, 15/5 2007
0%
20%
40%
60%
80%
100%
Control
1, no
hand
ling
Control
2, sa
lt water
Actomar
0,5%
Actomar
1,0%
Actomar
1,5%
Glutara
ldehy
de 0,
2%
Glutara
ldehy
de 0,
4%
Glutara
ldehy
de 0,
6%
Glutara
ldehy
de 0,
8%
% e
ggs
infe
cted
with
bac
teria
1,0E+00
1,0E+02
1,0E+04
1,0E+06
1,0E+08
Bact
eria
l num
ber
Agar assay, MAAgar assay, BABacterial count, MABacterial count, BA
Fig. 7.3. Bactericidal effect of disinfection in batch C tested by two methods. Results from the agar assay are shown by bars – values on the left y-axis. Results from the bacterial counts are shown as dots with the number of CFU on the right y-axis. The data from both growth media are presented. MA = marine agar, BA = blood agar.
75
7.3 References Bergh, Ø., Jelmert, A. 1996. Iodophor disinfection of eggs of Atlantic halibut. Journal of Aquatic Animal Health 8: 135-145 Bricknell, I.R,.Bron, J.E., Bowden, T.J. 2006. Diseases of gadoid fish in cultivation: a review. ICES J Marine Sci 63: 253-266. Buchmann, K, Larsen, J.L., Dalsgaard, I. 1993. Diseases and injuries associated with mortality of hatchery reared Baltic cod (Gadus morhua L.) larvae. Acta Vet Scand 34: 385-390. Dalsgaard, I, Mellergaard, S., Larsen, J.L. 1992. Mycobacteriosis in cod (Gadus Morhua L.) in Danish coastal waters. Aquaculture 107: 211-219. Hirazawa, N., Hara, T., Mitsuboshi, T., Okazaki, J., Hata, K. 1999. Iodophor disinfection of eggs of spotted halibut Verasper variegates and red sea bream Pagrus major. Fisheries Science 65: 333-338 Larsen, J.L., Pedersen, K., Dalsgaard, I. 1994. Vibrio anguillarum serovars associated with vibriosis in fish. J Fish Dis. 17: 259-267. Mikkelsen, H., Lund, V., Martinsen, L.C., Gravningen, K., Schrøder, M.B. 2007. Variability among Vibrio anguillarum O2 isolates from Atlantic cod (Gadus morhua L.): characterisation and vaccination studies. Aquaculture 266: 16-25. Morehead, D.T., Hart, P.R. 2003. Disinfection of striped trumpeter (Latris lineate) eggs with glutaraldehyde. Aquaculture International 11: 255-260. Morrison, C., Bird, C., O’Neil, D., Leggiadro, C., Martin-Robichaud, D., Rommens, M., Waiwood, K. 1999. Structure of the egg envelope of the haddock, Melanogrammus aeglefinus, and effects of microbial colonization during incubation. Canadian Journal of Zoology 77: 890-901. Olafsen, J.A. 2001. Interactions between fish larvae and bacteria in marine aquaculture. Aquaculture 200: 223-247. Olsen, A.B., Mikalsen, J., Rode, M., Alfjorden, A., Hoel, E., Straum-Lie, K., Haldorsen, R. Colquhoun, D.J. 2006. A novel systemic granulomatous inflammatory disease in farmed Atlantic cod, Gadus morhua L., associated with a bacterium belonging to the genus Francisella. J Fish Dis. 29: 307-311. Peck, M.A., Buckley, L.J., O’Bryan, L.M., Davies, E.J., Lapolla, A.E. 2004. Efficacy of egg surface disinfectants in captive spawning Atlantic cod Gadus morhua L. and haddock Melanogrammus aeglefinus L. Aquaculture Research 35: 992-996. Salvesen, I., Vadstein, O. 1995. Surface disinfection of eggs from marine fish: evaluation of four chemicals. Aquaculture International 3: 155-171.
76
Samuelsen, O.B., Nerland, A.H., Jørgensen, T., Schrøder, M.B., Svåsand, T. Bergh, Ø. 2006. Viral and bacterial diseases of Atlantic cod Gadus morhua, their prophylaxis and treatment: a review. Dis. Aquat. Org. 71: 239-254. Skjermo, J., Vadstein, O. 1999. Techniques for microbial control in the intensive rearing of marine larvae. Aquaculture 177: 333-343. Tendencia, E.A. 2001. Effect of iodine disinfection on the bacterial flora and hatching rate of grouper, Epinephelus coioides eggs at the cleavage and eyed stage. Bulletin of the European Association of Fish Pathologists 21: 160-163. Treasurer, J.W., Cochrane, E., Grant, A. 2005. Surface disinfection of cod Gadus morhua and haddock Melanogrammus aeglefinus eggs with bronopol. Aquaculture 250: 27-35. Wiklund, T. Dalsgaard, I. 1998. Occurrence and significance of atypical Aeromonas salmonicida in non-salmonid and salmonid fish species: a review. Dis. Aquat. Org. 32: 49-69.

77
Chapter 8. BVP program B. Monitoring of parasites in broodstock of Baltic cod Kurt Buchmann, professor, University of Copenhagen, Faculty of Life Sciences, Department of Veterinary Pathobiology. Parasitological investigations were conducted by Kurt Buchmann and Rasmus Demuth Heinecke, University of Copenhagen, Faculty of Life Sciences, Department of Veterinary Pathobiology (KU-LIFE). Molecular studies of protists were performed by Alf Skovgaard and histopathological work was carried out by Torsten Snogdal Boutrup.
8.1 Introduction
During the period from March 2006 to April 2007 a total of 16 adult cod Gadus morhua were examined for presence of parasites. Fourteen of these fish were adult spawners from the aquaculture plant established in Nexø, Bornholm. Two additional adult cod were captured immediately east of Bornholm but not placed in the rearing-plant before examination. All fish were examined in order to obtain all parasite types in all organs. In the month of July 2007 a sample of yolksac larvae from the egg hatching and fish larva rearing system in Nexø was taken and subjected to a molecular investigation by Alf Skovgaard in order to identify protist endoparasites. Dinoflagellate-like parasites were previously found in Baltic yolk-sac larvae in 1992 (Buchmann, Dalsgaard and Larsen 1993) and were present in some batches.
8.2 Materials and methods
Standardised dissection and microscopical techniques as described by Buchmann and Bresciani (2001) and Buchmann (2007) were applied. A finding of pathological reactions in the heart of a spawner called for additional histopathological investigations. Dissection procedure The investigation was aimed at finding all parasites and parasitic stages (protozoans and metazoans) in all organs of the examined cod. Scrapings from the surface were checked under high power light microscope. Skin, fins, gills, mouth cavity and nostrils (nares) were further scrutinised under low power microscopy. Eyes were removed and dissected; the lens and vitreous humour were recovered and examined under the dissections microscope using sub-illumination. The cranium was dissected and the brain inspected. All organs in the body were investigated. Thus, peritoneum, oesophagus, stomach, pyloric caeca, intestine including rectum, spleen, liver, gonads, swimbladder, urethers, urinary bladder, kidney and gallbladder were removed and scrutinised. Both low and high power microscopy was conducted on these organs. The pericardial cavity was opened and the atrium, ventricle and bulbus arteriosus opened and inspected. Further, blood samples were taken and smears produced on microscope slides. Preparation of isolated parasites Isolated parasites were preserved in 70% ethanol or 4% neutral formalin. Helminths were mounted in glycerine-gelatine or Aquamount. Smears of blood, cysts, mucus or intestinal samples on slides were dried, preserved and stained using Giemsa.

78
Sampling was performed as listed in the following: 2006, March: Three spawners; May: Four spawners; May: One spawner; September: Two spawners. 2007, March: Two spawners; April: Two spawners; July: Two spawners caught by K. Buchmann east of Bornholm (hook and line) but not placed in the fish production plant in Nexø.
8.3 Results
All spawners were found infected both by protozoan and by metazoan parasites. Thus, a total of 12 different species were identified. Two protozoan species and ten metazoan species were found as listed below in Table 8.1. In addition, a parasitic organism with an unclear taxonomic status, Ichthhyophonus, was detected. The yolksac larvae were found to be infected with dinoflagellates.
Table 8.1. Schematic view of the cod examined in 2006 and 2007. The table gives information on genus, species name, place found on the host cod, nr. cod examined with an infection and origin of the cod. The cod are either from the eastern part of Bornholm Basin or from west of Bornholm.
79
8.4 Discussion
A number of the recovered parasites are known from previous studies on Baltic cod. Thus, the nematodes Contracaecum osculatum, Anisakis simplex and Hysterothylacium aduncum have been detected on several occasions. The acanthocephalans Echinorhynchus gadi and Pomphorhynchus laevis are also very common parasites of Baltic cod (Buchmann and Bresciani 2006). The same applies for the digentic trematodes Lepidapedon elongatum, Diplostomum spathaceum, Cryptocotyle lingua and the myxosporeans Myxobolus sp. These parasites have complicated life cycles involving intermediate hosts which are not present in recirculated systems (Buchmann and Bresciani 2006). The impact of these parasites is therefore mainly attributed to weakening of spawners and a possible reduction of egg quality. However, they are not to be considered contagious in production systems such as used by the Bornholm cod project in Nexø. A number of other parasites found may prove more problematic. These will need serious measures in order to prevent spreading to other hosts (spawners and fish larvae). Thus, the spreading and propagation potential of Spironucleus torosa, Loma branchialis and Gyrodactylus sp. is very high. The life cycle of these parasites does not involve intermediate hosts and they are known to replicate rapidly. In addition, they are all pathogenic both to spawners and to fish larvae and fry. Therefore, spreading and contamination from the infected spawner system to other sections of the hatchery should be prevented by hygienic measures including disinfection of eggs, fish tanks, personnel and equipment. Further, the spreading potential of Ichthyophonus and Ichthyodinium under these circumstances is at present unknown which make it necessary to implement similar hygienic measures with regard to these pathogens.
8.5 References
Buchmann, K. 2007. An introduction to fish parasitological methods – classical and molecular techniques. BioFolia. Frederiksberg, Denmark. Buchmann, K., Bresciani, J. 2001. An introduction to parasitic diseases of freshwater trout. DSR Publishers, Frederiksberg, Denmark Buchmann, K., Bresciani, J. 2006. Ecological parasitology of Baltic fishes. In: Grønvold, J. (ed.): Ecology of Parasites. BioFolia, Frederiksberg, Denmark. Buchmann, K., Larsen, J. L., Dalsgaard, I. 1993. Diseases and injuries associated with mortality of hatchery reared Baltic cod (Gadus morhua L.) larvae. Acta veterinaria scandinavica 34: 385-390. Meyer, S. 2007. On the discovery of a spherical yolk sac parasite in Baltic cod larvae in Bornholms Lakseklækkeri . Unpublished note June 21, 2007 (5 pages) Skovgaard, A. 2007. Identification of a protistan parasite of cod yolk-sac larvae by rDNA sequencing. In: Pedersen, K. & Buchmann, K. (eds.) Proceedings of the SCOFDA two day workshop on welfare and health of fish. KU-LIFE, Frederiksberg, Denmark October 30 and 31, 2007.

80
Chapter 9 Dissemination of results
9.1 National and international presentations (chronological order)
Støttrup, J.G. 2005. The potential for enhancing the cod stock in the eastern Baltic. Aqua Europe. August 5-8, 2005. Invited Key-note.
Støttrup, J.G. 2005. Can stocking enhance stocks? 6th Flatfish conference, October 20-26, 2005. Invited key-note.
Støttrup, J.G. 2006. RESTOCK projektet. Temadag afholdt af den svenske kystvagt og Fiskeridirektoratets afdeling i Roskilde og Nexø i Helsingborg, Sverige. September 7, 2006.
Støttrup, J.G. 2006. Restocking the eastern Baltic cod: In sight or distant? Third International Symposium on Stock Enhancement and Sea Ranching, Seattle, USA. Sept 18-21, 2006.
Støttrup, J.G. 2007. Bidrag til genetablering af Østersøbestanden af torsk. Den 14. Danske Havforskermøde, 23-25 January, 2007.
Overton, J.L. 2007. Cod restocking: a Bornholm case study using the “responsible approach” Profet Policy, Workshop of Baltic Sea Fisheries, 19th-20th April 2007, Vilnius, Lithuania.
Støttrup, J.G. 2007. Rationale for restocking cod in eastern Baltic. Invited talk, Hamburg University, Germany. 2 May, 2007.
Støttrup, J.G. 2007. Responsible approach to stocking. Ecosystem-based Stock Enhancement Workshop held in Brugges, Belgium. 6-8 May 2007. Invited talk.
Peck, M. 2007. Preliminary results on larval cod growth and survival. Uncover Workshop, 26 to 28 June, Hamburg, Germany.
Janke, N., Støttrup, J.G., Peck, M. Environmental influences on growth and survival of Baltic cod (Gadus morhua) larvae. Poster for AFS Larval Fish Conference, 9 - 12 July 2007
Overton, J.L. 2008. Restocking of the Eastern Baltic cod (RESTOCK project): the story so far. Cod Theme Day, 5th February, 2008, Charlottenlund Castle, Denmark.
Seminar concerning RESTOCK held at Bornholms Lakseklækkeri on 27+28 marts 2007.
9.2 Publications in international peer-reviewed papers
Støttrup, J.G., Overton, J.L., Paulsen, H., Möllmann, C., Tomkiewicz, J., Pedersen, P.B., Lauesen, P. 2008. Rationale for restocking the eastern Baltic. Reviews in Fisheries Science 16, 58-64.
9.3 Popular scientific paper and articles
Støttrup, J.G., Overton, J.L., Möllmann, C., Paulsen, H., Pedersen, P.B., Lauesen, P., Tomkiewicz, T. 2005. The potential for enhancing the cod stock in the eastern Baltic. European Aquaculture Society. 35, 67-71.
Støttrup, J.G. 2005. Forsøg skal vise om man ved restaurering kan øge fiskebestandene i de kystnære områder. http://www.dfu.min.dk/fiskepleje/
Støttrup, J.G., Tomkiewicz, J., Paulsen, H., Pedersen, P.B., Overton, J.L., Möllmann, C., Lauesen, P. 2005. En hjælpende hånd til torsk i Østersøen. Fisk & Hav 58, 62-71.

81
Støttrup, J.G., Overton, J.L., Möllmann, C., Paulsen, H., Pedersen, P.B., Lauesen, P. 2005. Opdræt af torskeyngel til udsætning i Østersøen, 01.02.2004-30.06.2004: Slutrapport. DFU-rapport 143-05. Charlottenlund: Danmarks Fiskeriundersøgelser, 77 p.
9.4 Thesis reports
Janke, N. 2007. Environmental influences on growth and survival of Baltic cod (Gadus morhua) larvae. Diploma student, University of Hamburg, Germany. Marochin C. 2007. Suivi quantitative et qualitative de la production et du développement d’oefs de morue baltique Gadus morhua. Masters thesis, Caen University, France.

DTU Aqua‐rapportindex Denne liste dækker rapporter udgivet i indeværende år samt de foregående to kalenderår. Hele listen kan ses på DTU Aquas hjemmeside www.aqua.dtu.dk, hvor de fleste nyere rapporter også findes som PDF‐filer. Nr. 158‐06 Østers (Ostrea edulis) i Limfjorden. Per Sand Kristensen og Erik Hoffmann Nr. 159‐06 Optimering af fangstværdien for jomfruhummere (Nephrops norvegicus) – forsøg med
fangst og opbevaring af levende jomfruhummere. Lars‐Flemming Pedersen Nr. 160‐06 Undersøgelse af smoltudtrækket fra Skjern Å samt smoltdødelighed ved passage af
Ringkøbing Fjord 2005. Anders Koed Nr. 161-06 Udsætning af geddeyngel i danske søer: Effektvurdering og perspektivering. Christian
Skov, Lene Jacobsen, Søren Berg, Jimmi Olsen og Dorte Bekkevold Nr. 162-06 Avlsprogram for regnbueørred i Danmark. Alfred Jokumsen, Ivar Lund, Mark
Henryon, Peer Berg, Torben Nielsen, Simon B. Madsen, Torben Filt Jensen og Peter Faber
Nr. 162a-06 Avlsprogram for regnbueørred i Danmark. Bilagsrapport. Alfred Jokumsen, Ivar
Lund, Mark Henryon, Peer Berg, Torben Nielsen, Simon B. Madsen, Torben Filt Jensen og Peter Faber
Nr. 163-06 Skarven (Phalacrocorax carbo sinensis L.) og den spættede sæls (Phoca vitulina L.)
indvirkning på fiskebestanden i Limfjorden: Ecopath modellering som redskab i økosystem beskrivelse. Rasmus Skoven
Nr. 164-06 Kongeåens Dambrug – et modeldambrug under forsøgsordningen. Statusrapport for
første måleår af moniteringsprojektet. Lars M. Svendsen, Ole Sortkjær, Niels Bering Ovesen, Jens Skriver, Søren Erik Larsen, Per Bovbjerg Pedersen, Richard Skøtt Rasmussen og Anne Johanne Tang Dalsgaard.
Nr. 165-06 A pilot‐study: Evaluating the possibility that Atlantic Herring (Clupea harengus L.)
exerts a negative effect on lesser sandeel (Ammodytes marinus) in the North Sea, using IBTS‐and TBM‐data. Mikael van Deurs
Nr. 166-06 Ejstrupholm Dambrug – et modeldambrug under forsøgsordningen. Statusrapport for
første måleår af moniteringsprojektet. Lars M. Svendsen, Ole Sortkjær, Niels Bering Ovesen, Jens Skriver, Søren Erik Larsen, Per Bovbjerg Pedersen, Richard Skøtt Rasmussen og Anne Johanne Tang Dalsgaard.
Nr. 167‐06 Blåmuslinge‐ og Stillehavsøstersbestanden i det danske Vadehav efteråret 2006. Per
Sand Kristensen og Niels Jørgen Pihl Nr. 168‐06 Tvilho Dambrug – et modeldambrug under forsøgsordningen. Statusrapport for første
måleår af moniteringsprojektet. Lars M. Svendsen, Ole Sortkjær, Niels Bering Ovesen, Jens Skriver, Søren Erik Larsen, Per Bovbjerg Pedersen, Richard Skøtt Rasmussen og Anne Johanne Tang Dalsgaard.

Nr. 169‐07 Produktion af blødskallede strandkrabber i Danmark ‐ en ny marin
akvakulturproduktion. Knud Fischer, Ulrik Cold, Kevin Jørgensen, Erling P. Larsen, Ole Saugmann Rasmussen og Jens J. Sloth.
Nr. 170‐07 Den invasive stillehavsøsters, Crassostrea gigas, i Limfjorden ‐ inddragelse af borgere
og interessenter i forslag til en forvaltningsplan. Helle Torp Christensen og Ingrid Elmedal.
Nr. 171-07 Kystfodring og kystøkologi ‐ Evaluering af revlefodring ud for Fjaltring. Josianne
Støttrup, Per Dolmer, Maria Røjbek, Else Nielsen, Signe Ingvardsen, Per Sørensen og Sune Riis Sørensen.
Nr. 172-07 Løjstrup Dambrug (øst) ‐ et modeldambrug under forsøgsordningen. Statusrapport for
1. måleår af moniteringsprojektet. Lars M. Svendsen, Ole Sortkjær, Niels Bering Ovesen, Jens Skriver, Søren Erik Larsen, Per Bovbjerg Pedersen, Richard Skøtt Rasmussen og Anne Johanne Tang Dalsgaard.
Nr. 173-07 Tingkærvad Dambrug ‐ et modeldambrug under forsøgsordningen. Statusrapport for
1. måleår af moniteringsprojektet. Lars M. Svendsen, Ole Sortkjær, Niels Bering Ovesen, Jens Skriver, Søren Erik Larsen, Per Bovbjerg Pedersen, Richard Skøtt Rasmussen og Anne Johanne Tang Dalsgaard.
Nr. 174-07 Abildtrup Dambrug – et modeldambrug under forsøgsordningen. Statusrapport for 1.
måleår af monitoreringsprojektet. Lars M. Svendsen, Ole Sortkjær, Niels Bering Ovesen, Jens Skriver, Søren Erik Larsen, Per Bovbjerg Pedersen, Richard Skøtt Rasmussen, Anne Johanne Tang Dalsgaard.
Nr. 175-07 Nørå Dambrug – et modeldambrug under forsøgsordningen. Statusrapport for 1.
måleår af moniteringsprojektet. Lars M. Svendsen, Ole Sortkjær, Niels Bering Ovesen, Jens Skriver, Søren Erik Larsen, Per Bovbjerg Pedersen, Richard Skøtt Rasmussen, Anne Johanne Tang Dalsgaard.
Nr. 176-07 Rens Dambrug – et modeldambrug under forsøgsordningen. Statusrapport for 1.
måleår af moniteringsprojektet. Lars M. Svendsen, Ole Sortkjær, Niels Bering Ovesen, Jens Skriver, Søren Erik Larsen, Per Bovbjerg Pedersen, Richard Skøtt Rasmussen og Anne Johanne Tang Dalsgaard.
Nr. 177-08 Implementering af mere selektive og skånsomme fiskerier – konklusioner,
anbefalinger og perspektivering. J. Rasmus Nielsen, Svend Erik Andersen, Søren Eliasen, Hans Frost, Ole Jørgensen, Carsten Krog, Lone Grønbæk Kronbak, Christoph Mathiesen, Sten Munch‐Petersen, Sten Sverdrup‐Jensen og Niels Vestergaard.
Nr. 178-08 Økosystemmodel for Ringkøbing Fjord ‐ skarvbestandens påvirkning af
fiskebestandene. Anne Johanne Dalsgaard, Villy Christensen, Hanne Nicolajsen, Anders Koed, Josianne Støttrup, Jane Grooss, Thomas Bregnballe, Henrik Løkke Sørensen, Jens Tang Christensen og Rasmus Nielsen.
Nr. 179-08 Undersøgelse af sammenhængen mellem udviklingen af skarvkolonien ved Toftesø og
forekomsten af fladfiskeyngel i Ålborg Bugt. Else Nielsen, Josianne Støttrup, Hanne Nicolajsen og Thomas Bregnballe.
Nr. 180-08 Kunstig reproduktion af ål: ROE II og IIB. Jonna Tomkiewicz, Henrik Jarlbæk Nr. 181-08 Blåmuslinge‐ og stillehavsøstersbestandene i det danske Vadehav 2007. Per Sand
Kristensen og Niels Jørgen Pihl Nr. 182-08 Kongeåens Dambrug – et modeldambrug under forsøgsordningen. Statusrapport for
2. måleår af moniteringsprojektet med væsentlige resultater fra 1. måleår. Lars M. Svendsen, Ole Sortkjær, Niels Bering Ovesen, Jens Skriver, Søren Erik Larsen, Per Bovbjerg Pedersen, Richard Skøtt Rasmussen og Anne Johanne Tang Dalsgaard.
Nr. 183-08 Taskekrabben – Biologi, fiskeri, afsætning og forvaltningsplan. Claus Stenberg, Per
Dolmer, Carsten Krog, Siz Madsen, Lars Nannerup, Maja Wall og Kerstin Geitner. Nr. 184-08 Tvilho Dambrug – et modeldambrug under forsøgsordningen. Statusrapport for 2.
måleår af moniteringsprojektet med væsentlige resultater fra 1. måleår. Lars M. Svendsen, Ole Sortkjær, Niels Bering Ovesen, Jens Skriver, Søren Erik Larsen, Per Bovbjerg Pedersen, Richard Skøtt Rasmussen og Anne Johanne Tang Dalsgaard.
Nr. 185-08 Erfaringsopsamling for muslingeopdræt i Danmark. Helle Torp Christensen, Per
Dolmer, Hamish Stewart, Jan Bangsholt, Thomas Olesen og Sisse Redeker. Nr. 186-08 Smoltudvandring fra Storå 2007 samt smoltdødelighed under udvandringen gennem
Felsted Kog og Nissum Fjord. Henrik Baktoft og Anders Koed. Nr. 187-08 Tingkærvad Dambrug ‐ et modeldambrug under forsøgsordningen. Statusrapport for
2. måleår af moniteringsprojektet med væsentlige resultater fra første måleår. Lars M. Svendsen, Ole Sortkjær, Niels Bering Ovesen, Jens Skriver, Søren Erik Larsen, Per Bovbjerg Pedersen, Richard Skøtt Rasmussen og Anne Johanne Tang Dalsgaard.
Nr. 188-08 Ejstrupholm Dambrug ‐ et modeldambrug under forsøgsordningen. Statusrapport for
2. måleår af moniteringsprojektet med væsentlige resultater fra første måleår. Lars M. Svendsen, Ole Sortkjær, Niels Bering Ovesen, Jens Skriver, Søren Erik Larsen, Per Bovbjerg Pedersen, Richard Skøtt Rasmussen og Anne Johanne Tang Dalsgaard.
Nr. 189-08 The production of Baltic cod larvae for restocking in the eastern Baltic. RESTOCK I.
2005‐2007. Josianne G. Støttrup, Julia L. Overton, Sune R. Sørensen (eds.)