Comparative Advantage, Absolute Advantage, Specialization and Trade

THE PRODUCT MAPPING ANALYSIS OF MANUFACTURING INDUSTRY PRODUCTS IN BILATERAL TRADE BETWEEN
INDONESIA AND CHINA IN 1995 – 2011 1. Grisvia Agustin, Student of Doctoral Programme of Economic Science
Faculty of Economy and Business Brawijaya University. E-mail: [email protected]. 2. Candra Fajri Ananda, 3. Ghozali Maski, 4. Putu Mahardika Adi Saputra
(Post-graduate Programme, Faculty of Economy and Business Brawijaya University)
ABSTRACT
This study aims to: (1) analyze the comparative advantage of Indonesia's manufacturing industry exports products to China, (2) determine the product of Indonesia's manufacturing industry become leadingexported products to China, (3) analyze the mapping of Indonesia’s manufacturing products in bilateral trade with China, and (4) analyze the development strategy of industry policies, especially on the leading exported products in bilateral trade between Indonesia and China. This research is expected to provide comparative advantage concept implementation which aims at improving the competitiveness of exports and improve the balance of bilateral trade between Indonesia and China, which in turn will boost economic growth in an integrative way. This research method is product mapping of data from various sources and to be processed by using RSCA index and TBI of 23 categories of leading exported products manufacturing industry in bilateral trade between Indonesia and China in 1995-2011. The results of this study indicate that, from the 23 categories studied, only 3 categories that are in area A. 3 other categories are in area B and the rest (16 categories of manufacturing industrial products) is in area D where RSCA index value and TBI are negative. This indicates that the majority of Indonesian manufacturing products in 1995-2011 have weak competitiveness and poor intra-industry trade balance. This condition becomes threat for the increasing progress of Indonesia and China international trade cooperation. In maintaining and improving its comparative advantage, manufacturers should innovate through researching and developing their products. Producers need easy and cheap access and connectivity for promoting to the exported products distributor in Indonesian. The requirement of more serious attention from various involved parties is in order to excel manufacturing export products becoming prominent for Indonesia in future international trade. Keywords: Product Mapping, RSCA, TBI, bilateral trade
Introduction
International trade is an important factor in the nation's economy, in which the presence of trade will be able to increase domestic revenues. National income will increase when the net export of a country is positive. Therefore, it is necessary to attempt to encourage exports volume of a country. So thatidentifying superior products export is essential to do.
According to Ram (1987), export-oriented economic policy is almost certainly able to increase the pressure of international competition in industrial sector. Outward looking influence on long-term growth has contributions in reducing poverty either directly or indirectly through its effects on trade and growth. According to Krugman, economist cannot discuss the effects of international trade or recommend a government policy in trading field convincingly, unless they know that their theories are quite good to explain international trade carefully observed with the concept of comparative advantage (Krugman, 2000).
Comparative advantage in this study is manifested by index Revealed Symmetric Comparative Advantage (RSCA). Laursen (1998) argues that in order to analyze the comparative advantage in econometric studies, Balassa index of RCA needs to be adjusted in order to be symmetric i.e. Revealed Symmetric Comparative Advantage (RSCA).
Grisvia Agustin, Candra Fajri Ananda, Ghozali Maski, Putu Mahardika Adi Saputra, Int.J.Eco. Res., 2014, v5i2, 37-49 ISSN: 2229-6158
IJER | MAR - APR 2014 Available [email protected] 1
37

1. The Case of Bilateral Trade of Indonesia and China In international trade with other countries, Indonesia appears showing a trend that
Indonesia has intensive bilateral trade with China. China is the main export destinations from Indonesia and also as the main importing country to Indonesia in 2007-2011 with the trend of 34.23%. Therefore, the intensity of international trade between Indonesia and China are definitely high.
Industrialization, mechanization and rapid urbanization in China need energy, and many types of raw materials from Indonesia. However, Indonesia has not been able to cultivate itsown natural resources to obtain higher added value (Nasution, 2012). This study focuses on manufacturing sector since the research of Blonigen and Wang (2005) shows that FDI inflow in developing countries is 50%.
After the global financial crisis in 2007-2008, the growth of production network and the distribution of manufacturing industry among the 8 countries included in the ASEAN+6 members of manufacturing industry (Japan, South Korea, China, Thailand, Malaysia, Singapore, Indonesia and the Philippines) were rapidly increasing. Furthermore, the changing of Chiang Mai Initiative (CMI) into multilateral institutionwhich made CMI has the authority to supervisethe economic policy program of loan-recipient countries(Nasution, 2012). So that, Indonesia cooperation with China is not intensively only in trade relationship.
The high intensity of trade between Indonesia and China are also driven by the implementation of CAFTA (China ASEAN Free Trade Area) on January 1st, 2010. Nevertheless, Indonesia-China trade balance had been deficit continuously, so that in 2011 it reached U.S. $ 3,861.2 million. Thus, it is necessary to reveal the competitiveness of Indonesia exports to stable the trade balance in international trade activity with China.
Product mapping analysisis needed to find superior products in Indonesia-China bilateral trade, because of the result of mapping will reveal which Indonesian products become the leading exported products. Leading exported products are products that have a high proportion of exports on the total world exports and total domestic exports. The analysis of product mapping combines RCA index and TBI (Trade Balance Index).
This study aims to: (1) Analyze the comparative advantage of Indonesia’s manufacturing industry exported products to China; (2) KnowIndonesia’sleading exported products of manufacturing industry to China; (3) Analyze the mapping of Indonesia’s manufacturing industry products in bilateral trade with China; (4) Analyze policy strategy primarily on the development of industrialization export products that has high competitive advantages in bilateral trade between Indonesia and China.
This research is expected to have contribution for Science Development (1) The concept implementation of comparative advantage which is expected to improve exportcompetitiveness and improve the balance of bilateral trade between Indonesia and China; (2) The role of product mapping with RSCA index and TBI to determine the position of Indonesian export superior products in domestic and international sphere; (3) The concept implementation of comparative advantage in improving economic growth in an integrative way.
2. Theoretical Overview 2. 1. Trade theory
A trade will occur when both parties doing the trade get benefit or advantage. A trade between countries is called as international trade. If there is no international trade, then each country should consume its own produces (Salvatore, 1997). There are two reasons why a
Grisvia Agustin, Candra Fajri Ananda, Ghozali Maski, Putu Mahardika Adi Saputra, Int.J.Eco. Res., 2014, v5i2, 37-49 ISSN: 2229-6158
IJER | MAR - APR 2014 Available [email protected] 1
38
country does international trade. It is because each country has distinct comparative advantage and for economic of scale purposes in order to increase foreign exchange earnings for development activities.
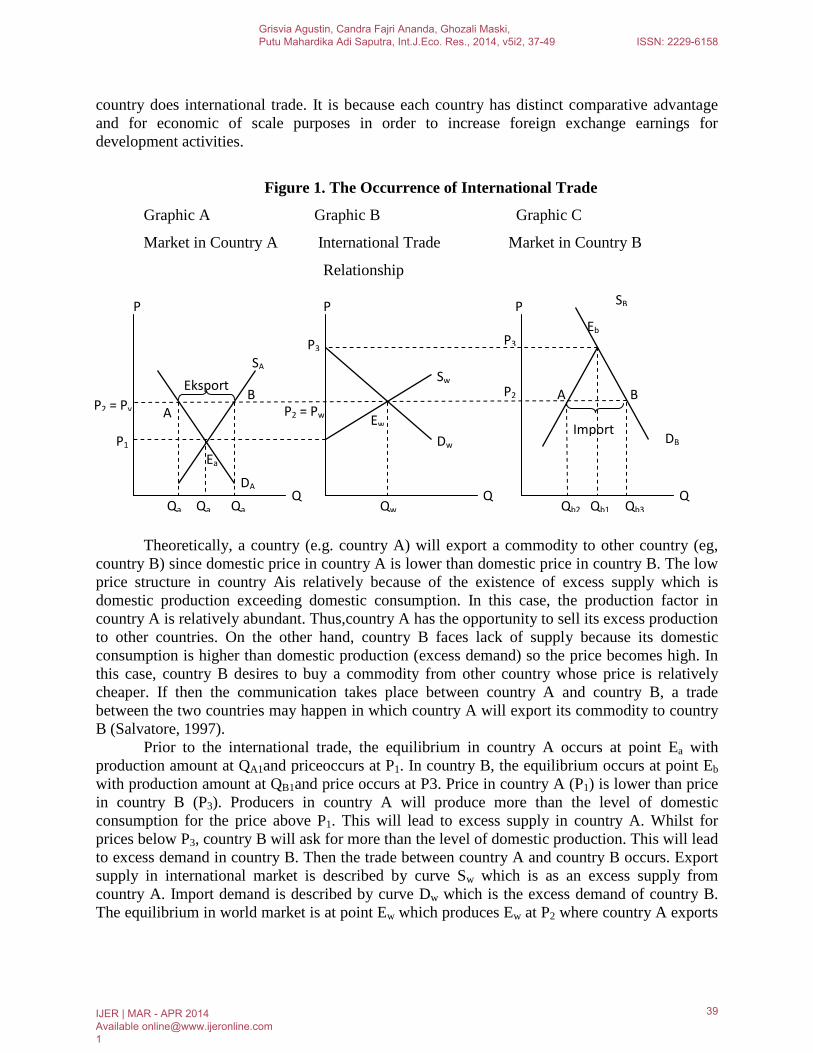
Figure 1. The Occurrence of International Trade
Graphic A Graphic B Graphic C
Market in Country A International Trade Market in Country B
Relationship
Theoretically, a country (e.g. country A) will export a commodity to other country (eg, country B) since domestic price in country A is lower than domestic price in country B. The low price structure in country Ais relatively because of the existence of excess supply which is domestic production exceeding domestic consumption. In this case, the production factor in country A is relatively abundant. Thus,country A has the opportunity to sell its excess production to other countries. On the other hand, country B faces lack of supply because its domestic consumption is higher than domestic production (excess demand) so the price becomes high. In this case, country B desires to buy a commodity from other country whose price is relatively cheaper. If then the communication takes place between country A and country B, a trade between the two countries may happen in which country A will export its commodity to country B (Salvatore, 1997).
Prior to the international trade, the equilibrium in country A occurs at point Ea with production amount at QA1and priceoccurs at P1. In country B, the equilibrium occurs at point Eb with production amount at QB1and price occurs at P3. Price in country A (P1) is lower than price in country B (P3). Producers in country A will produce more than the level of domestic consumption for the price above P1. This will lead to excess supply in country A. Whilst for prices below P3, country B will ask for more than the level of domestic production. This will lead to excess demand in country B. Then the trade between country A and country B occurs. Export supply in international market is described by curve Sw which is as an excess supply from country A. Import demand is described by curve Dw which is the excess demand of country B. The equilibrium in world market is at point Ew which produces Ew at P2 where country A exports
P1
P2 = Pv B Eksport SA
P2 = Pw
Ea
DA Qa
Qa
Qa
Q
A
Qw
Sw
P3
Ew Dw
Q
P P
P3
P
P2 B A
Eb
SB
DB Import
Qb2 Qb1 Qb3 Q
Grisvia Agustin, Candra Fajri Ananda, Ghozali Maski, Putu Mahardika Adi Saputra, Int.J.Eco. Res., 2014, v5i2, 37-49 ISSN: 2229-6158
IJER | MAR - APR 2014 Available [email protected] 1
39

amounted at Qa2 - Qa3. This is equal to the amountto imported country B (QB2 - QB3), the sum of these exports and imports is shown by trade volume at QW at the world market. 2.2. Classical Trade Theory of Comparative Advantage
The theory of comparative advantage is preceded by David Ricardo and as a solution to the theory of absolute advantage. According to David Ricardo (in Prapti, 2003), the trade basic is comparative advantage, not absolute advantage. This theory is the extension of absolute advantage theory, so it is still included in Classic Trade Theory. 2.3. Neo Classical Trade Theory (Heckscher - Ohlin)
This theory seeks to improve the Trade Theory conveyed by classic theory with the purpose to be closer to the reality. According to Hechscher - Ohlin (in Prapti, 2003), none of the output produced with one input merely and any country which trades can have import substitution industries (not full-specialized). For Hechscher - Ohlin, this condition is much more closer to the reality.
An important point as the subject of Hecksher - Ohlin (HO) Theory is that the pattern of international trade is determined by the difference in relative factor endowment of each country. In this case, it is assumed that the endowmentfactor of each country differs. Thus, the country stated will have comparative advantages on labor intensive goods. Conversely, countries with abundant capital-labor characteristic poor will have comparative advantages in capital intensive goods because the capital price is relatively cheaper. According to this, each country will export goods intensively on the use of abundant inputs and import goods intensively on the use of rare inputs (Prapti, 2003). 2.4. Revealed Symmetric Comparative Advantage (RSCA)
Balassa (1965) introduces the concept of Revealed Comparative Advantage (RCA), comparing the relative export performance, RCA is expressed as follows:
……….. (1)
Where is RCAij is RCA index for manufacturing commodity i from Indonesia to China. Thus, Xij is export manufacturing commodity i from Indonesia to China. ΣXij is Indonesia's total exports to China. Xit is exported manufacturing commodity i from the world to China. ΣXitis total exports from the world to China.
If RCA value is greater than 1 until infinity then good export performance is illustrated with a strong share in international market. And conversely, if RCA value is smaller than 1 until zero then poor export performance is illustrated with a weak share in international market (Balassa, 1965). When processing RCA index values in econometric model, RCA index value is usually made into Revealed Symmetric Comparative Advantage, when it is used in econometric analysis (Laursen, 1998). Therefore, the use of RSCA index is obtained from the following formula:
………… (2)
Value obtained from this RSCA index ranges from -1 to 1. In Laursen research, RSCA index is also compared with the size of comparative advantage for other international trade specialization such as Michaely Index and Chi Square size. In conclusion, RSCA index is the
Grisvia Agustin, Candra Fajri Ananda, Ghozali Maski, Putu Mahardika Adi Saputra, Int.J.Eco. Res., 2014, v5i2, 37-49 ISSN: 2229-6158
IJER | MAR - APR 2014 Available [email protected] 1
40

best measure for comparative advantage. Therefore, the interpretation of RCA index value is similar toRSCA index (Laursen, 1998). 2.5. Trade Balance Index (TBI)
The concept of Trade Balance Index (TBI) is proposed by Lafay (1992) to analyze a country's specialization in export (as net-exporter) or in import (as net-importer) for specific product groups which are usually classified according to SITC. TBI is formulated as follows
............ (3) Where: TBI: trade balance index of country i for product group j Xij: export of product group j from country i mij: import of product group j from country i
TBI values range from -1 to +1. If TBI value is equal to -1 then a country only imports (net-importer). And conversely, if TBI value is equal to +1 then a country only exports (net-exporter). 2.6. Product Mapping
Figure 2. Product Mapping
RSC
A>0
Group B: Comparative Advantage
Net-importer (RSCA > 0 and TBI < 0)
Group A: Comparative Advantage
Net-exporter (RSCA > 0 and TBI > 0)
RSC
A<0
Group D: Comparative Disadvantage
Net-importer (RSCA < 0 and TBI < 0)
Group C: Comparative Disadvantage
Net-exporter (RSCA < 0 and TBI > 0)
TBI < 0
TBI < 0
Trade Balance Index (TBI) Source: Widodo, 2011
Product mapping will determine leading exported product. Leading exported product is a product that has high export proportion on total world export and total domestic export. The product mapping uses two analysis tools with comparative advantage and the balance of trade. By using RSCA index and TBI simultaneously, mapping product can be formed. 3. Previous Research study
A research by Dahi (2006) focuses on the trade among the developing countries, namely South-South trade, investigates the impact of trade direction on developing country performance in skilled-intensive manufacturing. The empirical test results indicate that South-South trade has a positive impact on developing countries performance in skilled-intensive manufacturing sector as measured by RCA time series.
Grisvia Agustin, Candra Fajri Ananda, Ghozali Maski, Putu Mahardika Adi Saputra, Int.J.Eco. Res., 2014, v5i2, 37-49 ISSN: 2229-6158
IJER | MAR - APR 2014 Available [email protected] 1
41
A research by Lee (2011) usesBalassa index (RCA) to capture the comparative advantage of a country, acquired for industries classified by their technological intensity. Regression results based on samples of 71 countries from 1970 mentions that the economy tends to grow faster when it is specialized in high technology export.
Dalum et al. (1998) show that in the context of intra-country, there is specialization pattern of exported products nationallythat is sticky, although there is a tendency of a country to de-specialize products in the medium until long term. There is a tendency of OECD countries (which dominated by European Union countries) de-specialized at national level. But at the level of the OECD countries level, these countries lead to the same sector.
Laursen (1998) argues that in order to analyze the comparative advantage in econometric studies, RCA index of Ballasa needs to be adjusted to be symmetric i.e. Revealed Symmetric Comparative Advantage (RSCA) . In a research from Laursen, RSCA index is also compared with the size of comparative advantage for international trade specialization such as Michaely index and Chi Square size. In conclusion, RSCA index is the best measure of comparative advantage.
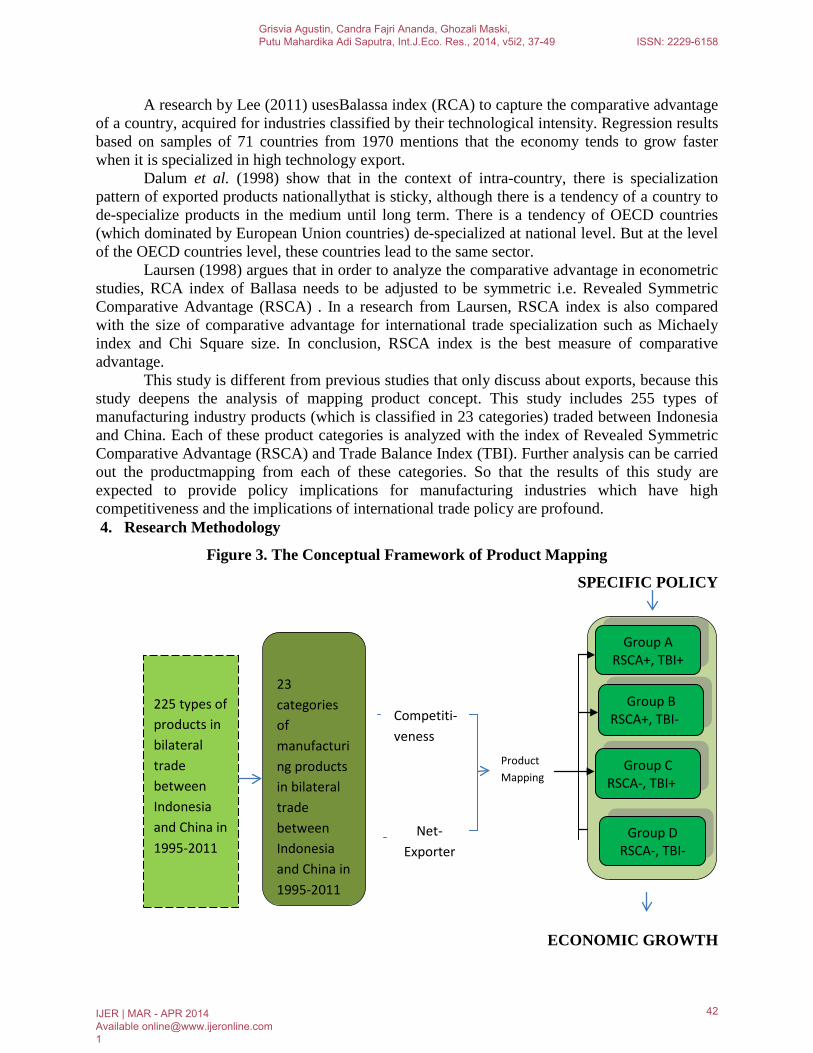
This study is different from previous studies that only discuss about exports, because this study deepens the analysis of mapping product concept. This study includes 255 types of manufacturing industry products (which is classified in 23 categories) traded between Indonesia and China. Each of these product categories is analyzed with the index of Revealed Symmetric Comparative Advantage (RSCA) and Trade Balance Index (TBI). Further analysis can be carried out the productmapping from each of these categories. So that the results of this study are expected to provide policy implications for manufacturing industries which have high competitiveness and the implications of international trade policy are profound. 4. Research Methodology
Figure 3. The Conceptual Framework of Product Mapping
SPECIFIC POLICY
ECONOMIC GROWTH
23 categories of manufacturing products in bilateral trade between Indonesia and China in 1995-2011
225 types of products in bilateral trade between Indonesia and China in 1995-2011
Product Mapping
Competiti-veness
Net-Exporter
Group A RSCA+, TBI+
Group D RSCA-, TBI-
Group B RSCA+, TBI-
Group C RSCA-, TBI+
Grisvia Agustin, Candra Fajri Ananda, Ghozali Maski, Putu Mahardika Adi Saputra, Int.J.Eco. Res., 2014, v5i2, 37-49 ISSN: 2229-6158
IJER | MAR - APR 2014 Available [email protected] 1
42

The Analysis Results of Product Mapping Product mapping in this study uses RSCA index and TBI to determine leading exported
products in bilateral trade between Indonesia and China in 1995-2011. If it is ranked according to RSCA value average and TBI, so that the ranking is as follows:
Table 1. Average Value of RSCA and TBI 1995-2011
No. Rank Sector Dominant Subsector RSCA TBI 1 10 Textiles Textile Yarn -0.0767 -0.5489 2 14 Wearing Apparel Men 's Clothing of Textile
Fabrics, not Knitted -0.6304 -0.3011
3 12 Leather Products Leather -0.5437 -0.3758 4 9 Footwear Footwear -0.2115 -0.3358 5 1 Wood Products Veneers, Plywood, and Other
Wood, Worked, n.e.s. 0.88556 0.83117
6 3 Furniture Furniture 0.22515 0.12937 7 2 Paper and Products Paper and paperboard 0.6494 0.66993 8 23 Printing and Publishing Printed Matter -0.8142 -0.8354 9 4 Industrial Chemical Hydrocarbons, n.e.s., and
Halogenated, Nitr. Derivative 0.09892 -0.0794
10 11 Other Chemical Miscellaneous Chemical Products, n.e.s.
-0.427 -0.4847
11 5 Rubber Products Rubber Materials (pastes, Plates, Sheets, etc.)
0.07018 -0.0822
12 8 Plastic Products Waste, Parings and Scrap of Plastics
-0.3621 -0.176
13 13 Pottery, China, Earthenware
Pottery -0.1277 -0.6079
14 7 Glass Products Glass -0.2305 -0.1539 15 6 Industrial Cement Lime, Cement, Fabrica.
Constr. Mat. (excluding glass, Clay)
0.04513 -0.2178
16 15 Clay Products Clay Products -0.0301 -0.6749 17 17 Iron and Steel Base Metal Manufactures,
n.e.s. -0.6048 -0.7139
18 21 Fabricated Metal Products
Tubes, Pipes and Hollow Profiles, Fittings, Iron, Steel
-0.5613 -0.7738
19 20 Machinery and Parts Office Machines -0.7375 -0.7339 20 19 Machinery, Electric Telecommunication
Equipment, n.e.s.; & Parts, n.e.s.
-0.7265 -0.5575
21 18 Transport Equipment Vehicles Parts & Accessories -0.6701 -0.7163
Grisvia Agustin, Candra Fajri Ananda, Ghozali Maski, Putu Mahardika Adi Saputra, Int.J.Eco. Res., 2014, v5i2, 37-49 ISSN: 2229-6158
IJER | MAR - APR 2014 Available [email protected] 1
43
-1
-0.8
-0.6
-0.4
-0.2
0
0.2
0.4
0.6
0.8
1
-1 -0.8 -0.6 -0.4 -0.2 0 0.2 0.4 0.6 0.8 1
TBI
RSCA
A
TEXTILE WEARING APPARELLEATHER PRO DUCTS FO O TWEARWO O D PRO DUCTS FURNITUREPAPER & PRO DUCTS PRINTING & PUBLISHINGINDUSTRIAL CHEMICALS O THER CHEMICALRUBBER PRO DUCTS PLASTIC PRO DUCTSPO TTERY PRO DUCTS GLASS & PRO DUCTSINDUTRIAL CEMENT CLAY PRO DUCTSIRO N & STEEL FABRICATED METAL PRO DUCTSMACHINERY & PARTS MACHINERY ELECTRICTRANSPO RT EQ UIPMENT PRO FESSIO NAL, SCIENTIFIC, & DIAGNO TIC EQ UIPMENTO THER MANUFACTURED PRO DUCTS
22 22 Professional, Scientific and Diagnostic Equipment
Meters & Counters, n.e.s. -0.8745 -0.6532
23 16 Other Manufactured Products
Jewelry & Articles of Precious Materials, n.e.s.
-0.6188 -0.5625
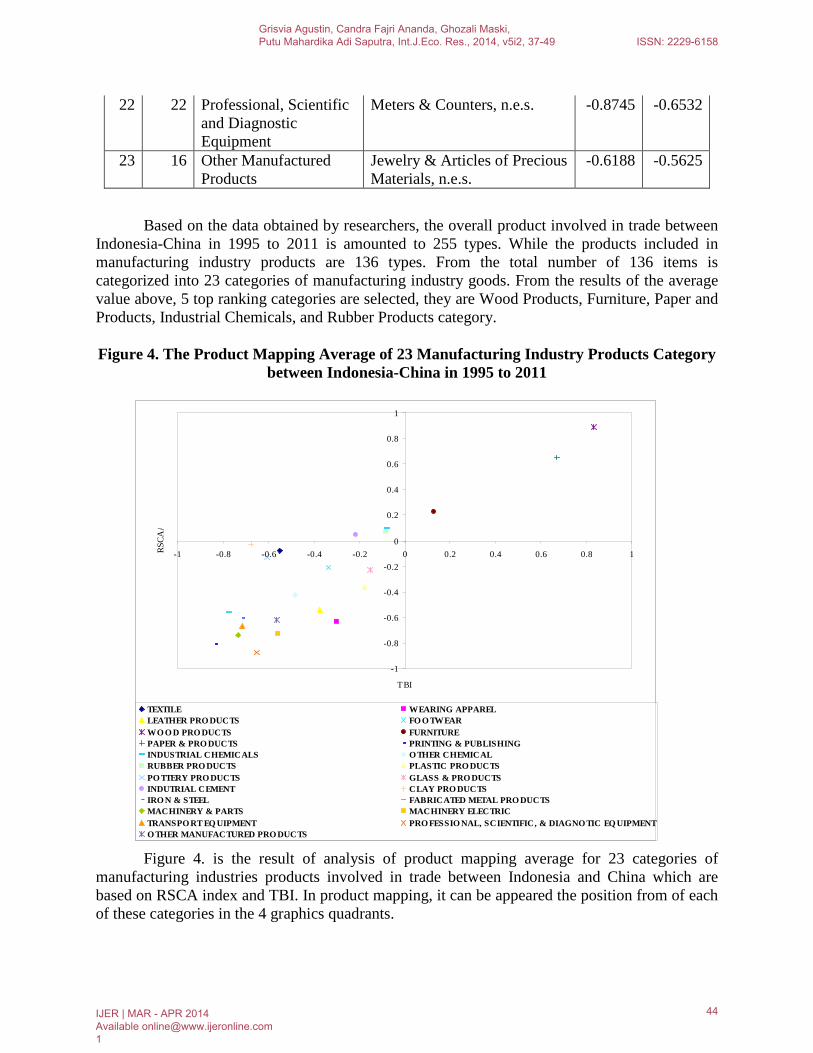
Based on the data obtained by researchers, the overall product involved in trade between Indonesia-China in 1995 to 2011 is amounted to 255 types. While the products included in manufacturing industry products are 136 types. From the total number of 136 items is categorized into 23 categories of manufacturing industry goods. From the results of the average value above, 5 top ranking categories are selected, they are Wood Products, Furniture, Paper and Products, Industrial Chemicals, and Rubber Products category. Figure 4. The Product Mapping Average of 23 Manufacturing Industry Products Category
between Indonesia-China in 1995 to 2011
Figure 4. is the result of analysis of product mapping average for 23 categories of manufacturing industries products involved in trade between Indonesia and China which are based on RSCA index and TBI. In product mapping, it can be appeared the position from of each of these categories in the 4 graphics quadrants.
Grisvia Agustin, Candra Fajri Ananda, Ghozali Maski, Putu Mahardika Adi Saputra, Int.J.Eco. Res., 2014, v5i2, 37-49 ISSN: 2229-6158
IJER | MAR - APR 2014 Available [email protected] 1
44
From the results of the product mapping shows that the Wood Products category, Paper and Products and Furniture are in Group A where RSCA average value and TBI are always positive in the period of 1995-2011. While in Group B, there is Chemicals Industrial, Rubber Products and Cement category. But in Group C, there is no category. Most categories (16 categories) are classified in Group D, where RSCA average and TBI value are negative.
The 3 categories in the highest ranking in Group A are Wood Products, Paper and Products and Furniture. And in Group B, there are Industrial Chemicals and Rubber Products. This indicates that the 5 products in the highest category of manufacturing industry are able to compete in China. Because RSCA index shows how strong Indonesia’s exports to China on the world, and TBI index shows strong intra-industry exports from Indonesia to China. Discussion
From the analysis of product mapping shows that only 3 categories that are in area A. 3 other categories are in area B and 16 (from 23) categories of manufacturing industry products are in area D where RSCA index value and negative TBI. This indicates that the majority of Indonesian manufacturing products of 1995-2011 have weak competitiveness and poor intra- industry trade balance. This condition has become uneasiness in the progress ofinternational trade between Indonesia and China that is improving.
There are three prominent regional developments in ASEAN since the Global Financial Crisis (GFC) in 2007-2008. Those developments are:
i. The development of Free Trade Area/ FTA. Nowadays, Indonesia is a member of the 7 FTA: AFTA, ACFTA (ASEAN-China FTA), AKFTA (ASEAN-Korea FTA), IJEPA (Indonesia-Japan Economic Partnership), ASEAN-Japan FTA, ASEAN-India FTA, and AANZFTA (ASEAN-Australia-New Zealand FTA).
ii. The rapid growth of production and distribution network of manufacturing industries across the countries within 8 ASEAN+6 members (Japan, South Korea, China, Thailand, Malaysia, Singapore, Indonesia, and the Philippines).
iii. The Chiang Mai Initiative (CMI) changes to multilateral institutions. This is the beginning the handover of part of country’s sovereignty in ASEAN+3 to regional institutions. These multilateral agreements will change the way of decision-making in ASEAN from the consensus now is to rule based system. It also will replace the system of non-intervention in the internal affairs member states with CMI interference that oversees the implementation of the economic policy program of loan-recipient country(Nasution, 2012). The signing of ACFTA has an effect on the declining on the average of tariff policy in
Indonesia. However, international trade agreements are expected to open up market access for Indonesian products so that revenue from import tariffs of raw materials can be increased and it is expected foreign export exchange from Indonesia’s products will also increase.
Government continuesthe reduction of tariffs as agreed under international agreements such as ACFTA. From international trade side, there are various challenges that arepotential to give negative effects on the revenues. In answering to the challenge of free trade, Indonesia is increasingly signinginternational trade agreements with other countries such as ACFTA.
Grisvia Agustin, Candra Fajri Ananda, Ghozali Maski, Putu Mahardika Adi Saputra, Int.J.Eco. Res., 2014, v5i2, 37-49 ISSN: 2229-6158
IJER | MAR - APR 2014 Available [email protected] 1
45

Table 2. Development Strategy Target for the Increasing of Competitiveness in 2011-2013
No. Strategic Issues 2011 2012 2013
1 The Increasing of Investment and Business Climate
a. Investment Improvement (5) 8,8 10,9 11,1
b. Business Easiness Level
- Timing to start business (days) 45 36 20
- Building Permission (days) 158 145 137
2 Infrastructure building acceleration
a. National Road Condition (%) 88,5 90,5 92,5
b. District Capital City Served by Broadband (%) 66 76 83
3 Industrial Development Improvement in Various Economic Corridor
a. Manufacturing Industry Improvement (%) 6,2 6,1 6,7
b. Non-Gas-and-Oil Manufacturing Industry Improvement (%) 6,8 6,6 7,5
4 Job Vacancies Creation specially for Young Labors
Opened-unemployment Rate (%) 6,6 6,4-6,6 5,8-6,1
Source: Financial Memorandum and Proposed 2013
In terms of export, the imposition of export tariffs on Indonesia’s export commodities that are upstream or raw materials have the potential to inhibit the export an at the end it will impact negatively on export tariff revenues. However, foreign exchange from exports is enhancing when Indonesia’s products can be exported as finished goods or processedgoods, not raw materials. Based on current conditions, it can be seen that the success happens for downstream industries in the country.
The government plans to remain committed to the international goods trade cooperation agreements by continuing the reduction of tariffs in 2013 as agreed in an international agreement.
Another challenge is the decline of export tariffs. This happens because the purpose of the export tariff is as an instrument to support country’s revenues, but rather to aim to:
(a) meet the needs of domestic raw materials; (b) preserve natural resources;
Grisvia Agustin, Candra Fajri Ananda, Ghozali Maski, Putu Mahardika Adi Saputra, Int.J.Eco. Res., 2014, v5i2, 37-49 ISSN: 2229-6158
IJER | MAR - APR 2014 Available [email protected] 1
46
(c) keepcertain commodity price stability in the country, and (d) anticipate the increase of high prices rise for certain export commodities in international
market. By setting development targets to improve the competitiveness, the competitiveness of
Indonesia’s products, especially to China, can be increased. Before the flood of China’s products come to Indonesia, generally because of the low price set by China. With the import tariffs, the price of Chinese goods is still relatively low when compared to domestic products price (Indonesia), in additional, without import tariffs, along with the scheme of ACFTA agreement. This condition results the low price of goods from. Indonesia’s consumption patterns which are very sensitive on the price; prefer cheap goods without paying attention to quality; and a low sense of nationalism can cause domestic product (Indonesia) make Indonesia cannot compete with China’s products. Conclusion
From the analysis of product mapping, it appears that 5 categories on highest ranking in Group A are Wood Products, Paper and Products and Furniture. And is in Group B. there are Industrial Chemicals and Rubber Products. This indicates that the 5 products in the highest category in manufacturing industry are able to compete in China. Because RSCA index shows strong Indonesian exports to China on the world, and TBI index shows strong intra-industry exports from Indonesia to China.
However, in general, from the 23 categories studied, only 3 categories that are in area A. 3 other categories are in area B and the rest (16 categories of manufacturing industrial products) is in area D where RSCA index value and TBI are negative. This indicates that the majority of Indonesian manufacturing products in 1995-2011 have weak competitiveness and poor intra-industry trade balance. This condition becomes threat for the increasing progress of Indonesia and China international trade cooperation.
In maintaining and improving its comparative advantage, manufacturers should innovate through researching and developing their products. Therefore, the government should provide adequate infrastructure, training and development for manufacturers, as well as easy and cheap access for promoting to the exported products distributor in Indonesian. The requirementof more serious attention from various involved parties is in order to excel manufacturing export products becomingprominentfor Indonesia in future international trade.
It requires a comprehensive effort of various stakeholders to maintain and improve the comparative advantage of manufacturing products. Because of the reality occurring in the field indicate that (i) the access and promotiondifficulties to international markets, (ii) differences in product standardization in each of export destinations; (iii) convoluted procedures exporter permission, and (iv) export bureaucratic inefficiency resulting additional costs thereby reducing the competitiveness of export products. References 1) Anonim. Chiang Mai Initiative as the Foundation of Financial Stability in East Asia.
http://www.aseansec.org/17902.pdf. 2) Balassa, B. (1965). Trade Liberalization and ‘Revealed Comparative Advantage’. The
Manchester School, 33: 99-123.
Grisvia Agustin, Candra Fajri Ananda, Ghozali Maski, Putu Mahardika Adi Saputra, Int.J.Eco. Res., 2014, v5i2, 37-49 ISSN: 2229-6158
IJER | MAR - APR 2014 Available [email protected] 1
47

3) Carr, David, James R. Markusen, and Keith E. Maskus. 2001. Estimating the Knowledge-Capital Model of the Multinational Enterprise. American Economic Review 91, no. 3: 693–708.
4) Dalum, Bent, Keld Laursen dan Gert Villumsen. 1998. Structural Change in OECD Export Specialisation Patterns: De-specialisation and ‘Stickiness’. International Review of Applied Economics, Vol. 12, No. 3, 1998.
5) Hoekman, Bernard, Aaditya Mattoo, dan Philip English. 2002. Development, Trade, and The WTO. A Handbook. The International Bank for Reconstruction and Development. The World Bank. Washington, DC.
6) _________, Bernard dan Simeon Djankov. 2002. Determinants of The Export Structure of Countries in Central and Eastern Europe. The World Bank Economic Review Vol. 11, No. 3: 471–487.
7) Hsiao, Frank S.T. dan Mei-Chu W. Hsiao. 2006. FDI, Exports, and GDP in East and Southeast Asia—Panel Data versus Time-Series Causality Analyse. Journal of Asian Economics 17: 1082–1106.
8) Indonesia’s Trade Ministry. Regulasi Kementrian Perdagangan Indonesia. http://kemendag.go.id.
9) Industry and Trade Ministry. Regulation of Indonesia’s Industry and Trade Ministry. http://regulasi.kemenperin.go.id/site/peraturan/14/all.
10) Krugman, Paul. R dan Maurice Obsfield. 2000. International Economics: Theory and Policy. Addison Wesley Longman. New York.
11) Lee, Jim. 2011. Export Specialization and Economic Growth Around The World. Economic Systems 35 (2011) 45–63.
12) Mah, Jai S. 2010. Export Promotion Policies, Export Composition and Economic Development of Korea. Law and Development Institute Inaugural Conference Sydney, Australia October 2010.
13) Muendler, Marc-Andreas. 2009. Converter from SITC to ISIC. University of California, San Diego, CESifo and NBER. 8 Januari 2009.
14) Mundell, R.A. 1957. International Trade and Factor Mobility. American Economic Review 47(1957):321-35.
15) Nasution, Anwar. 2012. Optimalisasi Kebijakan Perdagangan Indonesia di ASEAN. Economic Institution Specialist Support for Economic Analysis Development in Indonesia (SEADI). Revisi Lecture Series 2012, Trade Ministry, Jakarta 14 Maret 2012.
16) Orgun, Bilgin Orhan. 2012. Strategic Trade Policy Versus Free Trade. Procedia - Social and Behavioral Sciences 58 (2012) 1283 – 1292. 8th International Strategic Management Conference.
17) Oskam, A.J., dkk. 2004. Trade Policies And Development of Less-Favoured Areas: Evidence From The Literature. Food Policy 29 (2004) 445–466.
18) Pamuji N. 2004. Diplomasi China, Indonesia dan Presiden Baru. http://www.mail-archive.com/ekonomi-nasional@yahoogroups. com/msg 00156.html. Diakses 3 Desember 2012.
19) Panagariya, Arvind. 1994. China's Export Strategy: What Can We Learn From It?. 20) Prapti, Endang Sih. 2003. Ekonomi Internasional. Lectures Collection. 21) Romer, David. 1996. Advanced Macroeconomics. New York: McGraw Hill. 22) Romer, Paul M. 1994. The Origins of Endogenous Growth. The Journal of Economic
Perspectives, Vol. 8, No. 1. (Winter, 1994), pp. 3-22.
Grisvia Agustin, Candra Fajri Ananda, Ghozali Maski, Putu Mahardika Adi Saputra, Int.J.Eco. Res., 2014, v5i2, 37-49 ISSN: 2229-6158
IJER | MAR - APR 2014 Available [email protected] 1
48

23) Salvatore, Dominick. 1997. International Economy. 24) Saputra, Putu Mahardika Adi. 2006. Export Led Growth. Junal Ekonomi dan Bisnis
Indonesia Vol 21, No. 1, Januari, 2006. 25) Sato, Sumie dan Mototsugu Fukushige. 2011. The North Korean Economy: Escape From
Import-Led Growth. Journal of Asian Economics 22 (2011) 76–83. 26) Stubbs, Richard. 2002. ASEAN Plus Three: Emerging East Asian Regionalism?. Asian
Survey, Vol. 42, No. 3 (May – Jun., 2002), halaman 440-455. 27) Todaro, Michael P. dan Stephen C. Smith. 2004. Economic Development in Third World.
11th Edition, translated by Burhanudin Abdullah. Jakarta: Erlangga 28) UNCTAD. 2008. World Investment Report 2008. New York & Geneva: UN 29) Widodo, Tri. 2011. Comparative Advantage: Theory, Empirical Measures and Case
Studies. 30) Yue, Changjun dan Ping Hua. 2002. Does Comparative Advantage Explains Patterns In
China?. China Economic Review 13 (2002) 276–296.
Grisvia Agustin, Candra Fajri Ananda, Ghozali Maski, Putu Mahardika Adi Saputra, Int.J.Eco. Res., 2014, v5i2, 37-49 ISSN: 2229-6158
IJER | MAR - APR 2014 Available [email protected] 1
49