The Primacy of Institutions Reconsidered: Direct...
31
The Primacy of Institutions Reconsidered: Direct Income Effects of Malaria Prevalence Kai Carstensen and Erich Gundlach Some recent empirical studies deny any direct effect of geography on development and conclude that institutions dominate all other potential determinants of development. An alternative view emphasizes that geographic factors such as disease ecology, as proxied by the prevalence of malaria, may have a large negative effect on income, independent of the quality of a country’s institutions. For instance, pandemic malaria may create a large economic burden beyond medical costs and forgone earnings by affecting house- hold behavior and such macroeconomic variables as international investment and trade. After controlling for institutional quality, malaria prevalence is found to cause quanti- tatively important negative effects on income. The robustness of this finding is checked by employing alternative instrumental variables, tests of overidentification restrictions, and tests of the validity of the point estimates and standard errors in the presence of weak instruments. The baseline findings appear to be robust to using alternative specifications, instrumentations, and samples. The reported estimates suggest that good institutions may be necessary but not sufficient for generating a persistent process of successful economic development. Economists, historians, and other social scientists have explained the large differences in the standard of living between the world’s richest and poorest nations in many different ways. One strand of the literature has emphasized the preeminent role of physical geography in explaining cross-country differences in the level of development. Some recent empirical studies deny any direct effect of geography on development and conclude that institutions dominate all other potential determinants of development (Hall and Jones 1999; Acemoglu, Johnson, and Robinson 2001; Easterly and Levine 2003; Rodrik, Subramanian, and Trebbi THE WORLD BANK ECONOMIC REVIEW, VOL. 20, NO. 3, pp. 309–339 doi:10.1093/wber/lhl001 Advance Access publication June 8, 2006 Ó The Author 2006. Published by Oxford University Press on behalf of the International Bank for Reconstruction and Development / THE WORLD BANK. All rights reserved. For permissions, please e-mail: [email protected]. Kai Carstensen and Erich Gundlach are research fellows at the Kiel Institute for the World Economy; their email addresses are [email protected] and [email protected]. The authors thank two anonymous referees and the editor, seminar participants at Aarhus University, Goethe University in Frankfurt, and Hamburg University, participants at the Ninth Convention of the East Asian Economic Association in Hong Kong, and Michael Funke, Charles I. Jones, Rolf J. Langhammer, Dani Rodrik, and Jeffrey Sachs for helpful comments on an earlier draft, as well as William A. Masters for providing the data on frost frequency, Gordon McCord for explaining the malaria data, Stephen Donald for sharing a sample program on instrument selection, and Jean-Louis Arcand for suggesting econometric strategies. 309 Public Disclosure Authorized Public Disclosure Authorized Public Disclosure Authorized Public Disclosure Authorized Public Disclosure Authorized Public Disclosure Authorized Public Disclosure Authorized Public Disclosure Authorized
Transcript of The Primacy of Institutions Reconsidered: Direct...
The Primacy of Institutions Reconsidered: DirectIncome Effects of Malaria Prevalence
Kai Carstensen and Erich Gundlach
Some recent empirical studies deny any direct effect of geography on development andconclude that institutions dominate all other potential determinants of development. Analternative view emphasizes that geographic factors such as disease ecology, as proxiedby the prevalence of malaria, may have a large negative effect on income, independentof the quality of a country’s institutions. For instance, pandemic malaria may create alarge economic burden beyond medical costs and forgone earnings by affecting house-hold behavior and such macroeconomic variables as international investment and trade.After controlling for institutional quality, malaria prevalence is found to cause quanti-tatively important negative effects on income. The robustness of this finding is checkedby employing alternative instrumental variables, tests of overidentification restrictions,and tests of the validity of the point estimates and standard errors in the presence ofweak instruments. The baseline findings appear to be robust to using alternativespecifications, instrumentations, and samples. The reported estimates suggest thatgood institutions may be necessary but not sufficient for generating a persistent processof successful economic development.
Economists, historians, and other social scientists have explained the largedifferences in the standard of living between the world’s richest and poorestnations in many different ways. One strand of the literature has emphasized thepreeminent role of physical geography in explaining cross-country differences inthe level of development. Some recent empirical studies deny any direct effect ofgeography on development and conclude that institutions dominate all otherpotential determinants of development (Hall and Jones 1999; Acemoglu, Johnson,and Robinson 2001; Easterly and Levine 2003; Rodrik, Subramanian, and Trebbi
THE WORLD BANK ECONOMIC REVIEW, VOL. 20, NO. 3, pp. 309–339 doi:10.1093/wber/lhl001
Advance Access publication June 8, 2006
� The Author 2006. Published by Oxford University Press on behalf of the International
Bank for Reconstruction and Development / THE WORLD BANK. All rights reserved. For permissions,
please e-mail: [email protected].
Kai Carstensen and Erich Gundlach are research fellows at the Kiel Institute for the World Economy;
their email addresses are [email protected] and [email protected]. The authors thank
two anonymous referees and the editor, seminar participants at Aarhus University, Goethe University in
Frankfurt, and Hamburg University, participants at the Ninth Convention of the East Asian Economic
Association in Hong Kong, and Michael Funke, Charles I. Jones, Rolf J. Langhammer, Dani Rodrik, and
Jeffrey Sachs for helpful comments on an earlier draft, as well as William A. Masters for providing the
data on frost frequency, Gordon McCord for explaining the malaria data, Stephen Donald for sharing a
sample program on instrument selection, and Jean-Louis Arcand for suggesting econometric strategies.
309
Pub
lic D
iscl
osur
e A
utho
rized
Pub
lic D
iscl
osur
e A
utho
rized
Pub
lic D
iscl
osur
e A
utho
rized
Pub
lic D
iscl
osur
e A
utho
rized
Pub
lic D
iscl
osur
e A
utho
rized
Pub
lic D
iscl
osur
e A
utho
rized
Pub
lic D
iscl
osur
e A
utho
rized
Pub
lic D
iscl
osur
e A
utho
rized
wb451538
Typewritten Text
77526
2004). Engerman and Sokoloff (1997) and Acemoglu, Johnson, and Robinson(2002) examine how geographic endowments in the Americas may have shapedfactor abundance (people per unit of land) and how unequal factor abundancemay have shaped persistent institutions imposed by the colonizing powers thatenabled the entrenchment of a small group of elites. Because the IndustrialRevolution required the broad participation of the population in entrepreneurshipand innovation, economies were favored that started with a more equal factorabundance (due to geographic endowments) and hence with institutions thatresulted in a less unequal distribution of income and wealth. Overall, this newliterature emphasizes that geographic endowments affect the level of developmentonly through their impact on factor abundance, political economy, and institu-tions and not more directly.
While development economists can easily agree on the relevance of goodinstitutions for successful development and on the indirect role of physicalendowments in shaping different institutional outcomes and different pathsof development, there is no agreement on the direct role of geography fordevelopment in the recent empirical literature. Partly by highlighting thearguments of the older literature and partly by presenting new empiricalevidence, Jeffrey Sachs and his coauthors in particular have argued in aseries of papers that measures of geography such as disease ecology maydirectly affect the level of economic development in addition to the undis-puted effects of the institutional framework of a country (Bloom and Sachs1998; Gallup, Sachs, and Mellinser 1999; Gallup and Sachs 2001; Sachs 2001;McArthur and Sachs 2001; Sachs and Malaney 2002; Sachs 2003). The maindisagreement in the current debate concerns the robustness of the empiricalevidence presented by Sachs and his coauthors, which has been directly rejectedby Acemoglu, Johnson, and Robinson (2001) and Rodrik, Subramanian, andTrebbi (2004) and is in conflict with the studies that favor the primacy ofinstitutions.
A parsimonious baseline specification is used here to reconsider the generaleconometric limitations of alternative empirical strategies that have been appliedto derive clear-cut conclusions with regard to the deep determinants of develop-ment. Recent empirical studies have not treated geographic variables such asdisease ecology in the same way as measures of institutions, thus probablyreducing the chances of the geography hypothesis to prevail. The contributionof this article is to see whether a measure of disease ecology such as malariaprevalence, which is likely to be an endogenous geography variable, directlyexplains the level of development independent of a measure of institutions,which is also likely to be an endogenous variable. This appears to be an unsettledquestion in the empirical literature.
Mainly to keep the empirical analysis tractable in the presence of alimited number of candidates for instrumental variables, explanatory vari-ables other than institutions and disease ecology are ignored, not least
310 T H E W O R L D B A N K E C O N O M I C R E V I E W , V O L . 20, N O . 3
because measures such as the quality of economic policies (Easterly andLevine 2003) or the level of trade integration (Rodrik, Subramanian, andTrebbi 2004) have not been found to exert a direct effect on the level ofdevelopment independent from the effect of institutions. Instead, the emphasisis on the fundamental problems of statistical inference implied by instrumentalvariable estimation and on tracing the basic reason for the different empiricalresults on the direct role of disease ecology. After controlling for institutionalquality, malaria prevalence is found to have quantitatively important directnegative effects on income. This finding appears to be robust to alternativespecifications, instrumentations, and samples.
Finding a robust direct effect of malaria prevalence, which is held to be aproxy for the adverse disease ecology of a country, should matter for devis-ing appropriate development policies. For instance, if there is no empiricalevidence that malaria prevalence directly affects the level of development inimpoverished countries, foreign aid may be targeted mainly to improvepolicies and institutions. But the finding that there are such direct effectson income means that foreign aid should also be spent on solving biophy-sical and technological problems that are specific to public health in tropicalcountries. Especially in Sub-Saharan Africa, but probably also in parts ofAsia and Latin America, poor countries may need something in addition togood institutions to generate a persistent process of successful economicdevelopment.
I . TH E MA N Y PO S S I B L E LI N K S B E T W E E N GE O G R A P H Y,IN S T I T U T I O N S, A N D DE V E L O P M E N T
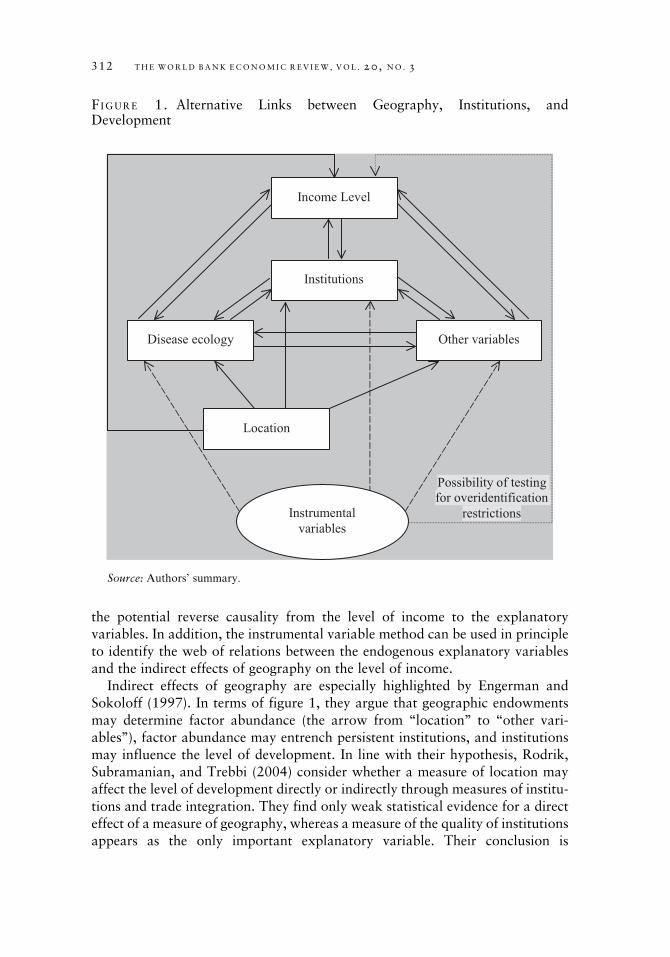
The various approaches that have been used to identify the many possible linksbetween geographic endowments, institutions, and level of development can berepresented with the help of figure 1. The solid arrows indicate the potentialdirections of causality between the variables considered, the dashed arrowsindicate the relation between the instrumental variables and the endogenousexplanatory variables, and the dotted arrow indicates the possibility of testingfor overidentification restrictions, if there are more instrumental variables thanendogenous variables.
Instrumental variables are needed to identify the direct development effects ofinstitutions and other endogenous explanatory variables. An instrumental vari-able can be used to identify that part of the variation in the endogenousexplanatory variables that is exogenous to the variation in the dependent vari-able, which here is the level of income per capita. The solid arrows indicate thatthe instrumental variable method can identify the true causal effect of theendogenous variables on the level of income. If valid instrumental variables areavailable, unbiased estimates of the causal effects on income of institutions,disease ecology, and other variables may be obtained without having to identify
Carstensen and Gundlach 311
the potential reverse causality from the level of income to the explanatoryvariables. In addition, the instrumental variable method can be used in principleto identify the web of relations between the endogenous explanatory variablesand the indirect effects of geography on the level of income.
Indirect effects of geography are especially highlighted by Engerman andSokoloff (1997). In terms of figure 1, they argue that geographic endowmentsmay determine factor abundance (the arrow from ‘‘location’’ to ‘‘other vari-ables’’), factor abundance may entrench persistent institutions, and institutionsmay influence the level of development. In line with their hypothesis, Rodrik,Subramanian, and Trebbi (2004) consider whether a measure of location mayaffect the level of development directly or indirectly through measures of institu-tions and trade integration. They find only weak statistical evidence for a directeffect of a measure of geography, whereas a measure of the quality of institutionsappears as the only important explanatory variable. Their conclusion is
Income Level
Institutions
Other variables Disease ecology
Location
Instrumental
variables
Possibility of testing
for overidentification
restrictions
FI G U R E 1. Alternative Links between Geography, Institutions, andDevelopment
Source: Authors’ summary.
312 T H E W O R L D B A N K E C O N O M I C R E V I E W , V O L . 20, N O . 3
confirmed by Easterly and Levine (2003), who do not use a measure of geogra-phy in their specification but instead employ an overidentification test to seewhether their set of geography-based instrumental variables can be consideredvalid. They find no evidence that any of their instrumental variables should beincluded in their specification, which may also be interpreted as supporting thehypothesis of the primacy of institutions.1
With all possibilities taken into account, certain variables may affect thelevel of income directly, through their effects on other variables, through onechannel, or not at all. Empirical estimates of the various potential causal effectsdepend crucially on the quality of the available instrumental variables, whichhave to be correlated with the endogenous explanatory variables but uncorre-lated with the error term in the structural equation. This condition will besatisfied if the instrumental variables affect the dependent variable only indir-ectly through the endogenous explanatory variables that are included in thestructural equation and if the instrumental variables are not affected by anyfeedback from the endogenous variables. Thus, almost by definition, validinstrumental variables are difficult to come by in the cross-country empiricsof development, because most economic variables are affected by the level ofincome. Measures of geography play a special role in this context because mostof them, such as distance from the equator or temperature, can undoubtedly beconsidered as exogenous to the level of development and to the endogenousexplanatory variables.
The problem is that once a measure of geography has a direct effect on the levelof income, it no longer qualifies as a valid instrumental variable. For instance,local temperature may affect the level of income either directly through thelocation–income link or through its effects on other variables (figure 1). Wherethere is a direct location–income link, the measure of geography cannot be used asan instrumental variable. And if the remaining available instrumental variables arealso mainly measures of geography such as distance from the equator, the inde-pendent variation across the exogenous variables could probably turn out to betoo small to allow for an empirical identification of all causal effects of interest.
Acemoglu, Johnson, and Robinson (2001) estimate a specification whereinstitutions and malaria prevalence determine the level of income. Since themeasure of malaria prevalence is not instrumented but is nevertheless statisti-cally insignificant, they conclude that there is no causal disease–income link. Insupport of their empirical results, Acemoglu, Johnson, and Robinson dismiss apriori the possibility that tropical diseases such as malaria could have a largeeffect on the level of development because people living in areas where suchdiseases are endemic may have developed immunities against the diseases.According to this view, malaria is unlikely to have strong income effects becauseit is a debilitating rather than a fatal disease, with the risk of severe illness and
1. See Hall and Jones (1999) for the same line of reasoning based on overidentification tests.
Carstensen and Gundlach 313
death limited mainly to people without any immunity such as children below theage of 5 years and adults who grew up elsewhere, like European settlers.2
However, this argument ignores other mechanisms through which malariamay affect the level of income. For instance, one form of immunity againstmalaria comes at a cost for the adult population. The sickle cell trait providesprotection against malaria without serious health complications when inheritedfrom only one parent, but the same allele inherited from both parents leads tosickle cell anemia.3 Sickle cell anemia generates severe episodes of pain andincreasing infections, outcomes that are at least comparable to the direct nega-tive health effects of malaria experienced by people without any immunity.These considerations suggest that due to natural selection, areas with a highprevalence of malaria are likely to be areas with a high prevalence of sickle cellanemia. Some estimates claim that up to 40 percent of the population in tropicalAfrica may carry the sickle cell trait.4 Thus, malaria may additionally cause poorhealth and absenteeism of the workforce through natural selection in favor of ahigh prevalence of the sickle cell trait.
This is not to deny that traditional studies of the economic costs of malariafind relatively small gross domestic product (GDP) losses on the basis of the totalnumber of cases and the fixed costs of prevention and treatment. But there are atleast two other mechanisms through which the pandemic nature of malaria canimpose large economic costs, namely by affecting household behavior andmacroeconomic variables such as foreign direct investment, trade, and tourism(Sachs and Malaney 2002). In response to the disease, households may increasefertility and thus the dependency ratio, which will reduce GDP per capita. A highfertility rate is also likely to reduce investments in human capital per child, whichmay reduce possibilities for long-run development. In addition, malaria infec-tions can reduce the cognitive development and learning ability of children,which may further depress the long-run average skill level and thus the level ofdevelopment. Malaria may also decrease household investment in physical
2. The Anopheles mosquito is the vector that transmits malaria from human to human. The mosquito
must first bite an infected person who is sick with malaria. Then, the mosquito must survive several days
while the malaria parasite develops in its body. Finally, the infected mosquito must bite another human to
complete the circle of infection. About 40 species of the Anopheles mosquito are significantly involved in
the transmission of malaria. These species differ substantially with respect to their feeding behavior on
humans and their longevity. Thus, all other things constant, the potential for malaria transmission will be
high in densely populated regions where the locally dominant Anopheles has developed, through biolo-
gical evolution, a specific human-biting behavior and a relatively high daily survival rate and has found
excellent breeding conditions. Most tropical regions combine these favorable conditions for malaria
prevalence. In moderate climatic zones far away from the equator, the breeding conditions are less
favorable, and the locally dominant Anopheles mosquitoes are less specialized on human biting and
usually less robust. However, differences in the potential for malaria transmission do exist not only across
but also within climatic zones, as is shown by a new measure called the stability of malaria transmission
(Kiszewski and others 2004).
3. For information on sickle cell anemia, see http://www.scinfo.org/ (March 2006).
4. See http://www.pbs.org/wgbh/evolution/library/01/2/l_012_02.html (March 2006).
314 T H E W O R L D B A N K E C O N O M I C R E V I E W , V O L . 20, N O . 3
capital compared with a situation with less-frequent episodes of illness, lowerfertility, and lower dependency ratios.
At the macroeconomic level, malaria appears to suppress the economic lin-kages between malarious and nonmalarious regions of the world. Foreign inves-tors may avoid malarious regions if the disease burden raises the costs ofattracting the needed labor force, and with less foreign investment inflows,there will be fewer possibilities of exploiting comparative advantages by specia-lization and international trade. For instance, trade in services such as tourismcannot prosper under conditions of high rates of malaria transmission, whichwill reduce the possibility to import growth-enhancing investment goods. Inaddition, malaria might be closely related to other diseases, either as a directcausal factor or by rendering individuals more susceptible to other diseases,which would further increase its cumulative economic costs. Malaria prevalencemay thus have much larger economic costs than will be visible from calculatingonly the direct medical costs and forgone earnings, especially if internationaltrade in goods and services and international investment are critical factors fordevelopment in an era of closer global economic integration.
To put the geography hypothesis on a more equal footing with the primacyof institutions hypothesis, both the prevalence of malaria and the quality ofinstitutions are used as endogenous explanatory variables, as suggested by Sachs(2003). The main interest is the relative size of the causal effects of the institu-tions–income link and the disease–income link (figure 1). This approachdiffers from the approaches by Hall and Jones (1999), Acemoglu, Johnson,and Robinson (2001), Easterly and Levine (2003), and Rodrik, Subramanian,and Trebbi (2004), which do not always instrument their measure of endo-genous disease ecology, use an exogenous measure of geography, or rely onan overidentification test only. Because of previous results reported in theliterature and a general shortage of plausible instrumental variables, allpossible effects that might result from explanatory variables other thaninstitutions and disease ecology are ignored, as are possible links betweeninstitutions and disease ecology. Different from Sachs (2003), additionalinstrumental variables are employed, recently developed econometric testsare used to check the validity of the point estimates and standard errors inthe presence of weak instrumental variables, and a test for overidentificationrestrictions is applied to avoid a potentially unjustified exclusion of exogenousmeasures of geography from the baseline specification.
I I . SP E C I F I C A T I O N A N D DA T A
In line with previous empirical studies, the following cross-country regressionequation is used to estimate the relative effects of institutional quality (INSTI-TUTIONS) and malaria prevalence (MALARIA) on economic development,which here is measured by the logarithm of GDP per capita (lnGDPC):
Carstensen and Gundlach 315
ln GDPCi ¼ �1 þ �2 � INSTITUTIONSi þ �3 �MALARIAi þ "ið1Þ
where "i is an error term with zero mean and common variance, and �2 and �3
are the coefficients of interest. The research question is whether an estimate of�3, as represented by the disease–income link in figure 1, is statistically differentfrom zero, negative, and quantitatively important. To better understand wherethe different results in the literature may come from, the baseline specification[(equation (1)] is re-estimated by paying particular attention to the choice of thevariables, the instruments, and the country sample.
The Choice of the Variables
Indicator variables are needed to measure the effects of institutions and geogra-phy on the level of economic development. Such indicator variables are necessa-rily incomplete and erroneous because the three concepts are multidimensionaland difficult to measure. Therefore, different indicator variables are used. Thedependent variable is either the lngdpc in 1995, which is used by Acemoglu,Johnson, and Robinson (2001), Easterly and Levine (2003), and Rodrik,Subramanian, and Trebbi (2004), or the log of GDP per working age person in1990 (lngdpw), which appears to be more closely related to the applied growthliterature and is used by Hall and Jones (1999).5
Institutional quality is measured by one of the following three variables: anaverage index of the quality of governance in 1996 (rule) from Kaufmann,Kraay, and Mastruzzi (2004), the index of government antidiversion policiesin 1986–95 (gadp) used by Hall and Jones (1999), and the index of protectionagainst expropriation in 1985–95 (exprop) used by Acemoglu, Johnson, andRobinson (2001). To measure disease ecology, two measures of malaria pre-valence are employed: the proportion of a country’s population at risk of malariafalciparum transmission in 1994 (malfal) used by Acemoglu, Johnson, andRobinson (2001) or a new index of malaria risk (malrisk) suggested by Sachs(2003). The new index is based on the prevalence of nonfatal species of themalaria pathogen (Plasmodium vivax, Plasmodium malariae, Plasmodiumovale), where a relatively higher proportion of malaria vivax is reported forthe Americas, Europe, and much of Asia than for sub-Saharan Africa. Forinternational comparisons, the new index may provide a more accurate measureof the share of the population that is at risk of malaria infection than the measureused by Acemoglu, Johnson, and Robinson (2001).
The Choice of the Instrumental Variables
Two premises, both suggested by Acemoglu, Johnson, and Robinson (2001), areused to find an instrumental variable for institutional quality. First, studying theimpact of institutions on the level of development has to focus on a sample of
5. See the appendix for detailed descriptions of the data and sources.
316 T H E W O R L D B A N K E C O N O M I C R E V I E W , V O L . 20, N O . 3
former colonies, because only this sample provides the necessary exogenousvariation in measures of institutions that can be exploited to estimate a causaleffect. Second, the potential endogeneity of any measure of institutional qualityshould be controlled for by a measure that is correlated with the current varia-tion in the institutional frameworks without being influenced by current eco-nomic conditions,6 and it should only affect the current level of developmentthrough its effect on institutions but not directly. In this context, mortalityamong European settlers in the early nineteenth century appears to be themost plausible instrumental variable that has been suggested to date.
Differences in mortality among early settlers across colonies, which were wellknown in Europe at the time, may explain the differences in institutional frame-works that were created by the colonizing powers. For instance, regions withlow mortality were favored for settlement, and colonies of settlers may haveimplemented for themselves a set of institutions that resembled the institutionsof their home countries by establishing property rights, the rule of law, andchecks against government power. In regions where large-scale settlement wasnot feasible for Europeans because of an unfavorable disease ecology and highrates of mortality, the colonial powers may have imposed a different set ofinstitutions that did not protect private property and did not provide protectionagainst expropriation but instead focused mainly on the extraction of naturalresources.7 Since early settler mortality is certainly independent of currenteconomic conditions and since early institutional frameworks have proved tobe fairly persistent over time (Acemoglu, Johnson, and Robinson 2001), settlermortality across former colonies can be used as an instrumental variable thathelps to identify the exogenous cross-country variation in current institutionalframeworks.
To control for the endogeneity of malaria prevalence, a new measure ofmalaria ecology (maleco) is considered that was developed by Kiszewski andothers (2004) and first used for cross-country regressions by Sachs (2003). Sincethis measure of malaria ecology is built only on the climatic factors and biolo-gical properties of each regionally dominant malaria vector, Kiszewski andothers (2004) claim that maleco is exogenous to public health interventionsand economic conditions and thus can be considered as a valid instrumentalvariable in regressions of economic development on malaria risk.
The index of malaria ecology measures the contribution of regionally domi-nant vector mosquitos to the potential transmission intensity of malaria. Thus, itincludes regions where malaria is not currently transmitted but where it had
6. Technically, this means that the control measure should be uncorrelated with the error term of the
income equation [equation (1)].
7. The hypothesis advanced by Acemoglu, Johnson, and Robinson (2001) that geographic and
climatic conditions were decisive for the adoption of institutions that favored either settlement or resource
extraction is in conflict with some historical facts for the colonization of the Americas. An alternative
hypothesis favored by Engerman and Sokoloff (1997) emphasizes initial factor abundance as determinants
of institutions. See Hoff (2003) for a survey of the issues.
Carstensen and Gundlach 317

been transmitted in the past or might be in the future.8 Since the region-specificdominant malaria vector reflects only the forces of biological evolution, it can beconsidered independent of current economic conditions. That is, terms likely tobe affected by economic conditions or public health interventions (mosquitoabundance, for example) do not enter the calculation of the index. The indexreveals that, because of different vector properties, a given malaria interventionis likely to have a smaller impact in the tropics than in more temperate climaticzones, where the vector is less robust and does not specialize in human biting andwhere the parasite has less fatal infectious consequences.
However, Rodrik, Subramanian, and Trebbi (2004) doubt that maleco isactually exogenous to current economic conditions. They object that Sachs(2003) does not detail the construction of the index and point out that Kiszewskiand others (2004) do not discuss exogeneity at all.9 While this critique istechnically correct, doubts regarding the exogeneity of maleco may not bejustified, as discussed in the previous paragraph. Nevertheless, three sets offurther instrumental variables that relate to the climatic environment, the influ-ence of Western European languages, and the openness of a country are con-sidered in addition to the two baseline instruments lnmort and maleco.
Temperature, rainfall, and latitude are additional measures of the climaticenvironment that can be related to preconditions for the prevalence of malaria.Since a key part of the life cycle of the parasite depends on a high ambienttemperature, malaria is intrinsically a disease of warm environments. Malariaalso depends on adequate conditions of mosquito breeding, mainly pools ofclean water from rainfall. Hence, the prevalence of frost (frost), measured asthe proportion of a country’s land receiving 5 or more frost days in winter, or thedegree of humidity (humid), measured as the highest temperature during themonth when average afternoon humidity is at its highest, may be considered asappropriate instrumental variables that are exogenous to economic conditions.In addition, distance from the equator as measured by the absolute latitude of a
8. Abstracting from all detail, the construction of the index proceeds in two basic steps. First, the
regionally dominant Anopheles mosquito is identified across countries in which malaria is or has been
endemic. The criteria for the identification of the dominant vector are its longevity and its human-biting
habit. Second, the index of malaria ecology is calculated as a2i p
Ei
� ��� ln pið Þ; where i is the identity of the
dominant malaria vector, a is the proportion of vector i biting people [0,1], p is the daily survival rate of
vector i [0,1], and E is the length of the extrinsic incubation period in days, which depends mainly on
average temperature and differs between Plasmodium falciparum and Plasmodium vivax. Hence, the
index value for a specific country is measured as a function of climatic factors that determine the required
habitat of the dominant vector and of biological properties of the region-specific dominant vectors.
9. Information on the construction of the malaria transmission index (malaria ecology) is available
online at http://www.earth.columbia.edu/about/director/malaria/index.html (March 2006). A previous
version of the text describing the construction of the index may have contributed to the impression that
maleco is not purged of endogeneity, because it stated that a measure of mosquito abundance is included
in the calculation. However, observed mosquito abundance enters the index of malaria ecology only as a
screen for precipitation data, where the independently identified dominant malaria vector is assumed to be
absent from the specific site under consideration if precipitation falls below a certain level per month.
318 T H E W O R L D B A N K E C O N O M I C R E V I E W , V O L . 20, N O . 3
country (latitude) may also be used as a proxy for the climatic environment.What has to be taken into account, however, is that these three measures ofclimatic conditions may be instrumental variables not only for measures ofdisease ecology but also for measures of institutional quality. This is becausesettler mortality and thus the design of early institutions were influenced by theprevailing climatic conditions of the colonies. In this context, Acemoglu,Johnson, and Robinson (2001) point out that their work shows why absolutedistance from the equator might matter as an instrument for a measure ofinstitutions, as used in Hall and Jones (1999).
Other plausible instrumental variables than measures of geography are moredifficult to come by. One possibility is to consider the share of the populationthat speaks English (engfrac) or another Western European language (eurfrac) asthe first language. As suggested by Hall and Jones (1999), these variables mayreflect the different degree of Western European influence on the sample coun-tries and thus may help to identify the exogenous variation in measures ofinstitutions. Since Acemoglu, Johnson, and Robinson (2001) generally questionthe exogeneity of these variables, some formal tests of exogeneity are providedwhen using them in the checks of the robustness of the baseline results.
Furthermore, instrumental variables that are used for checking robustnessrelate to a country’s trade openness. More open countries may have betterinstitutions because openness may encourage less arbitrary government beha-vior, especially toward property rights. Thus, exogenous measures of opennesscould be used as instrumental variables for measures of institutions. Two mea-sures of openness are employed: the proportion of land area that is within 100kilometers of the coast (coast), which is taken from McArthur and Sachs (2001),and the (log) predicted trade share of a country (trade), which is constructed byFrankel and Romer (1999) from a gravity model that uses mainly geographicalvariables to explain actual bilateral trade flows.
Choice of the Sample
The sample of countries is limited to former colonies for which data on earlysettler mortality are available. Acemoglu, Johnson, and Robinson (2001, table 7,p. 1392) estimate equation 1 for a sample of 62 countries. This sample, however,includes 14 countries that are known to provide unreliable statistics (rated as Dcountries in Summers and Heston 1991), two countries that are very small (lessthan 1 million inhabitants in 1990), and one country that depends mainly on oilproduction. These countries are removed from the sample. Thus, baseline resultsare reported for a smaller but probably more reliable sample of 45 formercolonies that are not statistical terra incognita, small, or dependent on oilproduction. By contrast, previous studies that took issue with the Acemoglu,Johnson, and Robinson result on the primacy of institutions (McArthur andSachs 2001; Easterly and Levine 2003; Sachs 2003; Rodrik, Subramanian, andTrebbi 2004) increased the Acemoglu, Johnson, and Robinson sample size but
Carstensen and Gundlach 319
disregarded data quality. As a robustness check of the baseline findings onsample size, a larger sample of countries with additional observations on settlermortality (Acemoglu, Johnson, and Robinson 2000) is also included.
I I I . BA S E L I N E ES T I M A T I O N RE S U L T S
To begin, equation 1 is estimated by two-step least squares (2SLS) using lngdpc asthe dependent variable, rule and malfal as explanatory variables, and lnmort andmaleco as instrumental variables. This baseline specification is close to specifica-tions in the literature. In particular, (a) lngdpc is used as the dependent variableby Acemoglu, Johnson, and Robinson (2001), Easterly and Levine (2003), andRodrik, Subramanian, and Trebbi (2004); (b) rule is used as a measure ofinstitutional quality by Easterly and Levine (2003) and Rodrik, Subramanian,and Trebbi (2004); and (c) malfal is used as a measure of malaria prevalence byAcemoglu, Johnson, and Robinson (2001). The results are presented in column 1of table 1.
The point estimates have the expected signs and are quantitatively important.The point estimate of �2 reflects the change in log output per capita associatedwith an one-unit increase in the index of governance quality. Thus, �2 = 0.89implies that a difference of 0.1 in the governance index is associated with a 8.9percent cross-country difference in output per capita. To show the potentialmagnitude of the estimated effect of the measure of institutions on economicperformance, two countries in the sample that represent about the 70th and the30th percentile of the governance index are compared, South Africa with anindex value of 0.21 and Ecuador with a value of �0.40. This difference ispredicted to result in a 0.54 log-point difference [(0.21 + 0.40) times 0.89]between the log per capita GDPs of the two countries. That is, the per capitaGDPs of South Africa and Ecuador are predicted to differ by a factor of about 1.7due to institutional differences, whereas their sample per capita GDPs differ by afactor of about 2.7.
The point estimate of �3 reflects the change in log output per capita associatedwith an one-unit increase in malaria prevalence. Thus, �3 = �1.04 implies thatthe per capita GDPs of Paraguay and Pakistan, which represent roughly the 40thand the 70th percentile of the highly stratified distribution of the malaria index(with percent values of 0.001 for Paraguay and 0.49 for Pakistan), should differby a factor of about 1.7 due to the differences in the proportion of the popula-tion that lives with the risk of malaria infection, whereas the sample per capitaGDPs of these two countries differ by a factor of about 2.6.
The point estimates are statistically significant, with estimated standarderrors of 0.18 for �2 and 0.30 for �2, which imply t-statistics of 5.04 and�3.46. These values indicate statistical significance at the 5 percent level whenusing t-tests based on conventional asymptotic theory. The reported conven-tional confidence intervals contain the unknown true parameters with a
320 T H E W O R L D B A N K E C O N O M I C R E V I E W , V O L . 20, N O . 3
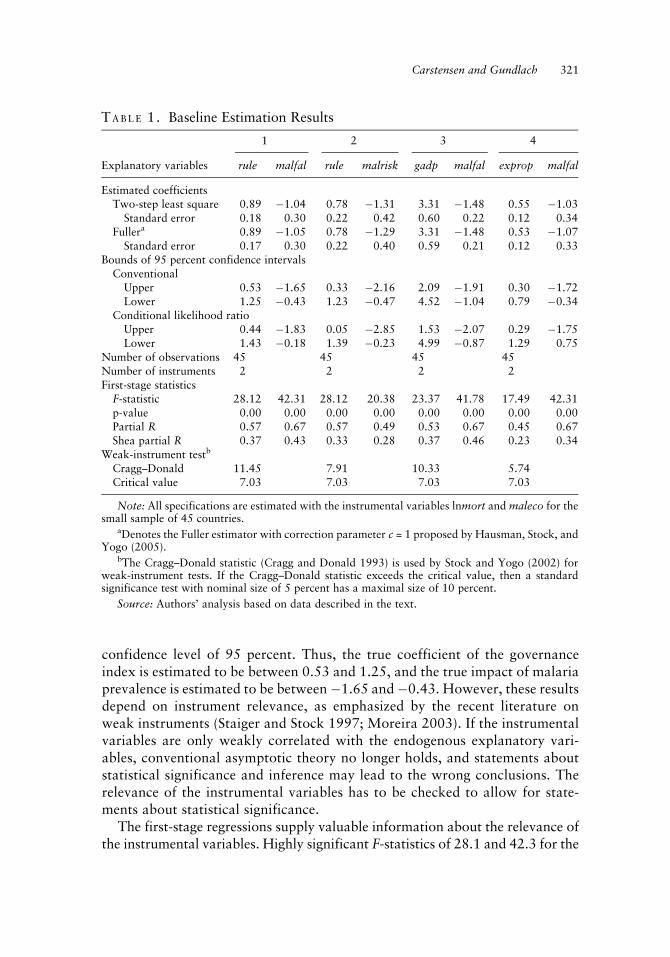
confidence level of 95 percent. Thus, the true coefficient of the governanceindex is estimated to be between 0.53 and 1.25, and the true impact of malariaprevalence is estimated to be between�1.65 and�0.43. However, these resultsdepend on instrument relevance, as emphasized by the recent literature onweak instruments (Staiger and Stock 1997; Moreira 2003). If the instrumentalvariables are only weakly correlated with the endogenous explanatory vari-ables, conventional asymptotic theory no longer holds, and statements aboutstatistical significance and inference may lead to the wrong conclusions. Therelevance of the instrumental variables has to be checked to allow for state-ments about statistical significance.
The first-stage regressions supply valuable information about the relevance ofthe instrumental variables. Highly significant F-statistics of 28.1 and 42.3 for the
TA B L E 1. Baseline Estimation Results
1 2 3 4
Explanatory variables rule malfal rule malrisk gadp malfal exprop malfal
Estimated coefficientsTwo-step least square 0.89 �1.04 0.78 �1.31 3.31 �1.48 0.55 �1.03
Standard error 0.18 0.30 0.22 0.42 0.60 0.22 0.12 0.34Fullera 0.89 �1.05 0.78 �1.29 3.31 �1.48 0.53 �1.07
Standard error 0.17 0.30 0.22 0.40 0.59 0.21 0.12 0.33Bounds of 95 percent confidence intervals
ConventionalUpper 0.53 �1.65 0.33 �2.16 2.09 �1.91 0.30 �1.72Lower 1.25 �0.43 1.23 �0.47 4.52 �1.04 0.79 �0.34
Conditional likelihood ratioUpper 0.44 �1.83 0.05 �2.85 1.53 �2.07 0.29 �1.75Lower 1.43 �0.18 1.39 �0.23 4.99 �0.87 1.29 0.75
Number of observations 45 45 45 45Number of instruments 2 2 2 2First-stage statistics
F-statistic 28.12 42.31 28.12 20.38 23.37 41.78 17.49 42.31p-value 0.00 0.00 0.00 0.00 0.00 0.00 0.00 0.00Partial R 0.57 0.67 0.57 0.49 0.53 0.67 0.45 0.67Shea partial R 0.37 0.43 0.33 0.28 0.37 0.46 0.23 0.34
Weak-instrument testb
Cragg–Donald 11.45 7.91 10.33 5.74Critical value 7.03 7.03 7.03 7.03
Note: All specifications are estimated with the instrumental variables lnmort and maleco for thesmall sample of 45 countries.
aDenotes the Fuller estimator with correction parameter c = 1 proposed by Hausman, Stock, andYogo (2005).
bThe Cragg–Donald statistic (Cragg and Donald 1993) is used by Stock and Yogo (2002) forweak-instrument tests. If the Cragg–Donald statistic exceeds the critical value, then a standardsignificance test with nominal size of 5 percent has a maximal size of 10 percent.
Source: Authors’ analysis based on data described in the text.
Carstensen and Gundlach 321

first-stage regressions of rule and of malrisk are reported (see table 1). Inaddition, both the usual partial R2 and the Shea (1997) partial R2 are farabove zero. These test results point to strong instruments, but even large first-stage F-statistics can be misleading. For example, the two instruments lnmortand maleco may not carry sufficient independent information, which couldmake it difficult to identify distinct effects of rule and malrisk. To this end, astatistic proposed by Cragg and Donald (1993) is computed, which representsthe relevance of the weakest instrument. Using weak-instrument asymptotictheory, Stock and Yogo (2002) show that a conventional significance test on �with a nominal size of 5 percent has an actual size of 10 percent or more, and isthus severely distorted, if the Cragg–Donald statistic is below 7. Since the Cragg–Donald statistic equals 11.45, the results of the baseline specification are notaffected by weak-instrument problems.
As a further robustness check for specifications with potentially weak instru-ments, a modified limited information maximum likelihood estimator (Fuller1977) is applied. This Fuller estimator with modification parameter a = 1 is morerobust to the presence of weak instruments than 2SLS (Hahn, Hausman, andKuersteiner 2004; Hausman, Stock, and Yogo 2005). The Fuller point estimatesare almost identical to the 2SLS estimates, with estimates of 0.89 for �2 and�1.05 for �3. In addition, 95 percent confidence intervals are computed basedon inverted conditional likelihood ratio (CLR) tests that take any weak-instru-ment problem into account (Moreira 2003).10 The CLR intervals turn out to beonly slightly larger than the confidence intervals based on conventional asymp-totic theory reported above, ranging from 0.44 to 1.43 for �2 and from �1.83 to�0.18 for �3. In particular, when the CLR confidence intervals are turned intosignificance tests, both �2 and �3 are individually statistically significant,because the confidence intervals do not include zero.
Before proceeding with further robustness checks, it is worth summarizingthe results obtained with the baseline specification. The point estimates for theeffects of institutional quality and malaria prevalence have the expected signsand are economically important. They do not appear to suffer from a weak-instrument problem and so appear statistically significant as well. Identifying adirect effect of a measure of disease ecology on the level of developmentconflicts with the evidence presented by Hall and Jones (1999); Acemoglu,Johnson, and Robinson (2001); Easterly and Levine (2003); and Rodrik, Sub-ramanian, and Trebbi (2004) and confirms the evidence presented by Sachs(2003).
10. Since there are two endogenous explanatory variables, the approach of Moreira (2003) delivers a
bivariate confidence region from which two univariate confidence intervals are calculated by the projec-
tion method put forward by Dufour (1997). A Matlab program that accomplishes this task is available on
request.
322 T H E W O R L D B A N K E C O N O M I C R E V I E W , V O L . 20, N O . 3
IV. RO B U S T N E S S
The results of the baseline specification are subjected to a number of robustnesschecks, beginning with the effects on the baseline results of alternative measuresof the dependent variable and of the endogenous explanatory variables. Otherrobustness checks assess the inclusion of alternative and additional instrumentalvariables, the validity of the baseline instruments lnmort and maleco, and theimpact on the results when a larger sample of countries is used.
Effects of Alternative Variables
Estimation results for specifications with alternative explanatory variables arepresented in columns 2–4 of table 1. In column 2, institutional quality is stillmeasured by the governance index (rule), but malaria prevalence is now mea-sured by the risk of infection with the nonfatal malaria pathogen (malrisk). Themain difference from the baseline specification is the smaller weight for institu-tional quality and the larger weight for malaria prevalence. This difference maybe due simply to estimation uncertainty, which has increased compared with thebaseline specification, as indicated by the larger confidence intervals. Moreover,the weak-instrument problem is of slightly greater relevance than before, asindicated by a smaller Cragg–Donald statistic, which nevertheless still exceedsthe critical value of 7. Despite somewhat weaker test statistics, all generalconclusions drawn from the baseline specification are confirmed by the specifi-cation with malrisk as well. Therefore, all further-reported specifications usemalfal as the measure of malaria prevalence.11
In column 3, the governance index is replaced by the index of governmentantidiversion policies (gadp) as a measure of institutional quality, while malariaprevalence is measured by the risk of infection with malaria falciparum (malfal).The point estimate for �2 is considerably larger than in the baseline specification,but this is due mainly to the smaller variance of gadp compared with rule. Thepoint estimate for �3 is also absolutely larger than in the baseline specification,but the difference is not substantial if estimation uncertainty is taken intoaccount. The economic significance of these estimates can be shown again forthe country pairs discussed above. With a point estimate of 3.31 for �2, theempirical model predicts that the per capita GDPs of South Africa and Ecuadordiffer by a factor of 1.7 due to differences in institutional quality, whereas theirsample per capita GDPs differ by a factor of about 2.7. With a point estimate of�1.48 for �3, the model predicts that the per capita GDPs of Paraguay andPakistan differ by a factor of 2.1 due to differences in malaria prevalence,whereas their sample per capita GDPs differ by a factor of about 2.6. Thestatistical significance of these estimates can be inferred from both the conven-tional and the CLR confidence intervals, which do not include zero. In addition,
11. Detailed results based on specifications with malrisk are available on request.
Carstensen and Gundlach 323
there is no weak-instrument problem, as indicated by a large Cragg–Donaldstatistic.
In column 4, the governance index is replaced by the risk of expropriation(exprop), while the risk of infection with malaria falciparum (malfal) remains themeasure of malaria prevalence. This is the specification analyzed by Acemoglu,Johnson, and Robinson (2001, table 7), who obtain an insignificant effect ofmalaria prevalence with their sample of countries (without instrumenting malfal).For the re-estimated equation, the point estimate of �2 is smaller than in thebaseline specification, but this may be explained by the estimation uncertainty andthe larger variance of exprop compared with rule. The point estimate of �3 isvirtually unchanged. At first sight, both estimates appear statistically significant,as indicated by low standard errors (2SLS and Fuller). However, the Cragg–Donaldstatistic of 5.74 indicates a weak-instrument problem. The 2SLS estimator may bebiased and the conventional confidence intervals may be inadequate. While thepoint estimates and standard errors remain virtually unchanged when the robustFuller estimator is used, the CLR confidence intervals of Moreira (2003) indicatethat the estimate of the coefficient on exprop is statistically significant but theestimate of the coefficient on malfal is not.
However, this result does not necessarily imply that malaria prevalence doesnot have an effect on per capita income. Rather, it indicates that it may not bepossible to identify an independent effect with sufficient precision, given therelatively small sample size. This view can be supported by two observations.First, a correlation coefficient of 0.6 shows that the instrumental variableslnmort and maleco are strongly correlated, which does not leave much informa-tion in one instrument that is independent of the other. While this informationappears to be sufficient for the previous specifications, it turns out to be insuffi-cient for the current specification, as indicated by lower Shea partial R2s thanbefore.
Second, the power of the significance test for �3 (which is derived from itsestimated confidence interval) might be low, probably due to the weak-instru-ment problem. While not much is known about the power of significance tests inthe presence of weak instruments, power is certainly lower than in the conven-tional strong-instrument case, due to reduced estimation precision. More speci-fically, the power of a significance test for �3 using conventional asymptotictheory should give an upper bound for the power of a significance test underweak-instrument asymptotic theory. Fortunately, power for the former test canbe easily calculated following the approach by Andrews (1989). An interval withpower below 0.5 is calculated to see in which region of true parameter values�3 6¼ 0 the test can be expected not to reject the wrong null hypothesis �3 = 0.The interval turns out to be [�0.67, 0.67]. This implies that true parametervalues of �3 between �0.67 and 0.67 have a better chance to be undetected thanto be detected. An interval with power below 0.95 turns out to be [�1.23, 1.23].This implies that only true parameter values of |�3| > 1.23 are likely (with
324 T H E W O R L D B A N K E C O N O M I C R E V I E W , V O L . 20, N O . 3
probability above 95 percent) to be found statistically significant. The 2SLS pointestimate of �3 is only �1.03.
Since the correct power of a significance test based on weak-instrumentasymptotic theory is likely to be overstated in this exercise, the lower intervallimits of �0.67 for power regions below 50 percent and of �1.23 for powerregions below 95 percent are only upper bounds for the correct but unknowninterval limits. That is, the power of the significance test for �3 appears to bequite low, given that parameter values for �3, such as the reported point esti-mate, are economically important but statistically difficult to distinguish fromzero. Thus, finding the coefficient estimate of �3 to be statistically insignificant isprobably due to the low power of the significance test rather than to theunimportance of malaria prevalence for economic development.12 This conclu-sion is also corroborated by the statistically significant point estimates of �3 incolumns 1 and 3 of table 1.
Effects of Additional Instrumental Variables
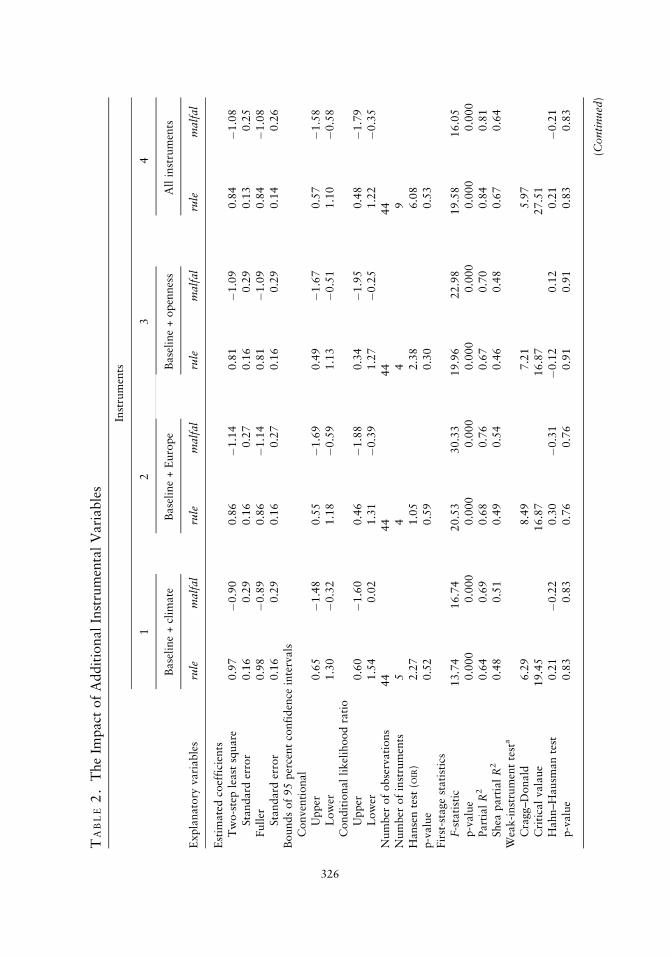
To exclude the possibility that the reported results are driven by the choice ofinstrumental variables, the analysis is replicated using additional sets of instru-mental variables related to the climatic environment (frost, humid, and latitude),the Western European influence (eurfrac and engfrac), and openness (coast andtrade). The analysis is restricted to the baseline specification, where institutionalquality is measured by the governance index (rule) and malaria prevalence ismeasured by the risk of infection with malaria falciparum (malfal). The resultsare presented in table 2.
Once the additional climate instruments (frost, humid, and latitude) areincluded (table 2, column 1), the effect of institutional quality is found to bestronger than in the baseline specification (table 1, column 1), whereas the effectof malaria prevalence is weaker. Both differences are small and can be explainedby estimation uncertainty. The Hansen test does not reject the three overidenti-fying restrictions that arise from the fact that the two endogenous regressors arenow estimated with five instruments. Taken at face value, this test result wouldimply that the exogeneity restrictions on the instruments appear valid and thatthere are no direct effects on the level of economic development from theadditional instruments.
The result of the Hansen test should be viewed with care if there are signs of aweak-instrument problem, because then the usual inference based on the �2
distribution of the test statistic would no longer hold. There is conflictingevidence on the presence of weak instruments. The Cragg–Donald statistic,which is much smaller than the critical value, does indicate a weak-instrumentproblem. But the weak-instrument test of Hahn and Hausman (2002), which canbe applied only for overidentified equations, does not reject the null hypothesis
12. The reason for the low power is probably that the small sample is not informative enough to
identify an independent effect of malaria prevalence in this specification.
Carstensen and Gundlach 325
TA
BL
E2
.T
he
Impact
of
Addit
ional
Inst
rum
enta
lV
ari
able
s
Inst
rum
ents
12
34
Base
line
+cl
imate
Base
line
+E
uro
pe
Base
line
+open
nes
sA
llin
stru
men
ts
Expla
nato
ryvari
able
sru
lem
alfa
lru
lem
alfa
lru
lem
alfa
lru
lem
alfa
l
Est
imate
dco
effi
cien
tsT
wo-s
tep
least
square
0.9
7�
0.9
00.8
6�
1.1
40.8
1�
1.0
90.8
4�
1.0
8Sta
ndard
erro
r0.1
60.2
90.1
60.2
70.1
60.2
90.1
30.2
5Full
er0.9
8�
0.8
90.8
6�
1.1
40.8
1�
1.0
90.8
4�
1.0
8Sta
ndard
erro
r0.1
60.2
90.1
60.2
70.1
60.2
90.1
40.2
6B
ounds
of
95
per
cent
confi
den
cein
terv
als
Conven
tional
Upper
0.6
5�
1.4
80.5
5�
1.6
90.4
9�
1.6
70.5
7�
1.5
8L
ow
er1.3
0�
0.3
21.1
8�
0.5
91.1
3�
0.5
11.1
0�
0.5
8C
ondit
ional
likel
ihood
rati
oU
pper
0.6
0�
1.6
00.4
6�
1.8
80.3
4�
1.9
50.4
8�
1.7
9L
ow
er1.5
40.0
21.3
1�
0.3
91.2
7�
0.2
51.2
2�
0.3
5N
um
ber
of
obse
rvati
ons
44
44
44
44
Num
ber
of
inst
rum
ents
54
49
Hanse
nte
st( O
IR)
2.2
71.0
52.3
86.0
8p-v
alu
e0.5
20.5
90.3
00.5
3Fir
st-s
tage
stati
stic
sF-s
tati
stic
13.7
416.7
420.5
330.3
319.9
622.9
819.5
816.0
5p-v
alu
e0.0
00
0.0
00
0.0
00
0.0
00
0.0
00
0.0
00
0.0
00
0.0
00
Part
ial
R2
0.6
40.6
90.6
80.7
60.6
70.7
00.8
40.8
1Shea
part
ial
R2
0.4
80.5
10.4
90.5
40.4
60.4
80.6
70.6
4W
eak-i
nst
rum
ent
test
a
Cra
gg–D
onald
6.2
98.4
97.2
15.9
7C
riti
cal
vala
ue
19.4
516.8
716.8
727.5
1H
ahn–H
ausm
an
test
0.2
1�
0.2
20.3
0�
0.3
1�
0.1
20.1
20.2
1�
0.2
1p-v
alu
e0.8
30.8
30.7
60.7
60.9
10.9
10.8
30.8
3
(Conti
nued
)
326

TA
BL
E2
.C
onti
nued
Inst
rum
ents
12
34
Base
line
+cl
imate
Base
line
+E
uro
pe
Base
line
+open
nes
sA
llin
stru
men
ts
Expla
nato
ryvari
able
sru
lem
alfa
lru
lem
alfa
lru
lem
alfa
lru
lem
alfa
l
Inst
rum
ent
sele
ctio
ncr
iter
iab
Donald
–N
ewey
MSE
0.4
20.3
70.4
70.1
0B
IC�
8.9
9�
6.5
0�
3.6
8�
18.8
4H
QIC
�5.6
7�
4.2
8�
1.4
6�
11.0
8
Note
:T
he
sets
of
inst
rum
ents
are
base
line
(lnm
ort
and
mal
eco),
clim
ate
(fro
st,
hum
id,
and
lati
tude)
,E
uro
pe
(eurf
rac
and
engf
rac)
,and
open
nes
s(c
oas
tand
trad
e).
aT
he
Cra
gg–D
onald
stati
stic
(Cra
gg
and
Donald
1993)
isuse
dby
Sto
ckand
Yogo
(2002)
for
wea
k-i
nst
rum
ent
test
s.If
the
Cra
gg–D
onald
stati
stic
exce
eds
the
crit
icalvalu
e,th
ena
standard
signif
icance
test
wit
hnom
inalsi
zeof
5per
cent
has
am
axim
al
size
of
10
per
cent.
The
wea
k-i
nst
rum
ent
test
by
Hahn
and
Hausm
an
(2002)
isbase
don
the
norm
ali
zed
dif
fere
nce
bet
wee
nbia
s-adju
sted
two-s
tep
least
square
ses
tim
ato
rs( B
2SL
S)fo
ran
equati
on
and
its
rever
seeq
uati
on,
wher
eth
ele
ft-s
ide
vari
able
and
the
endogen
ous
right-
side
vari
able
are
inte
rchanged
.bT
he
Donald
–N
ewey
inst
rum
ent
sele
ctio
ncr
iter
ion
(Donald
and
New
ey2001)
isth
eex
pec
ted
aver
age
mea
n-s
quare
der
ror
of
the
2SL
Ses
tim
ato
r.B
ICand
HQ
ICare
the
Bayes
ian
and
Hannan–Q
uin
nin
form
ati
on
crit
eria
(Andre
ws
1999)
for
the
choic
eof
inst
rum
ents
.
Sourc
e:A
uth
ors
’analy
sis
base
don
data
des
crib
edin
the
text.
327
of strong instruments. On balance, it can be concluded that the results of thebaseline specification are not rejected by adding additional climate instruments,because significant effects of institutional quality and malaria prevalence areobtained if the robust CLR confidence intervals are used for inference.13
Adding the Western European instruments (table 2, column 2) and theopenness instruments (table 2, column 3) to the baseline instruments alsodoes not change the results by much. Both institutional quality and malariaprevalence exert highly significant effects, even if a potential weak-instrumentproblem is taken into account, as indicated by the Cragg–Donald test. Again,the overidentifying restrictions are not rejected, and the conclusions of thebaseline model are confirmed, as indicated by the CLR confidence intervals.This result is not altered when all instruments are included together (table 2,column 4). The parameters remain highly significant, and the Hansen test stilldoes not reject the overidentifying restrictions. Moreover, a Hansen differencetest cannot reject the additional overidentifying restrictions of column 4 intable 2 over those of the columns 1, 2, and 3, leading to test statistics of 3.81(p-value 0.43), 5.03 (p-value 0.41), and 3.7 (p-value 0.59). Thus, includingadditional instrumental variables based on climate, Western European influ-ence, and openness does not change the conclusions relative to those obtainedfrom the baseline specification.
As a further robustness check to see which set of instrumental variables isfavored, three formal instrument selection criteria are applied—the expectedaverage mean squared error criterion of Donald and Newey (2001), the Baye-sian information criterion, and the Hannan–Quinn information criterion ofAndrews (1999). All test results suggest choosing the full instrument set.14
However, it must be taken into account that these criteria are not designed forspecifications with weak instruments, where they may lead to the wrongconclusions. As a general tendency in the estimation results, the weak-instru-ment problem appears to increase with the number of instruments, at least ifthe Cragg–Donald statistic is taken as the benchmark. This may reflect anoverfitting problem when using many instruments, notably in table 2, column4, where nine instrumental variables are employed for a sample of 45 coun-tries. Nevertheless, the point estimates are quite robust to the number ofinstruments included. This indicates that the results of the baseline specifica-tion are not driven by the choice of instruments and that the baseline specifica-tion should be preferred to minimize overfitting and the weak-instrumentproblems.
13. The 95 percent CLR confidence interval includes zero but is a borderline case. For example, a 93
percent CLR confidence interval does not include zero.
14. The values of Bayesian and Hannan–Quinn information criteria equal zero for all just-identified
specifications and are therefore reported only for overidentified specifications.
328 T H E W O R L D B A N K E C O N O M I C R E V I E W , V O L . 20, N O . 3
Validity of Lnmort and Maleco
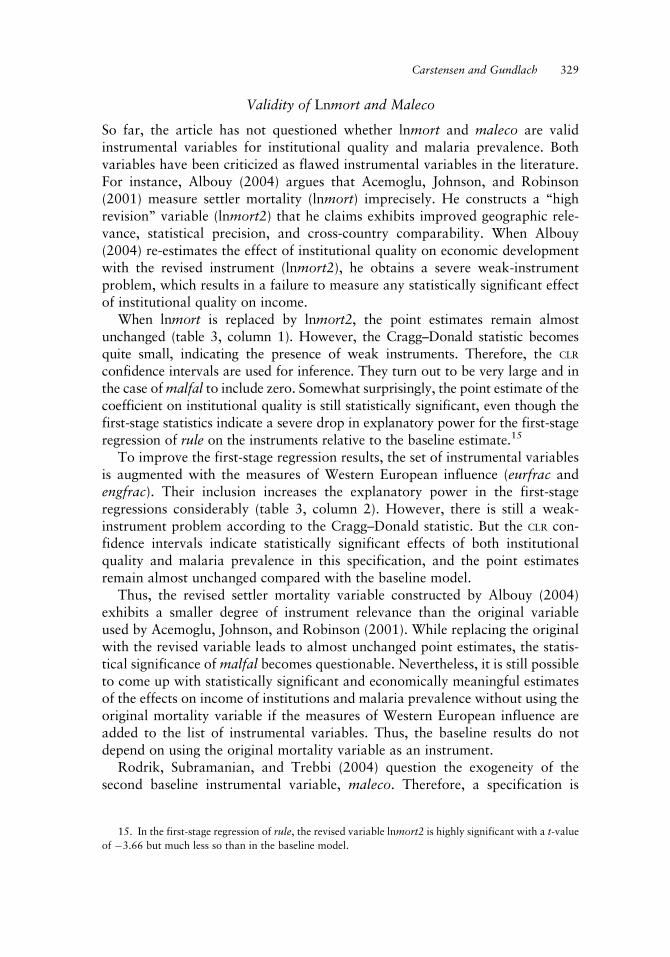
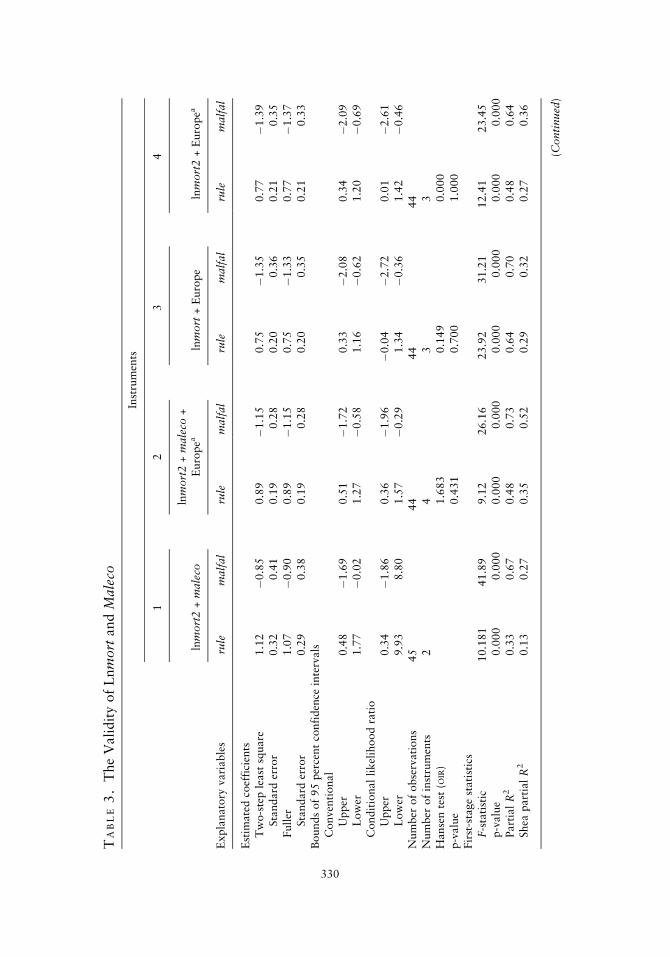
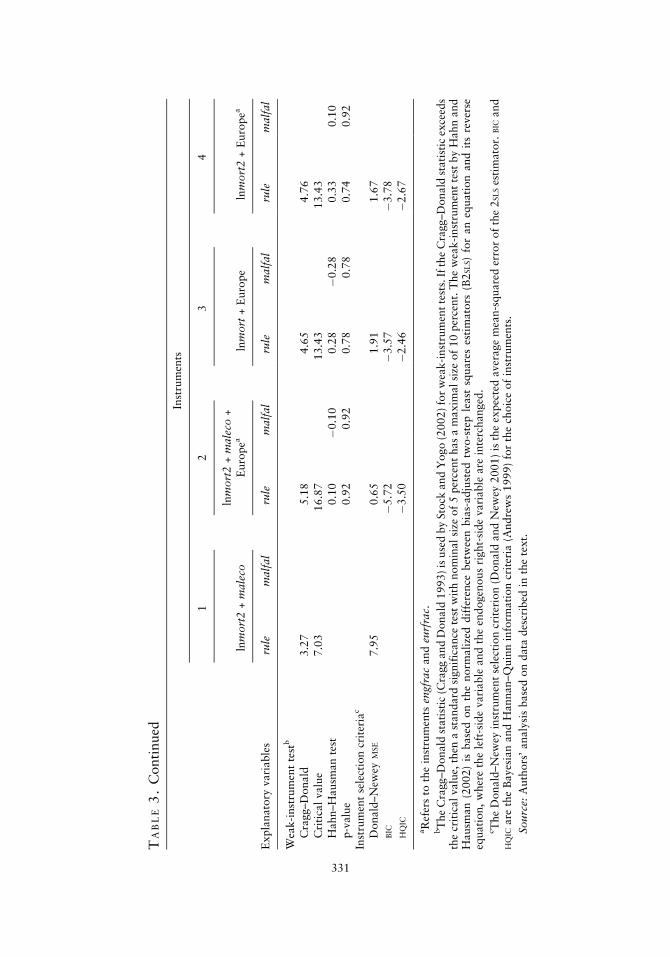
So far, the article has not questioned whether lnmort and maleco are validinstrumental variables for institutional quality and malaria prevalence. Bothvariables have been criticized as flawed instrumental variables in the literature.For instance, Albouy (2004) argues that Acemoglu, Johnson, and Robinson(2001) measure settler mortality (lnmort) imprecisely. He constructs a ‘‘highrevision’’ variable (lnmort2) that he claims exhibits improved geographic rele-vance, statistical precision, and cross-country comparability. When Albouy(2004) re-estimates the effect of institutional quality on economic developmentwith the revised instrument (lnmort2), he obtains a severe weak-instrumentproblem, which results in a failure to measure any statistically significant effectof institutional quality on income.
When lnmort is replaced by lnmort2, the point estimates remain almostunchanged (table 3, column 1). However, the Cragg–Donald statistic becomesquite small, indicating the presence of weak instruments. Therefore, the CLR
confidence intervals are used for inference. They turn out to be very large and inthe case of malfal to include zero. Somewhat surprisingly, the point estimate of thecoefficient on institutional quality is still statistically significant, even though thefirst-stage statistics indicate a severe drop in explanatory power for the first-stageregression of rule on the instruments relative to the baseline estimate.15
To improve the first-stage regression results, the set of instrumental variablesis augmented with the measures of Western European influence (eurfrac andengfrac). Their inclusion increases the explanatory power in the first-stageregressions considerably (table 3, column 2). However, there is still a weak-instrument problem according to the Cragg–Donald statistic. But the CLR con-fidence intervals indicate statistically significant effects of both institutionalquality and malaria prevalence in this specification, and the point estimatesremain almost unchanged compared with the baseline model.
Thus, the revised settler mortality variable constructed by Albouy (2004)exhibits a smaller degree of instrument relevance than the original variableused by Acemoglu, Johnson, and Robinson (2001). While replacing the originalwith the revised variable leads to almost unchanged point estimates, the statis-tical significance of malfal becomes questionable. Nevertheless, it is still possibleto come up with statistically significant and economically meaningful estimatesof the effects on income of institutions and malaria prevalence without using theoriginal mortality variable if the measures of Western European influence areadded to the list of instrumental variables. Thus, the baseline results do notdepend on using the original mortality variable as an instrument.
Rodrik, Subramanian, and Trebbi (2004) question the exogeneity of thesecond baseline instrumental variable, maleco. Therefore, a specification is
15. In the first-stage regression of rule, the revised variable lnmort2 is highly significant with a t-value
of �3.66 but much less so than in the baseline model.
Carstensen and Gundlach 329
TA
BL
E3
.T
he
Validit
yof
Lnm
ort
and
Mal
eco
Inst
rum
ents
12
34
lnm
ort
2+
mal
eco
lnm
ort
2+
mal
eco
+E
uro
pea
lnm
ort
+E
uro
pe
lnm
ort
2+
Euro
pea
Expla
nato
ryvari
able
sru
lem
alfa
lru
lem
alfa
lru
lem
alfa
lru
lem
alfa
l
Est
imate
dco
effi
cien
tsT
wo-s
tep
least
square
1.1
2�
0.8
50.8
9�
1.1
50.7
5�
1.3
50.7
7�
1.3
9Sta
ndard
erro
r0.3
20.4
10.1
90.2
80.2
00.3
60.2
10.3
5Full
er1.0
7�
0.9
00.8
9�
1.1
50.7
5�
1.3
30.7
7�
1.3
7Sta
ndard
erro
r0.2
90.3
80.1
90.2
80.2
00.3
50.2
10.3
3B
ounds
of
95
per
cent
confi
den
cein
terv
als
Conven
tional
Upper
0.4
8�
1.6
90.5
1�
1.7
20.3
3�
2.0
80.3
4�
2.0
9L
ow
er1.7
7�
0.0
21.2
7�
0.5
81.1
6�
0.6
21.2
0�
0.6
9C
ondit
ional
likel
ihood
rati
oU
pper
0.3
4�
1.8
60.3
6�
1.9
6�
0.0
4�
2.7
20.0
1�
2.6
1L
ow
er9.9
38.8
01.5
7�
0.2
91.3
4�
0.3
61.4
2�
0.4
6N
um
ber
of
obse
rvati
ons
45
44
44
44
Num
ber
of
inst
rum
ents
24
33
Hanse
nte
st( O
IR)
1.6
83
0.1
49
0.0
00
p-v
alu
e0.4
31
0.7
00
1.0
00
Fir
st-s
tage
stati
stic
sF-s
tati
stic
10.1
81
41.8
99.1
226.1
623.9
231.2
112.4
123.4
5p-v
alu
e0.0
00
0.0
00
0.0
00
0.0
00
0.0
00
0.0
00
0.0
00
0.0
00
Part
ial
R2
0.3
30.6
70.4
80.7
30.6
40.7
00.4
80.6
4Shea
part
ial
R2
0.1
30.2
70.3
50.5
20.2
90.3
20.2
70.3
6
(Conti
nued
)
330
331
TA
BL
E3
.C
onti
nued
Inst
rum
ents
12
34
lnm
ort
2+
mal
eco
lnm
ort
2+
mal
eco
+E
uro
pea
lnm
ort
+E
uro
pe
lnm
ort
2+
Euro
pea
Expla
nato
ryvari
able
sru
lem
alfa
lru
lem
alfa
lru
lem
alfa
lru
lem
alfa
l
Wea
k-i
nst
rum
ent
test
b
Cra
gg–D
onald
3.2
75.1
84.6
54.7
6C
riti
cal
valu
e7.0
316.8
713.4
313.4
3H
ahn–H
ausm
an
test
0.1
0�
0.1
00.2
8�
0.2
80.3
30.1
0p-v
alu
e0.9
20.9
20.7
80.7
80.7
40.9
2In
stru
men
tse
lect
ion
crit
eria
c
Donald
–N
ewey
MSE
7.9
50.6
51.9
11.6
7B
IC�
5.7
2�
3.5
7�
3.7
8H
QIC
�3.5
0�
2.4
6�
2.6
7
aR
efer
sto
the
inst
rum
ents
engf
rac
and
eurf
rac.
bT
he
Cra
gg–D
onald
stati
stic
(Cra
gg
and
Donald
1993)
isuse
dby
Sto
ckand
Yogo
(2002)fo
rw
eak-i
nst
rum
ent
test
s.If
the
Cra
gg–D
onald
stati
stic
exce
eds
the
crit
icalvalu
e,th
ena
standard
signif
icance
test
wit
hnom
inalsi
zeof
5per
cent
has
am
axim
alsi
zeof
10
per
cent.
The
wea
k-i
nst
rum
ent
test
by
Hahn
and
Hausm
an
(2002)
isbase
don
the
norm
ali
zed
dif
fere
nce
bet
wee
nbia
s-adju
sted
two-s
tep
least
square
ses
tim
ato
rs(B
2SL
S)fo
ran
equati
on
and
its
rever
seeq
uati
on,
wher
eth
ele
ft-s
ide
vari
able
and
the
endogen
ous
right-
side
vari
able
are
inte
rchanged
.cT
he
Donald
–N
ewey
inst
rum
ent
sele
ctio
ncr
iter
ion
(Donald
and
New
ey2001)
isth
eex
pec
ted
aver
age
mea
n-s
quare
der
ror
of
the
2SL
Ses
tim
ato
r.B
ICand
HQ
ICare
the
Bayes
ian
and
Hannan–Q
uin
nin
form
ati
on
crit
eria
(Andre
ws
1999)
for
the
choic
eof
inst
rum
ents
.
Sourc
e:A
uth
ors
’analy
sis
base
don
data
des
crib
edin
the
text.

estimated that excludes maleco and uses only (original) settler mortality and themeasures of Western European influence as instrumental variables (table 3,column 3). The results indicate that this specification creates a weak-instrumentproblem according to the Cragg–Donald statistic. But the point estimates remainstatistically significant16 and quantitatively similar, compared with the baselinespecification. This suggests that finding a significant influence of malaria pre-valence on economic development does not hinge on the use of maleco as aninstrument. Moreover, when maleco is included as an additional instrumentalvariable, its validity is not rejected by a Hansen difference test,17 which providesstatistical evidence against the endogeneity of maleco as presumed by Rodrik,Subramanian, and Trebbi (2004). Basically, the same findings emerge if therevised settler mortality variable (lnmort2) is used (table 3, column 4).18
Sample Size
As a final robustness check, results for a larger sample of countries are reported inappendix (table A.1). First, the baseline specification is re-estimated (column 1).Compared with the baseline sample of 45 countries (table 1, column 1), the pointestimates and interval estimates are by and large the same. Thus, independent of thesample of countries, the estimated coefficients on both institutional quality andmalaria prevalence appear economically important and statistically significant. Alsoas before, the Cragg–Donald statistic does not signal a weak-instrument problemfor this specification. In contrast to the previous estimates, there is a reduced fit ofthe first-stage regressions that may reflect the presumed weak data quality for someof the countries in the larger sample, especially for the governance index (rule).
Similar conclusions can be drawn from the Acemoglu, Johnson, and Robinson(2001) specification in column 2 of table A.1, where institutional quality is mea-sured by expropriation risk (exprop). Compared with the estimates for the smallersample of countries (table 1, column 4), the point estimates change slightly. Themost important result, the statistical insignificance of the coefficient on malariaprevalence, also shows up in the large sample. Again, this can be traced to a severeweak-instrument problem, which affects mainly the first-stage equation for exprop.
Using additional instrumental variables also does not change anyprevious insightsfor the larger sample of countries. In column 3 of table A.1, results are presented forthe baseline specification augmented by all available instruments. The point andinterval estimates change only slightly compared with the previous estimates, both
16. The 95 percent CLR confidence interval for institutional quality includes zero but is a borderline
case. For example, a 93 percent CLR confidence interval does not include zero.
17. Detailed results are available on request.
18. A potential problem with the specification reported in table 3, column 4, is signaled by the Hansen
statistic that is essentially zero. This could indicate that the instruments are highly correlated with each
other or that there are too many instruments. However, the correlation of the instruments is far below
one, and each instrument is significant in at least one first-stage regression. In fact, lnmort2 and engfrac
are highly significant in the regression for rule, and lnmort2 and eurfrac are highly significant in the
regression for malfal.
332 T H E W O R L D B A N K E C O N O M I C R E V I E W , V O L . 20, N O . 3
institutional quality and malaria prevalence remain statistically significant, and theoveridentifying restrictions are not rejected. Finally, using the revised settler mor-tality variable (lnmort2) and excluding malaria ecology (maleco) from the set ofinstrumental variables again leads to almost identical results in the large sample(table A.1, column 4) compared with the smaller sample (table 3, column 4).
The conclusion from the robustness checks is that the results of the baselinespecification are not sensitive to changes in the explanatory variables, the set ofinstruments, or the sample of countries.19 Therefore, the hypothesis derived fromthe baseline specification is maintained. Both institutions and malaria prevalenceappear economically important determinants of the level of development.
V. CO N C L U S I O N
The reported empirical results suggest that the Sachs hypothesis of direct incomeeffects of malaria prevalence cannot be dismissed as easily as claimed in recentstudies by Acemoglu, Johnson, and Robinson (2001) and Rodrik, Subramanian,and Trebbi (2004). Different from Acemoglu, Johnson, and Robinson (2001),statistically significant effects on income of malaria prevalence are estimatedonce its potential endogeneity is controlled for, and there appears to be noempirical evidence that the instrumental variable used by Sachs (2003) is invalid,as presumed by Rodrik, Subramanian, and Trebbi (2004). For given effects ofinstitutional quality, the estimated direct negative income effects of malariaprevalence are quantitatively important. This result appears to be robust tousing alternative measures of institutions and malaria prevalence, alternativeand additional instrumental variables, and an alternative sample of countries.
Taken at face value, the results imply that institutions do not dominate allother potential determinants of development. An emphasis on good governance,even if it can be successfully implemented in poor countries, will probably notsuffice to achieve improved economic performance. As argued by Sachs and hiscoauthors in various papers, subsidized research on tropical diseases and directassistance from foreign donors for interventions against diseases may be neededto advance the development of poor countries, which otherwise may not escapethe restrictions imposed on them by adverse geographic endowments. All this iscertainly not to deny that good institutions would make such interventionspossible in the first place or at least would make them more productive, butthe findings of this article point out that good institutions alone are not necessa-rily a sufficient recipe for successful economic development.
19. Regarding variations in the sample size, the inclusion of sub-Saharan African countries is key to
the presented identification strategy and to the validity of the instrumental variables, as it is in Acemoglu,
Johnson, and Robinson (2001). The reason is that the variance across the sample stems mainly from the
difference between the sub-Saharan African countries and the other countries. The reported direct effects
of malaria on income may thus explain why some previous cross-country studies reported a negative
coefficient of the dummy variable for sub-Saharan Africa (Collier and Gunning 1999).
Carstensen and Gundlach 333
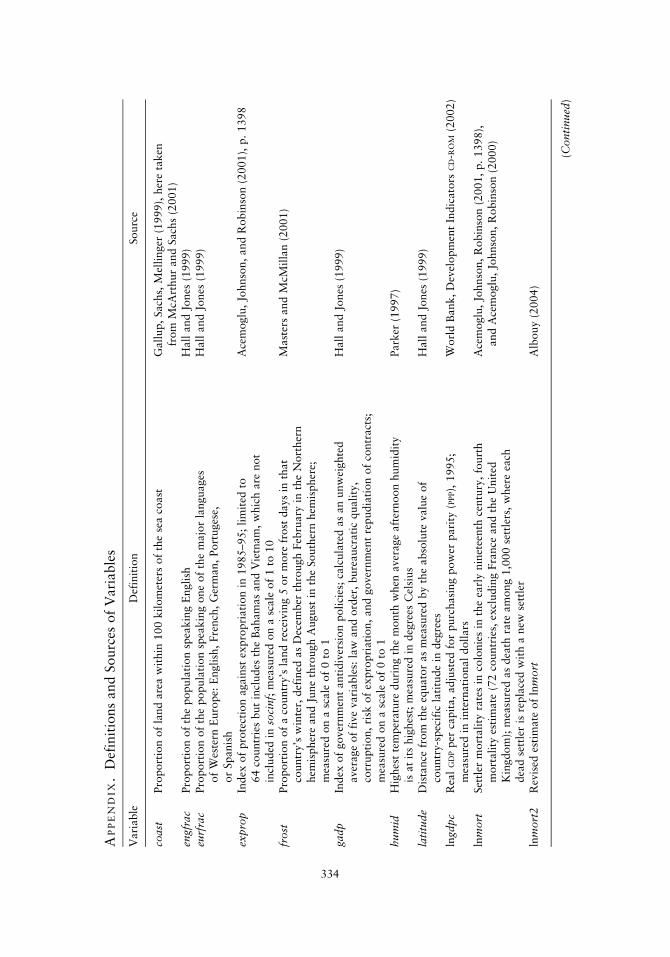
AP
PE
ND
IX.
Def
init
ions
and
Sourc
esof
Vari
able
s
Vari
able
Def
init
ion
Sourc
e
coas
tPro
port
ion
of
land
are
aw
ithin
100
kil
om
eter
sof
the
sea
coast
Gall
up,
Sach
s,M
elli
nger
(1999),
her
eta
ken
from
McA
rthur
and
Sach
s(2
001)
engf
rac
Pro
port
ion
of
the
popula
tion
spea
kin
gE
ngli
shH
all
and
Jones
(1999)
eurf
rac
Pro
port
ion
of
the
popula
tion
spea
kin
gone
of
the
majo
rla
nguages
of
Wes
tern
Euro
pe:
Engli
sh,
Fre
nch
,G
erm
an,
Port
uges
e,or
Spanis
h
Hall
and
Jones
(1999)
expro
pIn
dex
of
pro
tect
ion
again
stex
pro
pri
ati
on
in1985–95;
lim
ited
to64
countr
ies
but
incl
udes
the
Baham
as
and
Vie
tnam
,w
hic
hare
not
incl
uded
inso
cinf;
mea
sure
don
asc
ale
of
1to
10
Ace
moglu
,Jo
hnso
n,
and
Robin
son
(2001),
p.
1398
frost
Pro
port
ion
of
aco
untr
y’s
land
rece
ivin
g5
or
more
frost
days
inth
at
countr
y’s
win
ter,
def
ined
as
Dec
ember
thro
ugh
Feb
ruary
inth
eN
ort
her
nhem
ispher
eand
June
thro
ugh
August
inth
eSouth
ern
hem
ispher
e;m
easu
red
on
asc
ale
of
0to
1
Mast
ers
and
McM
illa
n(2
001)
gadp
Index
of
gover
nm
ent
anti
div
ersi
on
poli
cies
;ca
lcula
ted
as
an
unw
eighte
daver
age
of
five
vari
able
s:la
wand
ord
er,
bure
aucr
ati
cquali
ty,
corr
upti
on,
risk
of
expro
pri
ati
on,
and
gover
nm
ent
repudia
tion
of
contr
act
s;m
easu
red
on
asc
ale
of
0to
1
Hall
and
Jones
(1999)
hum
idH
ighes
tte
mper
atu
reduri
ng
the
month
when
aver
age
aft
ernoon
hum
idit
yis
at
its
hig
hes
t;m
easu
red
indeg
rees
Cel
sius
Park
er(1
997)
lati
tude
Dis
tance
from
the
equato
ras
mea
sure
dby
the
abso
lute
valu
eof
countr
y-s
pec
ific
lati
tude
indeg
rees
Hall
and
Jones
(1999)
lngd
pc
Rea
lG
DP
per
capit
a,
adju
sted
for
purc
hasi
ng
pow
erpari
ty(P
PP),
1995;
mea
sure
din
inte
rnati
onal
doll
ars
Worl
dB
ank,
Dev
elopm
ent
Indic
ato
rsC
D-R
OM
(2002)
lnm
ort
Set
tler
mort
ali
tyra
tes
inco
lonie
sin
the
earl
ynin
etee
nth
centu
ry,
fourt
hm
ort
ali
tyes
tim
ate
(72
countr
ies,
excl
udin
gFra
nce
and
the
Unit
edK
ingdom
);m
easu
red
as
dea
thra
team
ong
1,0
00
sett
lers
,w
her
eea
chdea
dse
ttle
ris
repla
ced
wit
ha
new
sett
ler
Ace
moglu
,Jo
hnso
n,
Robin
son
(2001,
p.
1398),
and
Ace
moglu
,Jo
hnso
n,
Robin
son
(2000)
lnm
ort
2R
evis
edes
tim
ate
of
lnm
ort
Alb
ouy
(2004)
(Conti
nued
)
334
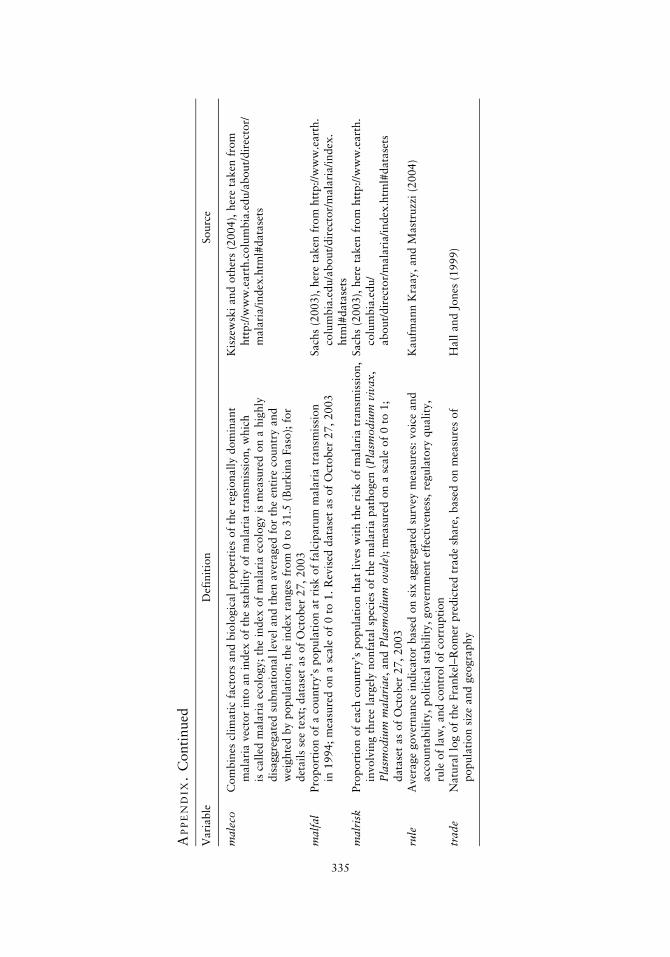
AP
PE
ND
IX.
Conti
nued
Vari
able
Def
init
ion
Sourc
e
mal
eco
Com
bin
escl
imati
cfa
ctors
and
bio
logic
al
pro
per
ties
of
the
regio
nall
ydom
inant
mala
ria
vec
tor
into
an
index
of
the
stabil
ity
of
mala
ria
transm
issi
on,
whic
his
call
edm
ala
ria
ecolo
gy;
the
index
of
mala
ria
ecolo
gy
ism
easu
red
on
ahig
hly
dis
aggre
gate
dsu
bnati
onal
level
and
then
aver
aged
for
the
enti
reco
untr
yand
wei
ghte
dby
popula
tion;
the
index
ranges
from
0to
31.5
(Burk
ina
Faso
);fo
rdet
ail
sse
ete
xt;
data
set
as
of
Oct
ober
27,
2003
Kis
zew
ski
and
oth
ers
(2004),
her
eta
ken
from
htt
p:/
/ww
w.e
art
h.c
olu
mbia
.edu/a
bout/
dir
ecto
r/m
ala
ria/i
ndex
.htm
l#data
sets
mal
fal
Pro
port
ion
of
aco
untr
y’s
popula
tion
at
risk
of
falc
iparu
mm
ala
ria
transm
issi
on
in1994;
mea
sure
don
asc
ale
of
0to
1.
Rev
ised
data
set
as
of
Oct
ober
27,
2003
Sach
s(2
003),
her
eta
ken
from
htt
p:/
/ww
w.e
art
h.
colu
mbia
.edu/a
bout/
dir
ecto
r/m
ala
ria/i
ndex
.htm
l#data
sets
mal
risk
Pro
port
ion
of
each
countr
y’s
popula
tion
that
lives
wit
hth
eri
skof
mala
ria
transm
issi
on,
involv
ing
thre
ela
rgel
ynonfa
tal
spec
ies
of
the
mala
ria
path
ogen
(Pla
smodiu
mvi
vax,
Pla
smodiu
mm
alar
iae,
and
Pla
smodiu
mova
le);
mea
sure
don
asc
ale
of
0to
1;
data
set
as
of
Oct
ober
27,
2003
Sach
s(2
003),
her
eta
ken
from
htt
p:/
/ww
w.e
art
h.
colu
mbia
.edu/
about/
dir
ecto
r/m
ala
ria/i
ndex
.htm
l#data
sets
rule
Aver
age
gover
nance
indic
ato
rbase
don
six
aggre
gate
dsu
rvey
mea
sure
s:voic
eand
acc
ounta
bil
ity,
poli
tica
lst
abil
ity,
gover
nm
ent
effe
ctiv
enes
s,re
gula
tory
quali
ty,
rule
of
law
,and
contr
ol
of
corr
upti
on
Kaufm
ann
Kra
ay,
and
Mast
ruzz
i(2
004)
trad
eN
atu
ral
log
of
the
Fra
nkel
–R
om
erpre
dic
ted
trade
share
,base
don
mea
sure
sof
popula
tion
size
and
geo
gra
phy
Hall
and
Jones
(1999)
335
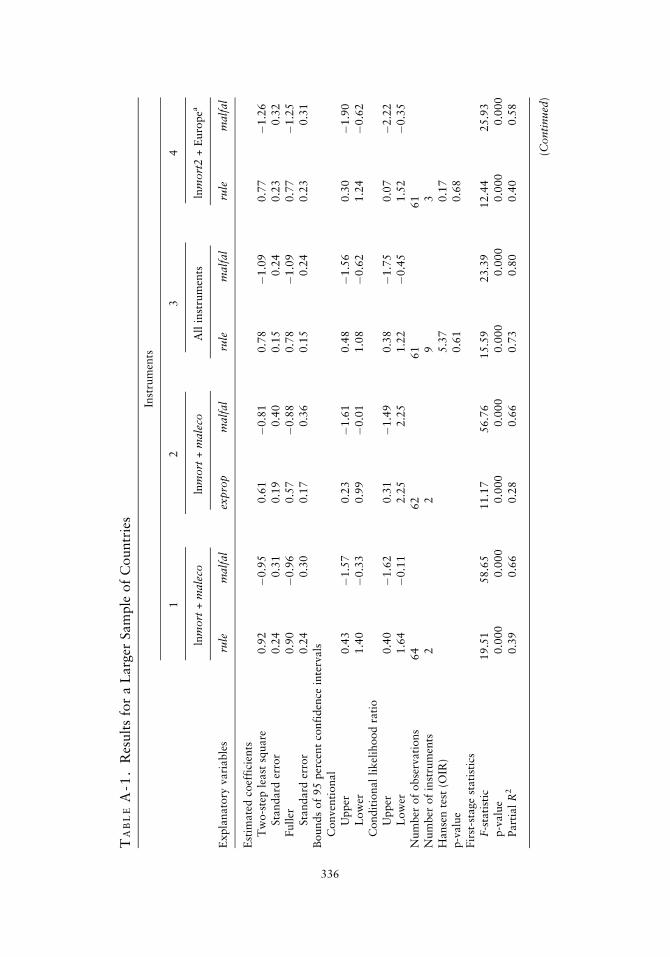
TA
BL
EA
-1.
Res
ult
sfo
ra
Larg
erSam
ple
of
Countr
ies
Inst
rum
ents
12
34
lnm
ort
+m
alec
oln
mort
+m
alec
oA
llin
stru
men
tsln
mort
2+
Euro
pea
Expla
nato
ryvari
able
sru
lem
alfa
lex
pro
pm
alfa
lru
lem
alfa
lru
lem
alfa
l
Est
imate
dco
effi
cien
tsT
wo-s
tep
least
square
0.9
2�
0.9
50.6
1�
0.8
10.7
8�
1.0
90.7
7�
1.2
6Sta
ndard
erro
r0.2
40.3
10.1
90.4
00.1
50.2
40.2
30.3
2Full
er0.9
0�
0.9
60.5
7�
0.8
80.7
8�
1.0
90.7
7�
1.2
5Sta
ndard
erro
r0.2
40.3
00.1
70.3
60.1
50.2
40.2
30.3
1B
ounds
of
95
per
cent
confi
den
cein
terv
als
Conven
tional
Upper
0.4
3�
1.5
70.2
3�
1.6
10.4
8�
1.5
60.3
0�
1.9
0L
ow
er1.4
0�
0.3
30.9
9�
0.0
11.0
8�
0.6
21.2
4�
0.6
2C
ondit
ional
likel
ihood
rati
oU
pper
0.4
0�
1.6
20.3
1�
1.4
90.3
8�
1.7
50.0
7�
2.2
2L
ow
er1.6
4�
0.1
12.2
52.2
51.2
2�
0.4
51.5
2�
0.3
5N
um
ber
of
obse
rvati
ons
64
62
61
61
Num
ber
of
inst
rum
ents
22
93
Hanse
nte
st(O
IR)
5.3
70.1
7p-v
alu
e0.6
10.6
8Fir
st-s
tage
stati
stic
sF-s
tati
stic
19.5
158.6
511.1
756.7
615.5
923.3
912.4
425.9
3p-v
alu
e0.0
00
0.0
00
0.0
00
0.0
00
0.0
00
0.0
00
0.0
00
0.0
00
Part
ial
R2
0.3
90.6
60.2
80.6
60.7
30.8
00.4
00.5
8
(Conti
nued
)
336
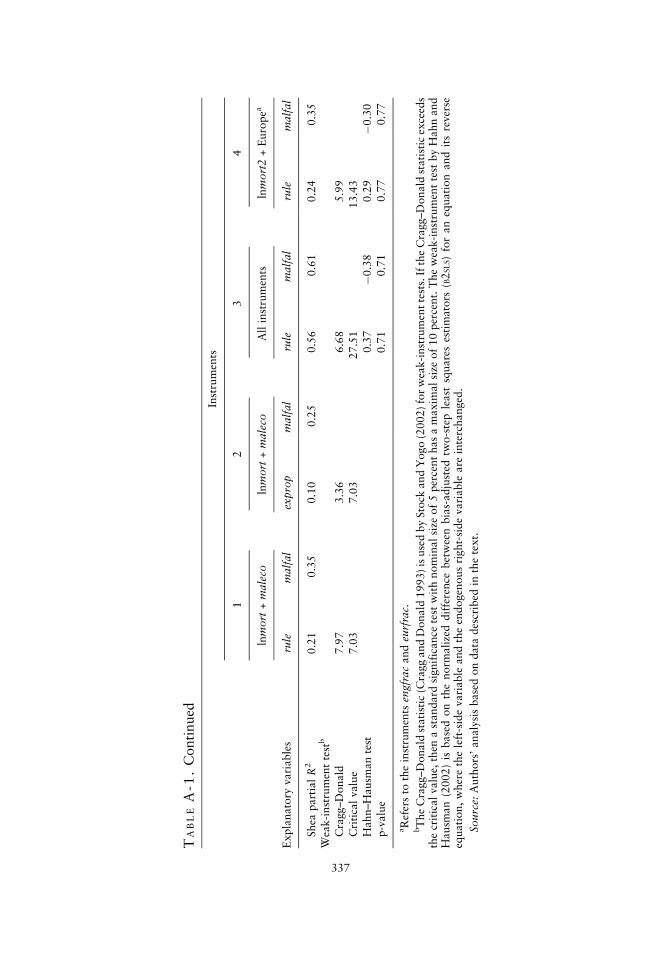
TA
BL
EA
-1.
Conti
nued
Inst
rum
ents
12
34
lnm
ort
+m
alec
oln
mort
+m
alec
oA
llin
stru
men
tsln
mort
2+
Euro
pea
Expla
nato
ryvari
able
sru
lem
alfa
lex
pro
pm
alfa
lru
lem
alfa
lru
lem
alfa
l
Shea
part
ial
R2
0.2
10.3
50.1
00.2
50.5
60.6
10.2
40.3
5W
eak-i
nst
rum
ent
test
b
Cra
gg–D
onald
7.9
73.3
66.6
85.9
9C
riti
cal
valu
e7.0
37.0
327.5
113.4
3H
ahn–H
ausm
an
test
0.3
7�
0.3
80.2
9�
0.3
0p-v
alu
e0.7
10.7
10.7
70.7
7
aR
efer
sto
the
inst
rum
ents
engf
rac
and
eurf
rac.
bT
he
Cra
gg–D
onald
stati
stic
(Cra
gg
and
Donald
1993)
isuse
dby
Sto
ckand
Yogo
(2002)fo
rw
eak-i
nst
rum
ent
test
s.If
the
Cra
gg–D
onald
stati
stic
exce
eds
the
crit
icalvalu
e,th
ena
standard
signif
icance
test
wit
hnom
inalsi
zeof
5per
cent
has
am
axim
alsi
zeof
10
per
cent.
The
wea
k-i
nst
rum
ent
test
by
Hahn
and
Hausm
an
(2002)
isbase
don
the
norm
ali
zed
dif
fere
nce
bet
wee
nbia
s-adju
sted
two-s
tep
least
square
ses
tim
ato
rs( B
2SL
S)fo
ran
equati
on
and
its
rever
seeq
uati
on,
wher
eth
ele
ft-s
ide
vari
able
and
the
endogen
ous
right-
side
vari
able
are
inte
rchanged
.
Sourc
e:A
uth
ors
’analy
sis
base
don
data
des
crib
edin
the
text.
337
RE F E R E N C E S
Acemoglu, Daron, Simon Johnson, and James A. Robinson. 2000. ‘‘The Colonial Origins of Comparative
Development: An Empirical Investigation.’’ Working Paper 00-22. Massachusetts Institute of Tech-
nology, Department of Economics, Cambridge, Mass.
———. 2001. ‘‘The Colonial Origins of Comparative Development: An Empirical Investigation.’’ Amer-
ican Economic Review 91(5):1369–401.
———. 2002. ‘‘Reversal of Fortune: Geography and Institutions in the Making of the Modern World
Income Distribution.’’ Quarterly Journal of Economics 117(4):1231–94.
Albouy, David. 2004. ‘‘The Colonial Origins of Comparative Development: A Reexamination Based on
Improved Settler Mortality Data.’’ Department of Economics, University of California, Berkeley.
Andrews, Donald W. K. 1989. ‘‘Power in Econometric Applications.’’ Econometrica 57(5):1059–90.
———. 1999. ‘‘Consistent Moment Selection Procedures for Generalized Method of Moments Estima-
tion.’’ Econometrica 67(3):543–64.
Bloom, David E., and Jeffrey D. Sachs. 1998. ‘‘Geography, Demography, and Economic Growth in
Africa.’’ Brookings Papers on Economic Activity 2:207–95.
Collier, Paul, and Jan Willem Gunning. 1999. ‘‘Explaining African Economic Performance.’’ Journal of
Economic Literature 37(1):64–111.
Cragg, John G., and Stephen G. Donald. 1993. ‘‘Testing Identifiability and Specification in Instrumental
Variable Models.’’ Econometric Theory 9(2):222–40.
Donald, Stephen G., and Whitney K. Newey. 2001. ‘‘Choosing the Number of Instruments.’’ Econome-
trica 69(5):1161–91.
Dufour, Jean-Marie. 1997. ‘‘Some Impossibility Theorems in Econometrics with Applications to Struc-
tural and Dynamic Models.’’ Econometrica 65(6):1365–87.
Easterly, William, and Ross Levine. 2003. ‘‘Tropics, Germs, and Crops: How Endowments Influence
Economic Development.’’ Journal of Monetary Economics 50(1):3–39.
Engerman, Stanley L., and Kenneth I. Sokoloff. 1997. ‘‘Factor Endowments, Institutions, and Differential
Paths of Growth Among New World Economies: A View from Economic Historians of the United
States.’’ In Stephen Haber, ed., How Latin America Fell Behind. Stanford, Calif.: Stanford University
Press.
Frankel, Jeffrey A., and David Romer. 1999. ‘‘Does Trade Cause Growth?’’ American Economic Review
89(3):379–99.
Fuller, Wayne A. 1977. ‘‘Some Properties of a Modification of the Limited Information Estimator.’’
Econometrica 45(4):939–54.
Gallup, John Luke, Jeffrey D. Sachs, and Andrew Mellinger. 1999. ‘‘Geography and Economic Develop-
ment.’’ International Regional Science Review 22(2):179–232.
Gallup, John Luke, and Jeffrey D. Sachs. 2001. ‘‘The Economic Burden of Malaria.’’ The American
Journal of Tropical Medicine & Hygiene 64(1–2, Suppl.):85–96.
Hahn, Jinyong, and Jerry Hausman. 2002. ‘‘A New Specification Test for the Validity of Instrumental
Variables.’’ Econometrica 70(1):163–89.
Hahn, Jinyong, Jerry Hausman, and Guido Kuersteiner. 2004. ‘‘Estimation with Weak Instruments:
Accuracy of Higher-Order Bias and MSE Approximations.’’ Econometrics Journal 7(1):272–306.
Hall, Robert E., and Charles I. Jones. 1999. ‘‘Why Do Some Countries Produce So Much More Output per
Worker than Others?’’ Quarterly Journal of Economics 114(1):83–116.
Hausman, Jerry, James H. Stock, and Motohiro Yogo. 2005. ‘‘Asymptotic Properties of the Hahn-
Hausman Test for Weak Instruments.’’ Economics Letters 89(3):333–342.
Hoff, Karla. 2003. ‘‘Paths of Institutional Development: A View from Economic History.’’ The World
Bank Research Observer 18(2):205–26.
338 T H E W O R L D B A N K E C O N O M I C R E V I E W , V O L . 20, N O . 3

Kaufmann, Daniel, Aart Kraay, and Massimo Mastruzzi. 2004. ‘‘Governance Matters III: Governance
Indicators for 1996–2002.’’ World Bank Economic Review 18(2):253–87.
Kiszewski, Anthony, Andrew Mellinger, Pia Malaney, Andrew Spielman, Sonia Ehrlich Sachs, and Jeffrey D.
Sachs. 2004. ‘‘A Global Index of the Stability of Malaria Transmission Based on the Intrinsic Properties of
Anopheline Mosquito Vectors.’’ American Journal of Tropical Medicine and Hygiene 70(5):486–98.
Masters, William A., and Margaret S. McMillan. 2001. ‘‘Climate and Scale in Economic Growth.’’
Journal of Economic Growth 6(3):167–86.
McArthur, John W., and Jeffrey D. Sachs. 2001. Institutions and Geography: A Comment on Acemoglu,
Johnson, and Robinson (2000). NBER Working Paper 8114. National Bureau of Economic Research,
Cambridge, Mass.
Moreira, Marcelo J. 2003. ‘‘A Conditional Likelihood Ratio Test for Structural Models.’’ Econometrica
71(4):1027–48.
Parker, Philip M. 1997. National Cultures of the World. A Statistical Reference. Westport, Conn.:
Greenwood Press.
Rodrik, Dani, Arvind Subramanian, and Francesco Trebbi. 2004. ‘‘Institutions Rule: The Primacy of
Institutions over Geography and Integration in Economic Development.’’ Journal of Economic
Growth 9(2):131–65.
Sachs, Jeffrey D. 2001. Tropical Underdevelopment. NBER Working Paper 8119. National Bureau of
Economic Research, Cambridge, Mass.
———. 2003. Institutions Don’t Rule: Direct Effects of Geography on Per Capita Income. NBER Working
Paper 9490. National Bureau of Economic Research, Cambridge, Mass.
Sachs, Jeffrey D., and Pia Malaney. 2002. ‘‘The Economic and Social Burden of Malaria.’’ Nature
415(6872):680–85.
Shea, John. 1997. ‘‘Instrument Relevance in Multivariate Linear Models: A Simple Measure.’’ Review of
Economics and Statistics 79(2):348–52.
Staiger, Douglas, and James H. Stock. 1997. ‘‘Instrumental Variables with Weak Instruments.’’ Econo-
metrica 65(3):557–86.
Stock, James H., and Motohiro Yogo. 2002. Testing for Weak Instruments in Linear IV Regressions. NBER
Technical Working Paper 284. National Bureau of Economic Research, Cambridge, Mass.
Summers, Robert, and Alan Heston. 1991. ‘‘The Penn World Table (Mark 5): An Expanded Set of
International Comparisons, 1950–1988.’’ Quarterly Journal of Economics 106(2):327–68.
World Bank. 2002. World Development Indicators 2002. CD-ROM. Washington, D.C.
Carstensen and Gundlach 339