The Prices People Have to Pay for Medicines in the Philippines
40
The Prices People Have to Pay for Medicines in the Philippines Institute of Philippine Culture Ateneo de Manila University, Philippines In Collaboration with Health Action International/World Health Organization Department of Health, Philippines
Transcript of The Prices People Have to Pay for Medicines in the Philippines

The Prices People Have to Pay for Medicines in the Philippines
Institute of Philippine CultureAteneo de Manila University, Philippines
In Collaboration with
Health Action International/World Health Organization
Department of Health, Philippines

Dennis B. Batangan, M.D., M.Sc. Research AssociateInstitute of Philippine CultureAteneo de Manila UniversityLoyola Heights, Quezon CityPhilippines
With
Chona Echavez, Ph.D.
Anthony Aldrin Santiago, R.Ph.
Amparo C. de la Cruz
Engracia Santos
2

CONTENTS
REFERENCES
3

ACKNOWLEDGEMENTS
The successful completion of the Philippine Medicine Prices Survey Project, including the preparation of the final report was facilitated by substantive and technical contributions from different institutions with a common goal of lowering the prices of medicines and improving availability on a global scale. Our sincerest gratitude to Health Action International (HAI) and World Health Organization (WHO) for the financial support and endorsement of the project, which enable the institute to use the methodology for the medicine prices survey and served as data base for the advocacy initiatives of other projects. Worthy of mention are Margaret Ewen, HAI-Europe and Andrew Creese of WHO for providing logistical support and technical assistance to the project during the workshops as well as in facilitating the use of the program for workbook.
We are also thankful to the rest of the project consultants: Kirsten Myhr, HAI-Europe and Ulleval Drug Information Centre, Norway; Alexandra Cameron, WHO;Libby Levison (USA); Richard Laing, WHO, and Pierrick Gonnet (France) for providing technical assistance and support of the project.
With our indebted to thank Dr. Francisco Duque, Secretary of the Department of Health and Dr. Jean Marc Olive, Country Representative, World Health Organization- Philippines, for their invaluable assistance in the undertaking of this survey.
We wish to express special thanks to the Advisory Group:
Dr. Jaime Galvez-Tan, Health Futures, Inc.Dr. Leticia Gutierrez-Ibañez, Bureau of Food and Drugs, Department of Health Dr. Madeleine Valera, Philippine Health Insurance CorporationMs. Merlita Opeña, Representative from Philippine Council for Health Research and Development, Department of Science and TechnologyMr. Anthony Aldrin Santiago, Philippine General Hospital, University of the Philippines, Manila Mr. Alfredo Melgar, Jr., Representative from Cut the Cost , the Cut the Pain Network
We also wish to thank all the people our area supervisors Mr. Anthony Aldrin Santiago,R.Ph., Philippine General Hospital, University of the Philippines, Manila and Dr. Chona Echavez, of Xavier University. Our data collectors for the Manila and Baguio City Team namely: Lizbeth Santiago, Airish Lugao, Donna Laita, and Jennifer Amboni and for the Cagayan de Oro City and Cebu City Team namely: Michel Montejo, Donna Sanchez, Conralin Yap and Jennefer Lyn Bagaporo.
Credit also goes to the invaluable assistance of the Institute of Philippine Culture, Ateneo de Manila University which included the project research assistant Ms. Amparo C. de la Cruz who coordinated the data gathering process, and Ms. Engracia Santos who provided assistance on technical aspects of the workbook.
We recognize the participation and cooperation of all the health facilities and pharmacies involved in the survey.
4

INTRODUCTION
The Philippines is an archipelago of 7,107 islands stretching from the south of China to the northern tip of Borneo. The Philippine coastline adds up to 17,500 km. Three prominent bodies of water surround the archipelago: the Pacific Ocean on the east, the South China Sea on the west and north, and the Celebes Sea on the south. This position accounts for much of the variations in geographic, climatic and vegetational conditions in the country.
The archipelago is divided into three geographical areas: Luzon, Visayas, and Mindanao. The topography of the bigger islands - particularly Luzon and Mindanao - is characterized by alluvial plains, narrow valleys, rolling hills and high mountains. The highest mountains are found in Mindanao and Luzon, with the altitudes varying from 1,790 to 3,144 meters. Most of the smaller islands are mountainous in the interior, surrounded by narrow strips of discontinuous flat lowlands which constitute the coastal rims.
The Philippines has 17 regions, 79 provinces, 115 cities, 1,498 municipalities, and 41,955 barangays. The barangay or village is the smallest political unit into which cities and municipalities in the Philippines are divided. It is the basic unit of the Philippine political system and administered by a set of elective officials, headed by a barangay chairperson. The country has over a hundred ethnic groups and a mixture of foreign influences, all of which contributing to the evolution of a unique Filipino culture.1 The capital city is Manila.
Before the Spanish explorers came, indigenous Filipinos inhabiting the islands were actively engaged with Indo-Malays and Chinese merchants. In 1521 the Spaniards, led by Ferdinand Magellan, started the colonization of the islands. The Spanish conquistadores established a colonial government in Cebu in 1565 then transferred the seat of government to Manila in 1571. The Filipinos resisted and waged Asia's first nationalist revolution in 1896. On June 12, 1898, Emilio Aguinaldo declared the Philippines independent from Spain and proclaimed himself president. After ruling for 333 years, the Spaniards finally left in 1898 and were replaced by the Americans who stayed for 48 years. On July 4, 1946, a few years after the Second World War, the Americans recognized Philippine independence.
Health SituationThe current population of the Philippines is estimated at 83 million2, around 30-40% of which is estimated to be below the poverty threshold. The high population growth rate (2.36 in the year 2000)3 presents a serious challenge to the delivery of health services. Inequalities in health access between the urban and the rural areas and between the poor and the rich persist. The infant mortality rate, although declining, is still high (estimated to be 96.13 per 1000 live births in 2000)4 compared to that of neighbouring countries. The burden of both communicable and non-communicable disease hinders the country’s social and economic development.
5

The Health SystemThe Department of Health is the lead agency in the health sector which includes policy and regulatory functions for health care services and the management of specialty hospitals, regional hospitals and medical centres. A coordinating health office (Center for Health Development) is situated in 17 regions and manages provincial health teams and retained personnel. Following the devolution of health services to LGUs, the provincial government is in charge of provincial and district hospitals, while the municipal government manages rural health units (RHUs) and barangay health stations (BHSs).
In 2002, there were 11.50 doctors, 5.55 dentists and 43.69 nurses per 100,000 inhabitants4. However, medical personnel are unevenly distributed in the country, as staff is mostly concentrated in urban areas. This is aggravated by the migration of doctors, a majority of which retrain as nurses, to more developed countries further affecting the delivery of health services specially in the rural areas. Differences in geographical accessibility further adds up as a factor in the uneven access to health services.
Of the 33 hospitals located in the City of Manila, 23 or 69.69% are licensed private hospitals, 6 or 18.18% are national government owned hospitals and 4 or 12.12% are city government owned. The quality of health care services differs substantially between the public and private sub-sector which further widens the gap between the health care provided to the well off and poorer sections of the population. Public services are often ill-equipped and therefore unable to provide satisfactory basic health services. The coordination between private and public health care providers needs improvement and the health system suffers from inadequate and irregular insurance coverage reducing access to adequate care specially of the poor, high prices of pharmaceutical products and medical devices, and poor penetration of generic medicines.
Health System ReformsThe country’s public health care system has undergone far reaching reforms in the past 25 years which included the adoption of the Primary Health Care strategy in 1979, integration of public health and hospital services in 1983, reorganization of the Department of Health in 1987, devolution of health services to Local Government Units (LGUs) in 1992, and the streamlining of its organization and functions in 1999-2000.
The devolution of health services included a separation of tasks and responsibilities with provincial government being in charge of provincial and district hospitals, while the LGUs manage rural health units (RHUs) and barangay health stations (BHSs). However, the devolution of health services is seen as one of the problems of the health care system, because the local government units lack the necessary management and coordination skills to provide satisfactory health services.
6

Context of Access to Medicines in the PhilippinesPharmaceuticals are expensive in the Philippines in comparison to prices in neighboring countries such as Thailand, Malaysia and Indonesia. Since 1985, the price of drugs increased faster than the consumer price index5. In the policy debate, pharmaceutical companies have stressed cost and quality differences to explain observed price differences. On the other hand, advocates of public intervention have emphasized international and local monopolistic pricing practices6.
The implementation of the Philippine Generic Drug Act of 1988 requiring the use of generic labeling, advertising, and prescriptions has not led to a limited penetration of generic drugs in the market, estimated currently at around 5%7. This situation is mainly attributed to poor public perception of generic drugs by both consumers and providers reinforced by aggressive promotion of branded products by the industry8.
The Philippines is classified by WHO as among the countries where less than 30 percent of the population have regular access to essential drugs. For those with access, there is the problem of rational drug use with more than eleven thousand (11,000) pharmaceutical products sold under difference brand names, doses and preparations.9 Drug consumption patterns show an alarming high market share for cough and cold preparations, systemic antibiotics and vitamins/appetite stimulants. The pattern indicates irrational drug use that does not correspond to the people’s health needs10.
The issue of national drug use and management took another turn in the Philippines when the National Health Insurance Program was implemented in 1995. Quality assurance procedures for health care providers and limits for drugs and medicines were instituted for claims to the national health insurance benefits. The regular coverage of the national health insurance though is limited to around 70% of the 83 million population, therefore leaving 30% of Filipinos without the layer of drug quality assurance protection from the National Health insurance program11.
The Pharmaceutical Industry in the PhilippinesThe development of the drug industry in the Philippines started with the establishment of a pharmaceutical laboratory in Manila in 1900. This was known then as Laboratorio Hizon (now Hizon Laboratories) and was followed in 1913 by the commercial production of Tiki-Tiki by another company owned by Manuel Zamora. In 1918, the Philippine-Americal Drug Company. (Botica Boie) introduced home remedies extracted from local medicinal plants. Before the World War II, there were close to 20 drug manufacturers, mostly owned by Filipinos, using manual techniques in manufacturing.12
After the Second World War , there was an influx of foreign pharmaceutical firms in the Philippines as the government encouraged foreign investments to reconstruct the war-torn economy. Table 1 below
7

shows the list of drug companies from the U.S. and other countries which set-up operations in the Philippines from 1918-1968.
In 1946, the Philippine Wholesale Druggist Association (PWDA) was formed by the ten leading pharmaceutical groups of Manila. They were mostly pharmaceutical importers, distributors, and retailers. The original founders of PWDA, later changed to Drug Association of the Philippines (DAP), were: John Magda of Philippine American Drug Company (Boie), Elias Picker of Oceanic Commercial, Ciriaco A. Santiago of Hermoso Drugstore, Amando L. Vellila of Marsman & Company, Horacio Guanzon of Farmacio Oro, Leon Dolor of Dolor’s Pharmacy, Yu Siu Tek of Yucuanseh Drug Company, Jose Teehankee, Jr. of Farmacia Central, William Ty of Farmacia Oriental, and Manuel Galatas of Metro Drug Corporation. .It was only in 1991 that DAP’s name was changed to its present name, Pharmaceutical Healthcare Association of the Philippines (PHAP).13
Table 1. Earliest Foreign Pharmaceutical Firms in the Philippines14
Company Year established Home Country
Philippine-American Drug Co. 1918 US
Marsman & Co., Inc. 1929 US
Sterling Products International 1946 US
Wyeth Laboratories, Inc. 1948 US
Abbot Laboratories 1949 US
Winthrop-Stearns, Inc. 1950 US
E.R. Squibb and Sons 1951 US
Upjohn, Inc. 1951 US
Richardson-Merrel, Inc. 1951 US- Australia
Parke Davis and Co., Inc. 1954 US
Pfizer Laboratories (Phils.), Inc. 1954 US
Warner-Chilcott Laboratories 1954 US
Eli Lily (Phils.), Inc. 1961 US
Bayer Philippines, Inc. 1962 Germany
Roche Pharmaceuticals 1962 Switzerland
Smith, Kline & French Overseas 1964 US
Boehringer-Ingelheim (Phils.) 1966 Germany
AHS/Philippines, Inc. 1968 US
Bristol Laboratories (Phils.), Inc. 1968 US
8

By 2002, the estimated total pharmaceutical market was already PhP 65.7 billion (approximately US $1.34 billion). The top ten leading corporate groups with respect to their share the total market include: Unilab (18.68%), Glaxo Smith Kline (10.08%), Pfizer Inc.(6.59%), Wyeth Philippines (5.47%), Astra Zeneca (4.76 %), Bristol Myers Squibb (4.66%), Novartis (3.47%), Abott Laboratories (3.27%), Roche Philippines (3.16%), Boeringer Ingelheim (3.06%). 15 According to the Philippine Chamber of Pharmaceutical Industries (PCPI) , 72% of the total market is contolled by foreign companies. The rest of the pharmaceutical market (28%) is shared by United Laboratories (23%), and small Filipino – owned drug firms and other multinational firms jointly owned by Filipinos and foreigners (5%).16
Most of the drug companies operating in the Philippines are among the biggest companies in the Philippines and also in the global markets. Table 2 lists down the top drug firms in the Philippines and their revenues and profits. It is notable that in the list of top 29 drug firms in the Philippines, there are only six Filipino owned companies , some of which even have foreign partners. It is also significant to note that there has been mergers of the bigger foreign-owned companies creating even bigger transnational companies. This actually followed the global trend in the industry in the 1990’s where mergers and acquisitions created a small number of very big corporations with a large number of small companies filling particular niches.17
Table 2. Top Drug Firms in the Philippines, 1999 18
(Revenues and profits in million pesos)Company Country Revenues Profits
Zuellig Pharma Corp. United Kingdom 26,971 248
United Laboratories, Inc. Philippines 10,657 1,199
Wyeth Phils, Inc a/ US 7,242 1,827
Johnson & Johnson (Phils.), Inc. US 5,222 249
Bristol-Myers Squibb (Phils), Inc. US 4,883 510
Bayer Phils. Inc. Germany 3,419 236
Abbot Laboratories US 3,277 296
Glaxo Wellcome Phils. Inc. United Kingdom 3,169 376
JDH-Zuellig (Phils), Inc. b/ United Kingdom 2,733 (7)
Astrazeneca Pharmaceuticals (Phils), Inc. c/
Sweden 2,216 253
Roche (Phils) Inc. d/ Switzerland 1,812 159
Novartis Healthcare Phils, Inc. Switzerland 1,775 342
Boehringer Ingelheim (Phils), Inc. Germany 1,665 180
Pfizer, Inc. US 1,634 (258)
9

Warner-Lambert Phils, Inc. US 1,585 39
SmithKline Beecham
Research Ltd. e/ Britain 1,556 234
Interphil Laboratories, Inc. Luxemburg 1,144 60
Metrolab Industries, Inc. Philippines 1,090 27
Sanofi-Synthelabo Phils, Inc. f/ France 905 50
Westmont Pharmaceuticals, Inc. Malaysia 877 73
Euro-Med Laboratories Phils, Inc. Philippines 741 213
International Pharmaceuticals, Inc. NA 725 (72)
Duncan Pharmaceuticals Phils, Inc. Britain 639 35
Schering-Plough Corp. US 610 37
Pascual Laboratories, Inc. Philippines 606 80
Pediatrica, Inc. Philippines 574 54
Pharmacia & Upjohn, Inc. US 566 21
Hoechst Marion Roussel Phils, Inc. Germany 544 7
Medichem Pharmaceuticals, Inc. Philippines 535 33
Total 84,140 6,253
Notes:
a/ merged with Cynamid Phils iNc. On October 1998
b/ name changed form Zuellig Inchcape, Inc.
c/ name changed from Astra Pharmaceuticals Phils., Inc., merged with Zeneca Pharma Phils. On Sept. 13, 1999
d/ merged with Boehringer Mannheim Phils, Inc. on December 11, 1998
e/ Philippine branch
f/ name changed form Sanofi Winthrop, Inc.
Drug manufacturing in the Philippines is still wholly dependent on imported raw materials and chemicals. About 95% of the materials compounded in the country are imported and the industry is dependent on products discovered and developed in another country. 19The absence of a fine chemical industry has prevented the country from going into the synthesis of petrobased oil chemicals. The only items available for pharmaceutical manufacturing from local sources are refined sugar, starch, glycerine and alcohol; and materials for packaging materials – glass bottles, plastics, caps, droppers, and paper labels. For novel drugs to be manufactured locally, therefore, they must be owned by a Philippine branch of a multi-national patent –owner or a Filipino licensee.20
Under this arrangement, a local company acquires a patented technology from a foreign company under certain conditions and prices. Licensing agreements may either be voluntary or compulsory. Voluntary licensing is entered between a foreign company (the licensor) and a local firm. Most local drug manufacturers prepare foreign brands through licensing agreements. For example, Unilab has
10

either joint ventures or licensing agreements with foreign companies such as SmithKline Beecham and GD Searle and Schering of the US.
Compulsory licensing, on the other hand, needs the permission of the local patent office, now called the Intellectual Property Office, and has to comply with certain provisions of the World Trade Organization TRIPS (Trade Related Aspects of Intellectual Property Rights) and Public Health Agreements.
Drug distributors also enter into licensing agreement with foreign companies to manufacture the drugs that they would like to sell This manufacturing arrangement is also called toll manufacturing. The Zuellig Group, which owns and controls 70% of publicly listed Interphil Laboratories Inc., is one of the country’s biggest toll manufacturers. Profits in toll manufacturing remain constant because income is derived from “cost – plus basis.” Increase in the costs of inputs, labor and utilities do not affect the toll manufacturer’s profit since all costs are passed on to consumers.21
Licenses, however, cannot be granted to manufacturers if the drug product is still on patent. A patent is a statutory grant that is awarded to an inventor, in return for the disclosure of an invention to the public. With the patent, the inventor has the right to use the innovation exclusively for a fixed period. In the Philippines, a period of 20 years is granted to patented products.
Medicine Prices in the Philippines: the 2002 WHO/HAI Measuring Drug Prices Study
This report discusses the second medicine price survey findings in the Philippines using the WHO/HAI methodology. In June 2002, the first medicine prices survey was conducted in the Philippines as part of a series of pilots to test the WHO/HAI medicine prices survey standard methodology. The geographic regions included in the survey were the capital city Manila and three additional urban areas namely: Baguio, Legaspi, and Iloilo. Data were collected in two sectors only. The private for-profit sector survey included 77 facilities, while the public sector survey covered 25 outlets. Selected results are presented below.
In the for-profit sector, when drug prices were compared with international index prices for generics, the 15 innovators brand name versions of these generics were found to be priced almost 16 times the international index. Fifty percent of these innovator brand drugs surveyed were in the range of 7.1 times to 36.2 times this index. For three innovator brand products prices were 58% higher than Australian PBS prices. The cheapest and most expensive items were found to be 3.3 times and 72.4 times the international index price respectively. For the generic products, there is marked difference in the median ratios of most sold and cheapest drugs. Here the most sold and the cheapest were 17.8 times and 8.4 times the international index price respectively with 50% of the drugs being sold in the range of 5.5 to 31 times the international index prices. The lowest price generic was 4.3 times the international index while the most expensive was 54.4 times the same index.
11

Table 3. Drug Price Consolidation for For-Profit Sector, 2002 Philippine Medicines Survey
In the Public Sector, when drug prices were compared with the international index prices for generics, the 5 innovator brand name versions of these generics were found to be priced 18.2 times the international index. Fifty percent of these innovator brand drugs surveyed were in the range of about 10 times to 19.5 times this index. The cheapest and most expensive items were found to be 7.1 times and 21.4 times the international price respectively.
Table 4. Drug Price Consolidation for Public Sector, 2002 Philipppine Medicines Survey
Public Sector Drug Outlets
Summary of Median Ratios of MSH Price List Drugs
No. of Drugs Median 25%ile 75%ile Minimum Maximum
Brand 5 18.24 9.96 19.46 7.06 21.40 Highest Sales 0 Lowest Price 0
Summary of Median Ratios of Australia PBS Price List Drugs
No. of Drugs Median 25%ile 75%ile Minimum Maximum
Brand 0 Highest Sales 0 Lowest Price 0
For-Profit Sector Drug Outlets
Summary of Median Ratios of MSH Price List Drugs
No. of Drugs Median 25%ile 75%ile Minimum Maximum
Brand 15 15.95 7.10% 36.17% 3.30 72.40 Highest Sales 7 17.76 11.48% 30.98% 4.45 54.41 Lowest Price 8 8.36 5.50% 14.81% 4.31 37.08
Summary of Median Ratios of Australia PBS Price List Drugs
No. of Drugs Median 25%ile 75%ile Minimum Maximum
Brand 3 1.58 1.2 2.12 0.82 2.66 Highest Sales 0 Lowest Price 0 24 6
12

In the facilities surveyed, Amitriptyline and Nevirapine were not available. Moreover, most of the facilities only had the innovator brand for the following drugs: Acyclovir, Beclomethazone inhaler, Ciprofloxacin, Fluconazole, Fluxetine, Hydrochlorothiazide, Omeprazole and Simvastatin. All but one of the drug surveyed was priced lower than the reference price. In general, innovator brands are more expensive than their generic counterparts. Looking at the least of all the drugs, the drugs which was the most expensive compared to the international generic index price, was atenolol, which was 44.4 times (innovator brand) the said index. The same drug also had the biggest difference from its generic counterpart. The prescribed pack size of 100 ml for Cotrimoxazole (Bactrim) was not available in the country; however, we noted the price of the preparation available, which was 50 ml. The survey showed that the price was still 6 times higher than the reference despite the size difference. The price of another brand (Septrin) was also noted in spite of the difference in pack size at 70 ml and still a higher median ratio was observed.
Table 5. Summary Data for the Different Sectors, 2002 Philippine Medicines Survey
13
For the public sector, the overall price of the drugs surveyed was 18.2 times the international price index, higher than the private for-profit sector’s median ratio of almost 16 times. The latter, however, was derived from wider range of median ratios but compared individually, median ratios are lower for the public sector. When comparing generic prices with the innovator brand prices, most sold generics were shown to be more expensive based on the summary above also because of a wider range of median ratios; most sold generics generally have lower prices than the innovator brand. The least priced generic drugs were 52.4% cheaper than the innovator brand.
14

METHODOLOGY OF 2005 SURVEY
The methodology for measuring drug prices developed by the WHO and HAI used in the Philippines in 2002 was again used in the survey on medicine prices conducted from February to April 2005. The goal of the survey was to document and compare the prices, affordability, and availability of medicines in different sectors. Prices and/or availability data was collected for:
1. Public sector procurement prices 2. Public sector patient prices3. Private sector patient prices
The survey was part of the a project that aimed to provide independent and reliable data on the pricing of essential medicines in the Philippine in support of policy and advocacy initiatives for safe and affordable medicines.
Selecting the Study Sites and Medicine Outlets
The sites for the survey were selected from the three major island groups of Luzon, Visayas, and Mindanao. The National Capital Region (Metro Manila) were included as a the fourth study site since this is the most urbanized region in the Philippines. The following major cities were identified for the major island groups: Baguio City for Luzon, Cebu City for the Visayas, Cagayan de Oro City for Mindanao and the City of Manila for the National Capital Region. Below is a brief profile of the survey sites namely Baguio City, Cebu City, Cagayayan De Oro City, and City of Manila.
BAGUIO CITY
Until today, Baguio City as the Summer Capital of the Philippines, is the most frequented destination in Northern Luzon by local and foreign tourists alike. 22 Baguio City, approximately 250 kilometers north of Manila is, situated in the heart of the Province of Benguet. The area of the city is 49 square kilometers enclosed in a perimeter of 30.6 kilometers. The developed portion of the city is a plateau that rises to an elevation of 1,400 meters. Most of it lies on the northern half of the city.
There are two great valleys found in the south and the north of the city. The more famous Guisad - Lucban Valley has an elevation that ranges from 1,300 to 1,400 meters and is centrally located towards the north. The southern valley is composed of long and narrow vales surrounded by low hills and transected by a network of hills. Some of the more important valleys are Camp 7, Loakan, Bakakeng and Crystal Cave, These valleys are arable as they are rich with alluvial deposits.
The City’s population as of May 2000 was placed at 250,000 persons. This indicates an actual 10.19 percent (23,117 persons) increase over its 1995 population of 226,883. This indicates a growth rate of 1.95 percent per annum, a significant drop from 4.1 percent recorded between 1990 and 1995, or an average of 4,623 individual actual population increment. The city has a very young age structure as
15

65.5 of its total population are below thirty years old. Females comprise 51.3 percent as against the 48.7 percent males..
CEBU CITY23
Known as the “Queen City of the South”, Cebu City is the most urbanized area in the Visayas region. The presence of large urban areas in its immediate and outlying vicinity has transformed the Cebu City as the urban core and commerce center, with a pattern of activities that respect no boundaries due to the unrestricted and avoidable flow of goods and people. The city has metamorphosed as the center of education and culture; the hub of sea and air transport; and the center of trade and commerce. With its economic development and growth centers, it has absorbed the burdens of a high rate of in-migration from all over the Visayas and Mindanao.
Cebu City has a total land area of 29,124.78 has. The urban area covers 5,598.53 has. while the covers 23,526.25 has. Cebu City is located on the central eastern part of Cebu Province, an island at the center of the Visayas in Southern Philippines. It is bound by Mandaue City in the North and the City of Talisay in the South. On the East is Mactan Channel and on its West are the Municipality of Balamban and the City of Toledo.
According from the national census conducted by National Statistics Office on 1 May 2000, Cebu City has a total population of 718,821 and a household population of 147,600 with an average household size of 4.84. The annual growth rate recoded from 1990 to 2000 was 1.65.
CAGAYAN DE ORO CITY
Cagayan de Oro City in Mindanao is a center of booming trade and teeming commerce, a burgeoning education and population center of close to 800,000 people. It is geographically located between the central coastline of Macajalar Bay and the naturally rich plateaus and mountains of Bukidnon and Lanao del Norte to the south. It is bounded by the two municipalities of Misamis Oriental : Tagoloan and Opol on the east and west respectively. It is situated 491 miles (810 air kilometers) south of Metro Manila. By land travel, the city can be reached within forty (40) hours from Manila.
The city has a total land area of 488.86 square kilometers, representing 13.7% of the entire Misamis Oriental. It has about 25 kilometers of coastline and a fine deep water harbor within Macajalar Bay.
As of the last national census (May 1, 2000), the city's population was 461,877; its households numbered was 93,525 with an average household size of 4.91. The annual population growth rate as of the last census recorded from 1990 to 2000 was 3.12. There are a total of 12 hospitals located in the city and one PNP laboratory Clinic and private clinic.
CITY OF MANILA
The City of Manila was founded on June 24, 1571 and gained its cityhood on June 10, 1574. On June 24, 1571, the City was declared the capital of the archipelago. Manila has retained its status as the political hub of the country considering that the major political institutions - Malacañang, the Senate
16

and the Supreme Court are all located in Manila. It has also endured through time its reputation as the trading center of the country due to its strategic location and natural harbor. Manila has also remained as the melting pot of socio-cultural activities owing to its diversified and discriminating constituents, not to mention a well-informed electorate. Indeed, Manila's position as business center and its rich cultural heritage has made it a prime eco-tourism development area in the whole of Metropolitan Manila.
Manila is strategically located on the eastern coast of the Manila Bay at the mouth of the Pasig River that runs on an east-west course through the center dividing the city into its northern and southern sectors. The City shares borders with seven other cities and municipalities in Metropolitan Manila: in the north by Navotas and Caloocan; in the northeast by Quezon City; in the east by San Juan and Mandaluyong; in the southeast by Makati; and in the south by Pasay.
The City of Manila has a land area of about 35,966,479.65 square meters based on the City Charter (Republic Act 409). The land area of Manila is expected to expand as reclamation projects are in the pipeline. However, the official city map prepared by the City Engineer's Office estimated the total land area of Manila at 38,552,613.18 square meters, which include all reclaimed area along Manila Bay. The land area of Manila represents a mere 6.50 percent of Metro Manila's land area of about 636 square kilometers.
Based on the last census of population conducted by the National Statistics Office on 1 May 2000, the total population of Manila is 1,581,082 with a total number of 333,547 households and an average household size of 4.70. The male population of Manila is estimated at 48% of the total population while the female population is estimated at 52%. There are some 193,845 that are 19 years old and below; 652,158 belong to the 20 - 39 years old bracket; 901,436 to the 40 - 59 years old bracket and 81,267 to the 60 years old and above. The population’s annual growth rate as of 1990 to 2000 is -0.1324.
Selection of medicine outlets was conducted in a manner consistent with the WHO/HAI methodology. A list of the government facilities and private pharmacies in the study sites were secured from the Department of Health. The outlets were mapped out by the respective teams and were selected following the procedures in the manual. In each study site, the main public hospital was selected. Additional public medicine outlets (e.g. hospital medicine outlets, dispensaries) were selected at random from those within a 4 hour's drive from the main hospital. Finally, the private pharmacies closest to each of the selected public medicine outlets was selected to form the private sector sample. An initial visit to the selected sites was done to validate the selected list of outlets to be surveyed. Table 6 below provides a summary of the survey sites, sectors and number of outlets surveyed. Public and Private sectors were surveyed in four geographic areas of the country.
17

Table 6. Survey Sites by sector and number of outlets
SURVEY SITE SECTOR NUMBER OF OUTLETS
Manila Public 7
Private 6
Baguio Public 3
Private 20
Cagayan De Oro Public 7
Private 18
Cebu Public 9
Private 7
Total Public 26
Private 51
Selection and Training of Data Collectors
The field teams were formed such that they were located in the areas near the study sites. Area supervisors were asked to oversee the data gathering in the identified sites. The area supervisors were:
Mr. Anthony Aldrin Santiago of the University of the Philippines-Manila, Philippine General Hospital Pharmacy for the cities of Baguio and Manila
Dr. Chona Echavez of the Research Institute for Mindanao Culture, Xavier University, Cagayan De Oro City for the cities of Cebu and Cagayan de Oro.
18

Table 7. Data gathering team members, 2005 Philippines Medicine Survey.
City of Manila and Baguio City Cebu City and Cagayan De Oro City
Area Supervisor:
Anthony Aldrin Santiago, RPh
University of the Philippines, Manila Philippine General Hospital Pharmacy
Area Supervisor:
Dr. Chona Echavez
Xavier University
Data Collectors:
Lizbeth Santiago
Airish Lugao
Donna Laita
Jennifer Amboni
Data Collectors:
Michel Montejo
Donna Sanchez
Conralin Yap
Jennefer Lyn Bagaporo
The area supervisors and the data collectors had two orientation and training sessions. The first session was held in January 2005 after which the teams had their own training and planning sessions. The first week of February, 2005 for the Cebu and Cagayan de Oro teams, and the last week of February, 2005 for the Manila and Baguio teams.
Data Collection and Formation of the Advisory Committee
Introductory letters were secured from the World Health Office-Philippine Office, Department of Health and Philippine Health Insurance Corporation to inform and orient the identified outlets in the study sites about the research project. The study design and field teams were introduced to the heads of institutions through letters and follow-up calls. After which, schedules for the data gathering were set.
Prior to the start of data gathering, an advisory committee for the project was convened to assist in the management of the project and dissemination of the research results. The list of medicines included in the survey, including a possible supplementary list, was referred to the advisory committee. The members of the advisory committee included the following:
Representative from Cut the Cost, the Cut the Pain Network Mr. Alfredo Melgar, Jr.
Health Futures, Inc. Dr. Jaime Galvez-Tan
19

Philippine Council for Health Research and Development (PCHRD), Department of Science and Technology (DOST)
Ms. Merlita Opeña
Product Service Division, Bureau of Food and Drug , Department of Health
Ms. Josephine Sarao
National Drug Policy, Department of Health Asst. Sec. David Lozada
Philippine Health Insurance Corporation Dr. Madeleine Valera
University of the Philippines, Manila Mr. Anthony Aldrin Santiago
Data collectors visited medicine outlets in pairs and collected information on medicine availability and price using a standard data collection form specific to the medicines being surveyed in the Philippines. Public procurement data was collected from one tertiary hospital in Manila. Data was collected for the same core and supplementary medicines as surveyed in medicine outlets
Data Verification and Encoding
The data submitted by the area supervisors were checked before they were encoded in the workbook. Any questions or clarifications on the accomplished forms were referred to the area supervisor and their team members. This verification process was done continuously while the encoding was being done. A pharmacist member of the Manila Team did the verification and encoding of the data into the workbook.
Double Entry and Auto-checker Procedures
All the encoded surveyed data were subject to double entry and auto-checker procedure of the workbook. These procedures were included in the methodology incorporated in the program of the workbook. The procedures were done by the research assistant assigned for the project survey and applied for all the three sectors data, for the purpose of identifying possible errors in the encoding
List of MedicinesThe WHO/HAI methodology specifies a core list of 30 medicines to be surveyed, representing medicines commonly used in the treatment of a range of chronic and acute conditions. The methodology also includes the specific dosage form and strength that is to be collected for each medicine. This ensures that data on comparable products are collected in all surveys, thereby allowing international comparisons to be made. In the Philippines, nine medicines were excluded from the WHO/HAI core list, as they are not available in the country. The methodology also allows up to 20 supplementary medicines of local importance to be included in the survey. The supplementary medicines were chosen based on the list essential medicines being monitored by the Department of Health. Thirteen supplementary medicines were chosen, resulting in a total of 34 survey medicines (Table 8).
20

Table 8. List of core and supplementary medicines included in the survey
Generic Name Form Dosage Form Medicine Category
Medicine found in the DOH medicine
list/National Drug Formulary25
Core List1 Aciclovir 200 mg tablet Antiherpes Yes2 Amoxicillin 250 mg tablet Antibacterial Yes3 Atenolol 50 mg tablet Antihypertensive Yes4 Beclomethasone 0.05 mg/dose inhaler Antiasthma Yes5 Captopril 25 mg tablet Antihypertensive Yes6 Carbamazepine 200 mg tablet Antiepileptic Yes7 Ceftriaxone 1 g/vial Vial Antibacterial Yes8 Ciprofloxacin 500 mg tablet Antibacterials Yes9 Co-trimoxazole 8+40 mg/ml suspension Antibacterial Yes10 Diclofenac 25 mg tablet Antiinflammatory Yes11 Fluconazole 200 mg tablet Antifungal Yes12 Fluoxetine 20 mg tablet Antidepressant Yes13 Glibenclamide 5 mg tablet Antidiabetic Yes14 Hydrochlorothiazide 25 mg tablet Antihypertensive Yes15 Lovastatin 20 mg tablet Lipid reducing No16 Metformin 500 mg tablet Antidiabetic Yes17 Nifedipine retard 20 mg retard tablet Antihypertensive Yes but listed only
in the complementary list
18 Omeprazole 20 mg tablet Antacids & other antiulcer
Yes
19 Ranitidine 150 mg tablet Ulcer-healing Yes20 Sulfadoxine + Pyrimethamine 25+500 mg tablet Antimalarial Yes21 Salbutamol 0.1 mg/dose inhaler Antiasthma Yes
Supplementary List22 Chloramphenicol 500 mg capsule Anti-bacterial Yes23 Chloramphenicol 125 mg/5ml suspension Anti-bacterial Yes24 Dexamethasone .5 mg tablet Steroids Yes25 Digoxin .25mg tablet Cardiac drugs Yes26 Doxycycline 100 mg capsule Anti-bacterial Yes27 Ethambutol 400 mg tablet Anti-tuberculosis Yes28 Furosemide 40 mg tablet Diuretic Yes29 Isoniazid 300 mg tablet Anti-tuberculosis Yes30 Isosorbide Dinitrate 10 mg tablet Anti-angina Yes31 Metronidazole 500 mg tablet Anti-amoebic Yes32 Metronidazole 125mg/5ml suspension Anti-amoebic Yes33 Pyrazinamide 500 mg capsule Anti-tuberculosis In 500 mg tablet34 Rifampicin 300 mg tablet Anti-tuberculosis Yes
For each medicine, the following two products were surveyed: the innovator brand and the lowest priced generic equivalent, the latter of which is determined at each medicine outlet
21
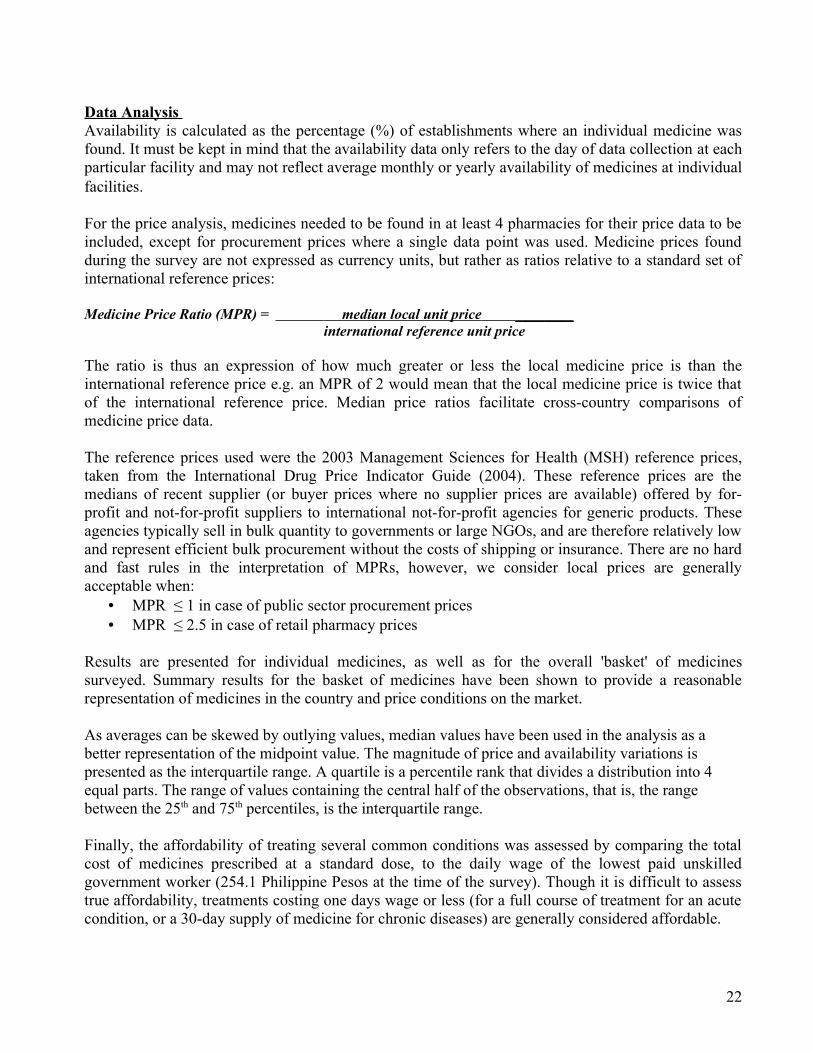
Data Analysis Availability is calculated as the percentage (%) of establishments where an individual medicine was found. It must be kept in mind that the availability data only refers to the day of data collection at each particular facility and may not reflect average monthly or yearly availability of medicines at individual facilities.
For the price analysis, medicines needed to be found in at least 4 pharmacies for their price data to be included, except for procurement prices where a single data point was used. Medicine prices found during the survey are not expressed as currency units, but rather as ratios relative to a standard set of international reference prices:
Medicine Price Ratio (MPR) = median local unit price ________ international reference unit price
The ratio is thus an expression of how much greater or less the local medicine price is than the international reference price e.g. an MPR of 2 would mean that the local medicine price is twice that of the international reference price. Median price ratios facilitate cross-country comparisons of medicine price data.
The reference prices used were the 2003 Management Sciences for Health (MSH) reference prices, taken from the International Drug Price Indicator Guide (2004). These reference prices are the medians of recent supplier (or buyer prices where no supplier prices are available) offered by for-profit and not-for-profit suppliers to international not-for-profit agencies for generic products. These agencies typically sell in bulk quantity to governments or large NGOs, and are therefore relatively low and represent efficient bulk procurement without the costs of shipping or insurance. There are no hard and fast rules in the interpretation of MPRs, however, we consider local prices are generally acceptable when:
• MPR ≤ 1 in case of public sector procurement prices• MPR ≤ 2.5 in case of retail pharmacy prices
Results are presented for individual medicines, as well as for the overall 'basket' of medicines surveyed. Summary results for the basket of medicines have been shown to provide a reasonable representation of medicines in the country and price conditions on the market.
As averages can be skewed by outlying values, median values have been used in the analysis as a better representation of the midpoint value. The magnitude of price and availability variations is presented as the interquartile range. A quartile is a percentile rank that divides a distribution into 4 equal parts. The range of values containing the central half of the observations, that is, the range between the 25th and 75th percentiles, is the interquartile range.
Finally, the affordability of treating several common conditions was assessed by comparing the total cost of medicines prescribed at a standard dose, to the daily wage of the lowest paid unskilled government worker (254.1 Philippine Pesos at the time of the survey). Though it is difficult to assess true affordability, treatments costing one days wage or less (for a full course of treatment for an acute condition, or a 30-day supply of medicine for chronic diseases) are generally considered affordable.
22

RESULTS AND DISCUSSION
The following results will be discussed in this report.
1. Availability of medicines in the public and private sectors2. Comparison of medicine prices with international reference prices3. The affordability of model treatment regimens4. Components of medicine prices
1. Availability of Medicines in the Public and Private Sectors
The data on availability of medicines refers to the inventory of the outlets on the day the data collection was done at each particular facility.
1.1. Public Sector
There were 26 pharmacies surveyed for the public sector. There were 12 innovator brands and 18 generic equivalents found in the public pharmacies surveyed. As in the case of public procurement data, only Lovastatin was not listed in the Philippine National Drug Formulary. Of the core and supplementary medicines surveyed , median availability was 8 % for innovator brand medicines and 15% for lowest priced generics. Table 9 shows the availability of core and non-core medicines in the public sector.
Table 9. Availability of medicines in the public sector (26 outlets) (Includes both core and non-core medicines, n = 34)
Median availabilityBrand Lowest price generic
Median availability 7.7% 15.4%25 %ile availability 3.8% 1.0%75 %ile availability 18.3% 33.7%
If only core medicines are analyzed, there are only 11 innovator brands and 10 generic equivalents available during the survey with median availability of 15% and 12 % respectively. Table 10 shows the availability of core medicines in the public sector.
Table 10. Availability of medicines in the public sector (26 outlets) (Includes core medicines only, n = 21)
Median availabilityBrand Lowest price generic
Median availability 15.4% 11.5%25 %ile availability 3.8% 0.0%
23

75 %ile availability 19.2% 30.8%
1.2 Private Sector
A total of 51 private pharmacies were included in this data set. For both core and supplementary medicines, 29 innovator brands and 24 generic equivalents were found. The median availability of branded medicines was 33 % and lowest price generic was 26.5 % . Table 11 shows the availability of core and non-core medicines in the private sector.
Table 11. Availability of medicines in the private sector (51 outlets) (Includes both core and non-core medicines, n = 34)
Median availabilityBrand Lowest price generic
Median availability 33.3% 26.5%25 %ile availability 15.7% 4.4%75 %ile availability 60.8% 46.6%
If only core medicines were analyzed, there were only 18 innovator brands and 12 generic equivalents with median availability of 35.3% and 15.7% respectively. Table 12 shows the availability of core medicines in the private sector.
Table 12. Availability of medicines in the private sector (51 outlets) (Includes core medicines only, n = 21)
Median availabilityBrand Lowest price generic
Median availability 35.3% 15.7%25 %ile availability 19.6% 2.0%75 %ile availability 60.8% 45.1%
1.3 Comparison of Public and Private Sector Availability for Selected Medicines
A comparison of the availability of selected medicines in the public and privates sector shows lowest price generics have higher availability in the public sector except Atenolol, Diclofenac and Salbutamol inhaler. Innovator brands on the other hand have higher availability in the private sector for the selected medicines as shown in the table below.
24

Table 13. Comparison of Public and Private Sector Availability for 11 Medicines, Innovator Brand and Generic Equivalent
Public Private Availability
IB LPG IB LPG Aciclovir 7.7% 15.4% 31.4% 5.9% Amoxicillin 3.8% 30.8% 25.5% 72.5% Atenolol 15.4% 15.4% 54.9% 31.4% Captopril 15.4% 46.2% 60.8% 49.0% Ciprofloxacin 23.1% 23.1% 35.3% 68.6% Co-trimoxazole susp 7.7% 34.6% 29.4% 33.3% Diclofenac 7.7% 7.7% 19.6% 15.7% Fluoxetine 15.4% 7.7% 11.8% 2.0% Glibenclamide 19.2% 23.1% 60.8% 39.2% Ranitidine 11.5% 34.6% 80.4% 64.7% Salbutamol inhaler 23.1% 0.0% 56.9% 7.8%
2. Comparison of Medicine Prices with International Reference Prices
2.1 Public Procurement Prices
The data for public procurement came from the hospital procurement data of a tertiary government hospital in Manila . Procurement price data was available for 17 branded medicines and 4 generic equivalents for a total of 21 medicines. The data for the public procurement facility indicated the procurement bidding price of medicines. The median MPR calculated for the branded medicines was 14.19 while for the lowest price generic was 5.14. The MPRs for the branded medicines ranged from 1.80 to 60.16 while that of generics ranged from 3.06 to 56.17. (Table 14). Thus, the public sector is purchasing most medicines at prices several times higher than international reference prices.
Table 14. Ratio of median unit price to MSH international reference price (median MPR), public procurement sector (Includes both core and non-core medicines, n = 34)
Innovator brand(n = 17)
Lowest price generic(n = 4)
25

Median MPR 14.19 5.1425 %ile MPR 6.90 3.6575 %ile MPR 28.27 18.86
Minimum MPR 1.80 3.06Maximum MPR 60.16 56.17
2.2 Public Sector Patient Prices
The 25 public pharmacies surveyed yielded 12 branded medicines and 18 generic equivalents. The median MPR for branded medicines was 15.31 while that of the generics was 6.40. The range of MPRs was significantly higher for the branded medicines at 3.11 to 79.89 as compared to the generics which showed an MPR range of 1.52- 19.49. Thus, patients are buying medicines from the public sector at many times their international reference price.
Table 15. Ratio of median unit price to MSH international reference price (median MPR), public sector (26 outlets) (Includes both core and non-core medicines, n = 34)
Innovator brand(n = 12)
Lowest price generic(n = 18)
Median MPR 15.31 6.4025 %ile MPR 8.14 3.2575 %ile MPR 32.43 10.59
Minimum MPR 3.11 1.52Maximum MPR 79.89 19.49
To compare medicines across product types, the analysis was restricted to only those medicines for which both the innovator brand and a generically equivalent product were found in at least four outlets. For these matched pairs, the median MPR for branded and generic medicines were 27.85 and 10.80 respectively (Table 16). Thus, in the public sector patients are paying nearly three times more for innovator brand medicines than for equivalent generics. Figure 1 shows the comparison of branded and generic MPRs on selected medicines in the public sector.
Table 16. Comparison of the prices of innovator brands and generically equivalent products: Median MPRs for medicines found as both product types
Innovator brand(n = 5)
Lowest price generic(n = 5)
Median MPR 27.85 10.8025 %ile MPR 17.30 7.4475 %ile MPR 29.17 13.59
Minimum MPR 6.13 1.70Maximum MPR 42.22 19.49
26

Figure 1. Median MPRs of innovator brands and generics equivalents for selected medicines in the public sector
0.00 10.00 20.00 30.00 40.00 50.00
Atenolol
Captopril
Ciprofloxacin
Public Sector MPRs
LPGIB
2.3 Private Sector Patient Prices
Of the 51 private pharmacies surveyed, a total of 29 branded medicines and 23 generics were included. The median MPR for the branded medicines stood at 17.28 while that of the generic equivalent was 5.64 (Table 17). Looking at the MPR range, the branded medicines registered a range of 3.33 to 184.09 while that of the generics showed 2.32 to 26.10. Similarly to the public sector, patients are buying medicines from the private sector at many times their international reference price.
Table 17. Ratio of median unit price to MSH international reference price (median MPR), private sector (51 outlets) (Includes both core and non-core medicines, n = 34)
Innovator brand(n = 29)
Lowest price generic(n = 23)
Median MPR 17.28 5.6425 %ile MPR 10.06 3.7875 %ile MPR 41.55 15.17
Minimum MPR 3.33 2.32Maximum MPR 184.09 26.10
27

For the private sector retail data, there were twenty-two medicines found both as innovator brand and lowest price generic in at least four outlets each. For these matched pairs, the median MPR for branded and generic medicines were 17.64 and 6.28 respectively (Table 18). Thus, in the private sector patients are paying nearly three times more for innovator brand medicines than for equivalent generics. The highest MPR documented in the private retail outlets was 184.09 for Doxycycline while the lowest was 3.33 for Salbutamol inhaler. Figure 2 shows the comparison of branded and generic MPRs on selected medicines in the private sector.
Table 18. Comparison of the prices of innovator brands and generically equivalent products: Median MPRs for medicines found as both product types (paired analysis)
Innovator brand(n = 22)
Lowest price generic(n = 22)
Median MPR 17.64 6.2825 %ile MPR 9.11 3.7675 %ile MPR 40.20 15.34
Minimum MPR 3.33 2.32Maximum MPR 184.09 26.10
Figure 2. Median MPRs of innovator brands and generics equivalents for selected medicines in the private sector
0.00 20.00 40.00 60.00
Amoxicillin
Atenolol
Captopril
Ciprofloxacin
Co-trimoxazole susp
Diclofenac
Private Retail Sector MPRs
LPGIB
3. The Affordability of Standard Treatment Regimens
The affordability of model treatments using the data from the survey was calculated based on the salary of lowest paid Philippine government employee (254.10 Philippine Pesos). This provides the number of days wages that the lowest paid Filipino government worker would have to spend to purchase a standard treatment course for selected conditions. For chronic conditions, a
28
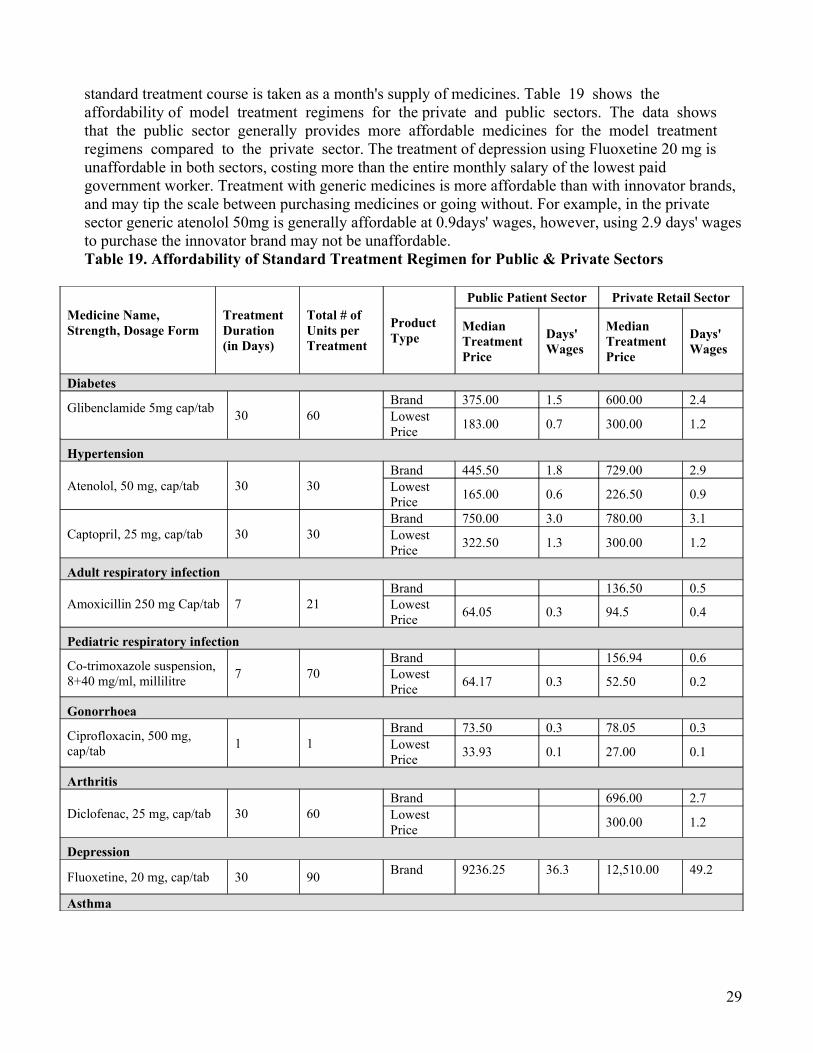
standard treatment course is taken as a month's supply of medicines. Table 19 shows the affordability of model treatment regimens for the private and public sectors. The data shows that the public sector generally provides more affordable medicines for the model treatment regimens compared to the private sector. The treatment of depression using Fluoxetine 20 mg is unaffordable in both sectors, costing more than the entire monthly salary of the lowest paid government worker. Treatment with generic medicines is more affordable than with innovator brands, and may tip the scale between purchasing medicines or going without. For example, in the private sector generic atenolol 50mg is generally affordable at 0.9days' wages, however, using 2.9 days' wages to purchase the innovator brand may not be unaffordable. Table 19. Affordability of Standard Treatment Regimen for Public & Private Sectors
Medicine Name, Strength, Dosage Form
Treatment Duration (in Days)
Total # of Units per Treatment
Product Type
Public Patient Sector Private Retail Sector
Median Treatment Price
Days' Wages
Median Treatment Price
Days' Wages
Diabetes
Glibenclamide 5mg cap/tab 30 60
Brand 375.00 1.5 600.00 2.4Lowest Price 183.00 0.7 300.00 1.2
Hypertension
Atenolol, 50 mg, cap/tab 30 30Brand 445.50 1.8 729.00 2.9Lowest Price 165.00 0.6 226.50 0.9
Captopril, 25 mg, cap/tab 30 30Brand 750.00 3.0 780.00 3.1Lowest Price 322.50 1.3 300.00 1.2
Adult respiratory infection
Amoxicillin 250 mg Cap/tab 7 21Brand 136.50 0.5Lowest Price 64.05 0.3 94.5 0.4
Pediatric respiratory infection
Co-trimoxazole suspension, 8+40 mg/ml, millilitre 7 70
Brand 156.94 0.6Lowest Price 64.17 0.3 52.50 0.2
Gonorrhoea
Ciprofloxacin, 500 mg, cap/tab 1 1
Brand 73.50 0.3 78.05 0.3Lowest Price 33.93 0.1 27.00 0.1
Arthritis
Diclofenac, 25 mg, cap/tab 30 60Brand 696.00 2.7Lowest Price 300.00 1.2
Depression
Fluoxetine, 20 mg, cap/tab 30 90 Brand
9236.25
36.3
12,510.00
49.2
Asthma
29

Salbutamol inhaler, 0.1m/dose As needed 200
Brand 330.40 1.3 353.60 1.4Lowest Price 268.00 1.1
Peptic ulcer
Ranitidine, 150 mg, cap/tab 30 60Brand 2153.40 8.5Lowest Price 525.00 2.1 780.00 3.1
Antiherpes
Aciclovir 200 mg cap/tab 5 5Brand 419.13 1.6Lowest Price 264.00 1.0
Figure 3 shows the number of days wages needed for standard treatments in the public sector when purchased as innovator brands and generic equivalent products.
Figure 3. Number of days' Wages needed to purchase selected medicines from the public sector
LPGG
Glib
en
cla
mid
e
Ate
no
lol
Ca
pto
pri
l
Am
oxic
illin
Co
-tri
mo
xa
zo
le s
usp
Cip
roflo
xa
cin
Dic
lofe
na
c
Flu
oxe
tine
Sa
lbu
tam
ol i
nh
ale
r
Ra
niti
din
e
Acic
lovir Branded
LPG
-
5.0
10.0
15.0
20.0
25.0
30.0
35.0
40.0
Selected Medicines (Branded & Generic)
Number of Days
Days' Wages to purchase a selected medicines
BrandedLPG
Branded
30

Figure 4 shows the number of days wages needed for standard treatments in the private sector when purchased as innovator brands and generic equivalent products.
Figure 4. Number of days' Wages needed to purchase selected medicines from the private sector
4. Components of Medicine Prices
The price components and mark-up data for the Philippine survey was gathered from various secondary sources. There was difficulty in getting the necessary data from primary sources in government agencies and in the private sector. The government agencies approached informed the research team that they cannot release the data requested because of disclosure and confidentiality limitations. The private sector sources approached would not want to divulge ‘trade secrets’ but were willing to refer the research team to other data sources. All the data collected from various secondary sources were tabulated and used in the components study. The analysis of data had to be revised considering the limited data available. A hypothetical case was developed using the minimum and maximum figures collected from the data. The table below shows the minimum and maximum figures collected for each stage of the components study.
-
5.0
10.0
15.0
20.0
25.0
30.0
35.0
40.0
45.0
50.0
Number of Days
Branded LPGSelected Medicines (Branded & Generic)
GlibenclamideAtenololCaptoprilAmoxicillinCo-trimoxazole suspCiprofloxacinDiclofenacFluoxetineSalbutamol inhalerRanitidineAciclovir
31

Table 20 shows the cumulative % mark up on a hypothetical case (imported medicines) using the minimum figures gathered for the components study. The cumulative mark-up adds to a minimum of 89.51 % using the minimum figures.
Table 20. Cumulative Mark-ups Using the Minimum Figures
Type of Charge Charge BasisAmount of
Charge
Price of Dispensed Quantity
Cumulative % Mark-up
Cost, insurance, freight (CIF) price NA NA 100.00 0.00%Finance/banking fees percent 1.00% 101.00 1.00%Quality control testing fee percent 0.54% 101.55 1.55%Import tariff/duty percent 3.84% 105.44 5.44%National corporate taxes percent 3.30% 108.92 8.92%Transport costs percent 10.17% 120.00 20.00%Wholesale mark-up percent 17.50% 141.00 41.00%Retail mark-up percent 20.00% 169.20 69.20%VAT percent 12.00% 189.51 89.51%
Table 21 shows the cumulative percent mark up on a hypothetical case (imported medicines) using the maximum figures gathered for the components study. The cumulative mark-up adds to a maximum of 273.24 % using the maximum figures.
Table 21. Cumulative Mark-ups Using the Maximum Figures
Type of ChargeCharge Basis
Amount of Charge
Price of Dispensed Quantity
Cumulative % Mark-up
Cost, insurance, freight (CIF) price NA NA 1000.00 0.00%Finance/bankling fees percent 1.61% 1016.10 1.61%Quality control testing fee percent 0.61% 1022.30 2.23%Import tariff/duty percent 3.84% 1061.55 6.16%National corporate taxes percent 5.70% 1122.06 12.21%Transport costs percent 20.00% 1346.48 34.65%Wholesale mark-up percent 65.00% 2221.68 122.17%Retail mark-up percent 50.00% 3332.53 233.25%VAT percent 12.00% 3732.43 273.24%
32

RECOMMENDATIONS
The second Philippine medicine price survey using the WHO/HAI methodology included four geographic regions namely: City of Manila, Baguio City, Cebu City and Cagayan de Oro City. The City of Manila and Baguio City are found in the Luzon Island group while Cebu City and Cagayan de Oro City are found in the Visayas and Mindanao Island groups respectively.
Data were collected for the public procurement prices, public sector patient prices and private sector patient prices showed the following trends:
Availability of Medicines
o For the public sector procurement data, there were 34 core and supplementary medicines included in the list. However, only 21 medicines or 62 % were found at the public procurement, even though all but Lovastatin are listed the Philippine National Drug Formulary Volume I. The 62% availability is relatively low considering that the tertiary government hospital where the data was collected is considered one of the biggest medical center in the country. Seventeen of these were innovator brands and only four were generic equivalents indicating a higher availability of innovator brands in public sector procurement agencies.
o The data for the public sector patient prices were gathered form the 26 pharmacies surveyed in the four cities. There were 12 innovator brands and 18 generic equivalents found in at least four of the public pharmacies surveyed. Of the core and supplementary medicines surveyed , median availability was 7.7% for innovator brand medicines and 15.4% for lowest priced generics. If only the core medicines are analyzed for availability, the median availability for branded medicines increases to 15.4% but for the lowest price generic medicines the median availability decreases to 11.5%. This indicates that for the core medicines innovator brands are more available in public sector facilities.
o For the private sector , a total of 51 private pharmacies were included in this data set. For both core and supplementary medicines, 29 innovator brands and 23 generic
33

equivalents were found in at least four pharmacies. The median availability of branded medicines was 33.3 % and lowest price generic was 26.5 % indicating a higher availability for the branded medicines. Looking at the core medicines only, the median availability for branded medicines increases slightly to 35.3 %. What is significant is that for core medicines in the private sector, the median availability drops to 15.7% indicating that for these medicines lowest price generic equivalents are not marketed as prominently as the innovator brands.
o A comparison of the availability of selected medicines in the public and privates sector shows lowest price generics have higher availability in the public sector except Atenolol, Diclofenac and Salbutamol inhaler. Innovator brands on the other hand have higher availability in the private sector. An example is Ranitidine which has a 80.4% availability in compared to 11.5 % in the public sector.
Comparison of Medicine Prices with the International Reference Price
o The public procurement price data was available for 17 branded medicines and 4 generic equivalents for a total of 21 medicines. The median MPR calculated for the branded medicines was 14.19 while for the lowest price generic was 5.14. The MPRs for the branded medicines ranged from 1.80 to 60.16 while that of generics ranged from 3.06 to 56.17. Thus, the public sector is purchasing most medicines at prices several times higher than international reference prices.
o For the public sector pharmacy prices, the 25 outlets surveyed yielded 12 branded medicines and 18 generic equivalents. The median MPR for branded medicines was 15.31 while that of the generics was 6.40. The range of MPRs was significantly higher for the branded medicines at 3.11 to 79.89 as compared to the generics which showed an MPR range of 1.52- 19.49. Thus, patients are buying medicines from the public sector at many times their international reference price.
o Of the 51 private pharmacies surveyed, a total of 29 branded medicines and 23 generics were included. The median MPR for the branded medicines stood at 17.28 while that of the generic equivalent was 5.64 . Looking at the MPR range, the branded medicines registered a range of 3.33 to 184.09 while that of the generics showed 2.32 to 26.10. Similar to the public sector, patients are buying medicines from the private sector up to 184 times higher than international reference price.
Affordability of Medicines
34

o The data on affordability of medicine shows that the public sector generally provides more affordable medicines for the model treatment regimens compared to the private sector. The treatment of depression using Fluoxetine 20 mg is unaffordable in both sectors, costing more than the entire monthly salary of the lowest paid government worker. Treatment with generic medicines is more affordable than with innovator brands, and may tip the scale between purchasing medicines or going without. For example, in the private sector generic Atenolol 50mg is generally affordable at 0.9days' wages, however, using 2.9 days' wages to purchase the innovator brand may not be unaffordable.
Component Costs
o For the study on component costs, a hypothetical case was developed using the minimum and maximum figures collected from secondary data sources. The cumulative % mark up on a hypothetical case (imported medicines) using the minimum figures gathered for the components study showed 89.51 % price mark-up. On the other hand, the cumulative % mark up on a hypothetical case (imported medicines) using the maximum figures indicated maximum of 273.24 % price markup. If duties and taxes were removed, the minimum and maximum percent markups would be reduced to 57.74% and 203.62%, respectively.
Based on the said results and discussions, the following recommendations are forwarded:
1. Dissemination of survey results to identified groups• The results of the study should be disseminated to broaden the stakeholder base and
start the advocacy process. The dissemination activity could also serve to validate the results of the study and generate interest on the further use of the methodology. Among the groups that should be made aware of the results of the study are: legislators interested in access to medicine issues, civil society groups involved in advocacy for affordable medicines, other government agencies involved in policy and program development on essential medicines, consumer groups and the general public. Agencies doing procurement of medicines at the international, national and local levels and agencies monitoring or auditing the procurement prices of medicines, are also critical groups who can use the study results for programming or decision making purposes.
• Preparation of a more popular version of the survey methodology and findings so that the study results can better be appreciated and understood. The popular version can also be posted in public places so that it can provide the general public with evidence-based information on medicine pricing in the country.
• The trends in the 2002 and 2005 surveys could provide the intended audience a more convincing picture of the medicine price situation and establish the benefits of doing a regular medicine price survey using a standard methodology.
35

2. Advocate for the Utilization of Survey Results
• The methodology and results of the medicine price survey should be reconciled with the current price monitoring scheme for essential medicines being conducted by the Department of Health. There are also other medicine pricing methodologies being used by other institutions so there is really a need to find a common ground on how to approach the differences in the methodologies of medicine price surveys.
• A regular medicine price survey is proposed to be implemented in whole country with data disaggregation at the regional level. This can be a tool to monitor the changing prices in the market throughout the country and inform policy makers on the variation of prices in other parts of the country. The survey should include medicines that the health system defines essential for the population’s needs.
• The results of the survey should be used to advocate for measures that can lower the prices of medicines in the country. The results can be used to argue for policy and program initiatives to lower the prices of medicines. There are several legislative initiatives currently being discussed at the national legislature and their proponents would surely benefit from the findings of this study.
• Consumers and consumer groups could likewise use the survey results to generate more consumer awareness on the issue of medicine prices. Well informed consumer groups can hopefully push for policies and programs that promote pricing transparency and eventually establish mechanisms for lower pricing of medicines.
3. Policy Recommendations
• The National Drug Policy in the Philippines to consolidate the findings of various medicine price surveys done so far and initiate the conduct of regular medicine price surveys in the country. The results of such surveys should be relayed to the National Price Coordinating Council so that medicine prices are discussed not only in the health sector but among the other agencies concerned with trade and welfare issues.
• The methodology to measure availability, Median Price Ratio of essential medicines and affordability can be integrated in a monitoring system that looks at the quality of health services. A score card on access to affordable medicines can be developed to assess the how far the health delivery system has responded to the needs of the populace with regards to their health problems.
• The study can be one of the links between research-based evidence on medicine prices and decision making on medicine procurement. The survey findings specifically the Median Price Ratio can be used as reference for price negotiations and auditing
36

of medicine procurements. This referencing process can introduce a more transparent pricing process and link the study to the discourse on fair pricing of medicines. The discourse on fair pricing, equity issues in access to medicines and the rights based approach to development programs will establish the issue of medicine prices as a human rights issue and therefore an integral part of one’s basic right to have access to basic health services.
• Of the 21 medicines found in public procurement, 17 were innovator brands and only 4 were generics. Some medicines (e.g. isosorbide dinitrate, omeprazole) are being procured both as innovator brands and generics, with the innovator brands costing nearly double the price of the generics. Further, both innovator brands and generic equivalents are being purchased at several times their international reference price. This situation requires further investigation, followed by appropriate action (e.g. pooled procurement, competitive tender with price transparency), to improve the efficiency of the public procurement system.
• Availability of medicines in both public (15.4 % for lowest priced generic) and private (26.5% for the lowest priced generic) sectors are comparatively low. This shows that population access to essential medicines is severely limited by its low availability in the outlets. Steps must be taken to improve access of essential medicines especially in the more difficult areas where availability will still be even lower.
• Public sector patient prices are many times higher than international reference prices (15 and 6 times higher for innovator brands and lowest priced generics respectively), and patients are paying nearly three times more to purchase innovator brands as compared to generics. Similarly, private sector patient prices are many times higher than international reference prices (17 and 6 times higher for innovator brands and lowest price generics, respectively), and patients are paying nearly three times more to purchase innovator brands as compared to generics. Policies are needed to encourage the use of generics medicines, and to reduce their cost in both sectors. This may require direct importation of generic medicines from outside the Philippines.
• Some standard treatments are very unaffordable to the lowest paid government worker. IN the private sector, a month's treatment of depression with innovator brand Fluoxetine costs the lowest paid government worker 49 days wages! The treatment of a peptic ulcer costs 8.5 days wages when innovator brands are prescribed or dispensed, and still costs 3 days' wages if generics are used. This is an additional evidence for the need to encourage the use of generics medicines which must go hand in hand with concrete policy measures to reduce medicine prices.
• Wholesale and retail mark-ups can reach 65% and 50%, respectively. Using these maximum figures, if mark-ups were removed, the cumulative mark-up would decrease from 273% to 51%. If wholesale and retail markups were halved, the cumulative markup would decrease to 150%. Similarly, if medicines were exempt from import tariffs (3.84%), national corporate taxes (5.7%) and VAT (12%), the maximum cumulative mark-up would decrease by 69%,
37
from 273% to 204%. Tax exemptions for medicines, and the regulation of mark-ups, should therefore be examined as possible policy options for reducing medicine prices.
38

1
� The Official Website of the Republic of the Philippines. “General Information on the Republic of the Philippines.” 2006. www.gov.ph/aboutphil/general.asp. Accessed 9 August 2006.
2 National Census and Statistics Office, Republic of the Philippines, 2006
3 UNFPA Country Statistics, Philippines, http://www.unfpa.org/profile/philippines.cfm, Accessed 9 August 2006
4 Philippine Health Data. World Health Organization- Western Pacific Region Website. Manila Philippines. http://www.wpro.who.int/countries/05phl/health_situation.htm, Accessed 9 August 2006
5 Bengzon, M.A. Balancing the scales: a review of the pharmaceutical markets of the Philippines, Thailand and Australia: Ateneo School of Government, 2000
6 Solon, O. and Banzon, E. Competition promotion and the price of drugs and medicines. Consultancy7 Report, 2000.
� Timmons Raal. Philippine pharmaceutical management assessment. Management Sciences for Health, 1999 April.
8 Bodart, C. et al. “Social Franchising in the Philippines: An Early Assessment of an On-going Experience in the Pharmaceutical Sector.” Proceedings from the 3rd Health Research for Action National Forum, Department of Health and Philippine NGO Council on Population, Health and Welfare, Inc. 23-24 May 2002
9 Ramos, Joshua, BFAD Deputy Director. “ Pharmaceutical Policies for Affordable Access”, presented on 01 September, 2006 at the Ateneo De Manila University, Quezon City.
10In Essential Drugs Monitor, Health Action Information Network. Quezon City, Philippines
11 Amartya Sen, Development as Freedom. Oxford University Press, New Delhi, 2000
12 Drug Industry in the Philippines, Ibon Foundation, Inc., Manila, 2001
13 Dayrit, Santos Ocampo, Dela Cruz. History if Philippine Medicine: 1899-1999. Pasig City. Anvil Pub., 2002
14 Philippine Chamber of Commerce. Primer on the Philippine Drug Industry, Ibon Databank, 1979
15 Philippine Pharmaceutical Industry Factbook. 6th Edition. Pharmaceutical Association of the Philippines. Man ila, July 2003.
16 Dela Cruz, Michael. “Philippine Chamber of Pharmaceutical Industries” Statement of Mr. Michael dela Cruz, President of CFDMD, Philippine Senate Committee Hearing, 23 May 2006.
17 Anderson, S. with Huss, R.,Summers, R. and Widenmayer, K. Birkhauser Verlag. Basel, Managing Pharmaceuticals in International Health. Switzerland. 2004
18 Business World. “Business World Top 1,000 Corporations.” SEC Philippines 5000, 2000 Edition
19 Philippine Pharmaceutical Industry Factbook. 6th Edition. Pharmaceutical Healthcare Association of the Philippines. Ma nila, July 2003
20 Dayrit, Santos and Ocampo, Dela Cruz. History if Philippine Medicine: 1899-1999. Pasig City. Anvil Publication. 2002.
21 Manila Times. “In Drug Industry in the Philippines,” Ibon Foundation, Inc. Manila. (4 May 2000) 2001
22 Baguio City. “Baguio City Profile.” 1996. http://baguio-city.ask.dyndns.dk/. Accessed 15 September 2006
23 Cebu City. “Cebu City Profile.” 1996. http://www.cebucity.gov.ph/. Accessed 6 April 2006
REFERENCES

24 Total Population, Number of Households, Average Household Size, Population Growth Rate and Population Density by Region, Province and Highly Urbanized City: as of 1 May 2000. http://www.census.gov.ph/census2000/c2kfinal_tbl.html. Accessed 9 August 2006.
25 Philippine National Drug Formulary, Volume 1, 6th Edition. Department of Health, Manila Philippines, 2005