
A Literature Review on the Influence of Promotion, Price ...
1 Copyright © 2018 The Nielsen Company (US), LLC. Confidential and proprietary. Do not distribute.
THE PRICE AND PROMOTION PLAYBOOK SERIES
WHAT TO DO WHEN THE COST OF GOODS GOES UP:MAKE THE PRODUCT SMALLER OR RAISE THE PRICE?

2 Copyright © 2018 The Nielsen Company (US), LLC. Confidential and proprietary. Do not distribute.
INTRODUCTIONU.S. energy and labor costs have stayed flat and inflation has been reasonably stable for several years. In fact, price increases have proven to be challenging lately even though food inflation has matched overall inflation for more than a decade. However, fast-moving consumer goods (FMCG) manufacturers and retailers, especially those who sell food products, remain under constant pressure to grow margins and profit— a task that often requires more strategy than simply raising prices.
U.S. FOOD INFLATION VS. OVERALL INFLATION IN THE LAST DECADE
Source: tradingeconomics.com U.S. Bureau of Labor Statistics
0 2
2 0
4 2
6 4
8 6
-2 -4
2008 2010 2012 2014 2016 2018
US INFLATION RATEUS FOOD INFLATION

3Copyright © 2018 The Nielsen Company (US), LLC. Confidential and proprietary. Do not distribute.
At Nielsen, we know there are other ways to increase margins, such as adjusting recipes, changing sourcing and changing pack configuration. But there’s one in particular that works best when the price of goods is high called "downsizing." Downsizing is essentially when a manufacturer makes its product size smaller but either keeps the price the same or does a price increase and downsizes to increase margins.
In this white paper, we’re going to focus primarily on downsizing: when it’s beneficial, how to do it effectively and how it can help companies protect their margins, especially when the cost of goods is high.
WHAT’S INVOLVED WITH DOWNSIZING?When a company reduces the pack size of a product (i.e., size, ounce, count, etc.,) it can offer the item at the same price of the previous pack size or it can adjust price along with pack size. For manufacturers, downsizing helps maintain volume and profit. The key, however, is to change the product’s size without making the smaller size obvious to shoppers. If the change isn’t discernible, shoppers will likely continue to purchase the product at the previous rate.
However, it can be dangerous to assume that downsizing is the right plan of action whenever the cost of goods is high. Before changing the pack size of a product, first evaluate all options to determine whether downsizing the product will be the financially beneficial decision for your company. Next, identify a solid objective for the process and implement a cost-saving plan around it.

4 Copyright © 2018 The Nielsen Company (US), LLC. Confidential and proprietary. Do not distribute.
THE ROLE THAT COST OF GOODS PLAY IN DOWNSIZINGManufacturers typically look to downsize one or more of their products when the cost of goods is high to reduce operational costs, a move that can help them either maintain margins or turn a profit. Categories with a high cost of goods include tuna fish, diapers and olive oil, whereas carbonated beverages, water and liquor have a low cost of goods. Comparatively, snack foods are somewhere in-between—some have a relatively high cost of goods, while others have a relatively low cost.
For example, let’s look at two snacking products: Brand A chips and Brand B biscuits. Each are $1.00 at retailers. But if the two companies downsized their products by 10%, the margins would be different. For example, let’s say that the cost of goods for Brand A chips is $0.40. Then downsizing the pack size would result in $0.04 savings for Brand A. On the other hand, if Brand B biscuits was to downsize its pack, it would only would incur a savings of $0.02 because its cost of goods is $0.20.
But deciding whether or not to downsize a product relies on more than just cost. It depends on both the size elasticity and price elasticity of your product. Since Brand A has the higher cost of goods, it’s safe to assume that this is the better product to consider downsizing. Let’s take a closer look at this thinking.
BRAND A CHIPS AND BRAND B BISCUITS
Shelf price
Cost of goods
Savings
$1.00
$0.40
$0.04
$1.00
$0.20
$0.02
BRAND A BRAND B

5Copyright © 2018 The Nielsen Company (US), LLC. Confidential and proprietary. Do not distribute.
5
DIGGING INTO ELASTICITIES: TO RAISE THE PRICE OR DOWNSIZE THE PRODUCTPrice elasticities are used to predict how an expected change in the price or size of a product will affect volume. They are represented as negative numbers, implying that as price goes one direction, volume takes the inverse action (i.e., price up, volume down).
Here’s a visual example of price elasticity vs. size elasticity in the context of our earlier example. The chart below shows that size elasticity for Brand A chips is smaller than its price, which is usually the case. This means that size changes are often more difficult for a consumer to detect. However, experience has taught us that while it may appear reducing the size of a product would be the better option, downsizing isn’t that simple or intuitive.
BRAND A VOLUME LOSS BY PRICE ELASTICITY VS. SIZE ELASTICITY
0%
-5%
-10%
-15%PRICE ELASTICITY SIZE ELASTICITY
BRAND A VOLUME LOSS

6 Copyright © 2018 The Nielsen Company (US), LLC. Confidential and proprietary. Do not distribute.
• Price elasticity is the unit change with a unit price change:For example, if Brand A’s price elasticity is -1.5, then a 10% price increase would result in a -13% change in units (the formula is 1.1^-1.5).
• Size elasticity is the unit change with a size price change:If Brand A’s size elasticity is -0.5, then a 10% decrease in size (which is essentially a price increase) would result in a -5% change in units (the formula is 1.10^-0.5).
To better understand the dynamics behind price and size elasticities, let’s dig deeper into the Brand A chips example to determine whether the manufacturer should downsize its product, raise the price or downsize its product and raise the price.
What would happen if Brand A increased the unit price?Currently, Brand A chips are sold at retail for $1.00. It costs Brand A $0.50 to manufacture a unit ($0.40 for the cost of goods and $0.10 for other costs, such as transportation, marketing, etc.). For retailers, it costs $0.75 to purchase the product from Brand A (the manufacturer), resulting in a $0.25 per unit profit for Brand A.
But let’s say that a few months from now Brand A wants to secure a retail shelf increase of $0.10. In order to keep the retailer’s margin whole, Brand A would need to increase its list price by $0.07 to $0.82 to enable the retailer to increase the shelf price to $0.10. Of that $0.10 shelf increase, $0.03 will go to the retailer and $0.07 to Brand A—a 28% margin for the company or profit per unit increase of $0.25 to $0.32.
INCREASING THE PRICE OF BRAND A CHIPS
Shelf Price
Manufacturer Cost
Cost of Goods
Other Costs
List Price to Retailer
Manufacturer Profit
$1.00 > $1.10
$0.50
$0.40
$0.10
$0.75 > $0.82
$0.25 > $0.32
BRAND A
So, even if Brand A calculates that it would make an additional profit of 11% on the price increase (1.28*.07), we see that the company will lose 13% volume when we factor in that Brand A has a price elasticity of -1.5.

7Copyright © 2018 The Nielsen Company (US), LLC. Confidential and proprietary. Do not distribute.
What would happen if Brand A decreased its product size?Well, first, let’s take a look at the facts.
• Earlier, we said that the price elasticity for Brand A chips was -0.5. So, if Brand A was to downsize its product by 10%, it would lose 5% of its volume.
• However, we just learned in the previous example that raising the price from $.25 to $.32 per unit did not increase Brand A’s profit.
• And, based on our cost of goods chart, we said that with a $0.40 cost of goods, downsizing Brand A chips by 10% would generate $0.04 cost savings.
So, if Brand A downsized its pack, then it would increase it’s profit $0.29 per unit. When compared to the profit from the unit price increase example, Brand A would increase its margin by 16% and profitability by about 10% (1.16*0.95).
However, going back to our Brand B biscuits example, the cost of goods is $0.20, which is significantly lower than Brand A’s cost of goods. In the chart below you’ll see that if Brand B was to apply this same downsizing strategy, the company would see an even smaller benefit from downsizing because its cost of goods rate is relatively low. So the effort wouldn’t be worth it in the long run.
KEY QUESTIONS
1) Do you know what the price elasticities and size elasticities
are for your product?
2) Do you know what would happen if the price or size of your
product changed?
DOWNSIZING BRAND A CHIPS VS. DOWNSIZING BRAND B BISCUITS
Shelf Price
Manufacturer Cost
Cost of Goods
Other Costs
List Price to Retailer
Manufacturer Profit
$1.00 > $1.10
$0.50
$0.40 > $0.36
$0.10
$0.75 > $0.82
$0.25 > $0.29
$1.00
$0.50
$0.20
$0.30
$0.75
$0.25
BRAND A BRAND B

8 Copyright © 2018 The Nielsen Company (US), LLC. Confidential and proprietary. Do not distribute.
A GLOBAL OVERVIEW OF PRICE ELASTICITY AND SIZE ELASTICITYMeasuring unit price sensitivity is a well-established science. However, size elasticity is a fairly underdeveloped discipline simply because downsizing is complex operationally and therefore has relatively fewer recent industry-tested insights. More specifically, downsizing is not often executed because altering the formulation and package configurations of a product can be a difficult process.
With fewer instances to measure, some turn to creating proxy measures (i.e., using consumer panel data about perceptions of product sizes) to simulate the effect—but all too often their occurrence is both infrequent and inaccurate. Sometimes we use a ratio (or percentage) of the price-to-size elasticity, based on the price elasticity—however, while this may be more helpful, it still is based on assumptions. A company could also use primary research if it relied on a carefully controlled model but, again, it’s not typical to have historical data that shows the effects of changing pack size. Let’s explore how you could estimate directional size elasticity from price elasticity.
To help with inferring plausible size elasticity from price elasticity, let’s take a look at a study that Nielsen conducted a few years ago that broadly investigates the actual relation between these two elasticities, sourced across 10 countries and from 14 different categories. We should note that, while the study is while the study is from a few years ago, it still holds a lot of value because it is one of the few global studies that has been conducted which shows the relation between price and size elastically. This is primarily because the market has maintained relatively stable since the recession, so sweeping pack size changes haven’t been top of mind for manufacturers in a few years.
9Copyright © 2018 The Nielsen Company (US), LLC. Confidential and proprietary. Do not distribute.
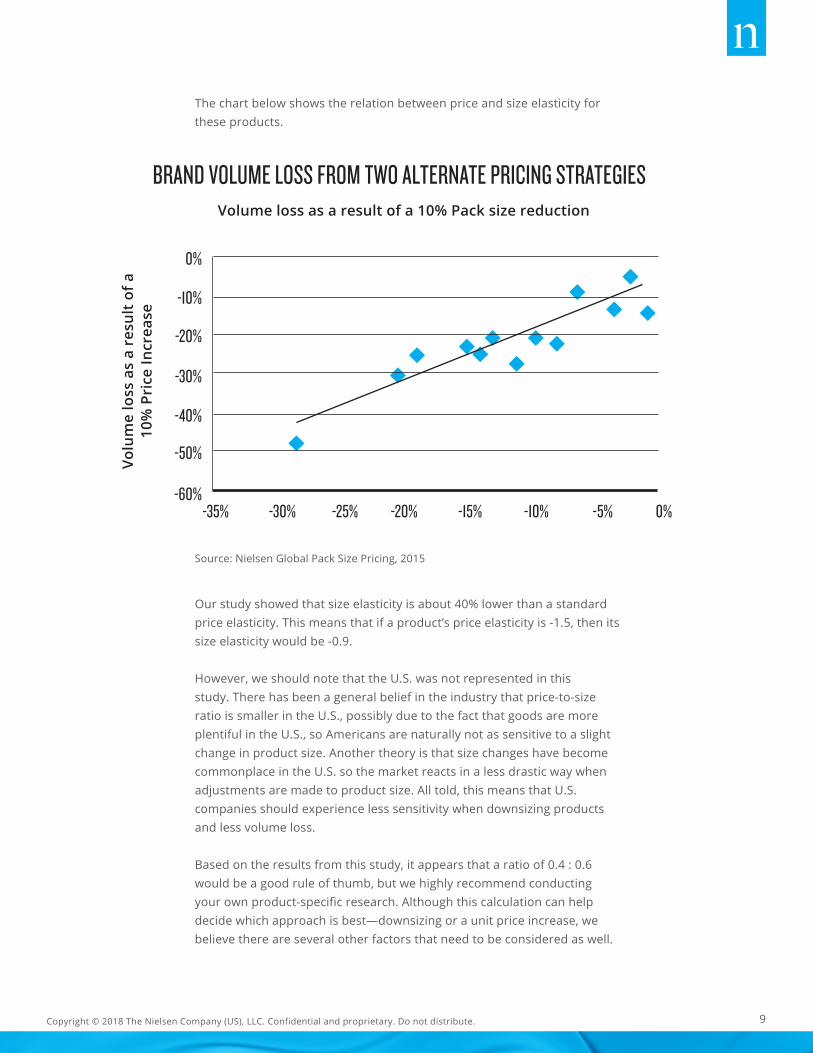
The chart below shows the relation between price and size elasticity for these products.
Our study showed that size elasticity is about 40% lower than a standard price elasticity. This means that if a product’s price elasticity is -1.5, then its size elasticity would be -0.9.
However, we should note that the U.S. was not represented in this study. There has been a general belief in the industry that price-to-size ratio is smaller in the U.S., possibly due to the fact that goods are more plentiful in the U.S., so Americans are naturally not as sensitive to a slight change in product size. Another theory is that size changes have become commonplace in the U.S. so the market reacts in a less drastic way when adjustments are made to product size. All told, this means that U.S. companies should experience less sensitivity when downsizing products and less volume loss.
Based on the results from this study, it appears that a ratio of 0.4 : 0.6 would be a good rule of thumb, but we highly recommend conducting your own product-specific research. Although this calculation can help decide which approach is best—downsizing or a unit price increase, we believe there are several other factors that need to be considered as well.
BRAND VOLUME LOSS FROM TWO ALTERNATE PRICING STRATEGIESVolume loss as a result of a 10% Pack size reduction
Volu
me
loss
as
a re
sult
of a
10
% P
rice
Incr
ease
-35% -30%
-30%
-40%
-50%
-60%-25% -20%
-20%
-10%
-10%
-15% -5% 0%
0%
Source: Nielsen Global Pack Size Pricing, 2015

10 Copyright © 2018 The Nielsen Company (US), LLC. Confidential and proprietary. Do not distribute.
WHAT TO CONSIDER WHEN DOWNSIZING A PRODUCTDeciding whether you should downsize or increase the price of your product can be tough. Here are a few questions to consider that can help you decide whether downsizing is the appropriate course of action.
Are you altering the relationship between price and value for your product? If you’re downsizing your product, the first thing you should look at is whether the change will seriously alter the relationship between price and value. If the package ends up being much smaller than the original one, the reduced amount of product becomes more noticeable to the consumer. This could turn the consumer away from wanting to buy your product.
Does your product have a size anchor? If so, will downsizing the product negatively impact it?Changing the size of a product comes with many risks, including the possibility of contradicting the market’s standard expectations of size. We call this expectation a “size anchor.” For example:
• Milk tends to be delivered in a gallon jug
• Beer tends to come in a 6, 12 and 24 packs
• Butter is typically a pound and each stick is 1 cup
One way around a size anchor is to change the metrics. So, if you’re planning to change your product to a liter when its size anchor is a quart, we recommend expressing explicitly that it’s a liter.
KEY QUESTIONS
Do consumers routinely use your product
configuration for a specific purpose? (i.e., in recipes)

11Copyright © 2018 The Nielsen Company (US), LLC. Confidential and proprietary. Do not distribute.
Is there a key usage for the current specs of your product?Size anchors are significant because they dictate the perception and usage of a product. One of the most important things to keep in mind when downsizing a product is whether or not the smaller product will stand out as under-sized. This is particularly important to consider if consumers use your product on a routine basis as a size deviation could jeopardize usage. For example, downsizing butter from a stick (or 8 tablespoons) to ¾ of a stick (or 6 tablespoons) may alienate consumers as many recipes call for a stick of butter and ¾ of a stick is more cumbersome to measure.
If you were to downsize your product, will it generate “dead space” on shelves?When downsizing, it’s important to keep in mind that different product configurations can complicate shelving dynamics. If the new size violates the size anchor for the product, then it could become problematic not only from a consumer point of view, but also from the retailer perspective. If the new size violates a size anchor, there might be more “dead” or unused space on the shelf, which a retailer may consider a lost revenue opportunity. For this reason, it’s especially important to collaborate with your retail partners when downsizing a product.
Should you match the competition’s pricing strategy?When manufacturers simulate volume loss from a price increase, they typically consider whether their competitors are going to match their price increase because then they would have a better chance of preserving volume. Some manufacturers may not even make a change to their price or volume if the competition won’t match price, primarily because an isolated price increase stands out in a negative way to both consumers and retailers. In this case, if a match-up is necessary for a price increase to be effective, then you should consider increasing the price of your product rather than downsizing it. Why? Downsizing takes longer to execute due to the changes that would need to be made to your operations, supply, etc. to make the product smaller. Comparatively, price increases can be executed in a few days or weeks.
Do you need to maintain a key price for your product?One key advantage of downsizing is that it doesn’t go hand in hand with price, meaning you aren’t necessarily required to reduce the price of a product and it can stay at its everyday, baseline non-promoted or promoted price. Now, you can still reach key promoted prices with an everyday price increase, but it is more costly. It may be especially risky to raise the price if your product has to be at a particular everyday or promoted price, unless you’re increasing trade promos commensurately.

12 Copyright © 2018 The Nielsen Company (US), LLC. Confidential and proprietary. Do not distribute.
Can we mask downsizing?It’s natural for manufacturers and retailers to try to mask any action that might result in volume loss. For example, a manufacturer may downsize a product by 5% so it’s still possible to use the product’s same packaging rather than downsize the product by a relatively high amount such as 10%, which could require a package change. The goal here is to make the change less noticeable to consumers and save on operational costs. Reducing a product size to 12.2 ounces from 12.9 ounces could go unnoticed by consumers, but transitioning from 10.5 ounces to 9.9 ounces tends to be more conspicuous. Additionally, a manufacturer may consider both downsizing and simultaneously changing the product (i.e., using organic goods instead of the original goods in the formulation). Again, this is another way to mask the functional price increase.
If you downsize your product, is there a benefit to consumers that you can leverage with retailers?One of the best ways to dampen the deleterious effects of downsizing is to position it as a good thing for consumers. How can this seemingly impossible message be crafted? After all, it’s a price increase. For example, you could position the smaller pack-size in an indulgent category like cookies as a forced calorie/portion control, thereby suggesting that consumers should buy smaller amounts. Downsizing enables manufacturers and retailers to reach historically important price points without more investment and, at the same time, consumers still get the product for their desired price.
Did you recently decrease trade or advertising spend? In Marketing Mix Modeling, we often find synergies between marketing elements. For example, a coupon dropped in conjunction with a print circular or ad performs so much better than when dropped in the absence of marketing support. In contrast, when a manufacturer or retailer downsizes a product at the same time that it decreases trade or advertising spend, the effect of the reduced product size could be accentuated.
Are there unintended consequences to downsizing?Yes. On the operations side, for example, the machine fill rate or the supply chain processes may not work out as smoothly as hoped. On the retail side, you may alienate your retail partners if your decision to downsize your product comes off as opportunistic. If you downsized your product would the UPC need to change?Some size changes legally require a UPC change. And, in reaction to this, retailers sometimes exact a slotting charge to manufacturers when they introduce a new UPC to the shelf.
KEY QUESTIONS
Does my product have a key everyday or promoted price?

13Copyright © 2018 The Nielsen Company (US), LLC. Confidential and proprietary. Do not distribute.
PULLING IT ALL TOGETHER: WHEN DOWNSIZING IS BENEFICIALTo summarize, below are the conditions to look for when determining whether downsizing your product is beneficial.
• The cost of goods is high
• Size elasticity is low and price elasticity is high
• Your product does not have a size anchor and won’t result in a loss of retail space utilization or alienate consumers who routinely use your product
• There is no need for the competition to match your price
• You can mask the fact that you’ve downsized your product, preferably in a way that adds some sort of value to consumers (i.e., product improvement, lower price)
• Your product still can reach key everyday and promoted prices
• Key stakeholders (i.e., retailers) are included in the execution
• There are no unintended consequences in terms of consumer usage, retail “dead space,” etc.
Of course, no product can satisfy the entire list and some of the dimensions are more important than others. The most important thing to keep in mind when downsizing is whether the downsized product will help you achieve your business objectives more than a price increase.
Downsizing is a complicated strategy that, when done right, can increase margin and profit. We can help you build strategies that set you up for optimal ROI. Contact us for more information about our pricing and promotion services and ask us how we can help you with your innovation and marketing areas as well.
14 Copyright © 2018 The Nielsen Company (US), LLC. Confidential and proprietary. Do not distribute.
ABOUT NIELSENNielsen Holdings plc (NYSE: NLSN) is a global measurement and data analytics company that provides the most complete and trusted view available of consumers and markets worldwide. Our approach marries proprietary Nielsen data with other data sources to help clients around the world understand what’s happening now, what’s happening next, and how to best act on this knowledge. For more than 90 years Nielsen has provided data and analytics based on scientific rigor and innovation, continually developing new ways to answer the most important questions facing the media, advertising, retail and fast-moving consumer goods industries. An S&P 500 company, Nielsen has operations in over 100 countries, covering more than 90% of the world’s population. For more information, visit www.nielsen.com.
THE SCIENCE BEHIND WHAT’S NEXT ™

15Copyright © 2018 The Nielsen Company (US), LLC. Confidential and proprietary. Do not distribute.