The Prevalence of Cellphone Use while Driving in Alberta
35
1 The Prevalence of Cell Phone Use while Driving in a Canadian Province Abu Sadat Nurullah Department of Sociology University of Alberta 5-21 Tory Building Edmonton, Alberta, T6G 2H4, Canada [email protected] Jasmine Thomas Department of Sociology University of Alberta 5-21 Tory Building Edmonton, Alberta, T6G 2H4, Canada [email protected] Fatemeh Vakilian Department of Public Health Sciences University of Alberta 3-300 Edmonton Clinic Health Academy 11405–87 Ave, Edmonton, Alberta, T6G 1C9, Canada [email protected] Cite this article as: Nurullah, A. S., Thomas, J., & Vakilian, F. (2013). The Prevalence of Cell Phone Use while Driving in a Canadian Province. Transportation Research Part F: Traffic Psychology and Behaviour, 19, pp. 52–62. doi:10.1016/j.trf.2013.03.006
Transcript of The Prevalence of Cellphone Use while Driving in Alberta
1
The Prevalence of Cell Phone Use while Driving in a Canadian Province
Abu Sadat Nurullah Department of Sociology
University of Alberta 5-21 Tory Building
Edmonton, Alberta, T6G 2H4, Canada [email protected]
Jasmine Thomas Department of Sociology
University of Alberta 5-21 Tory Building
Edmonton, Alberta, T6G 2H4, Canada [email protected]
Fatemeh Vakilian Department of Public Health Sciences
University of Alberta 3-300 Edmonton Clinic Health Academy
11405–87 Ave, Edmonton, Alberta, T6G 1C9, Canada [email protected]
Cite this article as: Nurullah, A. S., Thomas, J., & Vakilian, F. (2013). The Prevalence of Cell Phone Use while
Driving in a Canadian Province. Transportation Research Part F: Traffic Psychology and Behaviour, 19, pp. 52–62. doi:10.1016/j.trf.2013.03.006

2
The Prevalence of Cell Phone Use while Driving in a Canadian Province
Abstract
The use of a cell phone while driving has been recognized as a form of distracted driving across
the world. Many countries have banned the use of handheld mobile devices while operating
motor vehicles. In Canada, all the provinces and territories now ban the use of handheld cell
phones while driving. Utilizing the 2011 annual Alberta Survey, this study examined the current
prevalence of cell phone use while driving in the province of Alberta. Moreover, this paper
investigated the impact of the perception of risk on actual behaviors, and if demographic factors
played a role. Our results indicated that despite being cognizant of the risks involved, many
Albertans (52%) still use cell phones (45% of cell phone users utilized hands-free devices) while
driving. Logistic regression analysis indicated that gender, age, employment status, home
ownership, household income, immigrant status, and risk perceptions were significant predictors
of cell phone use while driving in the province. These findings imply that the use of cell phones
while operating a vehicle remains quite high despite legislative efforts to limit such behavior.
Keywords: cell phone use, distracted driving, Alberta

3
1. Introduction
The use of cell phones while driving has become a common phenomenon contributing to
distracted driving across the world. As a result, more than 70 countries have banned the use of
(mostly hand-held) cell phones while driving. Canada banned the use of hand-held cell phones
while driving in all provinces and territories (as of January 1, 2012). However, no jurisdiction in
Canada bans drivers from using hands-free cell phones while driving (Government of Alberta,
2010). Ishigami and Klein (2009) indicated that the danger associated with using hands-free cell
phones is as great as using hand-held ones, as studies across a wide range of driving behavior
show that talking on a cell phone, regardless of the phone type, results in difficulty in detecting
and identifying events (Amado & Ulupinar, 2005; Collet, Guillot, & Petit, 2010a, 2010b;
Ishigami & Klein, 2009; McEvoy et al., 2005; Törnros & Bolling, 2005) and causes driver
reaction time decrements (Caird et al., 2008; Hendrick & Switzer, 2007). Therefore, using a
hands-free cell phone can potentially result in drivers failing to notice pedestrians crossing
streets or missing traffic signals, resulting in critical accidents.
There is widespread agreement in research that using a cell phone while driving increases
the risk of an accident (Collet, Guillot, & Petit, 2010a, 2010b; McCartt, Hellinga, & Bratiman,
2006). Naturalistic studies found that talking on a cell phone increases the risk of collision by
over 30 percent (Wilson & Stimpson, 2010). In general, research has shown that drivers’ talking
on a hand-held or hands-free cell phone increased crash risk by about four times compared to the
drivers who were not using cell phones (Dragutinovic & Twisk 2005; McEvoy et al., 2005;
Redelmeier & Tibshirani, 1997). In contrast, Olson et al. (2009) found in a naturalistic study of
truck drivers that talking or listening to a hand-held phone was not related to increased risk, and
4
that talking or listening to a hands-free phone had a significant protective effect, i.e., decreasing
the risk of a safety-critical event (OR = 0.4).
Although a large majority of Canadians (66%) think that cell phone use while driving is a
road safety threat (Vanlaar et al., 2006), this risk perception may not always influence their
actual behavior. A large number of Canadians continue to use their cell phones while driving. A
2006 survey by the Traffic Injury Research Foundation found that 37 percent of drivers reported
using a cell phone while driving in the past week (Vanlaar et al., 2006). One explanation is that
the perception of the practical, social, and psychological benefits of using cell phones outweigh
the associated risks (Atchley, Atwood, & Boulton, 2011; Nelson, Atchley, & Little, 2009; Walsh
& White, 2006; White, Eiser, & Harris, 2004; White et al., 2007). For instance, Hafetz et al.
(2010) found that drivers’ perception of social benefits (e.g., “I would not be able to tell people
where I am or when I will arrive”) were associated with more frequent use of cell phones while
driving.
The 2007 Alberta Survey illustrated that about half of Albertans were using their cell
phone while driving, with men using more (58%) than women (42%) (see Nurullah, 2009).
According to the survey, 94 percent of Albertans (98% of women and 91% of men) thought it
was dangerous (43% saying very dangerous) to use a cell phone while driving. Moreover, 76
percent of Albertans generally held the belief that people should not be allowed to use cell
phones while driving; and 74 percent would support legislation that makes it illegal to use a cell
phone while driving (see Nurullah, 2009).

5
Similar to self-report surveys, studies based on direct observation report the use of cell
phones while driving in Canada. In an observational study, Burns, Lecuyer, and Chouinard
(2008) found that during 2006-2007, the use of cell phones while driving was the highest in
Alberta (10.7%, which was twice the national average), and the lowest in Nova Scotia (1.7%).
Another report based on observed driver cell phone use in Alberta showed that the rate of cell
phone use in light duty vehicles (e.g., passenger cars, pickup trucks, minivans and SUVs) was
10.7 percent in 2007, which has since declined to 0.9 percent in 2011 in both urban and rural
areas (Government of Alberta, 2012). It should be noted, however, that observational studies are
limited to the ability of the observer to detect the actual use (e.g., talking or texting) of cell
phones while driving at the moment of observation, and detection can be even harder for the use
of hands-free devices. As such, observational studies generally report lower incidences of cell
phone use while driving compared to self-report surveys.
The aim of this paper is to explore the current situation and prevalence of cell phone use
while driving in Alberta. Using self-reported survey data, this study intends to answer the
following questions:
1. What is the current state of (both hand-held and hands-free) cell phone use while driving
in Alberta?
2. Among those who use cell phones, what are the strategies to respond to calls on a cell
phone while driving?
3. What do Albertans think about the dangers of (both hand-held and hands-free) cell phone
use while driving?

6
4. To what extent do demographic factors (gender, age, income etc.) predict the use of cell
phones while operating a vehicle?
2. Methodology
The data set utilized for this analysis is the 2011 Alberta Survey administered by the
Population Research Laboratory (PRL) at the University of Alberta. The Alberta Survey is an
annual telephone survey of households across the province that allows academics, governments,
and non-profit organizations to develop questions for the survey instrument. The following
section of this paper outlines the data set and sampling design, general data collection
procedures, and a description of the variables and data analyses.
2.1. Data Set and Sampling Design
The 2011 Alberta Survey has a sample size of 1,203 households across Alberta, with 401
respondents in Edmonton, 400 in Calgary, and 402 from the remaining areas of the province. The
population targeted for the survey was individuals 18 years of age and older who lived in a
dwelling reached through direct dialing. The PRL implemented the Random-Digit Dialing
(RDD) method to ensure systematic selection of participants. A quota sampling design produced
an equal gender distribution in each of the three regions sampled. The PRL publishes the 2011
Alberta Survey data on their website for public usage (Population Research Laboratory, 2011).
Table 1 presents the demographic characteristics of the survey sample used for our analysis of
cell phone use while driving.

7
[Table 1 about here]
2.2. Data Collection
The PRL collected data between May 25, 2011 and June 22, 2011 using computer-
assisted telephone interviewing (CATI) technology. The survey questions were approved by the
university’s Research Ethics Board to ensure suitability for administration to the public.
Informed consent was obtained from participants, participation was voluntary, and
confidentiality of responses was maintained. Supervisors monitored the data collection process,
validated data, and developed progress reports. Ten percent of the respondents were randomly
selected and re-contacted by the supervisors to validate the initial results (n=120). On average,
3.3 call attempts were required to finish an interview, and 85 percent of completed interviews
were made in five attempts. The overall response rate was 26.1 percent. Sampling error for the
2011 Alberta Survey for 1,203 households at the 95% level of confidence was ±2.8 percentage
points.
2.3. Survey Instruments
Cell phone use and driving. The dependent variable measured the specific use of cell phone
devices while driving. We examined this phenomenon by asking, “Do you talk on a cell phone
while operating a vehicle, which may include talking while moving, or stopping at a red light?”
The following questions applied only to the respondents who used a cell phone while driving.
We asked the respondents, “Do you use a hands-free device when talking on a cell phone while
operating a vehicle?” Both of these questions were measured on a dichotomous ‘yes’ and ‘no’
scale, and the respondents were asked to base their answers on cell phone usage within the past

8
12 months. The frequency of cell phone use was measured by asking, “In a typical day, how
often do you talk on your cell phone while driving? Is it...” with response categories ranging
from 1 ‘never’ to 5 ‘all the time’. The purpose of talking was measured by asking, “In general,
how often do you talk on your cell phone while operating a vehicle for personal and for
work/business purposes? Is it...” with five response categories – ‘always for business purposes’,
‘mostly for business purposes’, ‘both for business and personal purposes’, ‘mostly for personal
purposes’, and ‘always for personal purposes’. Finally, strategies to respond to calls were
measured by asking, “How do you usually respond to calls on your cell phone while driving?”
with five options: ‘I answer the call right away while driving’, ‘I pull over to answer the call
right away’, ‘I answer the call when I feel it is safe to do so’, ‘I let the call go to voice mail’, and
‘I leave my phone off while driving’.
Collision involvement. Involvement in accidents was measured with a single item on a
dichotomous ‘yes’ and ‘no’ scale. We asked the respondents, “In the past 12 months, have you
had an accident or been close to having an accident when you were talking on your cell phone
while driving?” This question applied only to the respondents who used a cell phone while
driving.
Risk perception. We asked all of the respondents about their perceptions of dangers associated
with using cell phones while operating a vehicle. They responded to agreeing or disagreeing (1=
‘strongly disagree’ and 5= ‘strongly agree’) with the following statements: “Using a hands-free
device is safer than using a hand-held cell phone while driving,” “It is dangerous to write and
send text messages on a cell phone while driving,” “People who talk on a cell phone while

9
driving are more likely than others to be in a collision,” and “Using a cell phone while driving is
as dangerous as driving while under the influence of alcohol.”
2.4. Analysis
Data were analyzed using IBM SPSS® 18.0 for Windows® and included computation of
percentages, cross-tabulations, χ2-test, and logistic regression analyses. The sample was weighted
in the analyses making it representative of the population surveyed. Block-wise logistic
regression analyses (Peng, Lee, & Ingersoll, 2002) were conducted [since the outcome variable
represents dichotomous response categories (yes and no)] to evaluate the factors that predict
distracted driving. Odds ratios with 95% confidence intervals (95% CI) were used as summary
statistics. Nagelkerke R2 was used to estimate the variance explained by the model. All reported p
values were two-sided; and p < .05 was considered significant.
3. Results
3.1. Cell Phone Use and Driving
Table 2 illustrates the self-reported behaviors and perceptions of cell phone use while
driving among Albertans in 2011. About one half (52%) of the respondents indicated they used
their cell phones while driving in the past 12 months, and 37.8 percent did not. Additional
questions about distracted driving behavior focused upon the sample of respondents who did use
their cell phones while driving. For the 622 respondents who used a cell phone while driving, we
asked about hands-free devices, the frequency of cell phone use, the purpose of using cell phones
while driving, their strategies to respond to calls, and their involvement in automobile accidents

10
while using cell phones. Approximately one half (45.1%) of the respondents said they used
hands-free devices while operating a vehicle, while 54.9 percent said they did not. With regard to
the frequency of cell phone use while driving, 23.0 percent of the respondents reported using a
cell phone ‘sometimes’ and 11.4 percent used it ‘very often’.
[Table 2 about here]
We asked the respondents about their purpose of talking on a cell phone while operating
a vehicle. A majority of the respondents (50.6%) used a cell phone for personal purposes, while
19.5 percent of them used it for business purposes, and 30.0 percent of them used it for both
business and personal purposes. Regarding the strategies for responding to calls on a cell phone,
the majority of respondents (57.7%) indicated that they answered the call when they felt it was
safe to do so, 20.9 percent of them answered the call right away while driving, 13.9 percent of
them let the call go to voice mail, 5.9 percent of them pulled over the vehicle to answer the call,
and only 1.9 percent left their phone off while driving. Most of the respondents (92.4%)
mentioned that they were not involved in an accident when talking on a cell phone in the past 12
months, while 7.6 percent of them reported that they were.
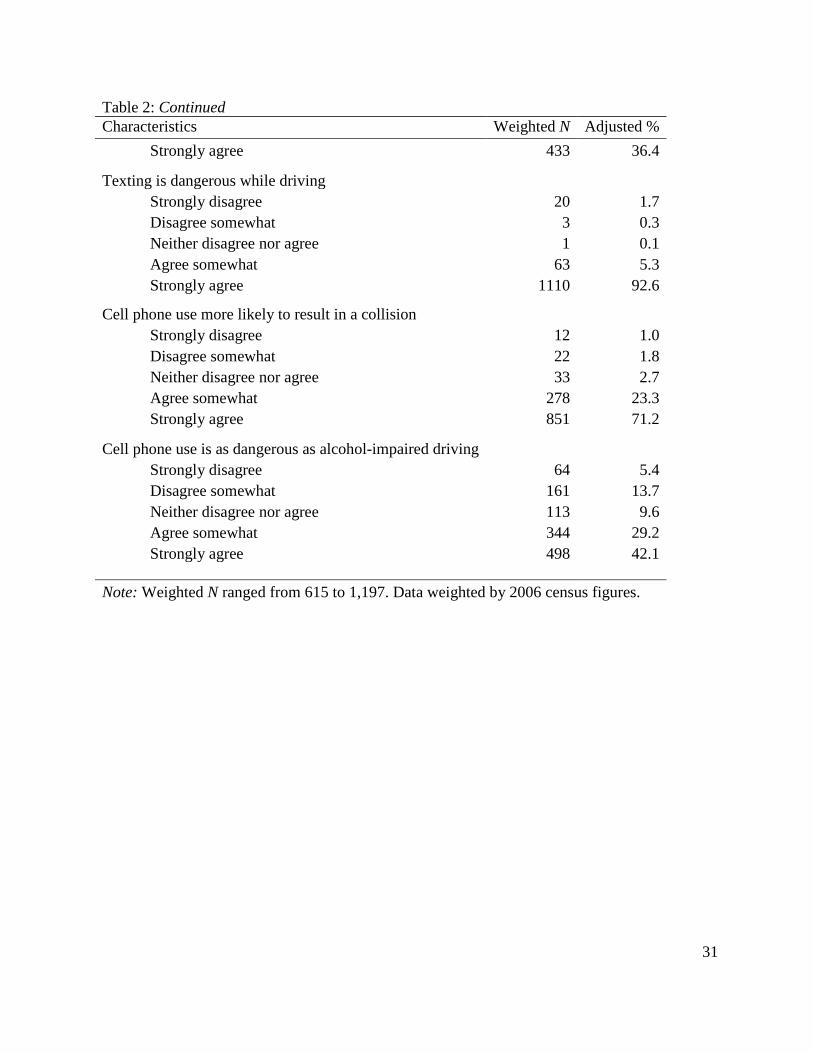
3.2. Public Perceptions of Danger
Several statements examined general perceptions regarding the dangers of cell phone
usage while operating a motor vehicle. These are presented in the last section of Table 2. All of
the participants responded to these statements regardless of whether they used a cell phone while
driving or not. The data indicated that, overall, respondents were cognizant of the risks related to

11
the use of cell phones while driving. Texting while driving illustrated the strongest awareness of
risk, with 92.6 percent of participants stating that they strongly agreed with the statement, “It is
dangerous to write and send text messages on a cell phone while driving.” Moreover, when
asked if cell phone use was likely to result in a collision, 71.2 percent of respondents stated that
they ‘strongly’ agreed, and 23.3 percent reported that they agreed ‘somewhat’. In response to the
statement, “Using a cell phone while driving is as dangerous as driving while under the influence
of alcohol,” 42.1 percent ‘strongly’ agreed and 29.2 percent agreed ‘somewhat’ that the danger
of these driving impairments carry equivalent risk. Finally, a large majority of the respondents
(68.4%) agreed (‘somewhat’ or ‘strongly’) that a hands-free device is safer than a hand-held cell
phone while driving; however, 22 percent disagreed with the statement.
In order to differentiate the perceptions of danger between the respondents who used cell
phones while driving and those who did not, we used cross-tabulations. Results indicated that
statistically significant differences existed between these two groups in their perceptions of
dangers associated with cell phone use while driving. The respondents who talked on a cell
phone were more likely than those who did not talk on a cell phone to perceive hands-free device
as safer and texting while driving as dangerous, but were less likely to think that using cell
phones would result in collisions. They were also less likely to think that using a cell phone
while driving is as dangerous as alcohol-impaired driving. See Table 3 for details on those
differences.
[Table 3 about here]
12
3.3. Socio-demographic Differences
Table 4 portrays the rates of cell phone usage while driving cross-tabulated with the
demographic characteristics of the sample. Statistically significant results indicated that gender
differences existed, with males being 9.0% more likely than females to use their cell phones
while driving. Additionally, younger age groups including those between 35-44 reported the
highest percentages (74.9%) of cell phone use while driving. Respondents over the age of 65 had
the lowest percentage of cell phone use while driving at 28.9 percent. Married and cohabiting
participants (62.2%) reported a higher rate of phone use while driving when compared to those
who were single (47.4%).
Respondents with completed post-secondary credentials were 23.2% more likely than
those with less than a high school education to use cell phones. Finally, other characteristics to
note were that higher income groups (those with a household income of $100,000 to $150,000+)
reported greater rates (71.2%) of cell phone use, employed (full-time and part-time) individuals
reported greater rates (66.5%) of cell phone use, home owners were 15.8% more likely than
renters to use cell phones, and Canadian born respondents were 10.3% more likely than
immigrants to use cell phones while driving. However, respondents’ religious status and location
of residence (urban or rural areas) did not result in statistically significant differences.
[Table 4 about here]

13
3.4. Predictors of Cell Phone Use while Driving
In order to assess the predictors of cell phone use while operating a vehicle in Alberta, we
conducted logistic regression analysis. Listwise deletion removed missing cases, resulting in a
slightly smaller sample size. Demographic questions included in our analysis were measures of
gender, age, marital status, educational attainment, employment status, annual household
income, religious belief, home ownership, rural or urban location, and immigrant status. The
measurement of gender (male=1, female=0), marital status (married/cohabiting=1, single=0),
employment (employed=1, unemployed=0), religious belief (not religious=1, religious=0), home
ownership (own=1, rent=0), rural or urban location (urban=1, rural=0), and immigrant status
(Canadian born=1, immigrant=0) were dummy coded to facilitate their inclusion into the logistic
regression. The age of respondents was included as a continuous measure, while education (less
than high school, completed high school, some post-secondary, and completed post-secondary)
and annual household income (< $30,000, $30,000-$59,999, $60,000-$99,999, and $100,000-
$150,000+) were coded into four categories. Risk perception was a continuous measure of
combined scores of the four items assessing the perception of dangers or risks associated with
the use of cell phones while driving.
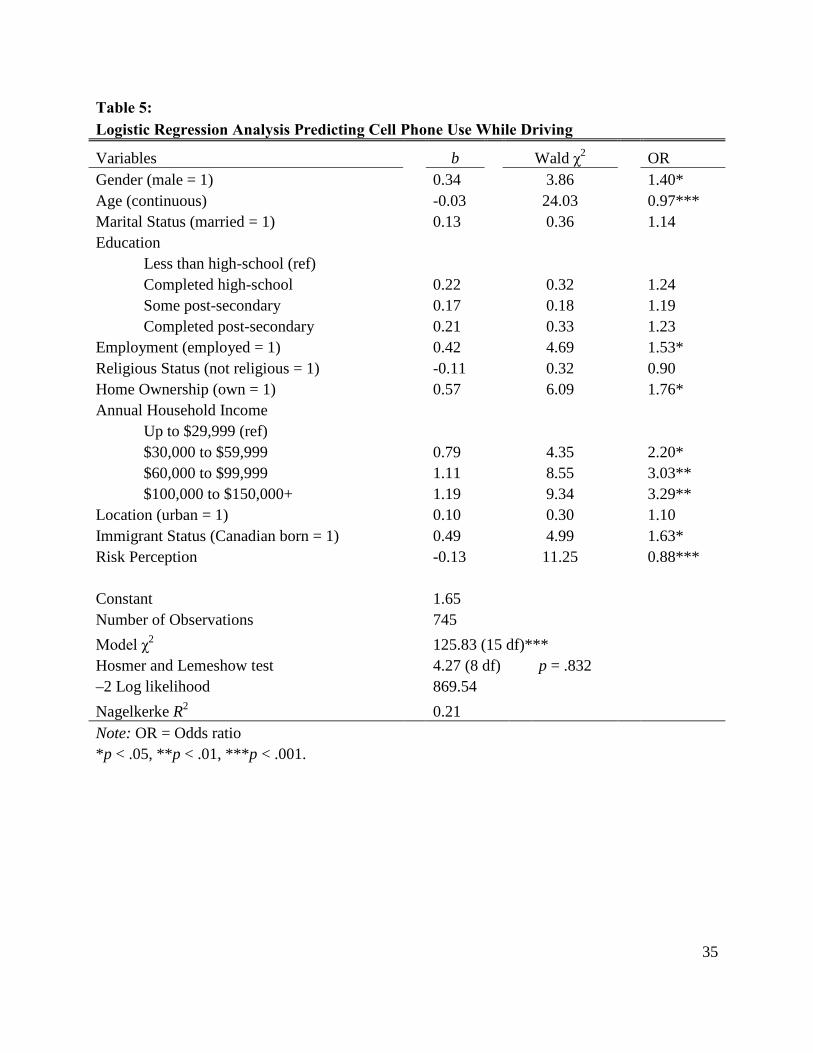
Table 5 illustrates the logistic regression model predicting the use of cell phones while
driving. For the logistic regression model, the Hosmer and Lemeshow test was not significant (p
> .05), indicating good fit of the model (Hosmer & Lemeshow, 2000). The chi-square statistic
for the model was significant (χ2 = 125.83 (15 df), p < .001), and explained approximately 21%
of the variance in cell phone use while driving (Nagelkerke R2 = .21). Odds ratios indicated the
influence of the independent variables on the dependent variable.

14
[Table 5 about here]
Table 5 shows that gender was a statistically significant predictor of cell phone usage
while driving with an odds ratio of 1.40 (p < .05), indicating males were more likely than
females to use their cell phones while operating a motor vehicle. Age had a negative relationship
with cell phone use while driving (odds ratio = 0.97, p < .001), as younger respondents were
more likely than older ones to use cell phones while driving. Employed respondents were 1.53
times (p < .05) more likely to use their cell phone than those who were unemployed. Home
owners were 1.76 times (p < .05) more likely to use their cells phones while driving than those
who were renting. Individuals reporting an annual household income up to $29,999 were used as
the reference category. As household income increased to $30,000-$59,999, respondents were
2.20 times (p < .05) more likely to use their cells phones while driving compared to the reference
category. The respondents who had an annual household income of $60,000 to $99,999 were
3.03 times (p < .01) more likely, and those who had a household income of over $100,000 per
year were 3.29 times (p < .01) more likely to use their cell phones while driving compared to the
reference category. These results indicated that participants in the higher annual income brackets
were much more likely to participate in distracted driving behavior involving cell phone usage.
In addition, immigrant status also had a statistically significant result, with Canadian-born
participants being 1.63 times (p < .05) more likely than immigrants to use their cell phones while
driving.
15
Finally, risk perception was negatively associated with the use of cell phones while
driving (odds ratio = 0.88, p < .001). This indicates that the more the participants were aware of
the dangers involving cell phone use while driving, the less likely they would do so. Since male
and younger participants were more likely to use cell phones while driving, we tested the
interaction effect between age and gender in a separate model (not shown here). However, the
interaction was not significant, and the χ2 value (block χ2 = 1.59 (1 df), p = .209) and the amount
of variance explained (Nagelkerke R2 = .21) did not significantly differ from that of our initial
model. Finally, marital status, educational credentials, religious status, and rural or urban
location did not significantly predict the use of cell phones while driving.
4. Discussion
The aim of this paper was to explore the self-reported prevalence of using cell phones
while driving for a sample of Albertans. The results showed that despite perceiving the dangers
associated with using a cell phone while operating a vehicle, a large number of participants
(52%) continued to engage in such behavior. This finding is consistent with other studies
conducted in Canada and elsewhere (Beck, Yan, & Wang, 2007; Braitman & McCartt, 2010;
Gras et al., 2007; Hafetz et al. 2010; Hallett, Lambert, & Regan, 2011; Marcoux, Vanlaar, &
Robertson, 2012; Tison, Chaudhary, & Cosgrove, 2011; White et al., 2010; Young & Lenné,
2010). For instance, a recent report from the U.S. National Highway Traffic Safety
Administration (NHTSA) showed that 41 percent of all drivers reported talking on their cell
phones while driving (Tison, Chaudhary, & Cosgrove, 2011). Similarly, Beck, Yan, and Wang
(2007) found that 46.7 percent, and Braitman and McCartt (2010) found that 40 percent of

16
drivers in the U.S. reported using their cell phones while operating a vehicle. In addition, an
Australian study reported that 43 percent of drivers use hands-free or hand-held cell phones
while driving (White et al., 2010). However, a few other studies reported a slightly higher
percentage of cell phone use while driving. For instance, a New Zealand study (Hallett, Lambert,
& Regan, 2011) found that 60 percent, an Australian study (Young & Lenné, 2010) found 59
percent, and a Spanish study (Gras et al., 2007) found 60.1 percent of the respondents reported
using their cell phones while driving to make/answer calls or send text messages. Finally, in a
survey of Canadian drivers, Marcoux, Vanlaar, and Robertson (2012) found that 36.3 percent of
the respondents reported using a cell phone while driving during the past seven days in 2011. In
summary, results from many studies across the world reflect the fact that the use of cell phones
while operating a vehicle remains quite high despite legislative efforts to limit and reduce such
behavior.
Research has shown that many drivers either underestimate the dangers associated with
cell phone use while driving (Hallett, Lambert, & Regan, 2011; White, Eiser, & Harris, 2004), or
continue to drive while using their cell phones even when they are cognizant of the risks (Ivers et
al. 2009; Nelson, Atchley, & Little, 2009). This raises the question as to why do people use their
cell phones while driving when they are aware of the perceived dangers? It could be that the
perceived practical, social, and psychological benefits outweigh the dangers associated with the
use of cell phones while driving (Atchley et al., 2011; Nelson, Atchley, & Little, 2009; Walsh &
White, 2006; White, Eiser, & Harris, 2004; White et al., 2007). The social expectation to return
calls immediately is another likely factor that influences talking on a cell phone while driving
(see Hafetz et al. 2010). Studies also indicated that social approval from close others (e.g.,

17
friends, family) resulted in the usage of cell phones while driving (Nemme & White, 2010;
Walsh et al., 2008). Finally, Zhao et al. (2012) suggested that it may be drivers’ personality traits
(e.g., attitude and behavior) and susceptibility to risk taking while driving rather than the use of
cell phones per se that influences their engagement in risky driving behaviors. This is because
those who used their cell phones more frequently in the past were more likely to engage in risky
driving behaviors compared to those who used it rarely or not at all, even when they were not
using their cell phones at the time of actual highway driving performance (Zhao et al., 2012).
Further research should investigate this phenomenon.
It was no surprise to find that almost one half of respondents reported using hands-free
devices while driving, given that a majority (76.7 percent of cell phone users) either ‘strongly’ or
‘somewhat’ agreed that hands-free devices are safer while operating a vehicle. In addition, those
who did not use a cell phone while driving also considered hands-free devices to be safer than
hand-held phones. In a study conducted in Jordan, Ismeik and Al‐Kaisy (2010) found that 71.8
percent of cell phone users and 51.7 percent of non-users believed that using a hands-free device
was safer than using a hand-held cell phone. Previous studies conducted in Spain and New
Zealand, however, reported less use of hands-free devices (Gras et al., 2007; Hallett, Lambert, &
Regan, 2011; Sullman & Baas, 2004). It may be that because in many countries where the law
bans the use of hand-held cell phones, people now use hands-free devices more while talking on
their cell phones. Past research, on the other hand, suggested that hands-free devices are no safer
than hand-held cell phones (Amado & Ulupinar, 2005; Caird et al., 2008; Hendrick & Switzer,
2007; Ishigami & Klein, 2009; McEvoy et al., 2005; Törnros & Bolling, 2005). As such,

18
people’s perception that hands-free devices are safer than hand-held ones may be largely
overrated.
In terms of strategies to respond to calls, a considerable proportion of people (57.7%)
reported answering calls on a cell phone when it was safe to do so. About one-fifth of the
respondents, however, reported answering calls right away while operating a vehicle. This
indicates that drivers in Alberta often engage in risky behavior by answering calls right away.
Nevertheless, the proportion of respondents reporting being involved in an accident was low
(7.6%), but quite similar (6%) to that of the U.S. NHTSA report (Tison, Chaudhary, & Cosgrove,
2011). It may be because a great number of respondents (60.1%) in our study reported ‘seldom’
using their cell phones while driving. Prior research suggested that the frequency of cell phone
use while driving is associated with risk outcomes (Pöysti, Rajalin, & Summala, 2005; Zhao et
al., 2012). In a recent study, Zhao et al. (2012) found that frequent users of cell phones
demonstrated more aggressive and risky driving behavior (e.g., speeding, traffic rule violations,
etc.). Furthermore, Pöysti, Rajalin, and Summala (2005) reported that safety oriented drivers
were less frequent users of cell phones while operating a vehicle.
Similar to previous research (e.g., Nemme & White, 2010; Reed & Robbins, 2008; Zhou
et al., 2009), our findings showed that writing and sending text messages on a cell phone while
driving were considered very dangerous by both those who used a cell phone while operating a
vehicle and those who did not use a cell phone. Both of these two groups also agreed that cell
phone use while driving can be as dangerous as driving while intoxicated, and that using a cell
phone creates a higher risk of collision. Past research supports these findings (McCartt et al.,

19
2006; McEvoy et al., 2005; Redelmeier & Tibshirani, 1997; Strayer et al., 2006; White et al.,
2010; Wilson & Stimpson, 2010).
Our results indicated that gender differences existed, such that males were more likely
than females to report using a cell phone while driving. Similar findings were reported in
previous studies (e.g., Hallett, Lambert, & Regan, 2011; Ivers et al. 2009; Sullman & Baas,
2004; Zhou et al., 2009). Because males are more likely to engage in risky driving behaviors
compared to females (Ivers et al. 2009), we suspected that our results would reflect such
behavior. Our findings also indicated that young adults and the middle-age group were more
likely than older people to use a cell phone while operating a vehicle. Past research also showed
that younger drivers were more likely to use their cell phones while driving (e.g., Harrison, 2011;
Hosking, Young, & Regan, 2009; Walsh et al., 2008; Zhou et al., 2009).
A limitation of the current study is that the findings are based on self-reported survey
instead of an actual on-road observation of cell phone use while driving. As such, it is unknown
as to the extent to which this retrospective self-reported behavior corresponds to actual driving
behaviors. It should also be noted that at the time of conducting the survey, the ban on cell phone
use while driving had not come into effect in Alberta. Because the ban came into effect (on
September 1, 2011) after the data for this study were collected, we could not measure the
immediate effect of the ban on people’s use of cell phones while operating a vehicle. Previous
research suggested that although effective enforcement of the ban on cell phone use produces
reductions in the use of cell phones in the long-term (McCartt & Hellinga, 2007; McCartt et al.,
2010), such ban has little effect on decreasing overall collision rates (Nikolaev, Robbins, &
20
Jacobson, 2010; Zhao et al., 2012). Clearly, further research is needed to examine the short-term
as well as long-term reductions in the usage of cell phones while driving in Alberta following the
enforcement of the Distracted Driving legislation that came into effect in September of 2011
(Government of Alberta, 2011).
21
Acknowledgements
This research was supported by a REID (Research and Education on Impaired Driving) grant
provided through the Department of Sociology at the University of Alberta. An earlier version of
this article was presented at the Canadian Sociological Association Annual Meeting, Waterloo,
Ontario, 29 May–02 June 2012. The authors thank Herb Northcott and Manoj Misra for their
helpful comments on an earlier version of this article.

22
References
Amado, S., & Ulupinar, P. (2005). The effects of conversation on attention and peripheral
detection: Is talking with a passenger and talking on the cell phone different?
Transportation Research Part F: Traffic Psychology and Behaviour, 8, 383–395.
Atchley, P., Atwood, S., & Boulton, A. (2011). The choice to text and drive in younger drivers:
Behavior may shape attitude. Accident Analysis and Prevention, 43(1), 134–142.
Beck, K. H., Yan, F., & Wang, M. Q. (2007). Cell phone users, reported crash risk, unsafe
driving behaviors and dispositions: A survey of motorists in Maryland. Journal of Safety
Research, 38(6), 683–688.
Braitman, K. A., & McCartt, A. T. (2010). National reported patterns of driver cell phone use in
the United States. Traffic Injury Prevention, 11(6), 543–548.
Burns, P., Lécuyer, J., & Chouinard, A. (2008). Observed driver phone use rates in Canada.
Proceedings of the 18th Canadian Multidisciplinary Road Safety Conference, Whistler,
British Columbia, June 8-11, 2008, pp. 1-10.
Caird, J. K., Willness, C. R., Steel, P., & Scialfa, C. (2008). A meta-analysis of the effects of cell
phones on driver performance. Accident Analysis and Prevention, 40(4), 1282–1293.
Collet, C., Guillot, A., & Petit, C. (2010a). Phoning while driving I: A review of
epidemiological, psychological, behavioural and physiological studies. Ergonomics,
53(5), 589-601.
Collet, C., Guillot, A., & Petit, C. (2010b). Phoning while driving II: A review of driving
conditions influence. Ergonomics, 53(5), 602-616.
Dragutinovic, N., & Twisk, D. (2005) Use of mobile phones while driving effects on road safety:
A literature review. Leidschendam, the Netherlands: Institute for Road Safety Research.
Government of Alberta. (2012, February). Cell phone use in light duty vehicles. Retrieved March
28, 2012, from

23
http://www.transportation.alberta.ca/Content/docType48/Production/AlbertaCellPhoneUs
eRateGraph20072011.pdf
Government of Alberta. (2011, August 25). Distracted Driving Legislation: Highlights. Retrieved
March 28, 2012, from
http://www.transportation.alberta.ca/Content/docType3679/Production/FactSheet.pdf
Government of Alberta. (2010, November18). Bill 16 - Distracted Driving Legislation. Retrieved
March 23, 2011, from http://www.transportation.alberta.ca/distracteddriving.htm
Gras, M. E., Cunill, M., Sullman, M., Planes, M., Aymerich, M., & Font-Mayolas, S. (2007).
Mobile phone use while driving in a sample of Spanish university workers. Accident
Analysis and Prevention, 39(2), 347–355.
Hafetz, J. S., Jacobsohn, L. S., Garcia-Espana, J. F., Curry, A. E., & Winston, F. K. (2010).
Adolescent drivers’ perceptions of the advantages and disadvantages of abstention from
in-vehicle cell phone use. Accident Analysis and Prevention, 42(6), 1570–1576.
Hallett, C., Lambert, A., & Regan, M. A. (2011). Cell phone conversing while driving in New
Zealand: Prevalence, risk perception and legislation. Accident Analysis and Prevention,
43(3), 862–869.
Harrison, M. A. (2011). College students’ prevalence and perceptions of text messaging while
driving. Accident Analysis and Prevention, 43(4), 1516–1520.
Hendrick, J. L., & Switzer, J. R. (2007). Hands-free versus hand-held cell phone conversation on
a braking response by young drivers. Perceptual and Motor Skills, 105(2), 514–522.
Hosking, S., Young, K., & Regan, M. (2009). The effects of text messaging on young drivers.
Human Factors, 51(4), 582–592.
Hosmer, D. W., & Lemeshow, S. (2000). Applied logistic regression. New York, NY: Wiley.
Ishigami, Y., & Klein, R. M. (2009). Is a hands-free phone safer than a handheld phone? Journal
of Safety Research, 40(2), 157-164.

24
Ismeik, M., & Al‐Kaisy, A. (2010). Characterization of cell phone use while driving in Jordan.
Transport, 25(3), 252–261.
Ivers, R., Senserrick, T., Boufous, S., Stevenson, M., Chen, H., Woodward, M., et al. (2009).
Novice drivers’ risky driving behavior, risk perception, and crash risk: Findings from the
DRIVE study. American Journal of Public Health, 99(9), 1638-1644.
Marcoux, K. D., Vanlaar, W., Robertson, R. D. (2012). The road safety monitor 2011:
Distracted driving trends. Ottawa: Traffic Injury Research Foundation.
McEvoy, S. P., Stevenson, M. R., McCartt, A. T., Woodward, M., Haworth, C., Palamara, P., &
Cercarelli, R. (2005). Role of mobile phones in motor vehicle crashes resulting in
hospital attendance: A case-crossover study. British Medical Journal, 331(7514), 428-
432.
McCartt, A. T., Hellinga, L. A., Strouse, L. M., & Farmer, C. M. (2010). Long-term effects of
handheld cell phone laws on driver handheld cell phone use. Traffic Injury Prevention,
11(2), 133–141.
McCartt, A. T., & Hellinga, L. A. (2007). Longer term effects of Washington DC, law on
drivers’ hand-held phones. Traffic Injury and Prevention, 8(2), 199–204.
McCartt, A. T., Hellinga, L. A., & Bratiman, K. A. (2006). Cell phones and driving: Review of
research. Traffic Injury Prevention, 7(2), 89-106.
Nelson, E., Atchley, P., & Little, T. D. (2009). The effects of perception and risk of answering
and initiating a cellular phone call while driving. Accident Analysis and Prevention,
41(3), 438–444.
Nemme, H., & White, K. (2010). Texting while driving: Psychosocial influences on young
people’s texting intentions and behavior. Accident Analysis and Prevention, 42(4), 1257-
1265.
25
Nikolaev, A. G., Robbins, M. J., & Jacobson, S. H. (2010). Evaluating the impact of legislation
prohibiting hand-held cell phone use while driving. Transportation Research Part A:
Policy and Practice, 44(3), pp. 182–193.
Nurullah, A. S. (2009). The prevalence of cell phone use while driving in Alberta: Results from
2007 annual Alberta survey. Paper presented at the W. David Pierce Research
Colloquium. Edmonton, AB: University of Alberta, 07 November 2009.
Olson, R. L., Hanowski, R. J., Hickman, J. S., & Bocanegra, J. (2009). Driver distraction in
commercial vehicle operations (Report No. FMCSA-RRR-09-042). Washington, DC:
USDOT, FMCSA.
Peng, C. J., Lee, K. L., & Ingersoll, G. M. (2002). An introduction to logistic regression analysis
and reporting. Journal of Educational Research, 96(1), 3-15.
Population Research Laboratory. (2011). The 2011 Alberta Survey. Retrieved December 23,
2012, from
http://www.prl.ualberta.ca/en/AlbertaSurvey/PublicReleaseAlbertaSurveyDatasets2011.a
spx
Pöysti, L., Rajalin, S., & Summala, H. (2005). Factors influencing the use of cellular (mobile)
phone during driving and hazards while using it. Accident Analysis and Prevention,
37(1), 47–51.
Redelmeier, D. A., & Tibshirani, R. J. (1997). Association between cellular-telephone calls and
motor vehicle collisions. New England Journal of Medicine, 336(7), 453-458.
Reed, N., & Robbins, R. (2008). The effect of text messaging on driver behavior: A simulator
study. Berkshire (UK): Transport Research Laboratory.
Sullman, M. J. M., & Baas, P. H. (2004). Mobile phone use amongst New Zealand drivers.
Transportation Research Part F: Traffic Psychology and Behaviour, 7(2), 95–105.
Strayer, D. L., Drews, F. A., & Crouch, D. J. (2006). A comparison of the cell phone driver and
the drunk driver. Human Factors, 48(2), 381-391.

26
Tison, J., Chaudhary, N., & Cosgrove, L. (2011, December). National phone survey on
distracted driving attitudes and behaviors. (Report No. DOT HS 811555). Washington,
DC: National Highway Traffic Safety Administration.
Törnros, J. E. B., & Bolling, A. K. (2005). Mobile phone use – effects of handheld and handsfree
phones on driving performance. Accident Analysis and Prevention, 37(5), 902–909.
Vanlaar, W., Simpson, H. M., Mayhew, D., & Robertson, R. (2006). The road safety monitor:
Distracted driving. Ottawa: Traffic Injury Research Foundation.
Walsh, S. P., White, K. M., Hyde, K. M., & Watson, B. (2008). Dialing and driving: Factors
influence intentions to use a mobile phone while driving. Accident Analysis and
Prevention, 40(6), 1893–1900.
Walsh, S. P., & White, K. M. (2006). Ring, ring, why did I make that call? Beliefs underlying
Australian university students’ mobile phone use. Youth Studies Australia, 25(3), 49-57.
White, K. M., Hyde, M. K., Walsh, S. P., & Watson, B. (2010). Mobile phone use while driving:
An investigation of the beliefs influencing drivers’ hands-free and handheld mobile
phone use. Transportation Research Part F: Traffic Psychology and Behaviour, 13, 9-20.
White, M. P., Eiser, J. R., Harris, P. R., & Pahl, S. (2007). Who reaps the benefits, who bears the
risks? Comparative optimism, comparative utility, and regulatory preferences for mobile
phone technology. Risk Analysis, 27, 741–753.
White, M. P., Eiser, J. R., & Harris, P. R. (2004). Risk perceptions of mobile phone use while
driving. Risk Analysis, 24, 323–334.
Wilson, F., & Stimpson, J. (2010). Trends in fatalities from distracted driving in the United
States, 1999 to 2008. American Journal of Public Health, 100(11), 2213-2219.
Young, K. L., & Lenné, M. G. (2010). Driver engagement in distracting activities and the
strategies used to minimise risk. Safety Science, 48(3), 326–332.

27
Zhao, N., Reimer, B., Mehler, B., D’Ambrosio, L. A., & Coughlin, J. F. (2012, in press). Self-
reported and observed risky driving behaviors among frequent and infrequent cell phone
users. Accident Analysis and Prevention. doi:10.1016/j.aap.2012.07.019
Zhou, R., Wu, C., Rau, P.-L. P, & Zhang, W. (2009). Young driving learners’ intention to use a
handheld or hands-free mobile phone while driving. Transportation Research Part F:
Traffic Psychology and Behaviour, 12, 208–217.

28
Table 1: Sample Characteristics from the 2011 Alberta Survey
Characteristics N Weighted % Adjusted % Gender
Male 600 49.9 49.8 Female 603 50.1 50.2
Age 18-24 66 5.5 5.6
25-34 159 13.2 13.6 35-44 213 17.7 18.2 45-54 244 20.3 20.9 55-64 260 21.6 22.3 65+ 227 18.9 19.4 Missing 33 2.8
Mean = 50.13, SD = 15.90
Marital Status Never married 181 15.0 15.1
Married/ Cohabiting 830 69.0 69.1 Divorced/ Widowed/ Separated 189 15.7 15.8 Missing 3 0.3
Education
Less than high-school 99 8.3 8.3 Completed high-school 223 18.5 18.5 Some post-secondary 161 13.4 13.4 Completed post-secondary 719 59.8 59.8
Employment Employed (full-time & part-time) 770 64.0 64.3
Not currently employed/Retired 428 35.6 35.7 Missing 5 0.4
Annual Household Income
Up to $29,999 84 7.0 9.5 $30,000 to $59,999 148 12.4 16.7 $60,000 to $99,999 238 19.8 26.8 $100,000 to $150,000+ 417 34.7 47.0 Missing 316 26.2

29
Table 1: Continued Characteristics N Weighted % Adjusted %
Religion No religion 300 25.0 26.5
Roman Catholic 265 22.0 23.4 Other Christian 494 41.1 43.6 Jews, Muslims, & others 73 6.1 6.4 Missing 71 5.9
Home Ownership
Own (self/ spouse/ parents) 969 80.5 81.2 Rent 224 18.7 18.8 Missing 10 0.8
Location
Urban area 792 65.8 65.8 Rural area 411 34.2 34.2
Immigrant Status Canadian born 979 81.4 81.4
Foreign born 224 18.6 18.6 Note: N = 1,203.

30
Table 2: Rates of and perceptions about cell phone use while driving
Characteristics Weighted N Adjusted % Cell phone use while driving
Yes 622 52.0 No 452 37.8 Don’t have a cell phone 66 5.5 Don’t drive 56 4.7
Hands-free device use while driving Yes 279 45.1
No 341 54.9
Frequency of using cell phones while driving Never 21 3.4
Seldom 373 60.1 Sometimes 143 23.0 Very often 71 11.4 All the time 13 2.1
Purpose of talking on a cell phone while driving Always for business purposes 20 3.3
Mostly for business purposes 99 16.2 Both for business and personal purposes 184 30.0 Mostly for personal purposes 140 22.7 Always for personal purposes 172 27.9
Strategies to respond to calls on a cell phone I answer the call right away while driving 129 20.9
I pull over to answer the call right away 36 5.9 I answer the call when I feel it is safe to do so 355 57.7 I let the call go to voice mail 85 13.9 I leave my phone off while driving 10 1.6
Involvement in an accident when talking on a cell phone Yes 47 7.6
No 574 92.4
Hands-free device is safer while driving Strongly disagree 139 11.7
Disagree somewhat 122 10.3 Neither disagree nor agree 114 9.6 Agree somewhat 381 32.0
31
Table 2: Continued Characteristics Weighted N Adjusted %
Strongly agree 433 36.4 Texting is dangerous while driving
Strongly disagree 20 1.7 Disagree somewhat 3 0.3 Neither disagree nor agree 1 0.1 Agree somewhat 63 5.3 Strongly agree 1110 92.6 Cell phone use more likely to result in a collision
Strongly disagree 12 1.0 Disagree somewhat 22 1.8 Neither disagree nor agree 33 2.7 Agree somewhat 278 23.3 Strongly agree 851 71.2
Cell phone use is as dangerous as alcohol-impaired driving Strongly disagree 64 5.4
Disagree somewhat 161 13.7 Neither disagree nor agree 113 9.6 Agree somewhat 344 29.2 Strongly agree 498 42.1 Note: Weighted N ranged from 615 to 1,197. Data weighted by 2006 census figures.

32
Table 3: Differences in perceptions of those who used cell phones while driving and those who did
not
Characteristics % Used % Didn’t χ2 (df) Hands-free device is safer while driving
Strongly disagree 5.0 17.2 Disagree somewhat 8.1 13.4 Neither disagree nor agree 10.2 8.7 Agree somewhat 33.8 31.3 Strongly agree 42.9 29.4 59.20 (4)***
Texting is dangerous while driving Strongly disagree 1.1 2.7
Disagree somewhat NA NA Neither disagree nor agree NA NA Agree somewhat 6.4 3.6 Strongly agree 92.3 93.3 11.13 (4)*
Cell phone use more likely to result in a collision Strongly disagree 1.0 1.3
Disagree somewhat 3.2 NA Neither disagree nor agree 4.8 NA Agree somewhat 31.6 12.9 Strongly agree 59.4 84.9 89.72 (4)***
It is as dangerous as alcohol-impaired driving Strongly disagree 8.5 2.0
Disagree somewhat 20.1 6.8 Neither disagree nor agree 13.3 4.3 Agree somewhat 30.3 28.5 Strongly agree 27.8 58.4 130.81 (4)***
Note: Weighted N ranged from 1,053 to 1,070. * p < .05, *** p < .001. NA = Less than 5 cases.

33
Table 4: Rates of cell phone use while driving by demographic characteristics
Characteristics % Yes % No χ2 (df) Gender
Male
62.4 37.6 Female
53.4 46.6 8.98 (1)**
Age 18-24
50.0 50.0 25-34
70.7 29.3
35-44
74.9 25.1 45-54
64.5 35.5
55-64
55.7 44.3 65+
28.9 71.1 104.18 (5)***
Marital Status Single
47.4 52.6 Married/ Cohabiting
62.2 37.8 19.65 (1)***
Education Less than high-school
38.3 61.7 Completed high-school
55.9 44.1
Some post-secondary
55.5 44.5 Completed post-secondary
61.5 38.5 16.99 (3)**
Employment Employed (full-time & part-time)
66.5 33.5 Not currently employed/Retired
40.8 59.2 64.20 (1) ***
Annual Household Income Up to $29,999
26.5 73.5 $30,000 to $59,999
48.1 51.9
$60,000 to $99,999
61.6 38.4 $100,000 to $150,000+
71.2 28.8 60.84 (3)***
Religious Status Not religious
61.3 38.7 Religious
56.4 43.6 1.92 (1)
Home Ownership Own (self/ spouse/ parents)
60.9 39.1 Rent
45.1 54.9 15.66 (1)***

34
Table 4: Continued Characteristics % Yes % No χ2 (df)
Location Urban area
59.5 40.5 Rural area
54.9 45.1 2.10 (1)
Immigrant Status Canadian born
59.8 40.2 Foreign born
49.5 50.5 6.98 (1)**
Note: Weighted N ranged from 816 to 1,073.
** p < .01, *** p < .001.
35
Table 5: Logistic Regression Analysis Predicting Cell Phone Use While Driving
Variables
b
Wald χ2
OR Gender (male = 1)
0.34
3.86
1.40*
Age (continuous)
-0.03
24.03
0.97*** Marital Status (married = 1)
0.13
0.36
1.14
Education Less than high-school (ref) Completed high-school
0.22
0.32
1.24 Some post-secondary
0.17
0.18
1.19
Completed post-secondary
0.21
0.33
1.23 Employment (employed = 1)
0.42
4.69
1.53*
Religious Status (not religious = 1)
-0.11
0.32
0.90 Home Ownership (own = 1)
0.57
6.09
1.76*
Annual Household Income Up to $29,999 (ref) $30,000 to $59,999
0.79
4.35
2.20* $60,000 to $99,999
1.11
8.55
3.03**
$100,000 to $150,000+
1.19
9.34
3.29** Location (urban = 1)
0.10
0.30
1.10
Immigrant Status (Canadian born = 1)
0.49
4.99
1.63* Risk Perception
-0.13
11.25
0.88***
Constant
1.65 Number of Observations
745
Model χ2
125.83 (15 df)*** Hosmer and Lemeshow test
4.27 (8 df) p = .832
–2 Log likelihood
869.54 Nagelkerke R2 0.21
Note: OR = Odds ratio *p < .05, **p < .01, ***p < .001.