THE PRACTICAL REALTIME & INSIGHT - …vantisgroup.com/pdf/Brochure_JENNIFER_4_EN.pdfIn Application...
8
Enterprise Application Performance Management REAL-TIME Application Monitoring Response Time Scatter Graph, “X-View” Enterprise Performance Management An Attractive Easy-Access Dashboard THE PRACTICAL REALTIME & INSIGHT
Transcript of THE PRACTICAL REALTIME & INSIGHT - …vantisgroup.com/pdf/Brochure_JENNIFER_4_EN.pdfIn Application...

Enterprise Application Performance Management
REAL-TIME Application MonitoringResponse Time Scatter Graph, “X-View”Enterprise Performance ManagementAn Attractive Easy-Access Dashboard
THE PRACTICALREALTIME & INSIGHT

JENNIFER Product Summary
Application Performance Management (APM)
Application Performance Management (APM) is a process of developing a progressive system that 1) effectively monitors the availability of enterprise applications, 2) identifies and resolves the application performance problems, and 3) predicts/prevents future application perfor-mance problems, considering the limit and potential of the resources available to an organization’s IT infrastructure and its supporting systems. Unlike the traditional system management (SMS, NMS), APM enhances the organization’s ability to manage the enterprise applica-tion services and resolve application performance problems, resulting in reduced Total Cost of Operation (TCO) and enhanced customer service.
JENNIFER
JENNIFER® is the Application Performance Management (APM) solution developed by JenniferSoft Inc. JENNIFER provides comprehensive application performance management and operational support services for enterprise web system, performing tasks such as real-time resource and service monitoring, immediate performance problem diagnosis, and effective performance problem resolution. We currently have more than 400 of enterprise JENNIFER users and expect the demand to grow significantly.
JENNIFER Key Features
Comprehensive Dashboard
Real-time Resource/Service Monitoring
Performance Problem Diagnosis and Resolution
Application Tracing and Tuning
Statistical Analysis and Reporting on the Performance Data
*Illustration of an Operation Center using JENNIFER.
Benefits

JENNIFER Control Dashboard
REALTIME & INSIGHT
JENNIFER enables users to intuitively analyze the perfor-mance of individual service transactions and all performance problems in real-time, and displays the data in its visually powerful dashboard to provide Insight into the system’s health.Each performance data displayed in JENNIFER dashboard is well-organized in relation to each another to maximize user’s ability to absorb the information and gain intuitive understanding and insight on the system status.
JENNIFER Competitive Advantage
Each detail in JENNIFER’s design was chosen with high consideration that they add intrinsic value to the user experience, whether it’s adding a new feature, choosing placement of a module, or selecting color of the graphics. Because of this attention-to-detail, JENNIFER is assessed to be the most practical APM solution available in the market.
REAL-TIME & INSIGHTFUL Performance MonitoringResponse time scatter graph (X-View)Integrated Enterprise Performance ManagementAn Attractive Easy-Access Dashboard
JENNIFER’s Unique Features
Dynamic Profiling ConfigurationDynamic StackTrace CapabilityActive Profiling CapabilityMonitoring and Management per DomainExtended Monitoring AdaptorReal-Time Combined Log Monitoring
JENNIFER’s Unique Features
Performance Problem DiagnosisRoot Cause AnalysisResponse Time Scatter Graph (X-VIEW)Individual Transaction ProfilingExternal Resource Monitoring (CTG, Jolt, WebT, WTC) Application / SQL TuningMemory Leak Detection and TrackingApplication Error Detection and AnalysisPeak Service Load Control Capability (PLC)User Customizable Dashboard (Drag & Drop Feature)System/Java Application Server Resource MonitoringUser customizable reporting system with templates

JENNIFER Dynamic Monitoring
In Application Performance Management, the concept of enterprise performance monitoring is classified into two parts: Service Monitoring and Resource Monitoring.
Service Monitoring
When monitoring the status of the application services, it is import to retrieve the performance data in real-time and grasp the mutual relationship between each service transactions. A delay in transaction response time may have originated from not just that transaction but from a combination of all transaction’s resource bottleneck. JENNIFER provides following features in service monitoring.
Real-time Active Service Monitoring
JENNIFER illustrates active service runtime in different colors and displays it via the equalizer graph in real time.
JENNIFER transmits the performance data through reverse-direction protocol that connects from JENNIFER Server to JENNI-FER Agent whenever user requests for the data. Using this method, JENNIFER can extract the snapshot information of the running active services. Active service data shown in JENNIFER is not a summarized data of events that occurred in the past but the real-time data concerning active services.
Concurrent UserActive ServiceTPS, Arrival and Service RateReal-Time Transaction Response TimeApplication Naming Dynamic SubstitutionSQL Tracing (Including BIND Variable)Transaction Profiling (Class/Method Level)HTTP POST Request KEY/VALUE Tracking
Resource Monitoring
Resource monitoring includes managing the physical and logical resources used in running an application service. JENNIFER provides following features in resource monitoring.
Performance Data Analysis
The performance problem in a web system can be categorized into two types: 1) conditional performance problems caused by anomalous circumstances or 2) relative performance problems caused by an increase in load and throughput that is more than the amount system can handle. JENNIFER possesses various types of data collection and analysis modules for detecting all types of performance problems.
JDBC Connection Pool StatusJVM CPU Usage (KERNEL/USER/IO)JVM Heap Memory UsageFILE Read/Write StatusTCP/IP SOCKET INPUT/OUTPUT TrackingCollection/Live Object CountStatus of Java Application Server Resource Used by JMX
Memory Leak DetectionJava Collection/Live Object, Application TracingJDBC Connection/Statement/ResultSet TracingJDBC Transaction (commit/rollback) TracingApplication Exception TracingSQL, SQL Exception TracingDump on Running ServiceHTTP Session Dump CapabilityReporting Loading Class Hierarchy Analysis Loaded Class Bytecode Deassembling
JENNIFER and X-VIEW
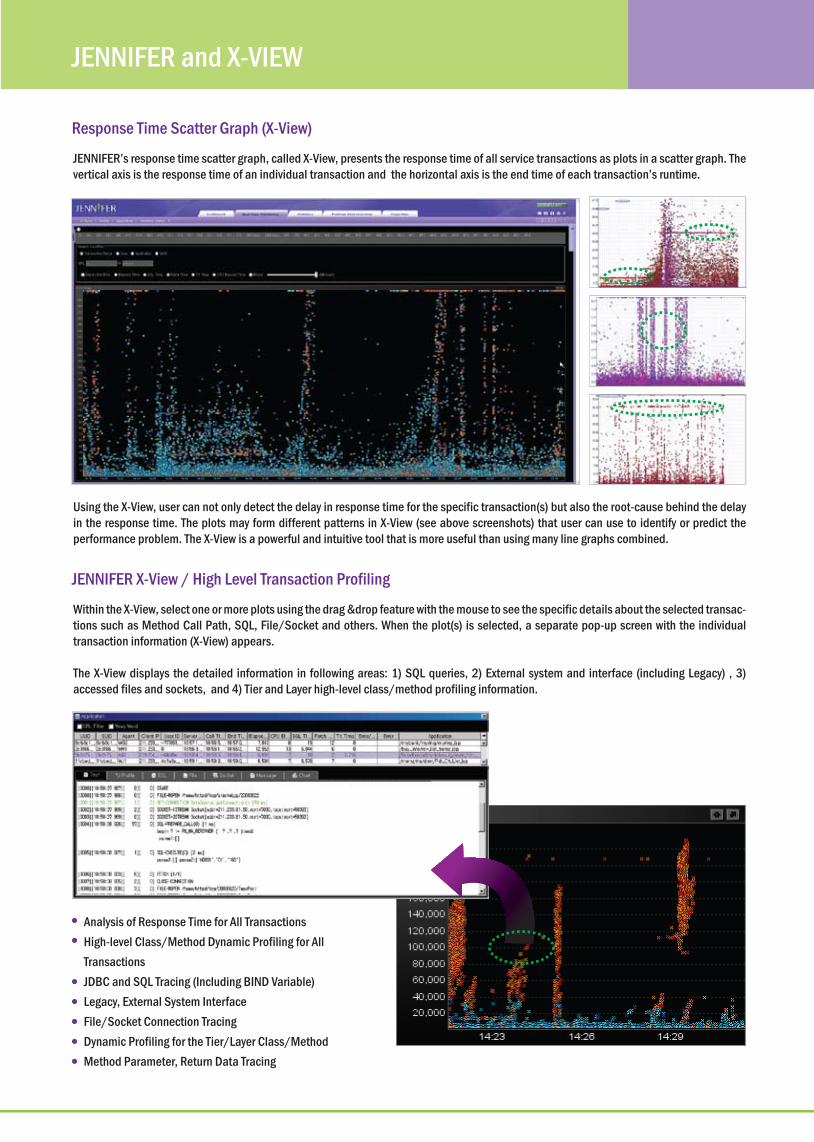
Response Time Scatter Graph (X-View)
JENNIFER’s response time scatter graph, called X-View, presents the response time of all service transactions as plots in a scatter graph. The vertical axis is the response time of an individual transaction and the horizontal axis is the end time of each transaction’s runtime.
JENNIFER X-View / High Level Transaction Profiling
Within the X-View, select one or more plots using the drag &drop feature with the mouse to see the specific details about the selected transac-tions such as Method Call Path, SQL, File/Socket and others. When the plot(s) is selected, a separate pop-up screen with the individual transaction information (X-View) appears. The X-View displays the detailed information in following areas: 1) SQL queries, 2) External system and interface (including Legacy) , 3) accessed files and sockets, and 4) Tier and Layer high-level class/method profiling information.
Using the X-View, user can not only detect the delay in response time for the specific transaction(s) but also the root-cause behind the delay in the response time. The plots may form different patterns in X-View (see above screenshots) that user can use to identify or predict the performance problem. The X-View is a powerful and intuitive tool that is more useful than using many line graphs combined.
Analysis of Response Time for All TransactionsHigh-level Class/Method Dynamic Profiling for All TransactionsJDBC and SQL Tracing (Including BIND Variable)Legacy, External System InterfaceFile/Socket Connection TracingDynamic Profiling for the Tier/Layer Class/MethodMethod Parameter, Return Data Tracing
JENNIFER Unique Features
Dynamic Profiling
JENNIFER can register additional package, class, method and/or activate/deactivate transaction profiling without restarting the web application server.
Dynamic StackTrace
The traditional method for extracting Java Full StackTrace is intentionally causing an exception/error for an application resource and outputting it onto the stacktrace; JENNIFER can register a class/method during operation, allowing dynamic full stacktrace of additional class/method without changing the application source code.
Monitoring per Domain
In a large scale of enterprise environment, many different business systems may exist, triggering a need for a solution that individually monitors each business system under integrated one view. JENNIFER provides performance management capability per domain that allows the user to allocate multiple business systems into different domain and manage each system under one umbrella.
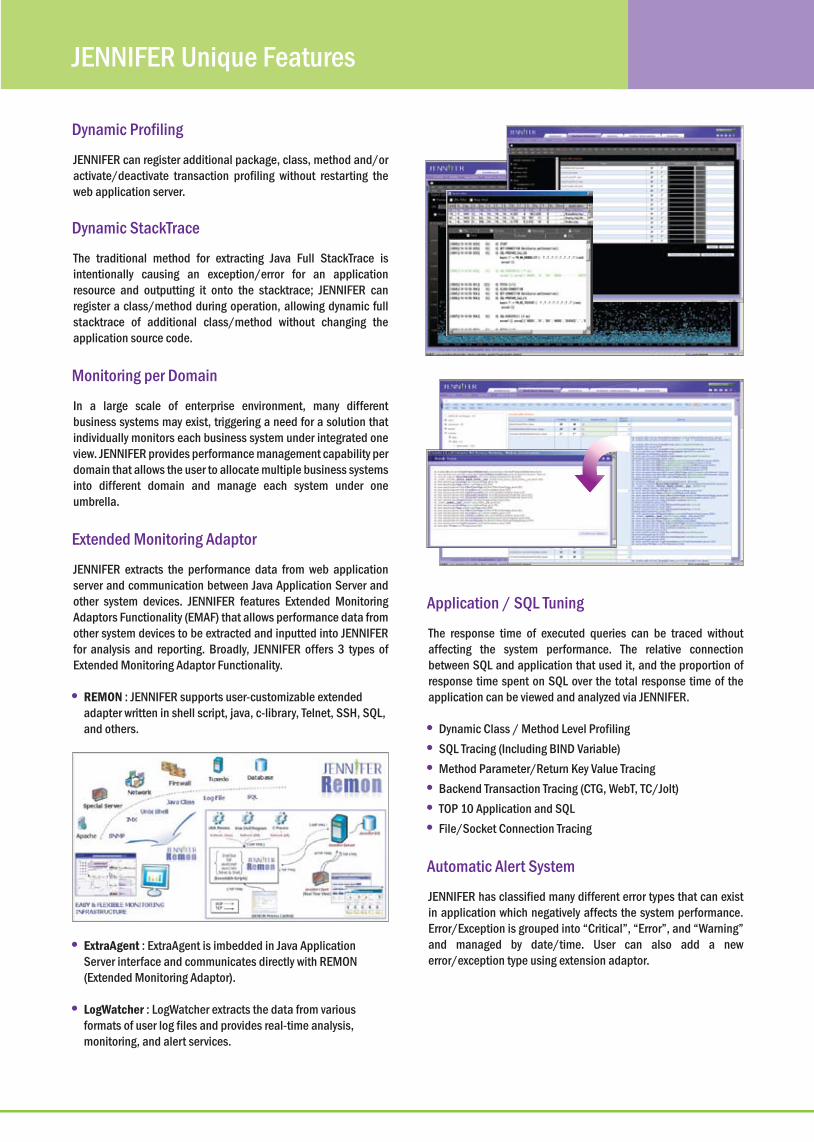
Extended Monitoring Adaptor
JENNIFER extracts the performance data from web application server and communication between Java Application Server and other system devices. JENNIFER features Extended Monitoring Adaptors Functionality (EMAF) that allows performance data from other system devices to be extracted and inputted into JENNIFER for analysis and reporting. Broadly, JENNIFER offers 3 types of Extended Monitoring Adaptor Functionality.
REMON : JENNIFER supports user-customizable extended adapter written in shell script, java, c-library, Telnet, SSH, SQL, and others.
ExtraAgent : ExtraAgent is imbedded in Java Application Server interface and communicates directly with REMON (Extended Monitoring Adaptor).
LogWatcher : LogWatcher extracts the data from various formats of user log files and provides real-time analysis, monitoring, and alert services.
Application / SQL Tuning
The response time of executed queries can be traced without affecting the system performance. The relative connection between SQL and application that used it, and the proportion of response time spent on SQL over the total response time of the application can be viewed and analyzed via JENNIFER.
Automatic Alert System
JENNIFER has classified many different error types that can exist in application which negatively affects the system performance. Error/Exception is grouped into “Critical”, “Error”, and “Warning” and managed by date/time. User can also add a new error/exception type using extension adaptor.
Dynamic Class / Method Level ProfilingSQL Tracing (Including BIND Variable)Method Parameter/Return Key Value TracingBackend Transaction Tracing (CTG, WebT, TC/Jolt)TOP 10 Application and SQLFile/Socket Connection Tracing
JENNIFER Statistical Analysis and Reporting
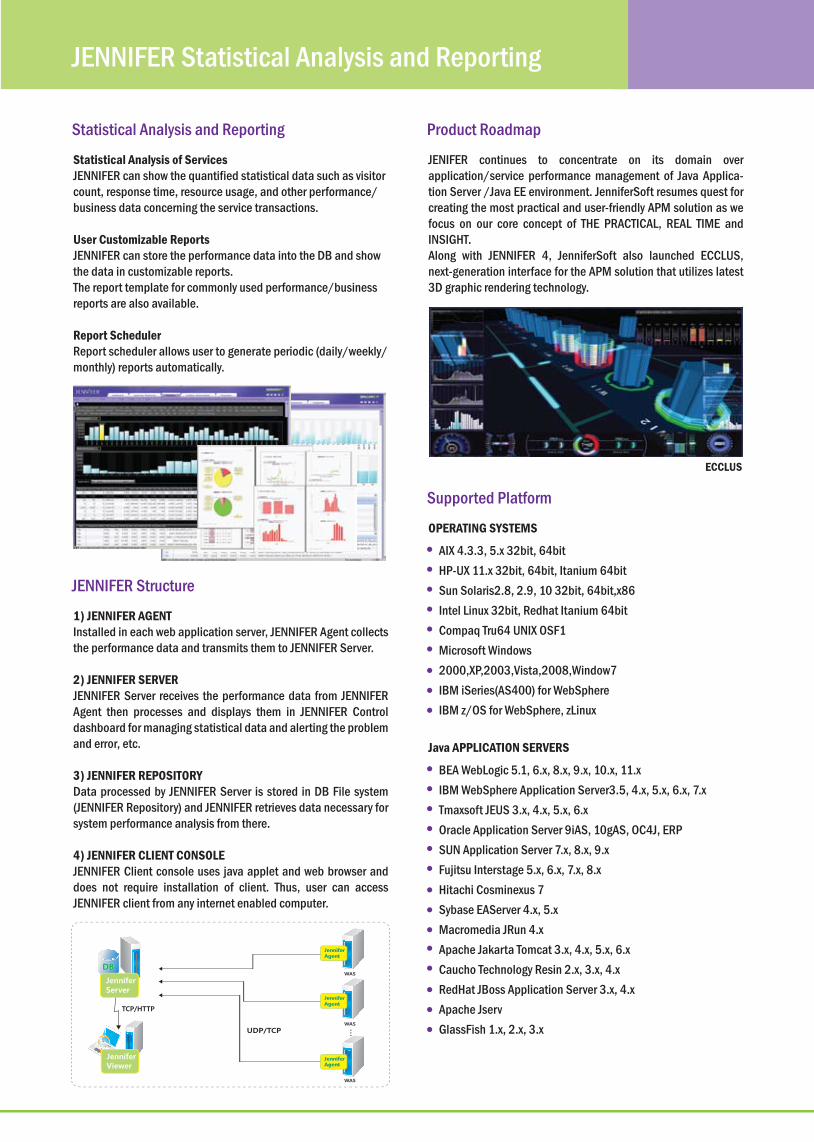
Statistical Analysis and Reporting
Statistical Analysis of ServicesJENNIFER can show the quantified statistical data such as visitor count, response time, resource usage, and other performance/business data concerning the service transactions.
User Customizable ReportsJENNIFER can store the performance data into the DB and show the data in customizable reports.The report template for commonly used performance/business reports are also available.
Report SchedulerReport scheduler allows user to generate periodic (daily/weekly/monthly) reports automatically.
JENNIFER Structure
1) JENNIFER AGENTInstalled in each web application server, JENNIFER Agent collects the performance data and transmits them to JENNIFER Server.
2) JENNIFER SERVERJENNIFER Server receives the performance data from JENNIFER Agent then processes and displays them in JENNIFER Control dashboard for managing statistical data and alerting the problem and error, etc.
3) JENNIFER REPOSITORYData processed by JENNIFER Server is stored in DB File system (JENNIFER Repository) and JENNIFER retrieves data necessary for system performance analysis from there.
4) JENNIFER CLIENT CONSOLEJENNIFER Client console uses java applet and web browser and does not require installation of client. Thus, user can access JENNIFER client from any internet enabled computer.
Product Roadmap
JENIFER continues to concentrate on its domain over application/service performance management of Java Applica-tion Server /Java EE environment. JenniferSoft resumes quest for creating the most practical and user-friendly APM solution as we focus on our core concept of THE PRACTICAL, REAL TIME and INSIGHT.Along with JENNIFER 4, JenniferSoft also launched ECCLUS, next-generation interface for the APM solution that utilizes latest 3D graphic rendering technology.
Supported Platform
OPERATING SYSTEMS
AIX 4.3.3, 5.x 32bit, 64bit HP-UX 11.x 32bit, 64bit, Itanium 64bitSun Solaris2.8, 2.9, 10 32bit, 64bit,x86Intel Linux 32bit, Redhat Itanium 64bitCompaq Tru64 UNIX OSF1Microsoft Windows 2000,XP,2003,Vista,2008,Window7 IBM iSeries(AS400) for WebSphereIBM z/OS for WebSphere, zLinux
Java APPLICATION SERVERS
BEA WebLogic 5.1, 6.x, 8.x, 9.x, 10.x, 11.xIBM WebSphere Application Server3.5, 4.x, 5.x, 6.x, 7.xTmaxsoft JEUS 3.x, 4.x, 5.x, 6.xOracle Application Server 9iAS, 10gAS, OC4J, ERPSUN Application Server 7.x, 8.x, 9.xFujitsu Interstage 5.x, 6.x, 7.x, 8.xHitachi Cosminexus 7 Sybase EAServer 4.x, 5.xMacromedia JRun 4.x Apache Jakarta Tomcat 3.x, 4.x, 5.x, 6.x Caucho Technology Resin 2.x, 3.x, 4.x RedHat JBoss Application Server 3.x, 4.x Apache JservGlassFish 1.x, 2.x, 3.x
Extended Monitoring Adaptor
ECCLUS