
THE POWERFUL OWL PROJECT - birdlife.org.au · Outcomes & Recommendations ..... 39 5.1 Volunteers...
51
David Bain, Rod Kavanagh, Kristen Hardy, Holly Parsons December 2014 THE POWERFUL OWL PROJECT Conserving owls in Sydney’s urban landscape
Transcript of THE POWERFUL OWL PROJECT - birdlife.org.au · Outcomes & Recommendations ..... 39 5.1 Volunteers...

David Bain, Rod Kavanagh, Kristen Hardy, Holly Parsons
December 2014
THE POWERFUL OWL PROJECT
Conserving owls in Sydney’s urban
landscape

The Powerful Owl Project: Conserving owls in Sydney’s urban landscape
i
Acknowledgements
The project would not have been possible without the generous time and commitment gifted
to the project from all the volunteers that participated. It would be impossible to name all the
volunteers here but they all know who they are. A special mention also, to all those members
of the public who sent in owl sightings, a valuable addition to our understanding of the owls
and where they are.
Thank you to those people who donated time and expertise to the project. Professor Kris
French from the University of Wollongong for helping with statistical analysis; Caroline Wilson
for help in compiling data for this report and undertaking some analyses; Julia Murphy from
Sydney University and Grant Lubyckij from University of Western Sydney for their dedication
to university projects that contributed significantly to the outcomes of this project; Stuart
Foggo for volunteering as an intern and spending days sifting through pellets; land managers
who provided data and organised access; all those many photographers who donated images
for reports, presentations and other material; and, wildlife care organisations who provided
data on injured owls.
This project was undertaken in accordance with the following permits and approvals:
• NSW Scientific Licence: SL100922
• Animal Research Authority from the NSW Department of Primary Industries
This project has been assisted by the New South Wales Government through its
Environmental Trust.
Report produced by: BirdLife Australia
Suite 2-05 60 Leicester Street Carlton Vic 3053 Phone (03) 9347 0757 Website www.birdlife.org.au
© BirdLife Australia. This report is copyright. Apart from any fair dealings for the purposes of
private study, research, criticism, or review as permitted under the Copyright Act, no part
may be reproduced, stored in a retrieval system, or transmitted, in any form or by means,
electronic, mechanical, photocopying, recording, or otherwise without prior written
permission. Enquiries to BirdLife Australia.
Recommended citation: Bain, D., Kavanagh, R., Hardy, K. and Parsons, H. (2014). The
Powerful Owl Project: Conserving owls in Sydney’s urban landscape. BirdLife Australia,
Melbourne.
Front cover photos: All photos by Kristen Hardy. Clockwise from top left: Young in hollow;
adult female; adult male with ringtail possum; two recent fledglings.
"It is not hard to become entranced by owls. There is an aura about
them, which no other birds possess." David Hollands

The Powerful Owl Project: Conserving owls in Sydney’s urban landscape
ii
Contents
Acknowledgements .......................................................................................................... i
Executive Summary ......................................................................................................... 1
1. Introduction ............................................................................................................ 2
1.1 Background ............................................................................................................... 2
1.1.1 The project ..................................................................................................... 2 1.1.2 The Powerful Owl ............................................................................................. 4 1.1.3 Citizen science ................................................................................................. 4
1.2 Aims and Objectives ................................................................................................... 5
2. Powerful Owl Volunteers & Community Involvement ..................................................... 6
2.1 Volunteer Recruitment and Training .............................................................................. 6
2.1.1 Recruitment .................................................................................................... 6 2.1.2 Training .......................................................................................................... 6
2.2 Community Involvement ............................................................................................. 7
2.3 Understanding the Volunteers ...................................................................................... 7
2.3.1 Who were the volunteers? ................................................................................. 7 2.3.2 What did volunteers get from participating? ......................................................... 11
3. Ecological Research .................................................................................................. 14
3.1 Methods .................................................................................................................... 14
3.1.1 Identifying breeding sites .................................................................................. 14 3.1.2 Owl timelines .................................................................................................. 16 3.1.3 Diet composition .............................................................................................. 16 3.1.4 Environmental variables .................................................................................... 16 3.1.5 Landscape analysis .......................................................................................... 18 3.1.6 Car-strike and other incidents ............................................................................ 19 3.1.7 DNA ............................................................................................................... 19
3.2 Results ..................................................................................................................... 19
3.2.1 Identifying breeding sites .................................................................................. 19 3.2.1 Owl timelines .................................................................................................. 23 3.2.2 Diet composition .............................................................................................. 23 3.2.3 Environmental variables .................................................................................... 24 3.2.4 Landscape analysis .......................................................................................... 28 3.2.5 Car-strike and other incidents ............................................................................ 30 3.2.6 DNA ............................................................................................................... 32
3.3 Discussion ................................................................................................................. 32
4. Education and Outreach ............................................................................................ 35
4.1 Education .................................................................................................................. 35
4.2 Land manager resources ............................................................................................. 38
5. Outcomes & Recommendations .................................................................................. 39
5.1 Volunteers and citizen science ...................................................................................... 39
5.2 Community ................................................................................................................ 39
5.3 Urban Powerful Owl management ................................................................................. 40
6. Conclusions ............................................................................................................. 41
References ..................................................................................................................... 42
Appendix A: Land Manager Guidelines ................................................................................ 45
The Powerful Owl Project: Conserving owls in Sydney’s urban landscape
1
Executive Summary
This project is the result of collaboration between a research scientist and an inspired
community member, both focused on the conservation of the Powerful Owl. Adoption of the
project by BirdLife Australia provided the resources necessary to further develop the idea.
The project’s focus has been to investigate the breeding ecology of the species in Sydney’s
urban landscape, engage the broader community in urban conservation and enhance
management of the Powerful Owl.
The Powerful Owl Project had two main avenues for participation, volunteers and the general
public. Three hundred and thirty three volunteer owl observers were trained in survey
techniques and allocated to survey sites. They were typically middle aged with even numbers
of males and females. The volunteers were generally interested in birds and bird watching,
were engaged already with the natural world and often already supporting conservation
initiatives. Participation increased knowledge of urban conservation and all volunteers felt
that their contribution was valuable. Over 800 members of the general community were also
engaged through submitting less formal observations of opportunistic sightings. These
records underwent a vetting process and contributed significantly to narrowing down
locations of new breeding territories.
Ecological research was the underpinning of the project, with a broad range of investigations
focused on breeding. Sixty breeding territories were mapped within the Sydney urban area,
with a fledgling success of 1.22. Dietary changes were observed from previous studies and
between the breeding and non-breeding season, primarily reflecting prey abundance.
Powerful Owls were observed to nest in proximity to roosting habitat in drainage lines,
typically high in the catchment area where hollow-bearing trees were most common.
Breeding territories were also focused on sites with high prey abundance and intact foraging
habitat. Numerous threats are present within the urban context, with a large proportion of
deaths attributed to car-strike. Other threats included urban development and land
management practices such as hazard reduction burning.
Education for all sectors of the community was an important component of the project.
Avenues of engagement included 29 talks and workshops, various media avenues, web-based
resources, an ongoing schools education program, and presentation at scientific conferences.
Resources were also developed and disseminated to land managers to improve their ability to
manage the species. These included management guidelines covering development and land
management, survey and important habitat characteristics.
Overall the project has been hugely successful in engaging the community and fostering an
understanding of the value of our urban bushland remnants. Over 1,000,000 people were
reached and an increase in understanding of the Powerful Owl has been achieved utilising
citizen science, for researchers, land managers and the community.

The Powerful Owl Project: Conserving owls in Sydney’s urban landscape
2
1. Introduction
This project is the result of collaboration between a research scientist and an inspired
community member, both focused on the conservation of the Powerful Owl. Adoption of the
project by BirdLife Australia helped to secure funding and provided an avenue to enlist
community volunteers to participate. The project’s focus has been to investigate the breeding
ecology of the species in Sydney, engage the broader community in urban conservation and
enhance management of the Powerful Owl.
1.1 Background
1.1.1 The project
Dr Rod Kavanagh has been keeping records on Powerful Owl nests throughout Sydney for
over 25 years. This work, both formally and informally, has been undertaken as part of
ongoing research and work on owls in Sydney’s urban bushland (for example Kavanagh
2003). One of the recommendations within this published research was the need for broad-
scale community involvement in voluntary surveys for owls.
In 2009, unknown to Rod, an inspired young music teacher by the name of Kristen Hardy had
begun investigating the occurrence of Powerful Owls in the northern beaches of Sydney
following a chance meeting with a juvenile Powerful Owl (see story overleaf).
The eventual coming together of Rod and Kristen created ‘The Powerful Owl Project’. Through
Rod’s involvement with BirdLife Southern NSW, the project was adopted by BirdLife Australia
through its urban bird conservation program, Birds In Backyards (BIBY).
In 2011, BIBY ran a pilot project to understand the potential of the project. Following
advertising, over 50 volunteers were engaged and trained. The pilot project was a huge
success and further project funding was sought through the NSW Environment Trust
Education (Community) Grants. It was thought that the Powerful Owl provided an icon
species to engage the wider community and a suitable vehicle to spread the message of
urban conservation.
Funding was secured through a two year grant with the Environment Trust as well as two lots
of additional support from BirdLife Southern NSW through their annual ‘Twitchathon’ fund
raising events.
Powerful Owl family. Kristen Hardy
The Powerful Owl Project: Conserving owls in Sydney’s urban landscape
3
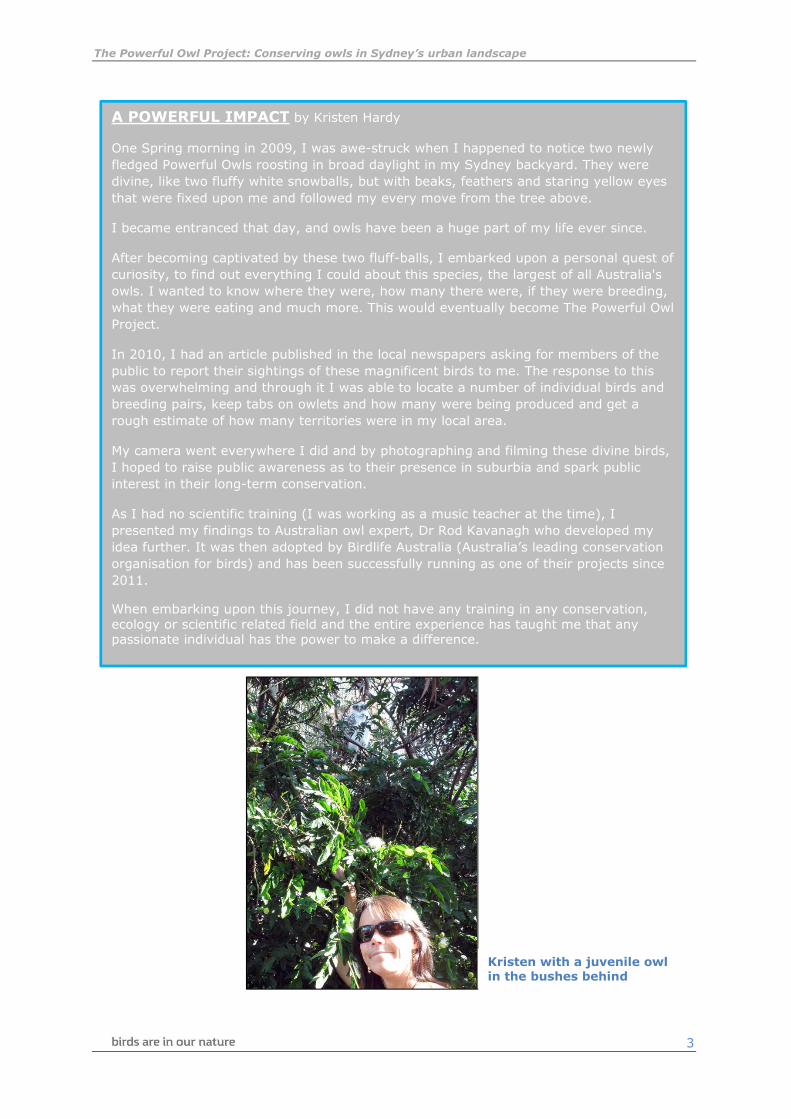
A POWERFUL IMPACT by Kristen Hardy
One Spring morning in 2009, I was awe-struck when I happened to notice two newly
fledged Powerful Owls roosting in broad daylight in my Sydney backyard. They were
divine, like two fluffy white snowballs, but with beaks, feathers and staring yellow eyes
that were fixed upon me and followed my every move from the tree above.
I became entranced that day, and owls have been a huge part of my life ever since.
After becoming captivated by these two fluff-balls, I embarked upon a personal quest of
curiosity, to find out everything I could about this species, the largest of all Australia's
owls. I wanted to know where they were, how many there were, if they were breeding,
what they were eating and much more. This would eventually become The Powerful Owl
Project.
In 2010, I had an article published in the local newspapers asking for members of the
public to report their sightings of these magnificent birds to me. The response to this
was overwhelming and through it I was able to locate a number of individual birds and
breeding pairs, keep tabs on owlets and how many were being produced and get a
rough estimate of how many territories were in my local area.
My camera went everywhere I did and by photographing and filming these divine birds,
I hoped to raise public awareness as to their presence in suburbia and spark public
interest in their long-term conservation.
As I had no scientific training (I was working as a music teacher at the time), I
presented my findings to Australian owl expert, Dr Rod Kavanagh who developed my
idea further. It was then adopted by Birdlife Australia (Australia’s leading conservation
organisation for birds) and has been successfully running as one of their projects since
2011.
When embarking upon this journey, I did not have any training in any conservation, ecology or scientific related field and the entire experience has taught me that any passionate individual has the power to make a difference.
Kristen with a juvenile owl
in the bushes behind

The Powerful Owl Project: Conserving owls in Sydney’s urban landscape
4
1.1.2 The Powerful Owl
The Powerful Owl (Ninox strenua) is the largest owl in Australia, standing at just over 60 cm
with a wingspan of 140 cm (Simpson & Day 1996). It is one of a number of threatened forest
owls in Australia, being listed as threatened or vulnerable in all States that it occurs in.
The Powerful Owl is found in the forests of eastern Australia from north of Brisbane down the
coast through Melbourne and just making it around to South Australia (Simpson & Day 1996;
Haywood 2010). Curiously, it survives within many of our cities despite its size and
threatened status (Kavanagh 2003; Cooke et al. 2002).
Predominantly feeding on possums and gliders, the Powerful Owl is a specialist hunter of
arboreal prey with the bulk of its diet being Common Ringtail Possums (Pseudocheirus peregrinus) and Greater Gliders (Petauroides volans), along with Common Brushtail Possums
(Trichosurus vulpecula), Flying-foxes (Pteropus spp.) and birds (Kavanagh 2002a). The species is
considered to mate for life and breeds during winter, nesting in hollows in large, old trees
from May to October (Higgins 1999).
Adult female Powerful Owl. Kristen Hardy
1.1.3 Citizen science
Citizen science is the collection of scientific data by volunteer members of the community.
Although citizen science has been in existence for a long time (Havens & Henderson 2013),
there is an increasing strategic utilisation in large projects (Tulloch et al. 2013; Cooper et al.
2014).
Citizen science provides several opportunities to undertake large widespread studies and to
collect large amounts of data (Tulloch et al. 2013). Inherent in the use of citizen science,
however, is the management of volunteers and quality and accuracy of the data collected

The Powerful Owl Project: Conserving owls in Sydney’s urban landscape
5
(Cooper et al. 2014; Szabo et al. 2012). None of these need be road blocks to the application
of citizen science, just appropriate study design to take into account these limitations.
This project is an example of a grass roots citizen science endeavour. A project born from a
young member of the community full of initiative, along with a seasoned research scientist
advocating the need for community driven surveys.
1.2 Aims and Objectives
This project aims to educate the community and a range of stakeholders about the
importance of landscape level habitat management for the protection of biodiversity by using
a vulnerable icon species, the Powerful Owl.
The Powerful Owl appears to be widely distributed within the Sydney region, with previous
estimates of approximately 20–30 pairs and at least fifteen confirmed breeding locations
(Kavanagh 2003). While the species has had a high level of community interest, there was no
formal process for coordinating information about the distribution and status of the Powerful
Owl in the Greater Sydney region. Little was known about the exact roosting and breeding
locations and requirements of Powerful Owls and very little information was available about
their fidelity to nesting sites and annual breeding success.
Powerful Owls also have large home ranges (often larger than 1000 ha; Kavanagh 2002b)
that are likely to stretch beyond the boundaries of individual Local Government Areas and
thus, whilst land managers may know of birds in their area, unless there is communication
between different Councils and other land managers, it is impossible to know the actual
population size of the birds and the importance of various individual bushland remnants
across the landscape.
This project stimulates and harnesses community interest in this iconic Australian bird by
engaging the general public in citizen science and in doing so, educates the general public in
ways that are likely to significantly enhance efforts to ensure the owls long-term
conservation.
In consideration of the above, the objectives of The Powerful Owl Project were:
1. To engage the community to collect data to inform the conservation status of Powerful
Owls in the Sydney Basin.
2. To identify site-specific management recommendations for all stakeholders and land
managers with breeding pairs of Powerful Owls.
3. To inform, coordinate and support management amongst stakeholders and between
land managers for conservation of Powerful Owls and other species.
During the course of the project, it was clear that stakeholders beyond the Sydney region
were interested. As a result of this, the project was expanded in a more limited form through
the urban areas of the Central Coast and north to Newcastle in 2013 and 2014.

The Powerful Owl Project: Conserving owls in Sydney’s urban landscape
6
2. Powerful Owl Volunteers & Community Involvement
The Powerful Owl Project had two main avenues for participation. Volunteer ‘Owl Observers’
who were trained in survey techniques and allocated to survey sites; or members of the
general community who submitted less formal observations. Volunteers were surveyed to
understand who they were and what they got from participation.
2.1 Volunteer Recruitment and Training
2.1.1 Recruitment
Volunteers were sourced via a number of avenues. These included media releases in local
newspapers, radio interviews, Council volunteer newsletters, bird club newsletters and word
of mouth.
In total 333 volunteers registered and were engaged in some capacity with the project
between 2011 and 2014. Of these, 287 undertook active surveys of sites. The number of
volunteers steadily grew each year as the project matured, with 51 volunteers in the pilot
project in 2011, 69 in 2012, 124 in 2013 and 127 in 2014. On average the volunteer
retention rate was 51% from year to year.
Predominantly volunteers participated for only one year (68%) (Figure 1). As with many
volunteer programs, there was a core group of people (12%) that participated in 3 or more
years of the project.
Figure 1: Number of years volunteers participated
2.1.2 Training
All volunteers were encouraged to attend a free 3 hour training workshop. These workshops
provided some general project information, survey techniques, ethical responsibilities and
safety issues for both volunteers and the owls.
0
20
40
60
80
100
120
140
160
180
200
1 2 3 4
No
. o
f v
olu
nte
ers
No. of years participated

The Powerful Owl Project: Conserving owls in Sydney’s urban landscape
7
For those volunteers who could not attend workshops, electronic training resources were
provided. In addition to these resources, questions and discussions were encouraged between
project officers and volunteers.
In general there was more than one volunteer per survey site. These volunteers were
introduced and encouraged to discuss results with each other to help develop each other’s
knowledge along with ensuring there was no doubling up of effort through each stage of the
surveys.
2.2 Community Involvement
As part of promotional material, requests were made for members of the public to contact the
project with current records of Powerful Owls. To ensure accuracy, records were vetted
through three different measures: conversations with observers; photo verification (photos
were requested or photos of common nocturnal species were sent to observers); and
consideration of the likelihood of the location.
During the course of the project, over 600 observations of Powerful Owls in unique locations
were submitted. The numbers of these unique observations were greatest in the first two
years of the project, and slowly reduced as owls were repeatedly reported in known locations
(see Chapter 3.2.1).
2.3 Understanding the Volunteers
Volunteers were asked to undertake a survey before and after participating in the project.
This was undertaken to understand who the volunteers were and what the impact was of
participation.
In total, 106 volunteers filled out the initial before questionnaire but only 16 of those filled
out the second, after participation questionnaire. We were able to follow these 16 individuals
across their experience of participation and also understand the demographics of all these
106 volunteers.
2.3.1 Who were the volunteers?
Volunteers were typically middle aged (Figure 2). Most had completed some form of
education post high school (Figure 3) and 42% were male and 58% female. A large
proportion of volunteers were members of wildlife or conservation organisations (Figure 4)
and unsurprisingly over 80% participated in passive nature or wildlife experiences such as
bushwalking, visiting zoos or wildlife sanctuaries or watching nature documentaries (Figure
5).
Only 21% of volunteers were a member of a bird club or organisation (including BirdLife
Australia), although 74% considered themselves to be bird watchers (Figure 6). Over half of
these people were regular bird watchers, with 32% bird watching every week and 18% bird
watching once a month (Figure 6).
The main motivation of volunteers in participating in the project was largely an interest in
conservation, both specifically for birds and in general. An additional 32% of volunteers had
an interest in or an experience with Powerful Owls prompting them to participate (Figure 7).

The Powerful Owl Project: Conserving owls in Sydney’s urban landscape
8
Encouragingly, over 80% of participants recognised that habitat loss was the key threat
impacting on native birds (Figure 8), which broadly is true (Garnett & Crowley 2000).
Figure 2: Age of volunteers.
Figure 3: Highest level of education of volunteers.
0.0
5.0
10.0
15.0
20.0
25.0
30.0
35.0
<18 18-24 25-34 35-44 45-54 55-64 65-69 >69
Pe
rce
nt
Age class
0.0
5.0
10.0
15.0
20.0
25.0
30.0
Pe
rce
nt

The Powerful Owl Project: Conserving owls in Sydney’s urban landscape
9
Figure 4: Membership of other wildlife or conservation organisations.
Figure 5: Other activities volunteers take part in.
0.0
5.0
10.0
15.0
20.0
25.0
30.0
35.0
Pe
rce
nt
0.010.020.030.040.050.060.070.080.090.0
100.0
Pe
rce
nt

The Powerful Owl Project: Conserving owls in Sydney’s urban landscape
10
Figure 6: Do the volunteers specifically go bird watching?
Figure 7: Main motivation of volunteers.
0
10
20
30
40
50
60
70
80
No Yes
Pe
rce
nt
Yes - once a year/rarely
Yes - few times a year
Yes - once a month
Yes - once a week
No
Spare time and
wanted
something to do
0%
Saw a Powerful
Owl and sparked
an interest
18%
Particular
ongoing interest
in the Powerful
Owl
14%
Interest in bird
conservation in
general
30%
Interest in
conservation in
general
29%
Wanted to
engage myself
and
family/friends in
a conservation
activity
4%
Other
5%

The Powerful Owl Project: Conserving owls in Sydney’s urban landscape
11
Figure 8: What is the biggest problem affecting native birds?
2.3.2 What did volunteers get from participating?
As well as understanding who the volunteers were, an attempt was made to understand the
knowledge volunteers had of the Powerful Owl and whether that changed through
participation in the project.
When answers were pooled across the volunteers, the group knowledge on Powerful Owls and
their threats increased as a result of participation (Figure 9 & Figure 10).
In relation to Powerful Owls, potentially the most important increase in knowledge was about
the roosting and nesting habitat (Figure 9). This knowledge is critical for communities to build
an understanding of their local area.
When looking at threats to Powerful Owls, the biggest increases in knowledge was that fire
regimes were important in Powerful Owl survival and conservation, loss of nesting and
breeding resources (habitat and hollow-bearing trees) and car-strike (Figure 10 and
discussed further in Chapter 3). Also of note was the decrease in numbers of people who
considered secondary poisoning to be a significant threat. This is likely due to an increased
understanding by volunteers of the dominance of arboreal prey that the Powerful Owl
consumes, rather than ground dwelling fauna which is more likely to be the focus of poison
control measures. An interesting artefact in the data was the increase in numbers of people
considering collision with windows and tall structures a threat. It is likely that this comes from
a photo commonly shown in talks where a Powerful Owl had hit a lounge room window and
was lying on a verandah.
0.0
10.0
20.0
30.0
40.0
50.0
60.0
70.0
80.0
90.0
100.0
Pe
rce
nt

The Powerful Owl Project: Conserving owls in Sydney’s urban landscape
12
When individuals (16) were followed across time, rather than the group as a whole, only four
(24%) people improved on their overall knowledge of owls. This was based on the overall
number of questions answered right or wrong (Figure 11). One (6%) of these individuals got
more questions wrong after participation than before.
All volunteers felt as though they contributed to the project, although 12% felt that their
expectations of participation were not met due to not finding a nest. Encouragingly, several
volunteers mentioned that the experience led them to talk to family and friends about the
Powerful Owl and had opened their eyes to their local area.
Figure 9: Volunteer knowledge of the Powerful Owl taken as a group before and after participation.
0
10
20
30
40
50
60
70
80
90
100
Pe
rce
nt
Right before
Right after

The Powerful Owl Project: Conserving owls in Sydney’s urban landscape
13
Figure 10: What are the current threats to Powerful Owls taken as a group before and after participation.
Figure 11: Volunteer knowledge of the Powerful Owls. Individuals followed over the first year of involvement presented as a comparison of the number of questions answered right or wrong using the same questions before and after participation.
0.0
10.0
20.0
30.0
40.0
50.0
60.0
70.0
80.0
90.0
100.0
Pe
rce
nt
Before
After
0.0
10.0
20.0
30.0
40.0
50.0
60.0
Improved Same right Same wrong Got worse
Pe
rce
nt
No. of knowledge questions answered right or wrong
The Powerful Owl Project: Conserving owls in Sydney’s urban landscape
14
3. Ecological Research
Ecological research undertaken as part of the project involved the community and volunteers
as much as possible. Investigations included; breeding sites and success; dietary changes;
environmental, landscape and habitat characteristics; and threats in the urban context.
Data are only provided and analysed for the territories located in Sydney, unless specifically
identified otherwise.
3.1 Methods
3.1.1 Identifying breeding sites
To find and map breeding sites of the Powerful Owl, a number of techniques were combined.
There were a number of breeding sites and nest trees already known within the Sydney area
from previous work undertaken by Kavanagh (2003) and those nests identified by Kristen in
the formative years of the project. Additional nests were considered likely and these were
identified using the following techniques.
Records of Powerful Owls from the NSW BioNET Wildlife Atlas and sightings from the general
public which were sent into the project were mapped across the study area.
Areas of likely habitat were identified in proximity to these records, particularly records from
within the breeding season, using aerial photography. Habitat was considered likely where it
was in proximity to drainage lines and contained suitable forest vegetation as determined
from aerial photo interpretation.
Volunteer ‘Owl Observers’ were engaged to search these areas of likely habitat for evidence
of owls, owls and breeding sites. The process of these investigations was based on volunteer
availability and was concentrated within the breeding season and followed the general pattern
of:
1. Listening for owls early in the breeding season (April-May). This was undertaken in
the early evening from vantage points in an attempt to identify the general location of
breeding site roosts as at this time of the year the owls typically called from a location
in proximity to the nesting site. This was repeated over 4 to 5 nights of suitable
listening conditions.
2. Searches for evidence of the owls were then undertaken during the day in the general
locations where owls were heard calling from. These searches were focused along the
drainage lines where preferred roosting habitat of mesic vegetation with denser dark
canopies occurred (Kavanagh 2003). Owl evidence that was searched for included
large areas of whitewash, pellets, suitable hollow-bearing trees adjacent to the
roosting habitat, and always roosting birds.
3. Once evidence of owls was identified, further listening surveys were undertaken in the
vicinity. These surveys were again undertaken in the early evening, throughout the
breeding season. Calling birds located using these techniques were often found to be
in close proximity to the nest tree and continued observations of the behaviour of the
owls in the early evening along with an understanding of the location of hollow-
bearing trees in the area would often result in the identification of the nest tree.

The Powerful Owl Project: Conserving owls in Sydney’s urban landscape
15
4. If a nest tree was identified, approximately weekly monitoring was undertaken to
follow the success of the nesting attempt. Alternatively, if nest trees were not
identified, surveys of common roosting sites were continued to observe the behaviour
of the owls. When adult females were observed regularly outside of the hollow,
listening surveys for chicks were undertaken in the evenings. Often, chicks were
heard within the hollow prior to fledging. Where the nesting tree was not identified,
continued evening surveys commonly recorded chicks following fledging due to their
characteristic call.
Protocols were developed to help and safeguard volunteers, and of course, to ensure minimal
disturbance to the birds at this critical time of the year. These included:
• do not intentionally get closer than 30 m to birds or their nests,
• undertake surveys in pairs or only small groups of less than 4 or 5 people,
• do not advertise the location of the nest tree,
• reduce flash photography,
• do not shine torches on animals for longer than about 10 seconds at a time.
In the evolution of the project, additional territories were recorded around the periphery of
the urban area of Sydney. These territories are not displayed or analysed as part of this work
as the focus was on the urban context.
Data were also collected on territories between the Central Coast and Newcastle in 2013 and
2014. Due to a reduced volunteer capacity throughout this region, comprehensive data were
not obtained from all breeding sites. These data have been mapped but they do not form part
of any detailed analyses.
Data on breeding success were recorded following the successful fledging of young.
Categories of data were:
• 1 chick – one chick successfully fledged.
• 2 chicks – two chicks successfully fledged.
• Owls about – adult owls were observed in the territory during the breeding season but
either the confirmation of a nesting attempt was never established, or the outcome of
nesting was never established. Generally this was due to volunteer availability or
expertise.
• Failed – confirmed nesting behaviour was observed such as owls entering the hollow
throughout the breeding season with prey or chicks were observed in the hollow, but
subsequently young failed to fledge.
The fate of fledged chicks was not followed closely, with the foremost aim to record fledging
success.

The Powerful Owl Project: Conserving owls in Sydney’s urban landscape
16
3.1.2 Owl timelines
Volunteers were asked to send in by email all interesting observations. Often additional
information was requested or discussed, and from this critical data were extracted.
Information collected included timing of significant events such as; owls seen for the first
time in the territory; pair bonding behaviour; mating; owls entering the hollow; chicks seen
or heard inside the hollow; female out of the hollow; and chicks fledged.
3.1.3 Diet composition
During the course of all surveys in 2012 and 2013, volunteers were asked to collect pellets
from known roosting sites. These pellets were then examined for prey items by identifying
the bones and hair present and also other remains such as feathers and beetle carapaces.
The bones were identified by comparison to museum specimens and reference to Lavazanian
(1996). Hair was identified using the HairID tool (Triggs & Brunner 2002).
Pellets were investigated through a number of avenues. As part of work by project officers,
within a workshop setting provided for interested volunteers, by Julia Murphy for a major
third year project as part of a Conservation Biology course at the University of New South
Wales and by Stuart Foggo, a volunteer intern at BirdLife Australia’s Discovery Centre in
Sydney.
The proportions of various dietary items were compared to previous results collected 18 to 24
years previously in the same areas by Kavanagh (2002a, 2003) and between breeding and
non-breeding seasons. Due to a large number of pellets coming from one location (Moore
Reserve), only a sub-sample from this site was included in the analysis.
Comparisons of the proportions of prey species comprising the diet were investigated using
Chi-square analyses.
3.1.4 Environmental variables
This work was undertaken by Grant Lubyckij as part of his Bachelor of Natural Science at the
University of Western Sydney in conjunction with the Powerful Owl Project. Edited extracts
from his report are provided here, with additional statistical analyses undertaken.
This study utilised several methods to identify different characteristics of the Powerful Owl’s
preferred habitat. Five environmental variables were investigated: vegetation structure;
mesic width; hollow-bearing tree abundance; dominant canopy tree species; and prey
density. The study was undertaken throughout the Sydney urban area.
Sixteen sites were established along drainage lines containing remnant vegetation. Drainage
lines were chosen as they are known habitat for Powerful Owls and represent the best
retained habitat in Sydney (Soderquist & Gibbons 2007; Kavanagh 2003). Eight sites were in
locations where Powerful Owls were known to roost and nest, labelled ‘present’, and eight
sites were in locations without records of Powerful Owl nesting, labelled ‘absent’. Each of
these sites was divided in half based on study site elevation into sub-sites; the ‘upper’, or
upstream portion of the location; and ‘lower’, or downstream portion of the location. The
sampling of sites in the upstream and downstream portion of the creek-lines was undertaken
as Powerful Owls often nest in the upper portions of drainage lines in Sydney (Kavanagh

The Powerful Owl Project: Conserving owls in Sydney’s urban landscape
17
2003 and D. Bain pers obs). Transects of 100m were established along the drainage line
within each site and sub-site.
Mesic width
At each study site the ‘mesic vegetation’ width was measured. Mesic vegetation is taken to be
the more densely canopied riparian vegetation, which Powerful Owls are known to favour for
roosting (Kavanagh 2003). The edge of the mesic area is quite pronounced in the sclerophyll
forests of the Sydney area. Measurements were taken perpendicular to the drainage line at
10 evenly spaced locations along a 100m transect.
This mesic area formed the base area for the vegetation structure assessment, functioning as
the boundary for all percentage foliage cover measurements and dominant tree species
recordings.
Mesic width was analysed using a two-factor analysis of variance to investigate differences
between locations with owls present and those where owls were absent and between the
upper portions of sites compared with lower portions of sites.
Vegetation structure
Percentage foliage-cover (PFC) of vegetation within the mesic area of the drainage line was
measured utilising the methods originally formulated by Walker & Hopkins (1990) and
replicated and augmented by McDonald et al. (1998). The PFC was recorded for three
vegetation strata layers: canopy, sub-canopy and understorey at all study sites. The PFC was
recorded at 10 points along a 100m transect using a quadrat 10m wide by the width of the
mesic area.
Vegetation structure was analysed using an analysis of similarity and a multi-dimensional
scaling (MDS) plot (Clarke and Gorley 2006) to investigate differences in PFC across all
vegetation strata between locations with owls present and those where owls were absent,
and between the upper portions of sites compared with lower portions of sites.
Hollow-bearing tree abundance
The ‘diameter at breast height’ (DBH) technique was utilised as a surrogate measure for trees
containing hollows (Smyth et al. 2002) to provide efficiency in data collection. A DBH of >70
cm was applied; if trees met this criterion they were considered to be of a size capable of
producing hollows for Powerful Owl occupation (Kavanagh 2003 & personal observation). A
count of all trees >70 cm DBH was undertaken within 50 m of the drainage line along a 100
m transect.
Hollow-bearing tree abundance was analysed using a two-factor analysis of variance to
investigate differences between locations with owls present and those where owls were
absent, and between the upper portions of sites compared with lower portions of sites.
Dominant canopy tree species
Dominant canopy species were investigated by identifying those species that dominated and
therefore had structural importance within the vegetation assemblage at the site (Tozer
2003). The same quadrats utilised to determine percentage foliage-cover were also used to
collect this information. The two most dominant species in each quadrat were recorded and
identified to species level.

The Powerful Owl Project: Conserving owls in Sydney’s urban landscape
18
Prey abundance
Spotlighting techniques were employed to identify prey species at all sites. The Powerful Owls
diet is known to be chiefly and almost exclusively comprised of nocturnal arboreal marsupial
prey (Cooke et al. 2006; Kavanagh 2002a). Spotlighting was performed with a 100W light
with minimum exposure of animals to torchlight to allow identification (Catling et al. 1997).
Observations used the ‘distance sampling’ method, where the spotter walked a pre-
determined distance through the habitat at a constant and set walking-pace (Ruette et al.
2003). This study utilised a set walking pace of 2 km/h for a duration of 30 minutes,
equalling approximately 1 km of spotlighting. A ‘meandering transect’ was used to allow safe
traversing of study locations, on worn tracks and level ground (Catling et al. 1997). A list of
fauna species found at each site and their relative abundance was recorded.
Spotlighting was only performed for one night in each of the sixteen study locations due to
time commitments within the project. This necessarily limits the strength of the data but
provided valuable experience for an upcoming researcher.
Prey abundance was analysed using a t-test to investigate differences between locations with
owls present and those where owls were not recorded (absent).
3.1.5 Landscape analysis
A landscape assessment was undertaken using some of this environmental information in
conjunction with existing datasets. The aim of the landscape assessment was to calculate the
amount of habitat within territories.
The extent of roosting habitat throughout Sydney was mapped to provide an indication of
important core areas for Powerful Owls. The broadness of the mapping limits the fine scale
application although it provides a valuable coarse layer for land management.
The extent of foraging habitat within a territory was investigated in relation to its total area
and the number of patches making up this area. Fledgling success was included within this
analysis to understand any influence of habitat intactness.
Territory size for the Powerful Owls was assumed to be 1256 ha calculated using a 2 km
radius circle centred on the nesting site. Territory sizes have been recorded between 300 ha
and 1589 ha and up to 4774 ha (Bilney 2013; Soderquist & Gibbons 2007; Kavanagh 2002b;
Higgins 1999). It is acknowledged that Powerful Owl territories are not circular and in reality
will be a reflection of the distribution of habitat and location of other pairs. However, for the
purposes of this analysis, it was considered that this approximation provides a valuable model
for the species.
Roosting habitat (breeding season)
A 15 m buffer on either side of all water bodies and water courses (all stream orders) and
restricted to dry sclerophyll forests, wet sclerophyll forests, forested wetlands and rainforests
using Keith (2004) vegetation formations was used to define roosting habitat (OEH 2013). A
15 m buffer was chosen based on the widths of mesic areas recorded (Chapter 3.1.4). This
vegetation was merged with all areas of wet sclerophyll and rainforest vegetation that formed
part of remnants greater than 1 ha in size.

The Powerful Owl Project: Conserving owls in Sydney’s urban landscape
19
Foraging habitat
Mapping of native and non-native vegetation across Sydney (OEH 2013) was used to
investigate foraging habitat. Vegetation considered to be used for foraging was represented
by dry sclerophyll forest, wet sclerophyll forest, rainforest, heathland, grassy woodland,
forested wetlands and planted exotics/urban vegetation. This vegetation was considered to
be that which important prey species, predominantly the Common Ringtail Possum, would
utilise within Sydney. Foraging habitat was considered to be represented by any patches
greater than 1 ha (i.e. similar to the home range of a Common Ringtail Possum (Van Dyck &
Strahan 2008), where a patch was any contiguous area of foraging vegetation separated by
less than 50 m.
A number of assumptions have been made in relation to the habitat classification used in the
landscape analysis. These classifications necessarily do not capture all of the utilised habitat
by Powerful Owls in Sydney, and potentially overestimate the suitability of other areas of
vegetation. However, they do provide a valuable approximation during the breeding season,
with 81% of known breeding season roosting and nesting sites occurring within 50 m of the
mapped roosting habitat.
3.1.6 Car-strike and other incidents
Data were regularly obtained from animal care organisations on the location of Powerful Owl
incidents. Organisations included WIRES, Sydney Wildlife, Taronga Zoo and many local vet
clinics. In addition, data were often provided by volunteers and members of the public.
The data collated, focused on accurate locations, the cause of the incident and fate of the
animal. In an attempt to understand any impact, all incidents resulting in death or permanent
captivity that occurred in the lead-up to and during each nesting season were mapped
against breeding success. Incidents after the fledging period were not included as adults are
known to be able to raise chicks alone following the death of a partner (McNabb et al. 2007;
D. Bain pers.obs.).
3.1.7 DNA
Volunteers were asked to collect feathers whenever possible. These were then stored in a
freezer and later sent to Fiona Hogan at Federation University. DNA analysis is still ongoing
based on previous work undertaken (Hogan & Cooke 2010; Hogan et al. 2008).
3.2 Results
3.2.1 Identifying breeding sites
The number of sightings increased as the reach of the project spread in the first two years
(Table 1). Subsequently the number of unique sightings decreased, not due to decreasing
records of Powerful Owls, but because only sightings of owls in new localities were recorded.
The results therefore indicate that, throughout the project, the distribution of observations
from the general public continued to expand.
The total number of breeding sites increased over the first three years of the project (Table
1). Most likely this is considered to have been driven by increased survey effort rather than a
The Powerful Owl Project: Conserving owls in Sydney’s urban landscape
20
true increase in breeding numbers of Powerful Owls. This is reflected in the similar number of
overall breeding sites in 2013 and 2014 (where volunteer numbers were similar).
Based on the amount of foraging habitat available (see Section 3.2.4), the density of
breeding sites within the analysis area was one territory per 569 ha of foraging habitat.
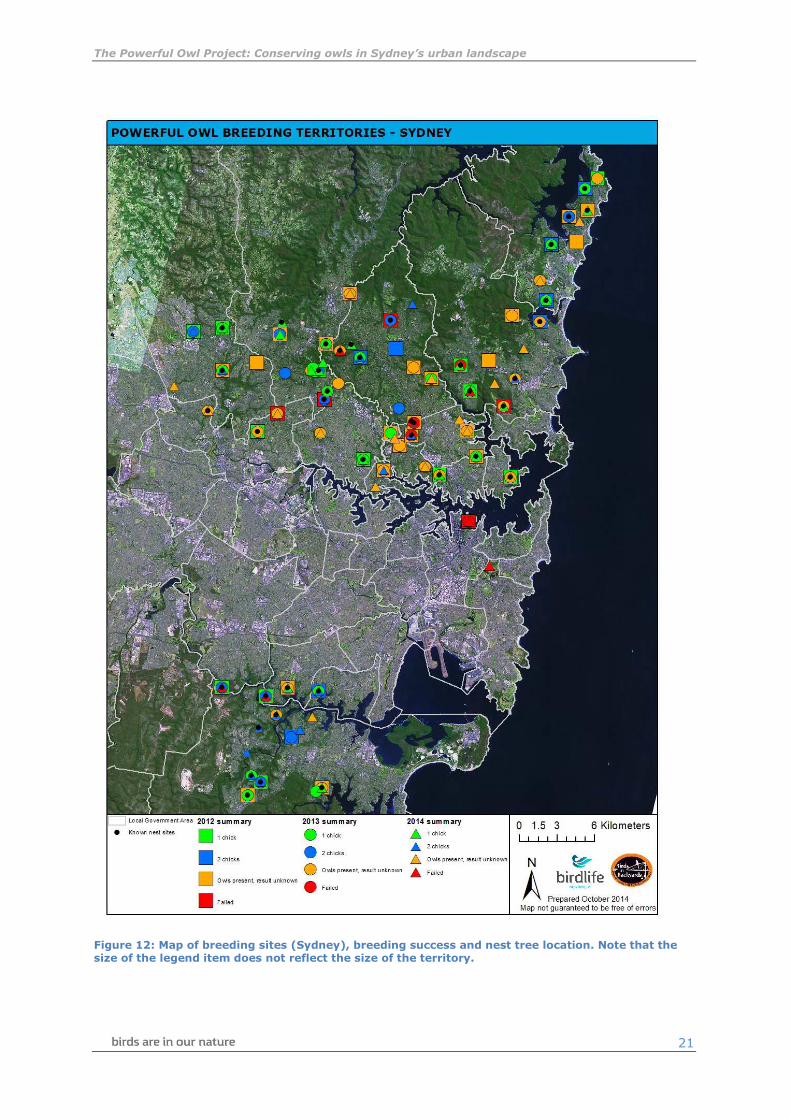
The average annual fledging rate in Sydney from 2011 to 2014 was 1.22 chicks. This was
similar to the annual fledging success of 1.28 chicks (51 fledglings from 40 breeding
attempts) reported by Kavanagh (2003). Figure 12 provides a map of the distribution of
breeding sites and nesting success in Sydney.
Breeding site data were collected to a lesser degree between the Central Coast and
Newcastle. Figure 13 provides a map of the distribution of breeding sites and nesting success
in this area. The average annual fledging rate in the Central Coast and Newcastle from 2012
to 2014 was 1.37.
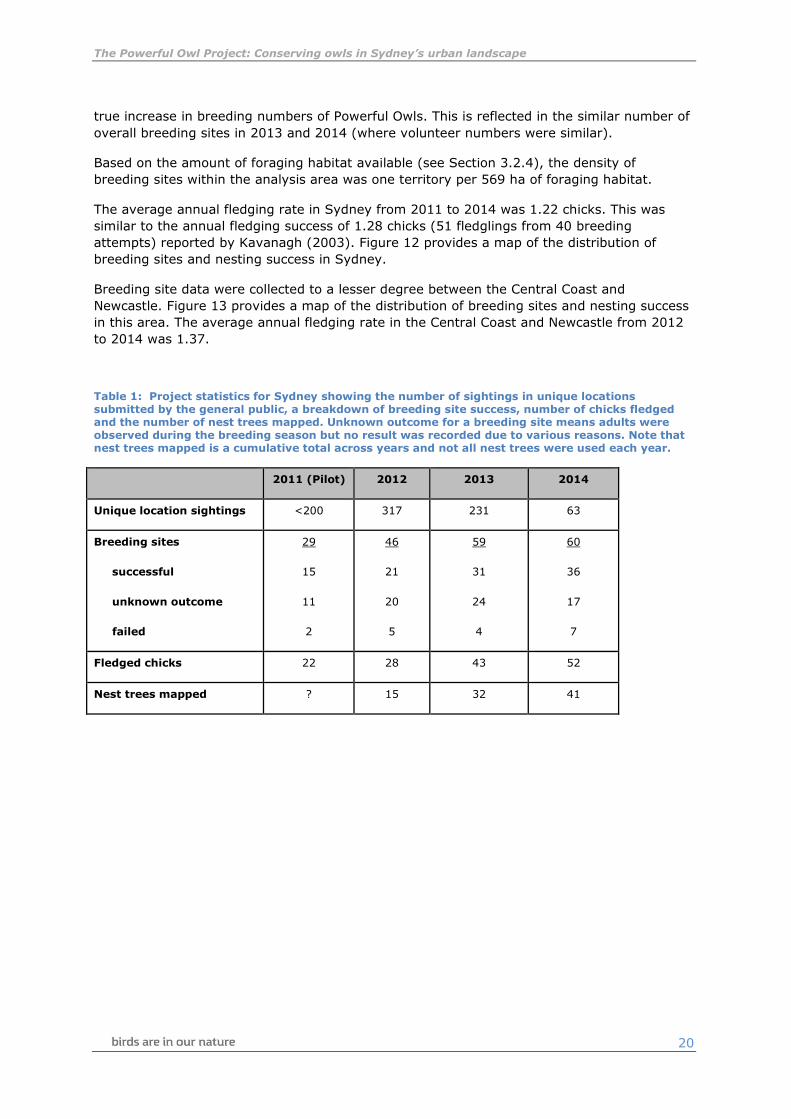
Table 1: Project statistics for Sydney showing the number of sightings in unique locations submitted by the general public, a breakdown of breeding site success, number of chicks fledged and the number of nest trees mapped. Unknown outcome for a breeding site means adults were observed during the breeding season but no result was recorded due to various reasons. Note that nest trees mapped is a cumulative total across years and not all nest trees were used each year.
2011 (Pilot) 2012 2013 2014
Unique location sightings <200 317 231 63
Breeding sites
successful
unknown outcome
failed
29
15
11
2
46
21
20
5
59
31
24
4
60
36
17
7
Fledged chicks 22 28 43 52
Nest trees mapped ? 15 32 41
The Powerful Owl Project: Conserving owls in Sydney’s urban landscape
21
Figure 12: Map of breeding sites (Sydney), breeding success and nest tree location. Note that the size of the legend item does not reflect the size of the territory.

The Powerful Owl Project: Conserving owls in Sydney’s urban landscape
22
Figure 13: Map of breeding sites (Central Coast and Newcastle), breeding success and nest tree location. Note that the size of the legend item does not reflect the size of the territory.

The Powerful Owl Project: Conserving owls in Sydney’s urban landscape
23
3.2.1 Owl timelines
The following data reports the timing of significant events during the breeding season (Table
2). The data represent a cumulative total of observations for all years. The number of
observations for each class of event is low and varies significantly due to the nature of the
monitoring by volunteers and their varying capacities, skill and motivation.
Powerful Owls were sighted in their breeding territories between early May and late October
(Table 2). Owls were first seen in their territories between early May and late July, considered
to be late and likely reflecting observer competence and availability. Pair bonding and
courting was seen between early May and mid-July, and mating occurred between mid-May
and mid-June, though there were not many records of mating (n = 3). Owls (gender
undetermined) were observed going into hollows between early May and mid-August, with
91% of records between early June and mid-August. Chicks were seen or heard inside their
hollow between mid-June and late September, with 65% of records between early August and
mid-September. Females were sighted outside of their hollows between early July and mid-
October, with 60% of records in early-to-mid August. Chicks were found to fledge between
mid-July to mid-October, with 70% of records between mid-August and late September.
Due to the variability in observer experience and availability, the most reliable data presented
here is considered to be that of the fledging date.
Table 2: Timeline of significant events in breeding season. Shading represents the number of confirmed observations that included specified dates ____ = 1 - 2, ____ = 3 - 5, ____ = 6 – 10 & ____ >10.
May
1st -
15th
May
16th -
31st
June
1st -
15th
June
16th -
30th
July
1st -
15th
July
16th -
31st
Aug
1st -
15th
Aug
16th -
31st
Sept
1st -
15th
Sept
16th -
30th
Oct
1st -
15th
Oct
16th -
31st
Owls seen (first
time)
Pair bonding
Mating
Owls seen going
to hollow
Chicks
seen/heard
inside hollow
Female out of hollow
Chicks fledged (out of hollow)
3.2.2 Diet composition
The composition of prey items identified in pellets collected during 2012 and 2013 in this
study was significantly different to that published by Kavanagh (2002a) on pellets collected in
the same region (χ 2=322.04, df=5, n=200, p<0.01). The main driver of this difference was
the higher proportion of Common Brushtail Possums in the current study (Figure 14).
The proportions of prey items identified in pellets varied significantly between the breeding
season and non-breeding season (χ 2=203.89, df=5, n=195, p<0.01). This difference was
driven by a decrease in Common Brushtail Possums and an increase in insects and birds in
the non-breeding season (Figure 15).

The Powerful Owl Project: Conserving owls in Sydney’s urban landscape
24
Figure 14: Proportion of prey items in pellets collected in urban locations by count.
Figure 15: Proportion of prey items by count in urban pellets between the breeding season (May-Oct) an non-breeding season (Nov-Apr).
3.2.3 Environmental variables
Mesic width
Mesic width averaged between 22 m and 30 m across the study area. Although it appeared
that the mesic width was wider in areas where owls were present as compared with the areas
where owls were not recorded or absent (Figure 16), this was not statistically significant
(F1,14=3.52, p=0.06).
0%
10%
20%
30%
40%
50%
60%
70%
80%
90%
100%
This study Kavanagh 2002
Unknown/other
Insects
Birds
Grey-headed Flying-fox
Brushtail Possum
Ringtail Possum
0%
10%
20%
30%
40%
50%
60%
70%
80%
90%
100%
May-Oct Nov-Apr
Unknown/other
Insects
Birds
Grey-headed Flying-fox
Brushtail Possum
Ringtail Possum

The Powerful Owl Project: Conserving owls in Sydney’s urban landscape
25
Figure 16: Average width of mesic vegetation between sites. Error bars show standard deviation
Vegetation structure
Figure 17 shows the vegetation structure across the study area. The PFC of the canopy and
sub-canopy was between 32% and 41% across all sites. The PFC of the understorey seemed
to be on average 12% to 17% greater in sites where owls were present, although this was
not significant (t30=2.04, p=0.07).
The analysis of similarities revealed that there was little difference in structure between all
the sites or within vegetation strata (p=0.75, Global R=-0.04). The MDS plot (Figure 18)
illustrated the similarity between all sites in terms of vegetation structure. There is some
suggestion that the sites where owls were present fall more to the right-hand side of the plot,
possibly driven by the higher PFC particularly in the understory an canopy in upper portions
of the sites (Figure 17).
Figure 17: Average percentage foliage cover of different vegetation strata. Error bars show standard deviation.
0.00
5.00
10.00
15.00
20.00
25.00
30.00
35.00
Owl Absent
Upper
Owl Absent
Lower
Owl Present
Upper
Owl Present
Lower
Me
sic
Wid
th (
m)
0.00
10.00
20.00
30.00
40.00
50.00
60.00
Owl Absent
Upper
Owl Absent
Lower
Owl Present
Upper
Owl Present
Lower
Pe
rce
nta
ge
Fo
lia
ge
Co
ve
r (%
)
Canopy Cover
Sub-canopy Cover
Understory Cover
The Powerful Owl Project: Conserving owls in Sydney’s urban landscape
26
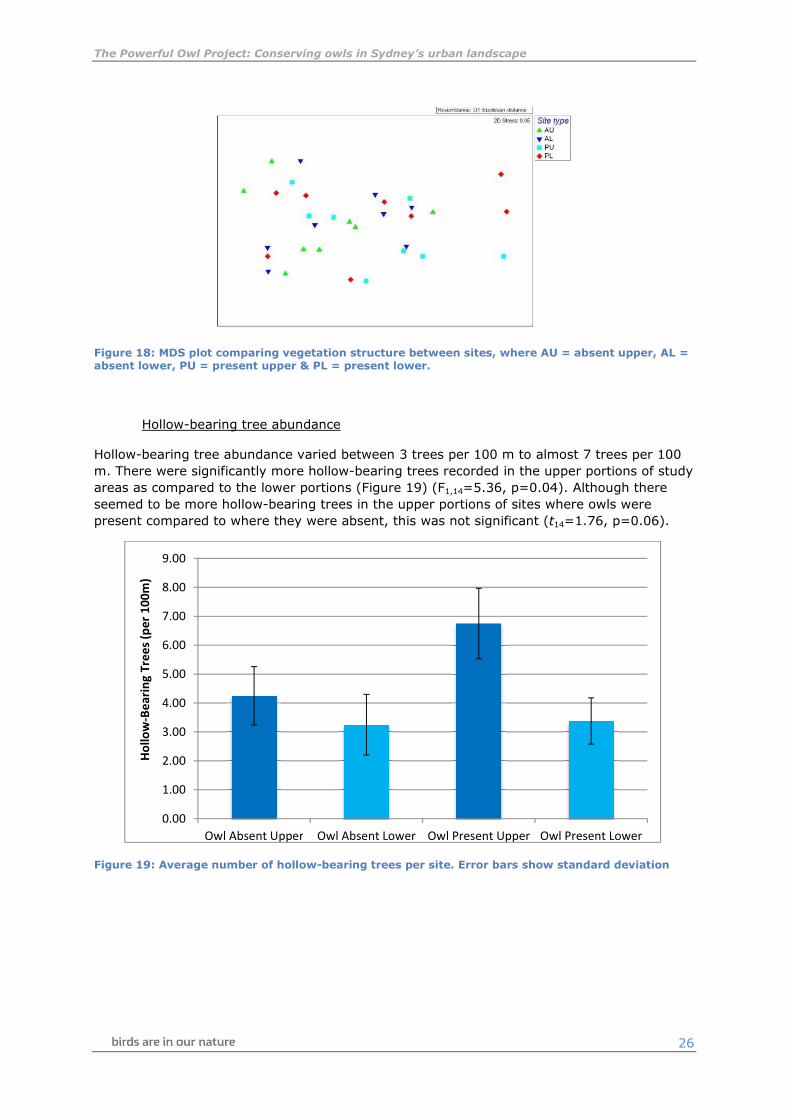
Figure 18: MDS plot comparing vegetation structure between sites, where AU = absent upper, AL = absent lower, PU = present upper & PL = present lower.
Hollow-bearing tree abundance
Hollow-bearing tree abundance varied between 3 trees per 100 m to almost 7 trees per 100
m. There were significantly more hollow-bearing trees recorded in the upper portions of study
areas as compared to the lower portions (Figure 19) (F1,14=5.36, p=0.04). Although there
seemed to be more hollow-bearing trees in the upper portions of sites where owls were
present compared to where they were absent, this was not significant (t14=1.76, p=0.06).
Figure 19: Average number of hollow-bearing trees per site. Error bars show standard deviation
0.00
1.00
2.00
3.00
4.00
5.00
6.00
7.00
8.00
9.00
Owl Absent Upper Owl Absent Lower Owl Present Upper Owl Present Lower
Ho
llo
w-B
ea
rin
g T
ree
s (p
er
10
0m
)

The Powerful Owl Project: Conserving owls in Sydney’s urban landscape
27
Dominant canopy tree species
Due to there being significantly more hollow-bearing trees in the upper portions of sites than
the lower, the dominant tree species were compared between these areas (Figure 20). As
expected, the results show a greater number of typical hollow-producing tree species higher
in the drainage lines and a more varied canopy composed of species more typical of more
protected, high moisture vegetation communities lower down in elevation.
Figure 20: Dominant canopy species in the upper and lower sub-sites. Total number of quadrats across all study sites.
Prey abundance
Unsurprisingly, more prey items were observed in areas with owls present than in areas
where owls were not recorded or absent (Figure 21) (t12=2.18, p=0.02). However, as sites
were only surveyed on a single occasion the inferential power of these results is limited.
Figure 21: Prey abundance. No error bars are presented as only one night of survey was undertaken
0
10
20
30
40
50
60
70
80
Nu
mb
er
of
qu
ad
rats
Upper
Lower
024
68
101214
1618
Qu
an
tity
(it
em
s/n
igh
t)
OWL
ABSENT
OWL
PRESENT

The Powerful Owl Project: Conserving owls in Sydney’s urban landscape
28
3.2.4 Landscape analysis
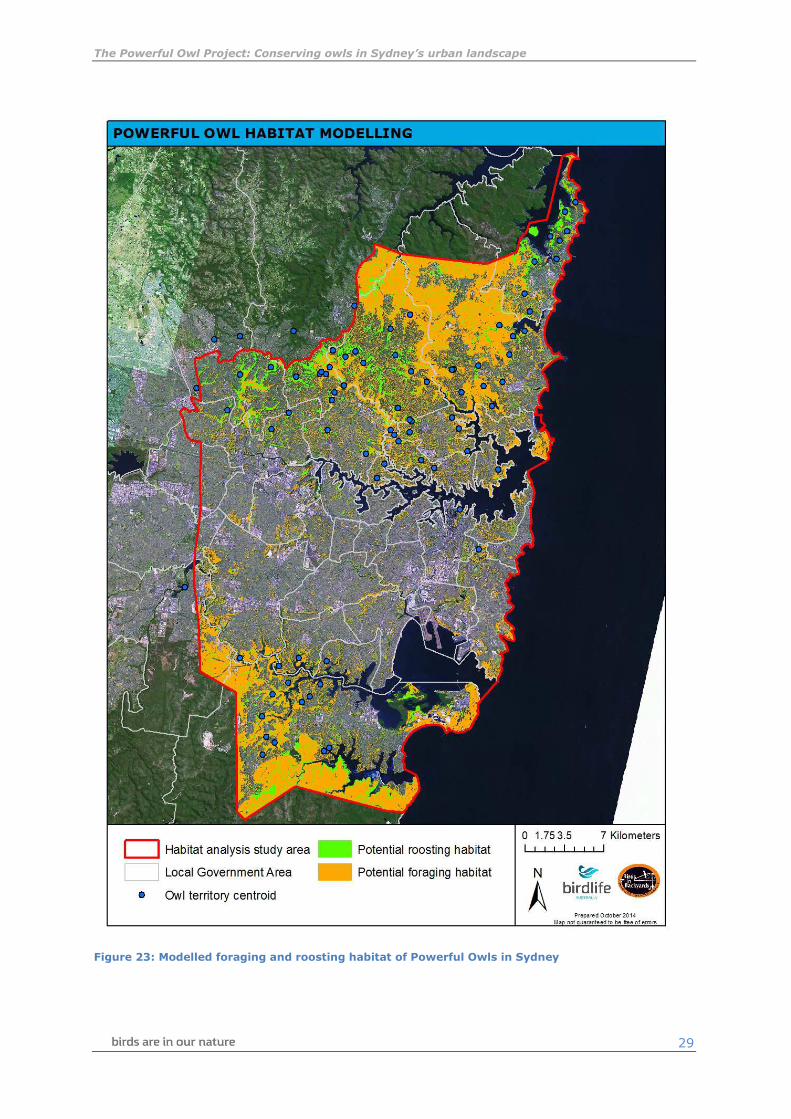
The roosting habitat analysis is considered to have over-estimated the true distribution of
roosting habitat. This is particularly so regarding the forested wetland vegetation and some of
the wet sclerophyll vegetation in the northern suburbs (Figure 23).
There was a negative relationship between foraging habitat area and the number of patches
(r=-0.7373, n=75, p<0.01) (Figure 22), with the number of patches decreasing as foraging
habitat area increased.
In total there was 34,150 ha of foraging habitat modelled (Figure 23) in 656 patches ranging
from 10,643 ha to 1 ha. The median area of foraging habitat for all territories was 488 ha and
the median number of habitat patches was three (Figure 22). Only 20% of territories (12)
had less than 286 ha of habitat in greater than 9 patches, with two of these being in locations
that were known not to breed.
Figure 22: Patchiness of foraging habitat for all territories with fledging success. Regarding fledging success; ‘no data’ represents those territories where owls were regularly seen in breeding season but no confirmation of a breeding attempt was recorded; and ‘<1’ includes sites where no nesting attempts were ever successful, despite mating being observed.
0
2
4
6
8
10
12
14
16
18
20
0 200 400 600 800 1000 1200
Nu
mb
er
of
pa
tch
es
Foraging area (ha)
>1
<1
No data
20th percentile (286)
Median (488)
Median (3)
80th percentile (9)
Fledging success
over study period
The Powerful Owl Project: Conserving owls in Sydney’s urban landscape
29
Figure 23: Modelled foraging and roosting habitat of Powerful Owls in Sydney
The Powerful Owl Project: Conserving owls in Sydney’s urban landscape
30
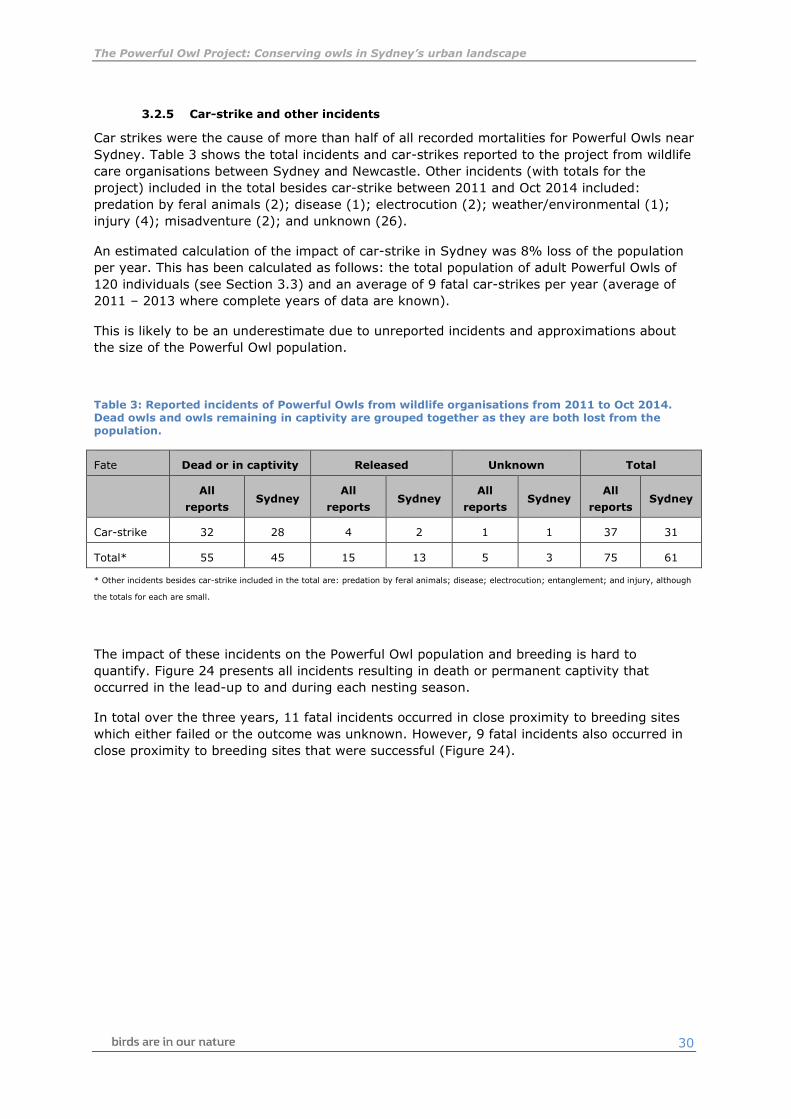
3.2.5 Car-strike and other incidents
Car strikes were the cause of more than half of all recorded mortalities for Powerful Owls near
Sydney. Table 3 shows the total incidents and car-strikes reported to the project from wildlife
care organisations between Sydney and Newcastle. Other incidents (with totals for the
project) included in the total besides car-strike between 2011 and Oct 2014 included:
predation by feral animals (2); disease (1); electrocution (2); weather/environmental (1);
injury (4); misadventure (2); and unknown (26).
An estimated calculation of the impact of car-strike in Sydney was 8% loss of the population
per year. This has been calculated as follows: the total population of adult Powerful Owls of
120 individuals (see Section 3.3) and an average of 9 fatal car-strikes per year (average of
2011 – 2013 where complete years of data are known).
This is likely to be an underestimate due to unreported incidents and approximations about
the size of the Powerful Owl population.
Table 3: Reported incidents of Powerful Owls from wildlife organisations from 2011 to Oct 2014. Dead owls and owls remaining in captivity are grouped together as they are both lost from the population.
Fate Dead or in captivity Released Unknown Total
All
reports Sydney
All
reports Sydney
All
reports Sydney
All
reports Sydney
Car-strike 32 28 4 2 1 1 37 31
Total* 55 45 15 13 5 3 75 61
* Other incidents besides car-strike included in the total are: predation by feral animals; disease; electrocution; entanglement; and injury, although
the totals for each are small.
The impact of these incidents on the Powerful Owl population and breeding is hard to
quantify. Figure 24 presents all incidents resulting in death or permanent captivity that
occurred in the lead-up to and during each nesting season.
In total over the three years, 11 fatal incidents occurred in close proximity to breeding sites
which either failed or the outcome was unknown. However, 9 fatal incidents also occurred in
close proximity to breeding sites that were successful (Figure 24).

The Powerful Owl Project: Conserving owls in Sydney’s urban landscape
31
Figure 24: Incidents resulting in death or permanent captivity in the lead up to or during nesting season (until fledging).

The Powerful Owl Project: Conserving owls in Sydney’s urban landscape
32
3.2.6 DNA
The DNA analysis work is still underway with Fiona Hogan at Federation University.
3.3 Discussion
Breeding sites in Sydney are concentrated in two main areas, the Hills District/northern
suburbs/northern beaches and the Sutherland/Hurstville area. The density of breeding sites
in these areas is high at 1/569 ha of modelled foraging habitat, with over 50% known to be
successful and a further 30% to 40% with an unknown outcome. These figures are
considered to be greater than in other urban areas such as Melbourne, where Powerful Owls
breed in only limited areas and seem to be intolerant of human disturbance to a larger
degree (Webster et al. 1999; Cooke et al. 2002). Nests sites in Sydney were commonly
located close to bushland walking tracks, and two nests that were successful each year were
even located in backyards albeit that backed onto significant bushland reserves.
Other curious examples of both disturbance and close human habitation were recorded. A
pair in Newcastle vacated a nesting site following significant disturbance from bird watching
activity during one season, only to subsequently nest in a tree within a heavily used picnic
area (closed at night) the following year. This pair successfully raised two chicks, although
they did not subsequently return to that site but returned to the original breeding location. In
Carlingford, a breeding pair (observed mating) received very high visitation from
photographers each year and vacated the area prior to laying. However, it is suspected that
this pair actually utilised a hollow in a neighbouring reserve, unbeknownst to the
photographers. Finally, a new pair in 2014 established a regular roosting site above a busy
café in Centennial Park in the middle of Sydney City. They were observed almost daily during
the breeding season and also seen mating, despite the high day time human activity.
Breeding was not ultimately recorded, although this is likely due to a lack of suitable hollows
rather than disturbance.
Both despite the human disturbance, and as result of the close proximity to humans allowing
ease of survey, valuable data has been collected on urban populations of Powerful Owls. The
total population of adult Powerful Owls within the Sydney urban landscape has been
estimated at 120. This has been calculated as follows:
• the breeding population of Powerful Owls in Sydney rounded to be 110 individuals
(average of 55 breeding sites in the last 3 years),
• plus an estimated additional 10% of non-breeding floaters (10)
The estimated number of non-breeding floaters is based on observations of ‘re-pairing’ where
breeding individuals have been killed, along with an examination of incident data. The
survivorship of juveniles and accurate estimation of floaters in the population is a key area of
future research.
The population estimate above suggests that there is in the order of 285 ha of foraging
habitat available per individual, although likely there is significant overlap in foraging ranges.
With estimated territory sizes in the order of 1256 ha, it would seem that the Sydney
population of Powerful Owls is at capacity and recruitment of juveniles into the breeding
population will only occur when established pairs break up. This breaking of a pair will likely
be due to death of one individual, although possibly also through rarely reported mate
competition as observed by one volunteer. Two males, one established male from the
previous year and an ‘intruder’ male were observed together in a breeding territory in May,

The Powerful Owl Project: Conserving owls in Sydney’s urban landscape
33
the start of the breeding season. Aggressive behaviour was observed between the two males
at about mid-morning, culminating in the previous year’s male flying away. By the afternoon
all had quietened down with the intruder roosting in proximity to the established female and
the previous year’s male nowhere to be seen.
There were 16 confirmed nesting failures from 2011 to 2014. At least two of these were
directly attributed to Sulphur-crested Cockatoos (Cacatua galerita) taking over the nesting
hollow prior to chicks fledging. Another two were highly suspected to be the result of
cockatoos also. Sulphur-crested Cockatoos were also known to ‘move into’ hollows almost on
the day of fledging in a number of other nests. Interestingly, one volunteer witnessed a male
Powerful Owl chasing cockatoos away from the nest hollow in the early evening just prior to
the chick fledging. It seems as though hollow-bearing trees are significant real estate in
Sydney and competition for them, particularly with increasing numbers of Sulphur-crested
Cockatoos, may be an ongoing concern for Powerful Owls.
Fledgling success has apparently remained stable over the last 10 years. Kavanagh (2003)
reported fledgling success of 1.28 in Sydney, and was recorded at 1.22 in this study. One
factor not taken into consideration with this calculation, however, is the number of breeding
sites with an unknown outcome. This unknown outcome is by in large due to the skill and
availability of volunteers to undertake comprehensive surveys.
Some aspects of breeding behaviour such as: mating; owls entering hollows; and chicks
being observed in hollows, seemed late compared with other published studies (Higgins
1999). However, chicks fledged from mid-July to mid-October in line with other observations
(Higgins 1999). The discrepancy in timing of early breeding season events is likely a factor of
volunteer observer competence rather than a true temporal shift in behaviour.
The variation in diet observed between Kavanagh (2002a) and this study along with the
change between seasons reflects the hunting strategy of the Powerful Owl. Both Kavanagh
(1988) and Cooke et al. (2006) postulated that the Powerful Owl is both a specialist hunter of
arboreal prey and also a generalist, by preying on the most available prey item within this
group. As was seen in this study, the change in proportions of dietary items likely reflects a
change in prey abundance in Sydney but may also be, as a result of high density, due to owl
territories increasingly being located within a variety of urban localities where the suitability
for prey species varies.
In a similar way, as the seasons change, so does the Powerful Owl diet. In regard to the
increases observed in winter with Common Brushtail Possums as prey, juveniles are often still
on their mother’s backs at this time or just recently weaned (Van Dyck & Strahan 2008),
making them ideal targets for Powerful Owls. Insects are prevalent at the time chicks are
maturing and several instances of chicks eating Christmas Beetles (Anoplognathus spp.) were
observed, an easy and nutritious prey to practice hunting. In the same way, birds are more
conspicuous in the environment in the warmer months and are an easy sleeping target for an
arboreal hunting owl at night. In addition, it is noted that birds form a larger part of the diet
of Powerful Owls closer to cleared areas (Bilney 2013), with obviously large cleared areas
throughout Sydney.
The assessment of environmental variables showed no surprises, although it did confirm
several assumptions used as part of the landscape assessment. Mesic widths in drainage lines
in the Powerful Owl distribution within Sydney were of the order of 30 m wide. Hollow-
bearing trees were more prevalent in the upper elevations of these drainage lines (Figure
19), corresponding to typical hollow-producing canopy species from dry sclerophyll and wet

The Powerful Owl Project: Conserving owls in Sydney’s urban landscape
34
sclerophyll forests in Sydney (Figure 20) and known nesting trees documented in Kavanagh
(2003).
The PFC of the understorey seemed to be greater in sites where owls were present, which
may represent a preference of some structural elements of vegetation by the owls. Within
Sydney the denser understory is often associated with a less dense sub-canopy, providing a
‘cathedral’ like structure anecdotally considered suitable for roosting. Increases in sub-canopy
density in the riparian mesic vegetation within Sydney can often be a result of invasive
species such as Privet (Ligustrum sp.) which may reduce the suitability of the area for
roosting. However, these assertions require further investigation to understand.
As previously discussed, the analysis of roosting habitat during the breeding season has over-
estimated the extent. However, it does provide a valuable coarse layer to focus attention on
important areas for Powerful Owls. To more accurately predict roosting habitat during the
breeding season, areas of known older age vegetation including large hollow-bearing trees
within the mapped roosting habitat distribution provide a valuable prediction for the species.
The landscape analysis indicates that foraging habitat for the Powerful Owl is widespread in
the ‘leafer’ suburbs of Sydney. In these areas backyard gardens and bushland reserves are
prevalent and prey availability is unlikely to be a limiting factor due to the high prevalence of
species such as Common Ringtail Possums in these areas. However, the availability of nesting
habitat with large hollow-bearing trees is likely a limiting factor. Areas lacking these
resources may create an ecological trap for some individuals that are attracted to the
available prey but do not contribute to the breeding population (Isaac, Cooke, et al. 2014).
The number of territories with large areas of foraging habitat but where little or no breeding
has been recorded provides collaborating evidence for this.
Car strike was estimated to impact 8% of the Sydney population per year and all reported
fatal incidents combined equated to 9% per year. Interestingly, when fatal incidents during
the breeding season were plotted against breeding success at adjacent sites (Figure 24),
there was an almost equal rate of successful breeding and not. As non-breeding floaters are
known in Powerful Owl populations in Sydney (McNabb et al. 2007), it is likely that a
proportion of these fatalities are non-breeding individuals, possibly sub-adults or non-
breeding adults. Alternatively, or in conjunction, McNabb et al. (2007) observed a recently
widowed Powerful Owl pair with a younger owl, suggesting any fatalities within a breeding
pair in the lead up to the breeding season may be replaced by nearby non-breeding
individuals.
In any case, the loss of at least 9% of the population to largely human created threats
suggests the need for management of these threats in urban planning and land management
(Isaac, et al. 2014).
Although Powerful Owls are surviving in Sydney’s urban areas, increasing urbanisation is
continuing to impact on their long-term persistence (Isaac et al. 2013). Current urbanisation
typically results in smaller lot sizes, reduction in the size of backyards, increased traffic,
encroachment into bushland and the ‘cleaning up’ of natural areas with the removal of
‘dangerous’ trees containing hollow branches. These factors slowly reduce the suitability for
Powerful Owls which, despite the ecological imperative to conserve, are at present an
important and engaging part of the environment for local communities.

The Powerful Owl Project: Conserving owls in Sydney’s urban landscape
35
4. Education and Outreach
Education for all sectors of the community was a core component of the project. Avenues to
engage different sectors of the community involved talks, media, web-based resources,
school education, and participation in scientific conferences. Resources were also developed
and disseminated to land managers to improve their ability to manage the species.
4.1 Education
Community involvement and education has been a large focus of the project. The opportunity
to utilise this iconic species to engage the community in urban conservation is far reaching.
Education was undertaken through a number of avenues and with a number of different
audiences. Education focused on various subject matters such as the Powerful Owls
themselves, the project and urban conservation. Educational opportunities took the form of:
community talks; media articles and radio interviews; children’s television; community
workshops; newsletters; a schools program; conference talks; and web-based resources.
From 2012 to 2014, educational resources reached 2400 people face to face and an
estimated audience of >1,000,000 people through media avenues.
Community talks
Twenty two talks were given over the course of the project to bird clubs, community groups
and at local government environmental days.
Media articles and radio interviews
Seven articles were published in local and regional newspapers; articles were published in
Australian Geographic and BirdLife magazines; and three radio interviews were conducted
with ABC local radio.
Children’s television
The Powerful Owl Project was featured in series 2, episode 23 of the successful ABC3
television program ‘Bushwacked’. This involved filming owls, their habitat and a staged
survey for the species, including evidence for the presence of the owls.
Community workshops
Seven survey workshops were undertaken which focused on training volunteers but were also
open to other members of the community. Two workshops were also held that were open to
anyone in the community on the topic of dietary analysis of regurgitated pellets.

The Powerful Owl Project: Conserving owls in Sydney’s urban landscape
36
Pellet analysis workshop. David Bain
Newsletters
Annual newsletters were distributed at the end of each breeding season to volunteers, land
managers and interested parties. These provided an update and overview of the season’s
results and what had been happening in the project.
Schools program
Gibberagong Environmental Education Centre lead a partnership with The Powerful Owl
Project, Taronga Zoo and Habitat Stepping Stones to deliver a schools program focused on
the Powerful Owl. Each year the program involved four primary schools, one high school and
approximately 350-400 students.
Primary school students were mentored through the program by high school students. The
program consisted of a number of stages including: Powerful Owl expert days; a night at
Taronga Zoo meeting their owls and other animals; habitat days at the school; and a final
expo to showcase student projects on Powerful Owl conservation in their local area to the
public. The habitat days involved walks through known Powerful Owl habitat, assessing and
adding value to habitat at the school and a pellet analysis workshop.
Conference talks
The project was presented at three scientific conferences: the 2013 Australian Raptor
Association Conference; the 2013 Australasian Ornithological Conference; and the 2014
Australian Bird Study Association Conference.
Web-based resources
Two web-based resources were developed during the project. These included: a short nine
minute documentary on Powerful Owls, their ecology and conservation; and edited nest

The Powerful Owl Project: Conserving owls in Sydney’s urban landscape
37
camera footage showing a full breeding season at one nest site. These resources were hosted
on the BIBY website, in conjunction with more general information on the Powerful Owl.
A Facebook page has also been running (https://www.facebook.com/ThePowerfulOwlProject),
created and lead by Kristen Hardy. To date the page is ‘liked’ by over 600 people and has
reached over 135,000 people.
Powerful Owl schools program. David Bain

The Powerful Owl Project: Conserving owls in Sydney’s urban landscape
38
4.2 Land manager resources
The project has worked with 33 land managers including 22 local councils, nine National
Parks, the Royal Botanic Gardens and the Centennial Park Trust. These bodies have been
consulted regarding many topics ranging from access to specific management issues for the
Powerful Owl.
Following every breeding season, land managers have been provided with a summary of
nesting success and locations in their jurisdiction and a discussion of the breeding season in
general.
All records of Powerful Owls have been submitted to the NSW Wildlife Atlas.
The project was involved in a number of workshops relating to land management and
Powerful Owl conservation. A number of sites in Powerful Owl territories in Sydney were the
subject of urban services works such as water and sewerage services upgrades and powerline
easement management. Discussions relating to the timing of works to avoid disturbance to
breeding owls, including proposals to conduct fuel reduction burning nearby, were
successfully undertaken.
A workshop held by Lake Macquarie City Council on management guidelines for all the
threatened owls found in the local government area was attended. This workshop brought
together a number of owl experts from across NSW and resulted in the production of the
Interim Lake Macquarie Large Forest Owl Planning and Management Guidelines (LMCC 2014).
Successful consultation with land managers in relation to a hazard reduction burning in a
breeding site was undertaken. The result was an altered burn plan focusing on avoiding the
nesting season and providing security and escape routes for the owls. Owls were also located
prior to, and monitored during the burn. Unexpectedly, the fledglings continued to be fed by
a parent during the operation right on the edge of the burn area about 20 m from a fire
tanker with flashing lights and pumps going. Post-fire the whole family left the area, likely in
search of better hunting grounds. Surprisingly, seven months later the adults returned to the
same nest tree and successfully bred. However, the next year following, the adults failed to
breed.
Post-fire response by Powerful Owls has been investigated in Victoria and in NSW. Results
have suggested that post-fire recovery can be variable depending on circumstances.
Generally recovery takes more than three years as a result of one or a combination of
impacts including death, displacement, loss of hollow-bearing trees and slow arboreal prey
recovery (Willig & Atkins 2013). In south-eastern NSW, a significant increase was recorded in
the distribution and abundance of the Powerful Owl approximately 15 years after major
disturbance caused by intensive logging and wildfire. Site-occupancy by this owl continued to
increase until approximately 25 years after disturbance and then to decrease substantially,
coinciding with marked changes in the distribution and abundance of its principal prey species
in the region, the Common Ringtail Possum. The rapid increase in numbers of this possum
within a decade of major disturbance, and its subsequent steady decline thereafter,
suggested the existence of a classic predator-prey response by the owls (Kavanagh and
Stanton 2013).
Guidelines have been produced for land managers. These are aimed at guiding them on
issues relating to Powerful Owl ecology as well as survey, land management and development
issues (Chapter 5.3 and Appendix A).
The Powerful Owl Project: Conserving owls in Sydney’s urban landscape
39
5. Outcomes & Recommendations
The project has been successful in participating with and engaging the community and
exposing them to the values of our urban bushland remnants. Increased understanding of the
Powerful Owl has been achieved utilising citizen science, benefitting both researchers and the
community. This has driven the development of management recommendations for the
continued survival of Powerful Owls in Sydney and other urban areas.
5.1 Volunteers and citizen science
The numbers of volunteers steadily increased over the course of the project, with a number
of key volunteers participating for multiple years. There are benefits for both projects and
volunteers through the participation in citizen science projects. Projects gain through having
a large labour base to collect information, over large geographical ranges. Volunteers benefit
through a feeling of contribution to science and knowledge and engaging in activities that
they have an interest in. There are important considerations for any citizen science project in
relation to the use of volunteers from the wider community:
• projects should sufficiently consider timescales of projects, to ensure the required
effort from volunteers matches realistic recruitment timeframes,
• volunteers should be regularly engaged, through project updates and correspondence
to maintain their engagement with the project, motivation to continue and
acknowledgement of efforts,
• the tasks or data that is the responsibility of volunteers to collect should reflect the
experience and availability of volunteers to collect.
There are large numbers of bird watchers in the community that are not involved in bird
organisations, and, for BirdLife Australia, this provides a great audience to approach.
Understanding how to engage these people with the organisation will serve to benefit both
the community, through increased awareness and exposure to issues relating to birds, and
for BirdLife in tapping into a large knowledge base and potential membership which
ultimately provides a more comprehensive voice on bird conservation. One obvious
opportunity may be to offer a discounted or bonus membership to volunteers who participate
in projects.
5.2 Community
Community interest in the project steadily grew from year to year with a significant increase
in engagement in the last two years. Engagement occurred through various avenues from
word of mouth from volunteering opportunities and free educational talks and workshops to
collaboration with other community groups, newspaper and magazine articles, radio
interviews and television coverage. This wide and varied engagement repertoire ensured a
broad audience for the project. Another important aspect was the identification of key
engaged individuals who have the motivation and capacity to spread the message of the
project.
Key lessons were the need for sustained communication within the community about the
project. Events, news articles and social media all play a role in keeping the community
engaged. In addition, providing the community with the information and capacity so they can

The Powerful Owl Project: Conserving owls in Sydney’s urban landscape
40
implement actions at home or in their local area provides ownership and attachment to place
that is critical to ensuring long-term local conservation outcomes.
The long-term goals of any community project need to be aligned with capacity building and
long-term outlook for a community.
5.3 Urban Powerful Owl management
The project has delivered important results, providing a rigorous understanding of how many
Powerful Owls are within the Sydney urban area and what areas they are utilising. This vital
information provides key focal data for land managers to better ensure their conservation.
Some of the key data that has been gathered within the project includes:
• maps of nest sites, breeding success and habitat utilisation,
• understanding of threats present in the urban area, such as car-strike, hazard
reduction burning, hollow-bearing tree competition and maintenance of prey
populations.
From this information and discussions with land managers, key management
recommendations have been formulated and are provided in Appendix A. These
recommendations cover:
• location, area and type of habitat present,
• areas of habitat critical to maintain for the maintenance of Powerful Owl,
• guidelines for land management including development, hazard reduction burning and
services works,
• key survey protocols to ensure adequate and focused effort.
The conservation of owls in urban areas requires the protection of extensive bushland areas
from urban and rural development. In particular the major forested gully systems which
provide essential nesting and roosting habitat for the Powerful Owl. Some important
questions remain unanswered such as; juvenile survivorship and number of non-breeding
individuals in the population; and, the role of fire frequency and weed control, both directly
on Powerful Owls but also indirectly with regard to impacts on important prey species.

The Powerful Owl Project: Conserving owls in Sydney’s urban landscape
41
6. Conclusions
The Powerful Owl Project has been successful in achieving its outcomes. The three year
project has achieved significant results on minimal funding.
The project has engaged widely with the community, with over 300 volunteers in systematic
surveys of the species throughout the study area, direct communication with 2500 people
through community talks, educational programs and events and indirect communication with
more than 1,000,000 people through various media channels.
The location of key owl breeding sites, measuring breeding success and modelling habitat at
those sites has provided valuable baseline data for management. Information has been
widely disseminated to land managers in a clear and direct manner to enable integration with
existing management actions.
Based on the level of success, the project has a continuing role to play in the conservation of
Powerful Owls and the promotion of urban conservation. The future of the project will require
continued funding, although the motivation of a number of volunteers will ensure ongoing
monitoring of several sites regardless of the status of the project.

The Powerful Owl Project: Conserving owls in Sydney’s urban landscape
42
References
Bilney, R.J., 2013. Geographic variation in the diet of the powerful owl (Ninox strenua) at a local scale. Australian Journal of Zoology, 61(5), pp.372–378. Available at: http://www.publish.csiro.au/?paper=ZO13048.
Bilney, R.J., 2013. Home-range , diet and breeding of a Powerful Owl Ninox strenua in East Gippsland , Victoria. Australian Field Ornithology, 30, pp.40–46.
Catling, P., Burt, R.. & Kooyman, R., 1997. A Comparison of Techniques Used in a Survey of the Ground-dwelling and Arboreal Mammals in Forests in North-eastern New South Wales. Wildlife Research, 24, pp.417–432.
Clarke, K.R. and Gorley, R.N. (2006). Primer v6 User Manual/Tutorial. Primer-E Ltd., Plymouth, UK.
Cooke, R., Wallis, R., Hogan, F., White, J. & Webster, A., 2006. The diet of powerful owls (Ninox strenua) and prey availability in a continuum of habitats from disturbed urban fringe to protected forest environments in south-eastern Australia. Wildlife Research, 33(3), pp.199–206.
Cooke, R., Wallis, R. & Webster, A., 2002. Urbanisation and the ecology of Powerful Owls Ninox strenua in outer Melbourne, Victoria. In I. Newton et al., eds. Ecology and
Conservation of Owls. Collingwood, Victoria: CSIRO Publishing. Cooper, C.B., Shirk, J. & Zuckerberg, B., 2014. The invisible prevalence of citizen science in
global research: migratory birds and climate change. PloS one, 9(9), p.e106508. Available at: http://www.ncbi.nlm.nih.gov/pubmed/25184755 [Accessed September 5, 2014].
Garnett, S.T. & Crowley, G.M., 2000. The Action Plan for Australian Birds 2000, Canberra: Environment Australia.
Havens, K. & Henderson, S., 2013. Citizen Science Takes Root. American Scientist, (5). Available at: http://www.americanscientist.org/issues/feature/2013/5/citizen-science-takes-root.
Haywood, B.T., 2010. The Powerful Owl , Ninox strenua ( Strigidae ), in South Australia. South Australian Ornithologist, 36, pp.1–8.
Higgins, P.J., 1999. Handbook of Australian, New Zealand and Antarctic Birds. Vol 4: Parrots
to Dollarbird, Melbourne: Oxford University Press. Hogan, F. & Cooke, R., 2010. Insights into the breeding behaviour and dispersal of the
Powerful Owl ( Ninox strenua ) through the collection of shed feathers. Emu, 110(2), pp.178–184. Available at: http://www.publish.csiro.au/?paper=MU09116.
Hogan, F.E., Cooke, R., Burridge, C.P. & Norman, J. a, 2008. Optimizing the use of shed feathers for genetic analysis. Molecular Ecology Resources, 8(3), pp.561–567. Available at: http://www.ncbi.nlm.nih.gov/pubmed/21585833 [Accessed May 19, 2014].
Isaac, B., Cooke, R., Ierodiaconou, D. & White, J., 2014. Does urbanization have the potential to create an ecological trap for powerful owls ( Ninox strenua )? Biological
Conservation, 176, pp.1–11. Available at: http://dx.doi.org/10.1016/j.biocon.2014.04.013.
Isaac, B., White, J., Ierodiaconou, D. & Cooke, R., 2013. Response of a cryptic apex predator to a complete urban to forest gradient. Wildlife Research, 40, pp.427–436.
Isaac, B., White, J., Ierodiaconou, D. & Cooke, R., 2014. Urban to forest gradients : Suitability for hollow bearing trees and implications for obligate hollow nesters. Austral
Ecology, doi:10.111, pp.1–10. Kavanagh, R.P., 2002a. Comparative diets of the Powerful Owl (Ninox strenua), Sooty Owl
(Tyto tenebricosa) and Masked Owl (Tyto novahollandiae) in southeastern Australia. In I. Newton, R. Kavanagh, J. Olsen and I. Taylor, eds. Ecology and Conservation of Owls. Collingwood, Victoria: CSIRO Publishing, pp. 175–191. https://www.academia.edu/8971009/Comparative_diets_of_the_Powerful_Owl_Ninox_strenua_Sooty_Owl_Tyto_tenebricosa_and_Masked_Owl_Tyto_novaehollandiae_in_southeastern_Australia [Accessed October 2014].
Kavanagh, R.P., 2002b. Conservation and management of large forest owls in southeastern Australia. In I. Newton, R. Kavanagh, J. Olsen and I. Taylor, eds. Ecology and

The Powerful Owl Project: Conserving owls in Sydney’s urban landscape
43
Conservation of Owls. Collingwood, Victoria: CSIRO Publishing, pp. 201–219. https://www.academia.edu/8971184/Conservation_and_management_of_large_forest_owls_in_southeastern_Australia [Accessed October 2014].
Kavanagh, R., 2003. Conserving owls in Sydney’s urban bushland: current status and requirements. In D. Lunney & S. Burgin, eds. Urban wildlife: more than meets the eye. Mosman, pp. 93–108. Available at: https://www.academia.edu/8971295/Conserving_owls_in_Sydney_s_urban_bushland_current_status_and_requirements [Accessed October 2014].
Kavanagh, R.P., 1988. The impact of predation by the powerful owl, Ninox strenua, on a population of the greater glider, Petauroides volans. Australian Journal of Ecology, 13(4), pp.445–450.
Kavanagh, R. and Stanton, M. (2013). Successional changes in habitat quality for forest owls and arboreal marsupials following intensive logging and wildfire in south eastern New South Wales. Australasian Raptor Association National Conference, Adelaide. August 2013.
Keith, D.A., 2004. Ocean shores to desert dunes: the native vegetation of New South Wales
and the ACT, Hurstville, Sydney: NSW Department of Environment and Conservation. LMCC 2014. Interim Lake Macquarie Large Forest Owl Planning Management Guidelines.
Prepared By Lake Macquarie City Council, Speers Point. Lavazanian, E., 1996. Diet and Habitat of the Powerful Owl ( Ninox strenua ) Living Near
Melbourne. Deakin University. McDonanld, R., Isbell, R., Speight, J., Walker, J. & Hopkins, M., 1998. Australian soil and land
survey: field handbook, Canberra: CSIRO Publishing. McNabb, E.G., Kavanagh, R.P. & Craig, S.A., 2007. Further observations on the breeding
biology of the Powerful Owl Ninox strenua in south-eastern Australia. Corella, 31(1), pp.6–9.
OEH 2013. The Native Vegetation of the Sydney Metropolitan Area. Office of Environment and Heritage, Department of Premier and Cabinet, Sydney.
Ruette, S., Stahl, P. & Albaret, M., 2003. Applying distance sampling methods to spotlight counts of red foxes. Journal of Applied Ecology, 40(1), pp.32–43.
Simpson, K. & Day, N., 1996. Field Guide to the Birds of Australia, Melbourne: Viking Penguin Books Australia Ltd.
Smyth, A., MacNally, R. & Lamb, D., 2002. Comparative influence of forest management and habitat structural factors on the abundances of hollow nesting bird species in subtropical Australian eucalypt forest. Environmental Management, 30(4), pp.547–559.
Soderquist, T. & Gibbons, D., 2007. Home-range of the Powerful Owl ( Ninox strenua ) in dry sclerophyll forest. Emu, 107, pp.177–184.
Szabo, J.K., Fuller, R. a. & Possingham, H.P., 2012. A comparison of estimates of relative abundance from a weakly structured mass-participation bird atlas survey and a robustly designed monitoring scheme. Ibis, 154(3), pp.468–479. Available at: http://doi.wiley.com/10.1111/j.1474-919X.2012.01229.x [Accessed May 19, 2014].
Tozer, M., 2003. The native vegetation of the Cumberland Plain, western Sydney: systematic classification and field identification of communities. Cunninghamia, 8(1), pp.1–75.
Triggs, B. & Brunner, H., 2002. HairID. CSIRO Publishing Tulloch, A.I.T., Possingham, H.P., Joseph, L.N., Szabo, J. & Martin, T.G., 2013. Realising the
full potential of citizen science monitoring programs. Biological Conservation, 165, pp.128–138. Available at: http://linkinghub.elsevier.com/retrieve/pii/S0006320713001754 [Accessed April 28, 2014].
Van Dyck, S. & Strahan, R., 2008. The Mammals of Australia 3rd ed., Reed New Holland. Walker, J. & Hopkins, M., 1990. Vegetation. In Australian Soil and Land Survey Field
Handbook. Canberra: Department of Primary Industries & CSIRO. Webster, A., Cooke, R., Jameson, G., Wallis, R., Resources, N., Region, P.P. & Hill, B., 1999.
Diet, roosts and breeding of Powerful Owls Ninox strenua in a disturbed, urban environment: A case for cannibalism? Or a case of infanticide? Emu, 99, pp.80–83.

The Powerful Owl Project: Conserving owls in Sydney’s urban landscape
44
Willig, R. & Atkins, S., 2013. Monitoring owls in South Gippsland after bushfire: Black
Saturday Victoria 2009 – Natural values fire recovery program, East Melbourne, Victoria.

The Powerful Owl Project: Conserving owls in Sydney’s urban landscape
45
Appendix A: Land Manager Guidelines
See following two pages

The Powerful Owl Project: Conserving owls in Sydney’s urban landscape
46

The Powerful Owl Project: Conserving owls in Sydney’s urban landscape
47

The Powerful Owl Project: Conserving owls in Sydney’s urban landscape
48
BirdLife Australia
Suite 2-05 60 Leicester Street Carlton VIC 3053
T 03 9347 0757 F 03 9347 9323
[email protected] birdlife.org.au
Birds In Backyards
Building 133 1 Jamieson Street Sydney Olympic Park NSW 2127
T 02 9647 1875 F 02 9647 2030
[email protected] birdsinbackyards.net


![The OWL Reasoner Evaluation (ORE) 2015 Competition Report · 456 B. Parsia et al. [2,18]. The three profiles introduced in OWL 2 (called OWL EL, OWL QL, and OWL RL) [26] correspond](https://static.fdocuments.us/doc/165x107/5f25a4c7c6651123655ae814/the-owl-reasoner-evaluation-ore-2015-competition-report-456-b-parsia-et-al-218.jpg)