The Power of Partnership: American Regions Collaborating for Economic Competitiveness
146
The Power of Partnership: American Regions Collaborating for Economic Competitiveness 2009 Generation I WIRED Interim Evaluation Report August 21, 2009 Submitted to: U.S. Department of Labor, ETA/OGCM Office of Policy Development and Research 200 Constitution Avenue, NW Room N-5641 Washington, D.C. 20210 Submitted by: Berkeley Policy Associates 440 Grand Avenue, Suite 500 Oakland, California 94610 BPA #830
-
Upload
api-25885483 -
Category
Documents
-
view
69 -
download
5
Transcript of The Power of Partnership: American Regions Collaborating for Economic Competitiveness
The Power of Partnership: American Regions Collaborating for Economic Competitiveness 2009 Generation I WIRED Interim Evaluation Report August 21, 2009 Submitted to:
U.S. Department of Labor, ETA/OGCM Office of Policy Development and Research 200 Constitution Avenue, NW Room N-5641 Washington, D.C. 20210 Submitted by: Berkeley Policy Associates 440 Grand Avenue, Suite 500 Oakland, California 94610 BPA #830

B e r k e l e y P o l i c y A s s o c i a t e s
Authors of this Report
Sherry Almandsmith, Project Director Mary Walshok, Ph.D., Principal Investigator
Kay Magill, Ph.D., Site Visit Task Leader Linda Toms Barker, Survey Task Leader
Pamela Surko, Ph.D., Analysis of Existing Data Task Leader Mary Vencill Tommy Smith Hannah Betesh
David Drury Tricia Cambron
Kristina Lara Thomas Goldring
This project has been funded, either wholly or in part, with Federal funds from the Department of Labor, Employment and Training Administration under Contract Number DOLJ071A20438. The contents of this publication do not necessarily reflect the views or policies of the Department of Labor, nor does mention of trade names, commercial products, or organizations imply endorsement of it by the U.S. Government.
B e r k e l e y P o l i c y A s s o c i a t e s
Acknowledgements This report was made possible by the assistance of many people. Eileen Pederson of ETA provided critical information, assistance, and guidance, and was instrumental in serving as a liaison among all those involved in this work. We wish to thank all those at ETA who participated in our assessment, including the ETA Leads for giving the evaluation team background information on the regions as well as their insights. We owe a special thanks to all of the staff, partners, and stakeholders in the 13 Generation I regions. The professionals we visited at each of the regions welcomed us and were generous with their time, information, and ideas.

B e r k e l e y P o l i c y A s s o c i a t e s
B e r k e l e y P o l i c y A s s o c i a t e s
TABLE OF CONTENTS
Executive Summary ....................................................................................................................... i Key Findings ......................................................................................................................................... iii Next Steps ......................................................................................................................................... viii
Chapter 1: Introduction ............................................................................................................1 Generation I Regions and Goals ............................................................................................................. 2 Evaluation of the Initiative ..................................................................................................................... 6 Contents of this Report ........................................................................................................................... 9
Chapter 2: Changes in Context and Governance .................................................................10 The Evolving Context for Generation I Regions .................................................................................. 10 Governance ................................................................................................................................ 15 Conclusion .......................................................................................................................................... 25
Chapter 3: Partnerships and Collaboration .........................................................................26 Partnerships and Partner Roles ............................................................................................................ 26 Strategies for Fostering Collaboration .................................................................................................. 35 Social Network Analysis ...................................................................................................................... 39 Conclusion: Partnership and Collaboration Foster Global Competitiveness ....................................... 50
Chapter 4: Strategies, Activities, and Funding .....................................................................59 Regional Strategies and Activities ........................................................................................................ 59 Funding of the Initiative ....................................................................................................................... 76 Summary .......................................................................................................................................... 83
Chapter 5: Progress Reported by Generation I Regions .....................................................85 Initiative and Regional Metrics ............................................................................................................ 85 Innovation Transformation ................................................................................................................... 93 Progress Toward Regionalism in Generation I Regions ...................................................................... 98 Sustainability ...................................................................................................................................... 102 Summary ........................................................................................................................................ 107
Chapter 6: Quantitative Measures of Progress: Changes in Extant Data Measures for the Generation I Regions ...........................................................................................................108
Introduction ........................................................................................................................................ 108 Data Sources ....................................................................................................................................... 109 Summary of Incremental Changes in Extant Data Measures ............................................................ 110
Chapter 7: Workforce Investment System Transformation .............................................112 The Initiative and Workforce System Transformation ....................................................................... 113 Progress toward Workforce System Transformation ........................................................................ 115 Challenges to Workforce System Transformation ............................................................................. 122 Summary ........................................................................................................................................ 124
Chapter 8: Conclusions and Observations ..........................................................................125 Regionalism ........................................................................................................................................ 126 Transformation in the Workforce System .......................................................................................... 127 Leadership ........................................................................................................................................ 128 Sustainability ...................................................................................................................................... 129 Next Steps ........................................................................................................................................ 129
B e r k e l e y P o l i c y A s s o c i a t e s
Appendices Appendix A: Site Visit Highlights from Generation I Regions ................................................. A-1 Appendix B: Generation I Regions’ Goals .................................................................................B-1 Appendix C: Early Implementation of Generation I Regions ....................................................C-1 Appendix D: Supplementary Quantitative Data on Generation I Regions ................................. D-1

B e r k e l e y P o l i c y A s s o c i a t e s
LIST OF FIGURES Figure 1.1 Generation I Regions ...............................................................................................4 Figure 1.2 Map of Generation I Regions ...................................................................................5 Figure 1.3 Analytical Framework for Evaluation .....................................................................8 Figure 2.1 Changes in Governance Structures Since Summer 2007 .......................................18 Figure 2.2 Metro Denver Initiative’s Transition to “Phase 2” ................................................21 Figure 2.3 Generation I Regions’ Structures for Management and Decision Making ............22 Figure 2.4 North Central Indiana’s Three Leaders ..................................................................24 Figure 3.1 The NCI Regional Compact...................................................................................38 Figure 3.2 Type of Organizations in Regional Networks .......................................................42 Figure 3.3 Type of Organizations of Site Visit Respondents ..................................................43 Figure 3.4 Organizational Roles in Regional Networks ..........................................................43 Figure 3.5 Organizational Roles of Site Visit Respondents ....................................................44 Figure 3.6 Proportion of Contacts at Each Organizational Level within Collaborating Organizations ..................................................................................45 Figure 3.7 Frequency of Contact in Regional Networks .........................................................45 Figure 3.8 2008 WAEM SNA Map .........................................................................................52 Figure 3.9 2008 California Corridor SNA Map ......................................................................52 Figure 3.10 2008 Metro Denver SNA Map ...............................................................................53 Figure 3.11 2008 Northwest Florida SNA Map ........................................................................53 Figure 3.12 2008 North Central Indiana SNA Map ..................................................................54 Figure 3.13 2008 Kansas City SNA Map ..................................................................................54 Figure 3.14 2008 North Star Alliance SNA Map ......................................................................55 Figure 3.15 2008 Mid-Michigan SNA Map ..............................................................................55 Figure 3.16 2008 West Michigan SNA Map .............................................................................56 Figure 3.17 2008 Montana SNA Map .......................................................................................56 Figure 3.18 2008 Finger Lakes SNA Map ................................................................................57 Figure 3.19 2008 Piedmont Triad SNA Map ............................................................................57 Figure 3.20 2008 Wall Street West SNA Map ..........................................................................58 Figure 4.1 Youth Programs and Approved Waivers ...............................................................71 Figure 4.2 Progress in Grant Expenditures 12-2008 ...............................................................76 Figure 4.3 Initiative-Connected Investments Reported to ETA ..............................................82 Figure 4.4 Initiative-Connected Investments for All Generation I Regions
by Funding Source .................................................................................................83 Figure 5.1 Progress on Initiative Metrics by Regions: Education and Training .....................88 Figure 5.2 Progress on Initiative Metrics by Regions: Capacity Building ..............................91 Figure 6.1 Regional Measures Compared to State: Changes Between August 2007 &
December 2008 ....................................................................................................111 Figure 7.1 Elements of Workforce System Transformation .................................................112

B e r k e l e y P o l i c y A s s o c i a t e s

The Power of Partnerships: American Regions Collaborating for Economic Competitiveness, 2009 Interim Report
B e r k e l e y P o l i c y A s s o c i a t e s
i
Executive Summary In most communities, the organizations and interests that drive economic development activities differ from the organizations and interests that drive workforce and talent development activities. The U.S. Department of Labor, Employment and Training Administration (ETA), has increasingly recognized that the typically separate, “siloed” resources of the business and economic development community and the talent and workforce development systems must come together for economic growth and transformation to occur.1 ETA has also recognized that while the services of these systems have traditionally been provided within narrow geographical and jurisdictional boundaries, recent research on economic growth and vitality suggest that both local economies and labor pools tend to cross such boundaries and are more typically regional in character.2 In response, ETA launched the Workforce Innovation in Regional Economic Development Initiative (“the Initiative”). For more than a decade, the U.S. Council on Competitiveness has focused increasing attention on innovation at the regional level as a key to economic competitiveness.3 Emphasizing regional action in a world where the Internet has virtually erased boundaries of space and time may seem paradoxical. Good economic research4 and experience have shown, however, that most innovations still come about through face-to-face interactions among highly skilled individuals with diverse knowledge and interests. At the regional level individuals and organizations can connect powerfully, build bridges across traditional institutional and industrial boundaries and, as a result, enable the sorts of “open systems”5 that enhance rapid flows of knowledge and new ideas. When mechanisms are in place to communicate, integrate, and collaborate within and between education, economic development, and workforce systems, a dynamic and highly productive process can be unleashed. In February 2006, ETA awarded demonstration grants to 13 regions across the country under the WIRED Initiative (see map of Generation I regions). The regions each receive approximately $5 million per year for three years, as well as access to ongoing technical assistance. The Initiative uses a set of incentives for regional efforts6 that link previously siloed assets – such as education, economic
1 DOL/ETA, Workforce Innovation in Regional Economic Development (WIRED) Initiative Evaluation, http://www.doleta.gov/sga/rfp/DOL061RP20079.pdf 2 Walshok, Mary L. Knowledge Without Boundaries: What America's Research Universities Can Do for the Economy, the Workplace and the Community. San Francisco: Jossey-Bass Publishers, 1995. 3 See discussion of the Regional Innovation Initiative and the Regional Competitiveness Summit at www.compete.org. 4 Krugman, Paul. “First Nature, Second Nature, and Metropolitan Location.” Journal of Regional Science 33(2): 129-144, 1993. 5 Chesbrough, Henry William. Open Innovation: the New Imperative for Creating and Profiting From Technology, Boston, Massachusetts: Harvard Business School Publishing Corporation, 2006. 6 This report distinguishes between the national and local WIRED efforts by using Initiative (with a capital “I”) for the national effort, and initiative (with a lower case “i”) or regions for projects and programs associated with local WIRED regions.
The Power of Partnerships: American Regions Collaborating for Economic Competitiveness, 2009 Interim Report
B e r k e l e y P o l i c y A s s o c i a t e s
ii
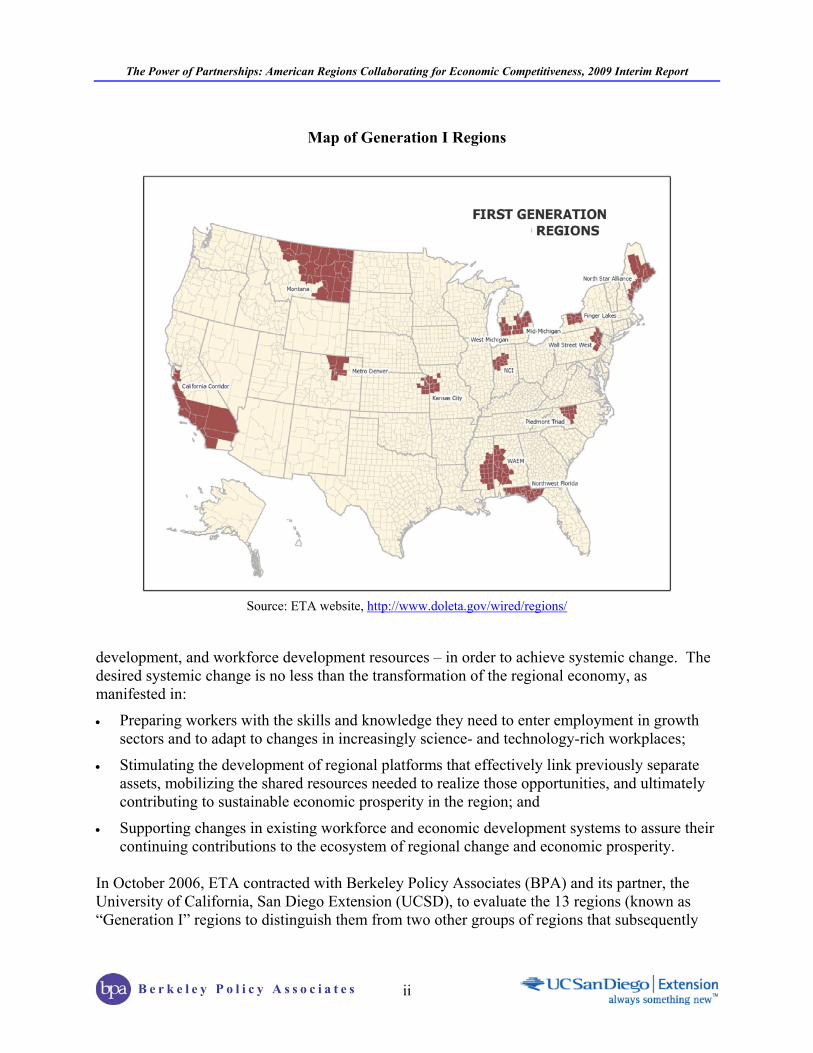
Map of Generation I Regions
Source: ETA website, http://www.doleta.gov/wired/regions/
development, and workforce development resources – in order to achieve systemic change. The desired systemic change is no less than the transformation of the regional economy, as manifested in:
Preparing workers with the skills and knowledge they need to enter employment in growth sectors and to adapt to changes in increasingly science- and technology-rich workplaces;
Stimulating the development of regional platforms that effectively link previously separate assets, mobilizing the shared resources needed to realize those opportunities, and ultimately contributing to sustainable economic prosperity in the region; and
Supporting changes in existing workforce and economic development systems to assure their continuing contributions to the ecosystem of regional change and economic prosperity.
In October 2006, ETA contracted with Berkeley Policy Associates (BPA) and its partner, the University of California, San Diego Extension (UCSD), to evaluate the 13 regions (known as “Generation I” regions to distinguish them from two other groups of regions that subsequently

The Power of Partnerships: American Regions Collaborating for Economic Competitiveness, 2009 Interim Report
B e r k e l e y P o l i c y A s s o c i a t e s
iii
received ETA funding7). The evaluation’s objective is to provide a comprehensive understanding of the implementation and cumulative effects of innovative economic development strategies in the Generation I regions, including transformation of their regional economic and workforce systems. The evaluation’s study design includes: reviewing all existing materials on the Initiative in general and the Generation I regions in particular; conducting annual visits to the Generation I regions; conducting surveys of regional partners; gathering and analyzing information from existing databases on regional economic and social indicators to assess the influence of the Generation I initiatives on their local economies; and analyzing information from all of these sources together. The research design is, of necessity, iterative and changeable over time, within the broad general structure originally laid out in the evaluation proposal and design report.8 This second evaluation report emphasizes the evolution of regional economic initiatives across the 13 regions since the evaluation’s “baseline” report published in May 2008.9 The evaluation, therefore, examines the changing context in which the Generation I regions operate and how they respond to their environments. This report documents adaptations in strategic activities and resource allocations as the regions shifted from a start-up phase to ongoing operations. The report also attempts to identify measurable progress as indicated by outcome metrics, narrative accounts of the regions, and economic indicators from publicly available sources. All these analyses contribute to the evaluation’s assessment of the regions’ progress towards their ultimate aim – regional economic transformation through effective integration of economic development institutions and a transformed workforce system. Key Findings The evaluation’s key findings on the second full year of implementation in the Initiative’s Generation I regions are summarized below. These are organized in terms of context and governance, collaboration and partnerships, activities and funding, measures of progress, and transformation of the workforce development system. Context and Governance The economic downturn that began in 2008 was a significant contextual factor for the Generation I regions, presenting the initiatives with the complications of dwindling public resources, diminishing industry investment, and limited philanthropic support. On the other hand, not all
7 Based on the original procurement, ETA selected another 13 regions (known originally as the Virtual Community of Regions and subsequently, as Generation II) to receive $100,000 to support their participation in Initiative conferences and other learning opportunities. In 2007, ETA supplemented these funds with awards totaling $5 million for each region over three years. Finally, in June 2007, ETA awarded 13 Generation III regions a total of $5 million each over three years. Information about regions in all three Generations of the Initiative is available at http://www.doleta.gov/wired/regions/. 8 Almandsmith, Sherry, Mary Walshok, et. al. Evaluation of Generation I of the Workforce Investment Regional Economic Development (WIRED) Initiative: Design Report, August 30, 2007. 9 Almandsmith, Sherry, et. al. Early Implementation of Generation I of the Workforce Innovation in Regional Economic Development (WIRED) Initiative: 2007 Interim Evaluation Report, ETA Occasional Paper 2008-03, June 2008.
The Power of Partnerships: American Regions Collaborating for Economic Competitiveness, 2009 Interim Report
B e r k e l e y P o l i c y A s s o c i a t e s
iv
regions were equally affected by the weak economy, and several found opportunities to strengthen cooperation and expand into new markets and emerging industries. Another contextual factor that affected virtually all regions was that of changes in ETA guidance regarding performance measurement and allowable expenditures. Many regions had initiated innovative programs with the express approval of ETA. After ETA instituted fiscal reviews and increased emphasis on acceptable uses of grant funds, regions found that some of their activities were disallowed by regulations about which they had no prior knowledge. The fiscal audits performed in 2008 led to significant disallowed costs in some regions. While most of the regions maintained consistent governance and management structures, notable changes occurred in some regions. The initiatives made structural changes for two reasons. Many regions consolidated or streamlined their collaborative structures and teams as their goals matured. Others made changes in their governance structures to sustain and institutionalize successful activities and structures after the ETA grant ends. Effective leadership – with leaders taking on the roles of champion, catalyst, and integrator – was commonly spread among several individuals within a region. This pattern of shared leadership may prove especially effective in assuring long-term sustainability and impact, since a large number of individuals are committed to achieving the initiative’s goals, not just a single visionary or champion. Collaboration and Partnerships Economic transformation requires synergy among a wide range of agencies and organizations—collaboration that transcends narrow geographical and jurisdictional boundaries. In fact, the Generation I regions can boast a large number of new, productive, and often innovative partnerships. These collaborative relationships produced the expected advantages of pooling resources and talent to advance objectives and reach initiative milestones. While judging whether these partnerships are resulting in economic transformation is impossible at this time, many early indicators are promising. Furthermore, many partners reported that the new relationships they had formed through their initiatives had also yielded concrete, ongoing benefits to their own organizations. In fact, site visit respondents consistently identified these new partnerships as being among a region’s most valued assets and most sustainable outcomes. As a consequence, staff members reported that they spend an enormous amount of time communicating with partners, keeping them informed of the initiative’s activities and accomplishments, seeking their input, inviting them to upcoming events, and soliciting their support. The evaluation’s second round of visits also revealed the strategies that respondents believed were most successful in fostering collaboration. These included: thinking creatively about common goals; allowing relationships to develop over time; building on personal relationships; and making expectations clear while expecting the best of collaborators. At least two of the regions laid out “ground rules” for their partners, emphasizing mutual respect and the commitment of the partners to the initiative and to each other. While empirical data are not
The Power of Partnerships: American Regions Collaborating for Economic Competitiveness, 2009 Interim Report
B e r k e l e y P o l i c y A s s o c i a t e s
v
available to draw conclusions about cause and effect, one may hypothesize that those who commit to these “simple rules of civic behavior” set a high standard within regions and facilitate the growth of a collaborative culture – and that culture in turn may well facilitate changes that enhance the region’s economic progress on a sustained basis. Activities and Funding Between 2007 and 2008, the Generation I initiatives moved from start-up to an operational phase. While much of the strategic planning efforts necessary in the start-up phase have concluded, the regions continue to learn and adjust their programs accordingly. Some of the variation in activities occurred simply because of the passage of time, as initiative objectives and milestones are met. Regions were also learning what did and did not work, adapting over time. Still other changes were responses to the changes in the regulatory and economic environments in which the regions operate. Only two regions changed the types of industries they targeted in 2008. Those regions expanded the types of industries with which they worked because of the economy’s negative impacts on their primary industry partners. In both cases, the shift resulted in an increase in the number of workers being trained. Economic development and regional transformation strategies employed across the 13 regions fall into four major categories, each of which encompasses a number of different types of activities:
1. Workforce development activities, including a. Developing new job training approaches, b. Credential and certification programs, c. Training for underserved populations, d. Incumbent worker training, and e. Training for “green jobs;”
2. Entrepreneurship and businesses services, such as a. Training and technical assistance, b. Creating or supporting business incubators, c. Providing assistance for rural businesses, d. Youth entrepreneurship training, e. Developing cluster initiatives, f. Providing small business assistance, and g. Help in accessing investment capital;
3. Talent development activities, including a. Promoting science, technology, engineering, and math (STEM) among high school youth, b. Career awareness programs, and c. Postsecondary programs; and
4. Data analysis and planning.

The Power of Partnerships: American Regions Collaborating for Economic Competitiveness, 2009 Interim Report
B e r k e l e y P o l i c y A s s o c i a t e s
vi
In year two of the initiative, Generation I regions increased funding for workforce training activities for several reasons. First, workforce training was a natural next step after the regions’ initial planning and implementation efforts. Second, regions devoted more resources to training in order to bring their activities in line with the H-1B funding requirements. Finally, changes in policy emphasis at ETA increased attention to training underserved workers. Many regions devote significant effort and resources to supporting entrepreneurs, and increasingly, to small rural companies. Research parks and business incubators are key facilities supporting regions’ efforts to assist emerging entrepreneurs. At the same time, regions have also invested considerable energy in supporting mature businesses through cluster-based technical assistance. The talent pipeline remains a chief concern in all of the regions. Several regions originally planned to offer STEM programs for students in grades kindergarten through 12 (K-12). Delayed or ambiguous guidance from ETA about H-1B requirements, particularly those limiting the use of these funds to youth age 16 and over,10 challenged several regions. To bring their programs into compliance, these initiatives had to either 1) redesign their STEM education programs to target older youth, or 2) find other sources of funding to provide services to younger students. As a result, regions have correspondingly increased career awareness activities targeting older youth. During the 2008 fiscal monitoring visits, ETA auditors defined leveraged funds according to the standard for other DOL grants, that is, only those non-grant funds that are used for costs that are allowable for the federal grant – which is not how the term had been used previously by ETA staff or understood by the regions. To differentiate between the definitions, and to capture the full range of funds available to the regions and their partners, the evaluation report uses the term Initiative-connected investments to refer to what the evaluation’s 2007 Interim Report called “leveraged funds.” The definition for both terms is the same: any funds other than the grants that are specifically supporting WIRED activities or any project within the region that is directly related to the vision and objectives of the region’s initiatives. Using this definition, through the end of August 2008, the regions collectively raised over $294 million in Initiative-connected investments. The majority of these investments were from federal sources; contributions also came from private industry, foundations, and state funds. Measures of Progress ETA developed the Initiative’s Accountability Framework11 to provide guidance to regions on how to approach measuring their success and to ensure that the grantees systematically capture 10WIRED is funded by revenue collected under 8 USC §1356(s)(2) (commonly referred to as H-1B funds), as authorized by the American Competitiveness and Workforce Improvement Act of 1998, Pub.L.No. 105-277 (codified, as amended, at 29 USC § 2916a). The legislation specifies that individuals must be at least age 16 to receive training paid for by these funds, unless the program obtains a waiver from ETA. See WIRED Policy on Investments in Activities For Secondary School Aged Youth. Memorandum dated November 19, 2007, signed by Assistant Secretary Emily Stover DeRocco. 11 DeRocco, Emily. “WIRED Performance Reporting – Implementing Your Regional Accountability Framework (Generation I and II Grantees),” Memorandum to WIRED Regions, April 27, 2007.

The Power of Partnerships: American Regions Collaborating for Economic Competitiveness, 2009 Interim Report
B e r k e l e y P o l i c y A s s o c i a t e s
vii
their initiative’s results and outcomes – both quantitative and qualitative. In addition to the national evaluation, components of the Framework include the Common Measures and region-specific metrics. Very few of the regions reported on the Common Measures in their December 2008 quarterly reports. The most likely reason is the time lag associated with using Unemployment Insurance (UI) wage records to document entering employment and wages. Other factors that could serve as barriers to reporting these measures are concerns about participant confidentiality associated with use of Social Security Numbers to access UI wage records, and the fact that the Common Measures were not designed to adequately capture information on the Initiative’s networking strategies, or about two of the major activities of many regions – training for incumbent workers and for entrepreneurs. As the regions approach the end of their grant, the data needed to calculate the Common Measures for their early years should become available. The evaluation team looks forward to discovering whether more of the initiatives are able to provide information about these metrics in their quarterly reports for December 2009. The metrics used to gauge regions’ progress are organized into three categories – education and training, capacity building, and economic indicators. Several factors have contributed to poor consistency and quality of the metrics data that Generation I grantees have submitted to document their performance. These include: 1) the measures are “suggested,” not required; 2) the measures were introduced a year after the grants started; and 3) ETA encouraged the regions to tell their stories by defining and adopting region-specific metrics to complement information gathered via the suggested metric framework. The initiatives were most consistent about reporting on the education and training metrics. Across all of the regions, the total number of individuals who began education and/or training courses using Initiative funds was 31,499. Of those who started education/training courses, 61% had completed training by the end of 2008. Finally, 25% of those who completed training went on to be employed within a targeted industry. These numbers underestimate the influence of Initiative-funded training both because of problems with data quality and reasons, because they may not take into account a substantial amount of incumbent worker training that the Generation I regions provided. At least one region did not have data on incumbent workers who received in-house training from their employers. Among the capacity-building metrics, the grantees were most consistent in reporting on the number of educators prepared for instruction in identified industries, the number of new curricula developed, and the number of students projected to be trained as a result of these two activities. The nine regions that provided data trained a total of 5,429 educators, and estimated that these instructors would in turn train 88,146 students per year. The initiatives developed 207 new curricula, which they projected would be used to train 6,278 students. Again, these results are likely to underestimate the influence of grant-funded activities and should be considered cautiously. The evaluation team also gauged regional progress in fortifying partnerships, developing shared strategies, fostering innovation, and ensuring sustainability of these efforts. Most regions had established cohesive regional structures based on shared interest, assets, and goals by the time of the evaluation visits in Fall 2008. The innovations described in this report refer to many
The Power of Partnerships: American Regions Collaborating for Economic Competitiveness, 2009 Interim Report
B e r k e l e y P o l i c y A s s o c i a t e s
viii
technological and business development initiatives, new creative policies and programs, and instances of transformative thinking about the alignment of talent and economic development. This report examines the sustainability of grant-funded programs beyond the grant period, as evidenced by: the extent to which the overall philosophy and goals of collaboration and transformation had taken hold among regional actors; the durability of the regions’ collaborative networks; and the extent to which the initiative’s programs and activities are being adopted and institutionalized within the organizations implementing them. Transformation of the Workforce System ETA has challenged the grantees to work toward two important nationwide goals: 1) to develop within their regions strong linkages between industry and the education, economic development and workforce systems; and 2) to transform the workforce system into an integrative, forward-looking talent development system. The evaluation team found that a number of the Generation I regions have taken important preliminary steps toward these desired goals. In some regions, clear signs have emerged that transformation is occurring in specific local areas, if not across the entire region, or in some components of the system. In other regions, state-level modifications of policy and structures have facilitated the regions’ efforts. The changes observed, however, do not (yet) rise to the level of “transformation” of the full workforce system. Next Steps This report, like the evaluation’s 2007 Interim Report, is a snapshot of the activities and achievements of the Generation I regions at a given point in time. This report thus represents the second set of “photographs” to be added to the initiative’s “album.” The evaluation team will continue to assess the regions’ progress in moving toward regional transformation with a final round of site visits, analysis of data from third-party sources, and a comprehensive survey of regional partners to be conducted in 2009 and 2010. As most regions come to the end of their federal funding in January 2010, the next steps for the regions are to continue expanding their partnerships, use the relationships and collaborative mechanisms that they have formed through the grant as a basis for collaboration in support of other activities, and continue their journey toward a new economy. As one respondent noted, “Transformation is continuous – the job is never done.”
The Power of Partnerships: American Regions Collaborating for Economic Competitiveness, 2009 Interim Report
B e r k e l e y P o l i c y A s s o c i a t e s
1
Chapter 1: Introduction In most communities, the organizations and interests that drive economic development activities differ from the organizations and interests that drive workforce and talent development activities. The U.S. Department of Labor, Employment and Training Administration (ETA), has increasingly recognized that the typically separate, “siloed” resources of the business and economic development community and the talent and workforce development systems must come together for economic growth and transformation to occur.12 ETA has also recognized that while the services of these systems have traditionally been provided within narrow geographical and jurisdictional boundaries, recent research on economic growth and vitality suggest that both local economies and labor pools tend to cross such boundaries and are more typically regional in character.13 In response, ETA launched the Workforce Innovation in Regional Economic Development Initiative (“the Initiative”). For more than a decade, the U.S. Council on Competitiveness has focused increasing attention on innovation at the regional level as a key to economic competitiveness.14 Emphasizing regional action in a world where the Internet has virtually erased boundaries of space and time may seem paradoxical. Good economic research15 and experience have shown, however, that most innovations still come about through face-to-face interactions among highly skilled individuals with diverse knowledge and interests. At the regional level individuals and organizations can connect powerfully, build bridges across traditional institutional and industrial boundaries and, as a result, enable the sorts of “open systems”16 that enhance rapid flows of knowledge and new ideas. The integration of education and training providers with research and development (R&D) and economic and business development interests increases the chances that the management and workforce skills required by these knowledge transformations can be provided quickly and effectively.
Many regions have within their boundaries superb universities, research institutions, and even large multi-national corporations, but these assets often fail to yield the innovations that lead to new products, industries, or local jobs. When mechanisms are in place to communicate, integrate, and collaborate within and between these knowledge domains and professional competencies, however, a dynamic and highly productive process can be unleashed.
12 DOL/ETA, Workforce Innovation in Regional Economic Development (WIRED) Initiative Evaluation, http://www.doleta.gov/sga/rfp/DOL061RP20079.pdf 13 Walshok, Mary L. Knowledge Without Boundaries: What America's Research Universities Can Do for the Economy, the Workplace and the Community. San Francisco: Jossey-Bass Publishers, 1995. 14 See discussion of the Regional Innovation Initiative and the Regional Competitiveness Summit at www.compete.org. 15 Krugman, Paul. “First Nature, Second Nature, and Metropolitan Location.” Journal of Regional Science 33(2): 129-144, 1993. 16 Chesbrough, Henry William. Open Innovation: the New Imperative for Creating and Profiting From Technology, Boston, Massachusetts: Harvard Business School Publishing Corporation, 2006.
The Power of Partnerships: American Regions Collaborating for Economic Competitiveness, 2009 Interim Report
B e r k e l e y P o l i c y A s s o c i a t e s
2
In launching the Initiative, ETA funded the regional initiatives17 to link previously siloed assets – specifically education, economic development, and workforce system resources – in order to achieve systemic change. The desired systemic change is no less than the transformation of the regional economy; contributing activities include:
Preparing workers (including those who are displaced, those currently employed and underemployed, and those entering the workforce) with the skills and knowledge they need to find employment in growth sectors and adapt to changes in increasingly science- and technology-rich workplaces;
Stimulating the development of regional systems that effectively link previously separate assets, mobilize the shared resources needed to realize those opportunities, and ultimately contribute to sustainable economic prosperity in the region; and
Supporting changes in existing workforce and economic development systems to assure their continuing contributions to the ecosystem of regional change and economic prosperity.
The 13 Generation I regions have addressed these issues in the initiatives they have been pursuing over the life of their grants. Together, they represent important case studies of how regions, in the face of dramatic economic and social challenges, can mobilize diverse institutions and assets to begin the journey towards renewed prosperity and full employment. The data and stories presented in this second Interim Report on the progress of these regions offer insights into potential ways to rebuild the American economy. They represent innovative regional initiatives that are responsive to local conditions, leverage distinctive local and regional assets, and focus on the need to grow high-wage, high value-added businesses and jobs. As this report will reveal, macro-social forces – as well as changes within the U.S. Department of Labor, in state-level priorities, and among the regional collaboratives – have resulted in some slight shifts in direction moving forward. Nonetheless, the core guiding principles of regional collaboration focused on workforce and economic transformation still drive the 13 regions.
Generation I Regions and Goals The premise of the Initiative is that national competitiveness and regional prosperity are possible if communities are able to link their varied knowledge resources with their business and innovation assets, and then train their workforce in the skills and knowledge required to work effectively in new and emerging industries. To this end, ETA used a competitive process to select 13 regions across the country (known as Generation I regions) to receive approximately $5 million each per year in grant funds over the course of three years, as well as access to ongoing technical assistance.18
17 This report distinguishes between the national and local efforts by using Initiative (with a capital “I”) for the national effort and initiative (with a lower case “i”) for projects and programs associated with local regions. 18 Ultimately, ETA funded a total of 39 regions in three generations of grants. Information about regions in all three generations is available at http://www.doleta.gov/wired/regions/ .
The Power of Partnerships: American Regions Collaborating for Economic Competitiveness, 2009 Interim Report
B e r k e l e y P o l i c y A s s o c i a t e s
3
Figure 1.1 lists the 13 Generation I regions by state, provides a brief description of the area that each region encompasses, and lists the “nickname” by which this report refers to each the region. Figure 1.2 is a map showing the regions’ locations across the U.S. Details on each region can be found in Appendix A, which describes site visit highlights from the evaluation team’s second round of visits to the regions. The process used to identify the geographic areas to be included in the Generation I regions varied. The boundaries of existing regional identities and entities defined some regions. For example, Northwest Florida, Metro Denver, Kansas City, and Finger Lakes all had existing regional alliances focused on regional economic development and growth and built upon those alliances in furthering regional collaboration. State policies defined the boundaries of other Generation I regions. Michigan had already consolidated its economic development and workforce agencies and aligned the boundaries of its corresponding intrastate regions prior to the announcement of the grants. This policy defined the borders of the Mid-Michigan and West Michigan regions. Similarly, the North Carolina General Assembly many years ago designated the Piedmont Triad as one of seven economic development regions in the state. Finally, new partnerships that were formed to apply for the funding from ETA resulted in newly created regions. Montana, Maine, the North Star Alliance (in coastal Maine), Wall Street West, Western Alabama/ Eastern Mississippi (WAEM), and the California Corridor are examples of this phenomenon. Changes in Goals and Timeline of the Generation I Regions As described in the evaluation’s first Interim Report,19 in working to increase their ability to respond to significant global economic challenges, the Generation I regions chose specific objectives that cluster under three distinct but interrelated categories: 1. Workforce and Talent Development – including goals such as:
Assessing and addressing employer needs and worker skill gaps; Retaining workers in the region; Creating a high-skilled workforce; Providing entrepreneurial training; Increasing graduation rates and STEM competencies; Training teachers (K-12); and Mentoring high school math and science students.
2. Economic Development – including goals such as: Creating quality, high-skilled jobs; Increasing research and development (R&D) activity and innovations; Increasing the competitiveness of business partners;
19 Almandsmith, Sherry, et. al. Early Implementation of Generation I of the Workforce Innovation in Regional Economic Development (WIRED) Initiative: 2007 Interim Evaluation Report, ETA Occasional Paper 2008-03, June 2008.

The Power of Partnerships: American Regions Collaborating for Economic Competitiveness, 2009 Interim Report
B e r k e l e y P o l i c y A s s o c i a t e s
4
Figure 1.1 Generation I Regions
State WIRED Initiative Location
Major Metropolitan
Areas Referred to in this report as:
Alabama/ Mississippi
WIRED Initiative for Western Alabama & Eastern
Mississippi 18 counties in W. Alabama; 19 counties in E. Mississippi
Meridian, MS Tuscaloosa, AL WAEM
California California Innovation Corridor 13 counties from Oakland to San Diego
Los Angeles, San Diego, Oakland California Corridor
Colorado Metro Denver WIRED 9 counties around Denver Denver, Boulder, Ft. Collins Metro Denver
Florida WIRED Northwest Florida Initiative
16 counties in the Florida Panhandle
Tallahassee, Pensacola Northwest Florida
Indiana North Central Indiana WIRED
14 counties including Lafayette Lafayette, Kokomo NCI
Kansas/ Missouri OneKC WIRED Initiative
Greater Kansas City (10 Missouri counties; 8 Kansas
counties) Kansas City, MO Kansas City, KS Kansas City
Maine North Star Alliance Initiative 12 coastal counties in Maine Portland, Bangor, Augusta North Star Alliance
Michigan WIRED for Mid-Michigan 13 counties including Lansing, Flint, and Saginaw Flint, Lansing Mid-Michigan
Michigan WIRED for West Michigan 7 counties in Western Michigan
Grand Rapids, Holland West Michigan
Montana Montana Agro-Energy Plan 32 counties in Northeast Montana Havre, Miles City Montana
New York Finger Lakes Partnership 9 counties in Upstate New York Rochester Finger Lakes
North Carolina Piedmont Triad Partnership 12 counties Greensboro, Winston-Salem Piedmont Triad
Pennsylvania Wall Street West 9 counties in Northeast Pennsylvania
Allentown, Bethlehem, Scranton Wall Street West
Source: ETA website, http://www.doleta.gov/wired/regions/ and BPA/UCSD Evaluation Team

The Power of Partnerships: American Regions Collaborating for Economic Competitiveness, 2009 Interim Report
B e r k e l e y P o l i c y A s s o c i a t e s
5
Figure 1.2 Map of Generation I Regions
Source: ETA website, http://www.doleta.gov/wired/regions/
Helping innovators commercialize their products; Identifying, assessing, and aligning regional resources; Increasing knowledge of global competitiveness; Sustaining and replicating collaboration and service models; Expanding current markets and creating new ones; and Increasing investment from external sources.
3. Social and Community Development – including goals such as: Building new organizational relationships; Increasing a support network; Creating and adopting a regional identity and mindset; Changing employment expectations; Creating a leadership structure; Creating collaboration across business, education, and government sectors; Creating broad community engagement; and Creating an entrepreneurial culture.
Appendix B provides details on which regions have adopted each type of goal.

The Power of Partnerships: American Regions Collaborating for Economic Competitiveness, 2009 Interim Report
B e r k e l e y P o l i c y A s s o c i a t e s
6
Only two of the Generation I regions – the Piedmont Triad and Wall Street West – have formally developed new goals since the evaluation’s first visit (see Appendix B). In October of 2008, the Piedmont Triad drafted specific goals for each of its industry clusters (i.e., creative enterprises and the arts, advanced manufacturing, logistics and distribution, and health care), as well as for education and workforce development. These goals reflect the evolution of the initiative, since they were developed by each industry’s roundtable and represent the group’s goals and action plan for industry. They represent a further specification of (rather than a change in) the goals stated in Piedmont Triad’s implementation plan. In June 2008, Wall Street West anticipated the looming crises in the finance industry and shifted the emphasis of its goals and activities in several ways. First, the initiative broadened its target industries to include business services, with a focus on business continuity services in particular. Second, the region’s goals were revised to increase their focus on training and workforce development. Finally, Wall Street West dropped an original goal that promoted innovation and technology transfer. Chapter 4 will describe how these changes affected the region’s activities. All but two of the Generation I regions applied for and received no-cost extensions of their grants; in these regions, funded activity will continue through January 2010. California Corridor and West Michigan did not change their initial period of performance; funding for these regions ended on January 31, 2009. The evaluation’s first Interim Report emphasized the extent to which the 13 regions began their economic transformation process at different starting points, both in terms of "readiness" for change and in terms of challenges and opportunities each faced. All shared the intention to address their goals in a regionally based, collaborative approach to growth and transformation in spite of the marked contrasts between those approaches and their geographies and particular regional histories. The first Interim Report captured the progress each region had made on their journey to transformation. This second Interim Report provides a look at their continuing progress as well as documentation of the specific activities and outcomes the regions have realized to date.
Evaluation of the Initiative In October 2006, ETA contracted with Berkeley Policy Associates (BPA) and its partner, the University of California, San Diego Extension (UCSD), to evaluate the Initiative’s 13 Generation I regions. The evaluation’s objective is to provide a comprehensive understanding of the implementation and cumulative effects of collaborative and innovative strategies in the Generation I regions, including transformations in their regional economic and workforce systems. This report provides an update on the implementation of the Initiative in its second full year. The evaluation’s study design includes: 1) reviewing all existing materials on the Initiative in general, and the Generation I regions in particular; 2) conducting annual visits to the Generation I regions; 3) surveying partners in each region; 4) gathering and analyzing information from existing databases on regional economic and other factors; and 5) analyzing information from all
The Power of Partnerships: American Regions Collaborating for Economic Competitiveness, 2009 Interim Report
B e r k e l e y P o l i c y A s s o c i a t e s
7
of these sources together. The research design is, of necessity, iterative and changeable over time within the broad general structure originally laid out in the evaluation’s design report.20 This study is not simply an evaluation of workforce training or economic development activities. It is also a description of how regional organizations that are concerned with economic growth and building human capital come together in new social relationships through which shared goals, co-investment, and a renewed sense of regional purpose and confidence can develop. The evaluation, therefore, focuses on three critical aspects of regional economic transformation: 1) regional alliance-building across geographic and professional boundaries, along with development of a regional identity; 2) specific organizational and programmatic strategies, in terms of partners, governance, co-investment, and specific business and talent development initiatives; and 3) measurable progress toward sustainable economic transformation, as indicated by outcome metrics related to regional economic well-being and workforce preparedness. All three types of analysis contribute to the evaluation’s assessment of the regions’ success. Figure 1.3 illustrates how the evaluation is collecting information to explore these three master themes. To assess collaboration, alliance building, and development of a regional identity, the research team is analyzing documents and plans, conducting site visits and interviews, and will be fielding regional partner surveys. The team is using the same methods to explore the specific organizational and programmatic strategies that each region is employing and will also use information from existing databases to analyze enrollment in training or education programs. Finally, to examine regional progress toward sustainable economic transformation, the evaluation is using information from documents, interviews, surveys, and existing data sources. The original grant period of three years defines an extremely short timeline by which to effect regional economic transformation.21 The evaluation’s study period extends nine months beyond the initially planned end of the Generation I grants.22 Still, changes in the regional economies that may ultimately be attributable to the Initiative can be expected to take ten years or longer to happen. Thus, the evaluation is designed to be sensitive enough to detect relatively small effects that represent leading indicators of progress in each region, and the study’s Final Report will assess the progress that the regions have made toward transformation during the period of the Initiative.
20 Almandsmith, Sherry, Mary Walshok, et. al. Evaluation of Generation I of the Workforce Investment Regional Economic Development (WIRED) Initiative: Design Report, August 30, 2007. 21 Due to delays associated with start-up, in April 2007 ETA extended the period of performance for most of the Generation I WIRED grants through January 31, 2010. 22 Though funding for two of the regions (California Corridor and West Michigan) ended on schedule in January 2009, the evaluation will continue to monitor progress in these regions.

The Power of Partnerships: American Regions Collaborating for Economic Competitiveness, 2009 Interim Report
B e r k e l e y P o l i c y A s s o c i a t e s
8
Figure 1.3 Analytical Framework for the Evaluation
Research Tools
Master Themes
Collaboration; Building Alliances &
Regional Identity
Specific Organizational &
Programmatic Strategies
Progress Toward Sustainable
Regional Transformation
Qualitative: Analysis of Documents & Plans
Activities planned and documented that build collaboration and foster awareness of the region as a cohesive economic unit; media reports about region
Specific steps planned and completed that foster innovation, new business development, improved workforce education and training
Reports of new businesses started, new products and markets developed; outside funding attracted to the region; lasting changes in education and training institutions
Qualitative: Site Visits & Interviews
Respondent reports about communication and decision-making, how collaboration affects their work lives; observation of the region; social network analysis showing new relationships among leaders in business, government, and intermediary organizations
Observation of meetings and visits to new or changed programs and organizations; discussions about defining and implementing various WIRED strategies
Extent of respondents’ genuine optimism about the region’s future; reports that outmigration of talent is slowing; reports that jobs are being created and institutions are changing
Quantitative: Surveys
Awareness among “non-leader” respondents of the region and its goals; reports of collaborative efforts and effects
Strategies used to communicate and strengthen collaboration and partnerships
Optimism about economy and converging beliefs that region is “on the move;” how collaboration has affected partners’ activities, practices, and policies
Quantitative: Analysis of Existing Data
Workforce Investment Act Standardized Record Data (WIASRD) enrollments; data from education systems x on achievements, numbers of graduations, numbers of faculty (with emphasis on STEM)
Quarterly census inventories of employment and wages from the Bureau of Labor Statistics; patents applied for, research and development activities; entrepreneurial activity and small business innovation research (SBIR)23 funding; labor force participation and average wage by industry; payroll
Source: BPA/UCSD Evaluation Team
23 The Small Business Innovation Research (SBIR) Program is a highly competitive award system that provides small businesses with opportunities to propose innovative ideas that meet the specific R & D needs of the federal government.

The Power of Partnerships: American Regions Collaborating for Economic Competitiveness, 2009 Interim Report
B e r k e l e y P o l i c y A s s o c i a t e s
9
Contents of this Report This second Interim Report describes the implementation of regional approaches to innovation and collaboration across geographical and political boundaries from Summer 2007 through the time of the evaluation’s second site visits in October, November, and December 2008. The report is based on information gathered during grantee conferences; from detailed review of quarterly progress reports from each of the 13 regions; from site visits to all regions; and through analyses of extant data on each region relevant to their goals and plans. The subsequent chapters of this report describe the observations made through these activities:
Chapter 2 describes changes in the context and governance of the regions over the past year;
Chapter 3 presents information on the evolution of partner roles, collaborative strategies, and social networking in each of the 13 regions;
Chapter 4 summarizes changes in activities and the funding of the regions;
Chapter 5 discusses the progress that the regions have reported in four areas – training and employment, innovation transformation, regional identity and integration, and sustainability;
Chapter 6 provides a brief update on the evaluation’s quantitative measures of progress from baseline to date for the regions;
Chapter 7 describes the interaction of the regional initiatives with local workforce systems and the extent to which WIRED has influenced local workforce development operations; and
Chapter 8 presents the evaluation team’s conclusions about the regions to date, and the evaluation’s next steps.
Appendices to this report include:
A. Site Visit Highlights from each of the Generation I Regions;
B. Generation I Regional Development Goals;
C. Social Network Analysis Data; and
D. Supplementary Quantitative Data on Generation I Regions.
The Power of Partnerships: American Regions Collaborating for Economic Competitiveness, 2009 Interim Report
B e r k e l e y P o l i c y A s s o c i a t e s
10
Chapter 2: Changes in WIRED Context and Governance Any initiative focused on creating change and transformation is inevitably affected by a variety of factors beyond its immediate control, including those at the national – or macro – level, as well as unexpected developments at the local level. Such contextual factors can create challenges to achieving the initiative’s original goals and objectives. This chapter first describes how changes outside the Generation I regions have influenced the initiatives and may affect their outcomes. It then discusses changes in the governance structures both at the national level and within the regions that also may influence the implementation and success of the initiatives.
The Evolving Context for Generation I Regions The 13 regions have faced substantial developments at the macro level that have created crises and in some cases, opportunities that few could have anticipated. A number of developments at the regional and sub-regional levels also are shaping the priorities, programs, and outcomes of the Generation I regions evaluated in this report. The most significant national trends affecting the regions include: 1) the broad and deep economic downturn affecting the entire nation; and 2) the shifts in priorities at ETA and in the guidance the agency provided. Key contextual developments at the regional level include opportunities presented by strong economies in localized areas in a few regions, and the emergence of new resources and partnerships in some regions. Each of these macro and micro contextual factors are discussed below. Changes in the National Context of the Initiative National Downturn in the Economy When the Initiative was launched in February 2006, the global financial, business, and employment landscape was very different than at the time of the second evaluation site visits in Fall 2008. In February 2006, housing stock was rising in value, the stock market and the financial community were reporting robust gains, and the excitement about new technology companies – particularly in the life sciences – was widespread and supported by a multiplicity of state and regional initiatives focused on building new clusters of high value-added industries and jobs. Less than three years later, the world had changed. Housing values were at their lowest point in decades and the building industry had been severely affected. The fragility of financial markets was exposed, and banks, lenders, and investors were fearful of the future. Traditional manufacturing was declining at precipitous rates, with tens of thousands of industrial workers laid off, not only across the United States, but also throughout Europe and most industrialized countries. Finally, the enthusiasm for the potential of new technology to create new wealth and new jobs waned as investment and venture capital support of R&D declined.
The Power of Partnerships: American Regions Collaborating for Economic Competitiveness, 2009 Interim Report
B e r k e l e y P o l i c y A s s o c i a t e s
11
The 13 regions represented in this report developed their plans and aspirations at a moment in time when everything seemed possible. They are winding down their projects with an adjusted set of expectations and, in many cases, new outcome metrics and measures of accomplishment. The failing economy affected these regions in several ways, including declining tax revenues and the subsequent decrease in availability of public dollars, and shrinking revenues in the private sector. In several regions, declining tax revenues worried many site visit respondents, particularly as they considered funding sustainability plans with dwindling public dollars. For example, the California Corridor’s expectations about their efforts to sustain successes were affected by a state unemployment rate above 10% in early 2009. A further impediment to sustaining regional economic efforts was the state’s budget deficit of nearly $16 billion. California Corridor projects like SEARCH, which trains engineers to be teachers, were placed on hold pending decisions about how many math and science teacher positions would be cut from school district budgets. The state of Maine enacted a 10% cut in the budgets of all agencies, the second such cut since 2006. Heads of three of the four North Star Alliance Pillar committees – as well as the initiative’s project coordinator – are senior staff from state agencies. While the Pillar committee chairs are not compensated for their work under this effort, the latest funding cut were expected to limit their ability to participate in the initiative given the increased workloads caused by staff reductions in their agencies. Shrinking revenues in the private sector hit the Wall Street West region particularly hard. Wall Street West spent considerable energies during the first grant year soliciting funding to build a fiber optic cable network that would enable synchronous back-up operations for Wall Street. That initial goal galvanized significant energy for collaboration, especially among economic development agencies. With the realization that this objective would not be achieved in the near future, the initiative expanded its target industries to include information technology, STEM (science, technology, engineering and math) occupations, and business continuity services. Wall Street West also increased its focus on workforce training and talent pipeline development. The challenge of rebuilding enthusiasm among the region’s original partners for a vision centered primarily on strengthening the existing and emerging workforce was significant. Private sector cutbacks affected the California Corridor as well. A partnership between an aerospace manufacturer and a university depends on the manufacturer’s ability to stay in business. As of late Fall 2008, the aerospace company had no new launches under contract. Executive boards had become increasingly reluctant to let their organizations expand and
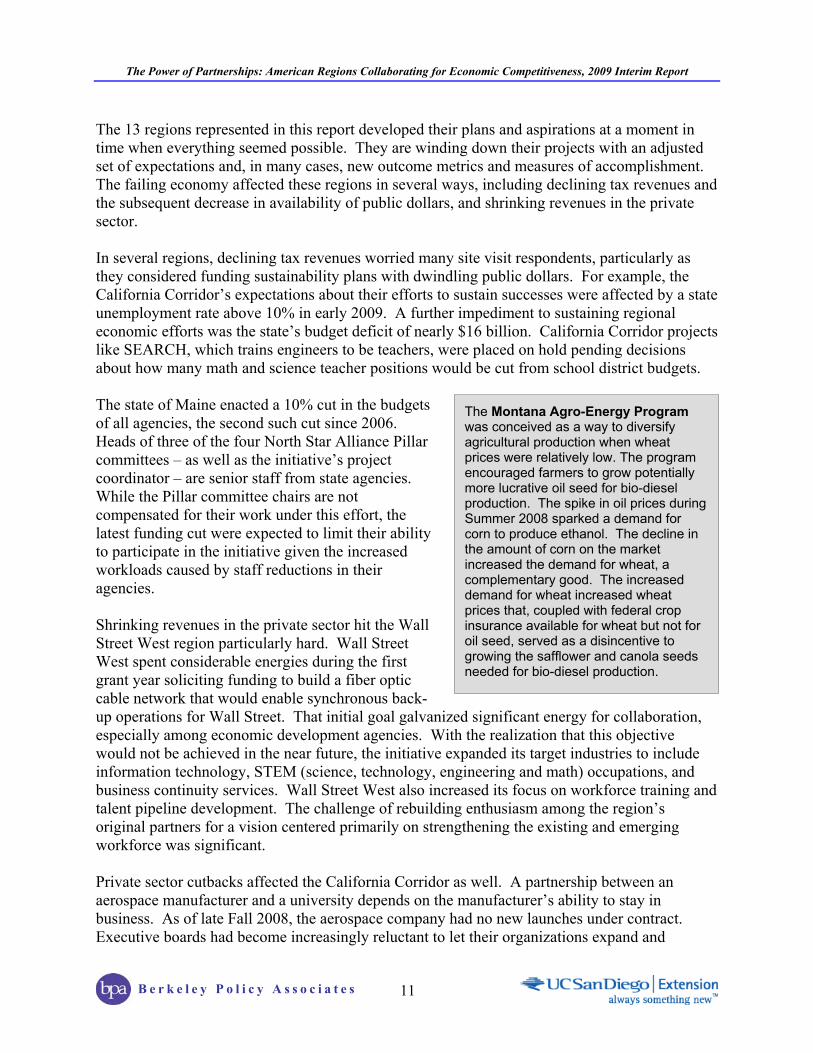
The Montana Agro-Energy Program was conceived as a way to diversify agricultural production when wheat prices were relatively low. The program encouraged farmers to grow potentially more lucrative oil seed for bio-diesel production. The spike in oil prices during Summer 2008 sparked a demand for corn to produce ethanol. The decline in the amount of corn on the market increased the demand for wheat, a complementary good. The increased demand for wheat increased wheat prices that, coupled with federal crop insurance available for wheat but not for oil seed, served as a disincentive to growing the safflower and canola seeds needed for bio-diesel production.
The Power of Partnerships: American Regions Collaborating for Economic Competitiveness, 2009 Interim Report
B e r k e l e y P o l i c y A s s o c i a t e s
12
innovate. Seeking to limit the exposure of their organizations, these stakeholders were asking, “Why are you doing that? We can't afford it,” or saying, “It’s out of our area,” increasing the challenge in moving forward towards transformation goals. Finally, the decrease in wealth in the private sector affected the nonprofit sector. Reductions in donations and support created significant challenges for nonprofit partners. Ironically, the economic downturn reinforced the strength of commitment to regional collaboration among North Central Indiana (NCI) partners. Economic development organizations in the eastern (Kokomo/Howard County Development Corporation, or KHCDC) and western (Greater Lafayette Commerce, or GLC) parts of the region had been competing for years. In response to major white-collar layoffs in the region, GLC held a job fair that received the blessing of the KHCDC because the latter recognized the fair’s importance in retaining an important talent base in the region. Likewise, with the full support of GLC, KHCDC submitted a proposal to use NCI funds to seed an incubator concept, called “skunk works,24” aimed at retaining laid off engineers in the region. Many respondents expressed hope that the new tools and partnerships developed by the regions would help them through the economic downturn. A respondent in the California Corridor said that, given the downturn in the economy, such innovations “would be harder to launch now, but it’s a good thing we launched when we did, because I think it’s going to help the region.” A Kansas City respondent saw the principles of regional collaboration and transformative innovation as being key to the country’s economic recovery. With the economic climate that prevailed in 2008-2009, he thought that policy makers might be finally willing to learn what it means to be competitive on a regional and even national level, and to embrace the concept that a diversified, strong workforce is the foundation of a strong regional economy. Changing Leadership and Guidance from ETA A second major contextual factor affecting all of the Generation I regions is the experimental character of the Initiative as originally conceived by ETA. As a result, the regions have been highly dependent on direction from ETA about objectives, implementation, and outcomes. The Initiative was the inspiration of the former Assistant Secretary, whose vision and enthusiasm allowed the Initiative to take hold across many regions in the United States, as well as within a large federal bureaucracy. While the Workforce Investment Act broadened the clientele of the workforce system to include employers as well as job seekers and incumbent workers, the Initiative pushed the envelope further with its emphasis on aligning the objectives of entrepreneurial, innovative business development with innovative forms of workforce development. In response to the challenges and opportunities that the original Solicitation for Grant Applications (SGA) presented, many of the Generation I regions chose economic development organizations to manage their initiatives and developed strategies in line with the Initiative’s far-reaching goals. Over time, however, the experimental nature of the Initiative has gradually given way to ETA’s traditional funding criteria and performance metrics. This return
24 In the high tech world, a “skunk works” is a small group of scientist and engineers tasked with “thinking outside of the box” to develop advanced technology. The term comes from the code name of the top secret aircraft development program at Lockheed Martin started during the Second World War.
The Power of Partnerships: American Regions Collaborating for Economic Competitiveness, 2009 Interim Report
B e r k e l e y P o l i c y A s s o c i a t e s
13
to the traditional has emphasized requirements and restrictions that have proven to be problematic, as regions have worked to implement their initial goals. During the second round of evaluation site visits, interview respondents described a number of ways in which changes within the Department have affected the clarity with which regions can move forward. ETA staff enacted some of these changes to ensure that the grantees were operating within the requirements of its funding source, H-1B visa fees authorized under Sec. 414(c) of the American Competitiveness and Workforce Improvement Act of 1998 (P.L. 105-277, Title IV). As the evaluation’s first Interim Report described, few of the Generation I management organizations were familiar with the legislation, and thus they were caught off guard when concerns about allowable costs arose during the fiscal audits. This situation was exacerbated by turnover in federal grant officers and monitoring staff, with regions sometimes receiving approval for particular approaches that was later rescinded when other, more experienced federal project officers interpreted the rules differently. Other changes were related to the overall refocusing of ETA’s vision and the reintroduction of more traditional metrics. Some of the specific concerns raised by regional interview respondents included the following:
Performance metrics were spelled out a year and a half after the regions began implementing their grants. In a number of cases, the regions’ original goals, objectives, and outcomes did not align closely with the ETA’s performance metrics.
The definition of allowable expenses continued to be refined through the second year of the grants. Many regions had objectives and activities that senior ETA leadership had initially endorsed, but that were subsequently identified as non-allowable expenses. During 2007, ETA clarified that activities such as marketing and promotion activities, purchasing equipment, and seeding start-up companies were not allowable expenses. In 2008, ETA further clarified that regions must request a waiver to serve youth under age 16, thus creating complications for regions that had been working extensively in K-12 education. In addition, late in 2008, ETA staff conducted fiscal reviews of all Generation I grantees and subsequently questioned numerous cost items, including some that had been previously approved by the ETA Leads or senior ETA staff. As a result, regions were left to seek alternative funds, discontinue some activities related to entrepreneurship and technical assistance, withdraw support from youth programs, or, in some instances, de-fund activities that did not meet the proper competitive bid requirements for services.
ETA guidance to the regions has gradually refocused on workforce development and the outcomes of training investments, and away from business and economic development metrics. As a result, a number of regions have reallocated funds and pursued different kinds of activities with different performance measures than they originally intended.
In the Fall of 2008, ETA steered the Initiative away from the model of regional job creation and new skill development originally articulated in the Solicitation for Grant Applications. Instead, ETA shifted the Initiative’s focus more on customers with barriers to employment such as a work history in low-income jobs, lack of education, and a history of incarceration.
In sum, all regions were affected to at least some extent by: 1) delays in the development of performance criteria and expenditure approvals; and 2) changing instructions about program

The Power of Partnerships: American Regions Collaborating for Economic Competitiveness, 2009 Interim Report
B e r k e l e y P o l i c y A s s o c i a t e s
14
emphasis and allowable costs from ETA. Several Generation I regions have had to shift their initiative’s emphasis due to stop work orders and disallowed costs. This list of the concerns raised by respondents in the Generation I regions will be important to keep in mind because these factors will ultimately influence the ability of the regions to achieve the objectives that were built into their proposals. The shifting realities at the U.S. Department of Labor represent important contextual factors in understanding how these regions performed. Changes in Context at the Regional Level The context within many of the regions has also changed since the evaluation’s initial visits. Despite the lagging national economy, a few regions – or subregions within the regions – have experienced growth. In addition, new resources and opportunities have emerged in several regions, and these may help the initiatives move toward their goals despite a poor economy. This section explores both of these factors. Localized Strong Economies Not all regions have felt the adverse impacts of the current economic downturn. In the Mid-Michigan region, Midland – home to chemicals industry giants SC Johnson and Dow, as well as Hemlock Semiconductor, one of the largest raw silicon producers in the world – enjoys the reputation of being the “hottest hiring market in the state.” In response, the City of Midland and Michigan Works (the workforce system) have partnered with Michigan State University and local economic development organizations to meet the labor demand. One interviewee pointed out that the region anticipated growth in the alternative energy sector (e.g., solar cells) and that they are also investing in wind energy, saying, “We saw it coming.” While the region is still largely dependent on the automotive industry, many now feel that the future of manufacturing is new technology, diversifying and repurposing, and alternative energy. Because of the high demand for trained workers from the petroleum industry in southeast Montana, a key partner of that state’s regional collaboration now has difficulty recruiting and retaining employees. Oil companies can pay workers with the same skills significantly more than he can. This company has trained a number of workers using ETA funds, only to lose the workers to more lucrative opportunities in the oil fields. Buoyed by higher oil and gas prices and increased investment in alternative energy, the energy sector workforce training programs in Metro Denver have enjoyed remarkable success, with active employer support and high placement rates for program graduates. New Resources and Opportunities Despite the failing economy that many regions are experiencing, new resources and opportunities have emerged in several of the Generation I regions – including West Michigan, the Piedmont Triad, and the North Star Alliance. In February 2008, the West Michigan Strategic Alliance (WMSA), which manages the West Michigan region, announced the launch of the West Michigan Green Jobs Regional Skills Alliance (RSA) to prepare workers for jobs in the burgeoning alternative energy industry. The
The Power of Partnerships: American Regions Collaborating for Economic Competitiveness, 2009 Interim Report
B e r k e l e y P o l i c y A s s o c i a t e s
15
RSA will focus on jobs needed to manufacture the components for renewable energy equipment, such as solar panels, and on jobs for workers at alternative energy power plants. Federal Express recently broke ground on a new sorting facility in the Piedmont Triad. This venture is expected to bring in significant job growth in logistics and distributions, areas that were targeted in the region’s grant proposal. One of the North Star Alliance’s key partners is the Maine Training Institute (MTI), a state-funded nonprofit corporation that offers early-stage capital and commercialization assistance for the research and development of innovative technology-based projects. MTI received a $1.2 million grant to develop business clusters in boatbuilding and composites and to support business expansions and training programs. The North Star Alliance was able to use these funds to supplement its ETA grant, creating a program wherein MTI provides funds to businesses for product enhancement while the ETA grant provides funds for employee training to support skills enhancement. To adapt to the significant and often sudden shifts in national and regional context, and to make the most of new opportunities within the region, leaders and managers within the regions have at times faced multiple simultaneous challenges. The next section describes the ways governance in the regions has evolved and responded to changing circumstances.
Governance Staff and other leaders who came on board for the implementation of the initiative set the tone for each region’s program plan. They shaped the initiative’s goals and priorities, and they determine the action steps taken to implement the initiative. Their effectiveness in bringing together the regions’ key partners and coalescing them around collaboration and innovation plays an important role in influencing the regions’ future economic well being. While many of the aspects of governance are intangible and resist analysis, the evaluation nonetheless explores the regions’ management and leadership, as site visitors observed them during the second round of visits to the regions in Fall 2008. The first Interim Evaluation Report noted that the Generation I regions have extremely diverse organizational structures. 25 The 13 management organizations remained essentially unchanged since 2007 when the evaluation conducted its first round of visits, as did the sub-units of those organizations responsible for day-to-day implementation of programs. On the other hand, leadership and project implementation roles have evolved in several regions, in line with two recurring themes. First, many regions consolidated or streamlined their grant-funded structures and teams. Second, a number of regions made changes in their governance structures that supported sustainability to extend and institutionalize collaborative activities and
25 For an overview of management structures in Year One, see Almandsmith, Sherry, et.al. Early Implementation of Generation I of the Workforce Innovation in Regional Economic Development (WIRED) Initiative: 2007 Interim Evaluation Report, ETA Occasional Paper 2008-03, June 2008, pp. 30-33.

The Power of Partnerships: American Regions Collaborating for Economic Competitiveness, 2009 Interim Report
B e r k e l e y P o l i c y A s s o c i a t e s
16
structures after the ETA grant ends. This section first describes changes in staffing of the management teams and the governance structures of the regions. It then explores the importance of leadership roles in implementing regions’ initiatives and the different patterns of leadership that have emerged within the 13 regions. . Changes in Regional Implementation Staff and Their Roles While only one region changed its overall manager, a few regions added, subtracted, or changed staff functions over the past year. These changes most often occurred in response to changing needs. In some regions, staff roles were added or changed once initial planning and implementation were complete; in others regions, staff functions were no longer needed and positions were eliminated as the initiative looked forward to its final months of implementation. Finger Lakes was the one Generation I region that changed its management. The original managing director was also the executive director of RochesterWorks!, the organizational home of the initiative. In April 2008, he resigned from both roles and became managing director of business development with an economic development organization, which was also a key partner. The Governing Board formed a nominating committee to lead the search process for a new managing director and eventually decided by consensus that the best candidate for the job was its chair. The new managing director is also executive director of the Greater Finger Lakes Regional Planning Council. His two roles are complementary in their nine-county geographic scope, their focus on the long-term economic well being of the region, and their overlapping stakeholders. Thus, this change in leadership may improve prospects for long-term continuity of the region’s mission and work toward regional economic transformation. Because the new Finger Lakes managing director had been centrally involved as a partner and member of the Governing Board since the initiative’s early months, he required only minimal time to settle into his new role. Respondents from the region reported that the change is “opening up” the initiative. Staffing changes at Wall Street West have resulted in management of the initiative being folded into the structure of the initiative’s management organization. As noted in the evaluation's first Interim Report, the Wall Street West program manager departed at the end of 2007. Instead of refilling the position, the Chief Executive Officer (CEO) of Ben Franklin NEPA, the initiative’s management organization, retained oversight of the initiative and remains involved in big-picture issues. For day-to-day activities, the organization hired a project coordinator who reports directly to the Chief Financial Officer (CFO). Her responsibilities include developing sub-grant RFPs, sub-grant monitoring, and reporting to the state. In April 2008, Wall Street West hired a director of communications to promote the initiative’s sub-grants within the community. Since training and talent development have become the region’s primary focus, the Director of Workforce Initiatives often now serves as the initiative’s spokesperson. Kansas City’s Executive Director has moved from management of day-to-day activities to focus on promoting the initiative’s vision. Between 2007 and 2008, the region added industry liaisons for its three key industry sectors – health care, biotechnology and advanced manufacturing. At the time of the second evaluation visit, Kansas City planned to hire an administrative assistant to work with the liaisons, and a public relations officer to facilitate outreach and education.
The Power of Partnerships: American Regions Collaborating for Economic Competitiveness, 2009 Interim Report
B e r k e l e y P o l i c y A s s o c i a t e s
17
In 2008, West Michigan streamlined its management team by eliminating the position of assistant project manager. Most of the initiative’s projects were well underway and no longer needed his support, and the region’s funding was scheduled to end in early 2009. Oversight of activities was then to be shifted to the Michigan Department of Energy, Labor, and Economic Growth, the region’s fiscal agent. Such changes in staff roles reflect the evolution of the regions’ needs as they moved past the initial implementation stage of transforming regional economies, or as they approached the end of the grant period. Staffing changes also indicate that the management organization used lessons learned from the initial months of operations to adjust roles or increase the efficiency of staff operations. Changes in Steering Committees and Other Governance Groups In addition to the key roles that initiative staff play, the major governance responsibilities and leadership roles are assumed by the regions’ Steering Committees, implementation teams, and other groups responsible for guiding and overseeing the initiative. This section describes the changes in these governance groups since the evaluation’s 2007 site visits. In nearly all regions, the guidance and decision-making roles of the Steering Committee26 changed between the 2007 and 2008 site visits. For the most part, however, Steering Committees have remained actively involved in shaping and remaining informed about the initiative’s activities in their regions. As illustrated in Figure 2.1 below, some of these committees have become less “hands on” in their involvement, while at least one (Finger Lakes) has become more active as the months have passed. Respondents in several regions noted that as their initiatives moved from the design and start-up phase of implementation to one of steady-state operations, their Steering Committees became less active and assumed more of a “big picture” policy oversight role than they had when their activities first began. Examples of such regions included:
The West Michigan Policy Council met less frequently during the second year of the grant than they had during the first year. At the time of the second evaluation visit, the majority of activities defined by the original grant proposal were already well underway or even completed, since the initiative was in its final months of funding.
Montana’s initiative also required less oversight by late 2008 than it did during its start-up phase, and its Executive Steering Committee meeting schedule changed from regular to occasional, in response to specific needs.
26 This report uses the term “Steering Committee” to designate the group responsible for governing, overseeing, or setting overall guidance for the region’s initiative. Individual regions use a variety of names for this group: Governing Board, Executive Committee, Action Committee, Leadership Team, Governance Council, Leadership Council, Governing Commission, and Policy Council.
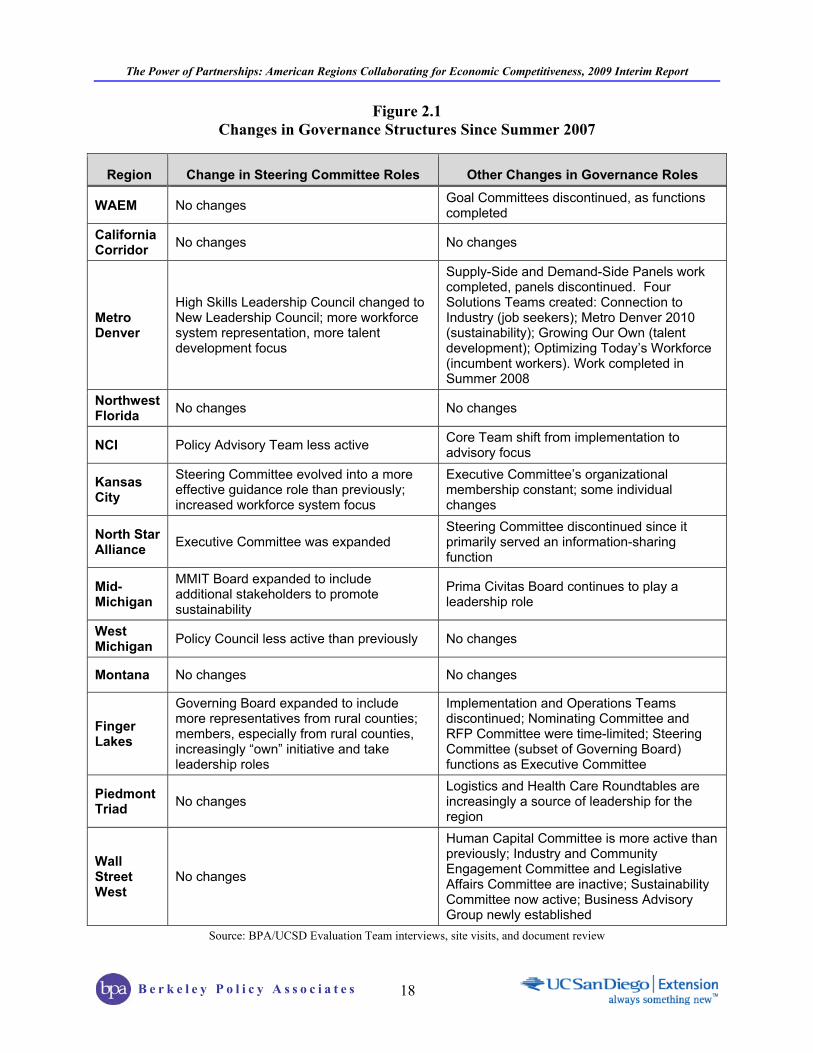
The Power of Partnerships: American Regions Collaborating for Economic Competitiveness, 2009 Interim Report
B e r k e l e y P o l i c y A s s o c i a t e s
18
Figure 2.1 Changes in Governance Structures Since Summer 2007
Region Change in Steering Committee Roles Other Changes in Governance Roles
WAEM No changes Goal Committees discontinued, as functions completed
California Corridor No changes No changes
Metro Denver
High Skills Leadership Council changed to New Leadership Council; more workforce system representation, more talent development focus
Supply-Side and Demand-Side Panels work completed, panels discontinued. Four Solutions Teams created: Connection to Industry (job seekers); Metro Denver 2010 (sustainability); Growing Our Own (talent development); Optimizing Today’s Workforce (incumbent workers). Work completed in Summer 2008
Northwest Florida No changes No changes
NCI Policy Advisory Team less active Core Team shift from implementation to advisory focus
Kansas City
Steering Committee evolved into a more effective guidance role than previously; increased workforce system focus
Executive Committee’s organizational membership constant; some individual changes
North Star Alliance Executive Committee was expanded
Steering Committee discontinued since it primarily served an information-sharing function
Mid-Michigan
MMIT Board expanded to include additional stakeholders to promote sustainability
Prima Civitas Board continues to play a leadership role
West Michigan Policy Council less active than previously No changes
Montana No changes No changes
Finger Lakes
Governing Board expanded to include more representatives from rural counties; members, especially from rural counties, increasingly “own” initiative and take leadership roles
Implementation and Operations Teams discontinued; Nominating Committee and RFP Committee were time-limited; Steering Committee (subset of Governing Board) functions as Executive Committee
Piedmont Triad No changes
Logistics and Health Care Roundtables are increasingly a source of leadership for the region
Wall Street West
No changes
Human Capital Committee is more active than previously; Industry and Community Engagement Committee and Legislative Affairs Committee are inactive; Sustainability Committee now active; Business Advisory Group newly established
Source: BPA/UCSD Evaluation Team interviews, site visits, and document review

The Power of Partnerships: American Regions Collaborating for Economic Competitiveness, 2009 Interim Report
B e r k e l e y P o l i c y A s s o c i a t e s
19
Similarly, WAEM’s Goal Committees were discontinued since the initiative did not need such a complicated structure once the projects relevant to each goal were underway.
The composition of NCI’s Policy Advisory and Core Teams remained relatively consistent over time; however, the level of engagement of these groups shifted beginning in late 2008. At the start of its initiative, the Policy Advisory Team set the vision and agenda for the region. The Core Team was then responsible for implementing that agenda. While these groups met monthly during the initiative’s first year, their schedule evolved to include less routine meetings, as the program staff increasingly managed the day-to-day operation of the initiative. The Core Team changed from being a hands-on implementation team to being more of an advisory body. Nonetheless, one respondent reported that the Core Team partnerships continued to be important and the team would live on, if only on an ad hoc basis.
All but a few regions added and subtracted subcommittees or implementation teams as the functional needs of their initiatives shifted. Some added advisory or similar groups to expand input from stakeholders, while others created subcommittees to explore strategies for sustainability. Like the changes in staff roles described above, these structural changes were made to address the initiatives’ evolving needs and often reflected lessons learned over time. In contrast to the regions described above, Finger Lakes saw an increase in its Governing Board’s leadership in shaping their initiative’s future. A bottom-up strategic planning process resulted in the creation of two ad-hoc committees: a Nominating Committee to search for a new Managing Director; and a Request for Proposals (RFP) Committee to shape the region’s final major initiative-funded investments. The RFP Committee was pleased with the quality of the two successful proposals submitted by separate coalitions consisting of 1) the region’s WIBs and 2) the region’s community colleges. The committee took the additional step of instructing the new sub-grantee groups to work together to assure that their respective projects were well aligned with, and complementary to, each other. This process resulted in increased “ownership” of the initiative among many of the Governing Board members, especially some of those representing rural counties who had previously expressed concern that a small Rochester-based group was driving the initiative. The Wall Street West 17-member Executive Committee has changed minimally, but the roles of standing committees evolved considerably after the initiative’s first year. The Human Resource Committee became extremely active because it was responsible for developing the sub-grant process for grant funds. A new Sustainability Committee was formed in Fall 2008 to focus on perpetuating the vision of transforming regional economies through collaboration beyond the grant period. A Business Advisory Group held its first meeting at the time of the second evaluation visit and was recruiting new members to address the region’s need for more representation from senior executives in the targeted industries. The Legislative Affairs and Industry and Community Engagement committees became inactive, largely as a result of the initiative’s evolution from a focus on economic development and business attraction to an emphasis on workforce and talent development. In another example of streamlining, the North Star Alliance dissolved one of its two oversight committees. The region originally had an Executive Committee, made up of the heads of the
The Power of Partnerships: American Regions Collaborating for Economic Competitiveness, 2009 Interim Report
B e r k e l e y P o l i c y A s s o c i a t e s
20
participating state agencies and industry representatives, and a Steering Committee, composed of most of the partners involved in the initiative. Over time, the partners realized that Steering Committee meetings were serving more of an information-sharing function than an oversight function, and that the number of meetings (including Executive, Steering, and Pillar committee meetings) was becoming burdensome. In response, they added a few key players to the Executive Committee and disbanded the Steering Committee. The committee changes in Metro Denver stand out because of the breadth of restructuring. The initiative shifted from a focus on well-researched design, with heavy industry involvement, to more action-oriented planning that required expertise from many different sources. The change was included in Metro Denver's original plan for the region and is summarized in Figure 2.2, below. Management in Generation I Regions Overall, the Generation I regions faced most of their challenges related to management structure early in their implementation process. Several initiatives were slow to bring all staff on board and begin actual program operations. During the second grant year, management changes demonstrated a more nimble approach and indicated responsiveness to the emerging needs of their initiatives. The evaluation’s first Interim Report provided an assessment of the extent to which regions had either flat management structures, with few “layers” in the chain of command, or more hierarchical organizations. The report characterized the extent to which regions’ decision-making appears to be consensus-based or staff-driven (top-down). These judgments were sometimes difficult, as several regions – especially the California Corridor – have multiple organizations in key roles, each with its own management style. The evaluation team updated these assessments based on information gathered during the 2008 site visits, and the results are shown in Figure 2.3, below. Compared to similar assessments made a year earlier, management and decision-making structures appear to have evolved in at least one region to become flatter and more consensus- based. Furthermore, several regions have moved from the “staff-driven” end of the spectrum to a middle ground, or more democratic form, of decision-making. Such changes may be a natural result of moving from initial implementation to full-scale operation of the initiative. Additionally, changes in several regions may also reflect an increase in trust as key partners become more accustomed to working with one another. The apparent changes in operating style may also be a natural outgrowth of the consolidation and streamlining that has taken place as the Generation I regions have moved beyond initial implementation to the mature operational phase. Another important aspect of program governance is the role of key leaders at the regional level. Leadership takes many forms and includes multiple functions, and only rarely is a single individual able to perform all those functions. Leadership in the Generation I regions is discussed below.
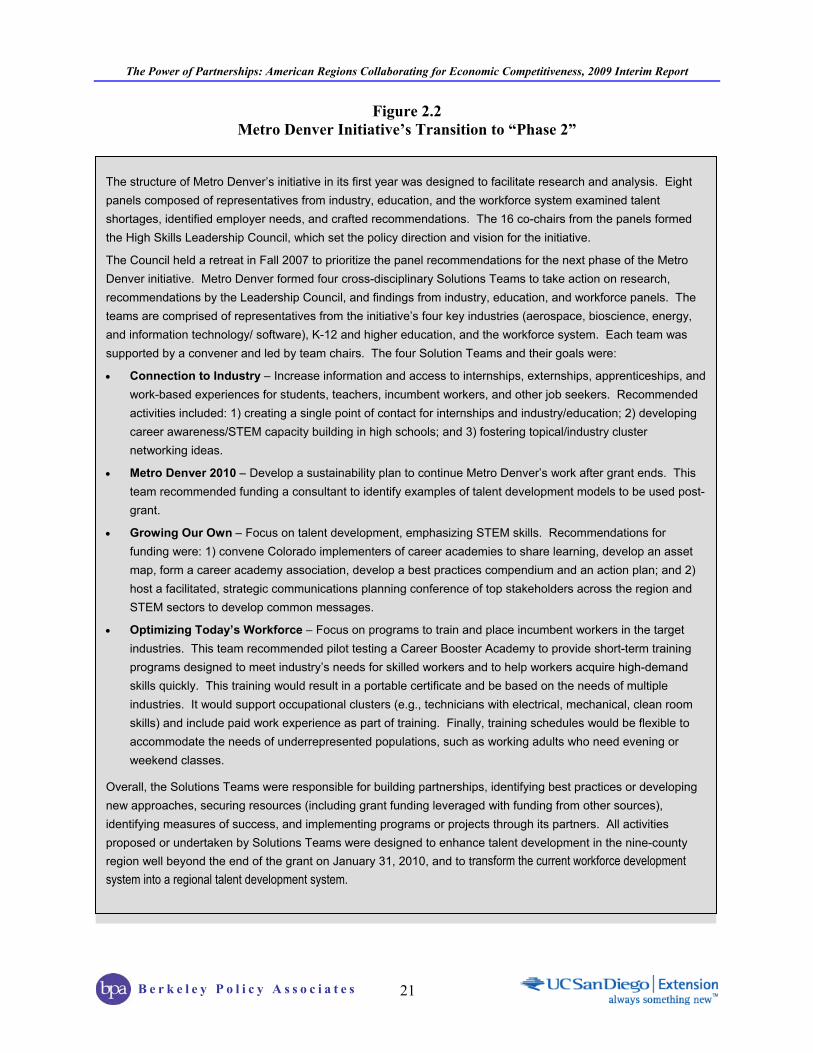
The Power of Partnerships: American Regions Collaborating for Economic Competitiveness, 2009 Interim Report
B e r k e l e y P o l i c y A s s o c i a t e s
21
Figure 2.2 Metro Denver Initiative’s Transition to “Phase 2”
The structure of Metro Denver’s initiative in its first year was designed to facilitate research and analysis. Eight panels composed of representatives from industry, education, and the workforce system examined talent shortages, identified employer needs, and crafted recommendations. The 16 co-chairs from the panels formed the High Skills Leadership Council, which set the policy direction and vision for the initiative.
The Council held a retreat in Fall 2007 to prioritize the panel recommendations for the next phase of the Metro Denver initiative. Metro Denver formed four cross-disciplinary Solutions Teams to take action on research, recommendations by the Leadership Council, and findings from industry, education, and workforce panels. The teams are comprised of representatives from the initiative’s four key industries (aerospace, bioscience, energy, and information technology/ software), K-12 and higher education, and the workforce system. Each team was supported by a convener and led by team chairs. The four Solution Teams and their goals were:
Connection to Industry Increase information and access to internships, externships, apprenticeships, and work-based experiences for students, teachers, incumbent workers, and other job seekers. Recommended activities included: 1) creating a single point of contact for internships and industry/education; 2) developing career awareness/STEM capacity building in high schools; and 3) fostering topical/industry cluster networking ideas.
Metro Denver 2010 Develop a sustainability plan to continue Metro Denver’s work after grant ends. This team recommended funding a consultant to identify examples of talent development models to be used post-grant.
Growing Our Own Focus on talent development, emphasizing STEM skills. Recommendations for funding were: 1) convene Colorado implementers of career academies to share learning, develop an asset map, form a career academy association, develop a best practices compendium and an action plan; and 2) host a facilitated, strategic communications planning conference of top stakeholders across the region and STEM sectors to develop common messages.
Optimizing Today’s Workforce Focus on programs to train and place incumbent workers in the target industries. This team recommended pilot testing a Career Booster Academy to provide short-term training programs designed to meet industry’s needs for skilled workers and to help workers acquire high-demand skills quickly. This training would result in a portable certificate and be based on the needs of multiple industries. It would support occupational clusters (e.g., technicians with electrical, mechanical, clean room skills) and include paid work experience as part of training. Finally, training schedules would be flexible to accommodate the needs of underrepresented populations, such as working adults who need evening or weekend classes.
Overall, the Solutions Teams were responsible for building partnerships, identifying best practices or developing new approaches, securing resources (including grant funding leveraged with funding from other sources), identifying measures of success, and implementing programs or projects through its partners. All activities proposed or undertaken by Solutions Teams were designed to enhance talent development in the nine-county region well beyond the end of the grant on January 31, 2010, and to transform the current workforce development system into a regional talent development system.

The Power of Partnerships: American Regions Collaborating for Economic Competitiveness, 2009 Interim Report
B e r k e l e y P o l i c y A s s o c i a t e s
22
Figure 2.3 Generation I Regions’ Structures for Management and Decision-Making
Source: BPA/UCSD Extension Evaluation Team interviews, site visits, and document review Leadership in Generation I Regions Any initiative that aims to mobilize business, industry, government agencies, education, and social service institutions, as well as individual citizens, will place great emphasis on finding appropriate economic, political, and civic leadership. The question arises as to whether the presence of a “sparkplug,” one particularly talented and influential leader, is a major factor facilitating a strategy’s implementation and contributing to the initiative’s success. While answering such a question with certainty may not be possible, the evaluation team explored the components of effective leadership and the ways they are manifested in the Generation I regions. The types of leadership that appeared to make a difference to the Generation I regions are related to the challenges these regions faced, and to the following three, specific leadership mandates:
1) Championing the initiative’s vision and mission;
2) Catalyzing the mobilization of collaborative efforts across a number of siloed geographic, economic, and institutional boundaries; and
3) Integrating plans and programs in a way that leverage complementary assets and distribute needed resources in an equitable and efficient manner.
Flat Management Structure
Hierarchical Management Structure
Staf
f-Driv
en o
r Top
-Dow
n D
ecis
ion
Mak
ing
Consensus-B
ased Decision M
aking
Flat Management Structure
Hierarchical Management Structure
Staf
f-Driv
en o
r Top
-Dow
n D
ecis
ion
Mak
ing
Consensus-B
ased Decision M
aking
Flat Management Structure
Hierarchical Management Structure
Staf
f-Driv
en o
r Top
-Dow
n D
ecis
ion
Mak
ing
Consensus-B
ased Decision M
aking

The Power of Partnerships: American Regions Collaborating for Economic Competitiveness, 2009 Interim Report
B e r k e l e y P o l i c y A s s o c i a t e s
23
While these three components of leadership are interrelated, they are nonetheless distinguishable. In very few cases does a single individual or institution provide leadership across all three types of activities. In many instances, a single leader is more effective in one of these roles than in others. In most Generation I regions, the evaluators noted that different individuals played different leadership roles. To understand the role of leadership in furthering the goals of the Generation I regions, dissecting where individual regions fall across these leadership dimensions is useful. In both Montana and the North Star Alliance, the governor plays a leadership role, primarily in catalyzing collaboration across agencies. In both places, championing the mission of regional collaboration is the role of the regional leads/project directors. Because the project directors of both of these initiatives are state employees, their constituency or their history of public service may encompass more than the initiative. Therefore, their leadership may take on a less “zealous” character than observed in other regions. In Maine (North Star Alliance), the chairs of the various Pillars provide leadership for the integrating function, based on the budget priorities that the Executive Committee established. The Pillar chairs come from both state agencies and the community: Department of Labor staff lead the Workforce Pillar; university staff chair the R&D Pillar; business leaders lead the Market Development Pillar; and Department of Commerce staff chair the Capitalization/ Investment Pillar. In Montana, leadership for the purpose of integrating plans and programs is even more diffuse –the project director assumes some of that leadership, but much of it also falls to the managers of the sub-grants within the Departments of Commerce, Agriculture, and Education. NCI is another example of dispersed leadership, where three distinct aspects of leadership manifest in the following three people (see in Figure 2.4, below):
The Principal Investigator is the keeper of NCI’s expertise and plays the role of champion. He was the primary author of the initiative and continues to provide the vision and leadership for NCI. The policy consultant reports to him, and he also directs the activities of the project administrator.
The Economic Policy Consultant is an expert in regional economic development and was the chief author of the region’s implementation plan. He is the “intellectual and philosophical compass” of NCI; at a crucial point in the development of the initiative, he served as a catalyst. In his current role, he continues to provide expertise to NCI but as a consultant rather than a leader. His perspective is relatively abstract; he leads the civic leadership initiatives but otherwise is not involved in implementation.
The Project Administrator is the initiative’s integrator. His role is strictly management. His background in business and aviation as a commercial pilot appears well suited for implementing plans, following instructions, and troubleshooting problems.

The Power of Partnerships: American Regions Collaborating for Economic Competitiveness, 2009 Interim Report
B e r k e l e y P o l i c y A s s o c i a t e s
24
Figure 2.4 North Central Indiana’s Three Leaders
Source: BPA/UCSD Extension Evaluation Team interviews, site visits, and document review
The principal champion in the Piedmont Triad is the CEO of Piedmont Triad Partnership, although members of the initiative’s team (such as the project manager and the chair of the Action Committee) also share that role. Implementation leadership comes from the project manager, with help from a strong internal team. Catalyst roles are even more widespread and are played by at least three key staff (including directors of some of the Industry Cluster Roundtables) and one or two members of the Action Committee. In Finger Lakes, many stakeholders believe that early implementation was hampered by the lack of a single “spark plug” leader, a visionary and catalyst. They report that with the selection of a new managing director for the initiative, a champion is emerging. The program’s momentum has been sustained since the beginning by the presence of an extremely capable implementer, who unfailingly “gets things done” and serves as an integrator of the efforts and energies of others. Only two regions – WAEM and Kansas City – are led by individuals who are regarded as the kind of influential leader who serves as both a catalyst, mobilizing collaborative efforts, and as a champion of the collaborative vision. In other regions – such as Mid-Michigan and Northwest Florida – members of the Steering Committee and other partners have taken on a combination of those roles. California Corridor’s leadership is split among several individuals, including: the consultant who pulled together the original, collaborative proposal-writing effort and continues to play important facilitating roles throughout implementation; and a strong project lead who combines integrative leadership with a champion role. The Executive Director of the California Space Authority is a powerful advocate for the aerospace industry as a whole but has not played a strong leadership role in the initiative.
Principal Investigator
Economic Policy
Consultant
Project Administrator
Provides overall vision and expertise
Provides overall “philosophical” vision
Provides management of day-to-day activities
The Power of Partnerships: American Regions Collaborating for Economic Competitiveness, 2009 Interim Report
B e r k e l e y P o l i c y A s s o c i a t e s
25
While effective leadership of innovative initiatives such as those funded by this grant requires a combination of roles –champion, catalyst, and integrator – evidence from two rounds of site visits suggests that no magic formula exists for finding or “growing” an individual who has the talent to perform all of these roles. Leadership spread among several individuals is far more common; indeed, such an arrangement may prove most effective in assuring that the initiative will have a lasting impact. Dispersed leadership may multiply the opportunities for sustainability, as any one of the individuals who has “taken on” leadership may prove effective in catalyzing post-grant collaboration and economic progress.
Conclusion The individuals leading and managing these collaborative partnerships in the Generation I regions, however diverse their stories and styles, have much in common. They share a commitment to building opportunity across their regions, pulling together the disparate cities, towns, and rural areas within the regions, and convincing other leaders of the advantages of working together. They have encountered the difficulties brought on by a faltering economy, such as reluctance to take risks or invest within the private sector, tightening purse strings and budget deficits within the public sector. They have adapted to changes within ETA leadership and the associated shifts in messages about what they should be accomplishing. Finally, they have assembled a large number of talented individuals and key organizations within their regions – all with time constraints and conflicting priorities – to create common missions, action plans, and the partnerships needed to bring those plans to fruition. The next chapter explores the roles of key partners, some of whom have taken on leadership responsibility in designing, overseeing, and carrying out the work of transforming their region. The chapter then examines the ways partners collaborate. Finally, the chapter discusses the social networks that foster communications among partners, initiative staff, and governance groups.

The Power of Partnerships: American Regions Collaborating for Economic Competitiveness, 2009 Interim Report
B e r k e l e y P o l i c y A s s o c i a t e s
26
Chapter 3: Partnerships and Collaboration One of the most remarkable achievements of the initiatives is the development of a large number of new, productive, and often innovative partnerships. The move toward partnership was already underway at the time of the evaluation’s first site visits; it continued and often had accelerated by the time of the second site visits. In fact, respondents in many regions cited new and unexpected partnerships as among the chief benefits of participating in a regional approach to economic development. This chapter describes the changes in partner roles and collaborative strategies reported by interview respondents during the evaluation visits. The discussion on collaboration continues with the results of a second round of social network analysis.
Partnerships and Partner Roles Grantees do not share a common definition of “partner.” The term is used in many different ways, even within a single region. Partners may be one of at least four types:
Decision Maker partners include the individuals (or the organizations they represent) who serve on the management team, the Steering Committee, and other key committees that are part of the governance structure.
Inner Circle partners tend to be members of the group that developed the grant proposal, along with individuals or organizations that contributed ideas or letters of support at the proposal stage. Others in this category may be members of advisory groups and leadership groups that contribute in important ways to the content of initiative-funded work, but are not responsible for making decisions.
Program partners are usually the organizations that operate and manage projects funded by the initiative.
Stakeholder partners may include a host of organizations regarded by initiative leaders as “key players” in the region. These may include local government entities, economic development organizations, industry associations, foundations, workforce investment boards, organized labor, universities, colleges, school districts, R&D centers, training providers, angel networks, Chambers of Commerce, and a variety of civic and not-for-profit organizations.
A region typically has partners that meet several of these descriptions, and a single organization or individual often plays more than one of the above roles. A group of partners may be relatively homogeneous and have a well-defined set of goals. An example would be one of Piedmont Triad’s Industry Cluster Roundtables, in which most members are inner circle partners, i.e., owners or managers of businesses in a particular industry, such as health care. In other instances, a relatively heterogeneous group of partners may share a particular interest, such as assuring that the region’s young adults are well prepared to enter the workforce; its members may include educators, workforce system professionals, employers,
The Power of Partnerships: American Regions Collaborating for Economic Competitiveness, 2009 Interim Report
B e r k e l e y P o l i c y A s s o c i a t e s
27
labor organizations, non-profits focused on youth development, parents, and social service agencies. Such a group may serve in an advisory capacity, or it may be central to the region’s decision-making (such as Metro Denver’s Solution Teams). Site visit respondents consistently identified partnerships developed as a result of participation in the initiative as being among a region’s most valued assets and most sustainable outcomes. As a consequence, staff members spend an enormous amount of time communicating with partners, keeping them informed of the initiative’s activities and accomplishments, seeking their input, inviting them to upcoming events, and soliciting their support. Some regions – such as Wall Street West and Kansas City – have dedicated a full-time staff position to the role of communicating with partners as well as with the general public, who are considered potential partners. The discussions that follow define “partners” as the individuals and organizations that have some involvement in a funded activity. This chapter discusses the ways partnership arrangements have changed between the first and second site visits, the evolution of partnerships involving previously competing organizations, partnerships involving the workforce system, and the roles that different types of partners play. The second part of the chapter describes strategies regions have used for building and nurturing collaboration. Expanding Partnerships Beyond the Initial Inner Circle Partnerships tended to change most dramatically in regions where a previously well-defined group of organizations collaborated in creating the grant proposal or were chosen at the proposal stage to operate pre-designated projects. Some regions found that to accomplish their goals, they needed to make efforts to expand their partnerships; others needed to reallocate unspent grant funds, and this process allowed them to bring new partners on board. All of the Generation I regions had to identify and enroll partners on a very short timeline in order to meet the RFP deadline. This impacted the degree to which the proposal writers were able to engage their partners in the process of creating a vision for the grant. For example, the California Corridor was one of the regions in which decision-making partners and program partners were defined during the proposal stage. The California Space Authority (CSA, the initiative’s organizational home) gathered all partners early in the project to lay out the 25 projects identified in the California Corridor proposal, and so, most of the partners did not participate in the process of identifying the initiative’s mission, goals, and philosophy. Several respondents said that while they understood CSA's intent to get funded projects underway quickly, the quick launch also meant that CSA lost the benefit of time to develop a common vision among its more than 70 partners. The early iteration of the California Corridor project also lacked sufficient numbers of key stakeholders from the workforce system, partners from education/academia at the decision-making level, industry representatives, and other stakeholders. Over the past two years, CSA has addressed this shortcoming by convening several advisory panels and steering committees to focus on the needs of specific funded projects. The Supply Chain Industry Advisory Group, the STEMCAP Steering Committee, the Project Pipeline Advisory Group and the UC Santa Clara
The Power of Partnerships: American Regions Collaborating for Economic Competitiveness, 2009 Interim Report
B e r k e l e y P o l i c y A s s o c i a t e s
28
Advisory Panel brought in numerous company representatives – along with high-level government and education stakeholders – to broaden stakeholder engagement in the grant. Respondents frequently cited service on these and other committees as a valuable path to forming new and lasting partnerships that have benefited their own organizations. Much of the Finger Lakes funding was also allocated to partners included in the grant proposal before the grant began. Many respondents in that region noted that important changes in partnerships occurred between 2007 and 2008. In 2007, the decision-making group appeared to be dominated by Rochester organizations, and representatives of the region’s rural counties saw themselves as outsiders. As the Governing Board took on the challenges of finding a new Managing Director and designing an RFP process to spend recaptured funds, members from rural counties took on active roles in the process. One such member described the change: “There has been a lot of movement, silos broken down, a lot of collaboration. We [rural counties] are now an agenda item at every WIB board meeting, and the discussion includes the future, how relationships strengthen, and the role of board member attitudes. We are becoming less parochial…. There is less anxiety among rural regions, more ‘we’ and less ‘I’– smaller communities see that they are tied together.” The need to spend unallocated and recaptured funds presented an opportunity to expand partnerships in Kansas City as well. The region initially defined its partner organizations as those included in its proposal and allocated the entire grant at the time of application. During the first round of evaluation visits, several respondents noted that this arrangement limited expansion of the network to new partners. During 2008, Kansas City undertook an RFA process to reallocate $800,000 in funds recaptured from unspent grant allocations to WIBs. Several of the region’s Executive Committee members described this process as an opportunity for the initiative to look at new partners and projects and to leverage their other investments. While only current sub-grantees were invited to apply, these groups were encouraged to include other partners in their proposals. The RFA process provided an opportunity “to look at new partnerships with evidence of synergistic connectivity.” WAEM has adopted a very broad definition of partnership that encompasses the more than 500 individuals and organizations that are involved in implementing the region’s activities. In addition to its contracted partners, WAEM partners in the region include municipal governments, business and industry, local economic development organizations, university/college coalitions, regional commissions, the Mississippi Band of Choctaw Indians, business associations, and regional foundations. Many new partners were added in the past year, including the University of Alabama’s (UA) Center for Community-Based Learning, the UA Rural Entrepreneurship through Action Learning (REAL) program, members of the WAEM region’s Mayors’ Network, and the Area Health Education Center (co-located at The Montgomery Institute). These new partners have played a variety of different roles in the partnership. For example, the business faculty and students at the UA Center for Community-Based Learning have assisted in creating and maintaining the MyBiz website, while the members of the Mayors’ Network – in addition to championing economic development in their own towns – have joined forces with each other and with WAEM to promote a regional vision and take action on regional issues.

The Power of Partnerships: American Regions Collaborating for Economic Competitiveness, 2009 Interim Report
B e r k e l e y P o l i c y A s s o c i a t e s
29
Forging Partnerships among Traditionally Competing Organizations Working together has allowed organizations that previously regarded themselves as competitors to recognize the extent to which they share goals. Many discovered that they are stronger working together than in isolation or in competition with each other. The most notable examples of these new-found symbiotic partnerships are those between economic development organizations and post-secondary education institutions, many of which have learned to de-emphasize rivalries and jurisdictional boundaries in order to meet common challenges. Economic Development Organizations Local economic development organizations, whether private or public, traditionally have seen each other as competitors rather than collaborators. Contrary to this tradition, NCI has been able to foster a working relationship between the local economic development organizations (LEDO) for the 14 counties in the region. Together they have developed a Regional Marketing Packet that includes regional workforce and industry profiles and a catalogue of available manufacturing sites. Through an NCI-sponsored advisory committee, the LEDOs jointly provide input into planning how to strengthen the regional economy. They are now sharing advice and assistance and pursuing joint endeavors. Several local projects – such as a wind farm in Howard County, a business park in Miami County, and a job fair in Tippecanoe County – have benefited from this regional communication and cooperation. During the grant’s second year, turnover among leaders of these partner organizations meant that NCI staff had to spend time building new relationships. NCI leaders continue to seek ways to build deeper relationships with the LEDOs, including networking with individual board members of each of the organizations. The initiative in Northwest Florida served to strengthen and support existing partnerships between LEDOs that had been forged by Florida’s Great Northwest, Northwest Florida’s home organization, prior to the grant. Midland, Bay, and Saginaw counties in Mid-Michigan had always been considered a region, but the local counties’ economic development organizations traditionally did not work together before the initiative. Economic development leaders from all three counties are now collaborating on a new photovoltaic study for the initiative. Furthermore, the Center for Entrepreneurship and Commercialization at SVSU, created by the grant, has worked to develop lateral connections across economic development organizations, with a focus on fostering “high expectation entrepreneurship.” Economic development organizations in the Wall Street West region began collaborating in 2007 to attract New York-based financial firms to invest in the region. The collapse of the financial sector in 2008 made that goal no longer feasible in the short run, however, and economic developers retreated from what had appeared to be promising partnerships. Post-Secondary Education Institutions Post-secondary education institutions, particularly community colleges, compete with each other for enrollments and funding because they are based in different jurisdictions and often funded by separate and distinct tax districts. Many regions report that community college systems, while

The Power of Partnerships: American Regions Collaborating for Economic Competitiveness, 2009 Interim Report
B e r k e l e y P o l i c y A s s o c i a t e s
30
appearing to cooperate, have not yet formed genuine partnerships. Other regions report significant progress in this direction. For example:
Several regions (e.g., Piedmont Triad, Finger Lakes, and Metro Denver) made the formation of new partnerships a requirement or priority for funding in their competitive RFP processes. The result has been the creation of partnerships to operate specific projects. Some of these partners have institutionalized the projects into their ongoing structures,1 so that outside funding will not be required to keep them in operation. Such partnerships and projects are likely to persist beyond the end of the grant.
In the NCI region, Purdue University, Ivy Tech, and Indiana University, Kokomo, had a history of competition before the grant. By collaborating on initiative projects, IU-Kokomo and Ivy Tech are recognizing the strong similarities between their two institutions; and while Purdue excels in technology transfer, entrepreneurship resources, and policy innovation, the smaller institutions are recognizing their suitability to provide vocational training.
Wall Street West’s Higher Education Consortium helps the region's education institutions better understand industry needs and design appropriate training and educational curricula to meet those needs. The consortium’s industry members benefit from becoming knowledgeable about the region’s educational resources and thus can assist in shaping resources to be more responsive to changing talent needs.
The community colleges in the Finger Lakes region partnered to respond to a 2008 RFP, thereby creating the Regional Center for Workforce Excellence. This Center was still being formed at the time of the 2008 site visit, but it appeared promising as a mechanism for breaking down pre-existing barriers among the colleges. On the other hand, the anticipated collaboration could be limited to staff operating workforce-focused programs within the colleges and may not pervade the colleges more broadly. Respondents believe that a real test of the ongoing impact of these activities will be to observe the progress of the community colleges, to see if they sustain the Center over the long-term and partner to create related initiatives.
From the beginning of the grant-funded collaboratives, partnerships among community colleges have been central to the structure of WAEM’s initiative. WAEM developed partnerships among community colleges that had previously not collaborated with each other even within their respective states, much less across the state line. The community and junior college systems in the two states are very different: Mississippi colleges are operated locally and are very different from each other. Alabama colleges are centralized under a state Board of Education and have common reporting requirements that tend to standardize the way the colleges are organized. Thanks to the introduction of regional collaboration activities, WAEM was able to “marry the top-down system in Alabama with the bottom-up system in Mississippi.” At the same time, however, numerous changes in personnel at the
1 Examples include several of the health care programs undertaken by community colleges in the Piedmont Triad.
A respondent in the North Central Indiana region noted that, before the grant, the last meeting between the chancellors of Ivy Tech, Kokomo and Indiana University, Kokomo was nine years ago. They now meet monthly.

The Power of Partnerships: American Regions Collaborating for Economic Competitiveness, 2009 Interim Report
B e r k e l e y P o l i c y A s s o c i a t e s
31
top levels of the community colleges in Alabama have complicated these partnerships. Two of the four Alabama colleges “are now being led by their third president since the grant began.” Upcoming retirements at the other two colleges and at several of the Mississippi colleges will mean still more change in the near future. Bringing new partners up to speed is time-consuming and may be especially difficult when the changes in personnel are the result of upheavals in the partner organizations. Nonetheless, WAEM staff members are pleased to report that “some of the newer presidents have really become engaged in workforce development and community development” and are now becoming more active in collaborating with each other and in the initiative’s efforts to transform the region’s economy.
Three of the Piedmont Triad’s community colleges partnered to develop the first Associate Pharmacy Technician program in North Carolina. Pharmacists employed by a local health care facility are interested in contributing to the program by teaching special lessons in advanced pharmacology. These professionals have offered to coordinate educational on-the-job training sessions within the Wake Forest University Baptist Medical Center’s pharmacy.
In Montana too, the initiative has fostered closer collaboration between the region’s community colleges, and between the colleges and state universities. Colleges that have been in competition for many years now cooperate on events, share expertise and coordinate course offerings. The new emphasis on collaboration has also led to joint projects between the community and tribal colleges and programs with MSU, Billings. Some of these connections are subcontractual; others take the form of more frequent informal contact and information sharing.
One of the most interesting collaborations between post-secondary institutions is an alignment of the programs in heavy truck diesel maintenance offered at both Montana State University Northern (MSU-Northern) and Mid-South Community College (MSCC) in West Memphis, Arkansas, in the Arkansas Delta, which received grant funds as a Generation II region. MSU-Northern is providing mentoring and training to MSCC faculty so that Mid-South students will have a more seamless path to a four-year education in this field.
Solidifying Partnerships Among Workforce Investment Boards Workforce Investment Boards (WIBs) in several regions have formed new partnerships, formal and informal, by undertaking collaborative efforts in response to funding opportunities. In at
least a few regions, WIBs have strengthened their pre-existing partnerships through joint efforts to operate initiative-funded projects. This section presents several examples of collaboration between workforce system partners. Wall Street West added an additional county to the region so that its boundaries would be contiguous with those of its local workforce system area partners. The three WIBs in the Finger Lakes have joined together to create a Regional Skills Alliance and are jointly creating a regional website for job seekers.
A Montana Job Service manager jokingly referred to collaboration as The Miracle of the Pies: “As the pies shrink, everybody brings their pies to the table. When they do, they find there’s an extra pie that no one noticed before.”
The Power of Partnerships: American Regions Collaborating for Economic Competitiveness, 2009 Interim Report
B e r k e l e y P o l i c y A s s o c i a t e s
32
The Piedmont Triad used grant funds to increase the scope of region-wide WIB activities that now include periodic “virtual job fairs” in which employers host an online “booth” to advertise vacancies and take online applications from job seekers. Respondents from WIBs in this region differ in their opinions about the extent to which this initiative has strengthened partnerships that pre-date the initiative. Their regional partnership, TriadWorks!, has state support and will definitely continue since the WIB directors believe that collaborating across jurisdictional lines strengthens their ability to respond to employers’ needs. Some California Corridor WIBs have learned that by forming partnerships, they can eliminate duplicative efforts or undertake projects that would have been impractical for a single WIB to undertake alone. Collaboration is not region-wide, but rather driven by the advantages that particular WIBs see in working together on specific initiatives. Several funded projects required WIBs to undertake extensive data collection efforts. While these usually took longer than anticipated, respondents noted that the collection process itself proved to be a valuable tool for nurturing partnerships and collaboration. The great majority of the respondents saw data collection, both in terms of results and process, as one of the most valuable outcomes of these activities. One respondent remarked that the initiative’s goals “ brought about collaboration,” and “led to asking ‘why everybody is doing the same thing, why there is so much duplication of effort.’” Another respondent reported that key relationships had been formed at the staff level, where things really get done, and not just among leaders. This respondent noted, “Having interlocking boards doesn’t get you there.” In West Michigan, WIBs have worked together – and with school districts, community colleges, and businesses – to promote and implement WorkKeys, a skills assessment program that is the basis for the National Career Readiness Certificate (NCRC). One-Stop Career Centers have been very active in promoting WorkKeys and some companies are now including a related credential level in their job postings. The success of their efforts has been noted statewide; legislation passed in August 2008 requires Michigan high school students to take all three WorkKeys tests annually, giving them the opportunity to earn the NCRC credential. Another region-wide effort – the Health Care Regional Skills Alliance – brings together five of the region’s six WIBs, along with health care employers and other advocates to develop and retain the health care workforce in the region. Building region-wide workforce partnerships is not always easy. In Kansas City, the goal of regional collaboration motivated the Regional Workforce Council to move toward integrated services across the region’s WIBs, with mixed results. The focus has been on creating a common brand – defined as a consistent customer experience – throughout the region, the logic being that if employers and job seekers are consistently satisfied with their experience regardless of which jurisdiction they contact, WIBs region-wide will benefit. WIB respondents saw some value in being able to share information with their peers from other WIBs through the Regional Workforce Council, but enthusiasm for the partnership has waned due to differences in opinion and lack of ongoing communications. Furthermore, as one respondent noted, belonging to multiple overlapping regional bodies is difficult in the absence of a single universally defined and accepted region. Another respondent, however, believed that the Regional Workforce Council facilitated information sharing and fostered many informal connections, thereby
The Power of Partnerships: American Regions Collaborating for Economic Competitiveness, 2009 Interim Report
B e r k e l e y P o l i c y A s s o c i a t e s
33
facilitating collaboration on future grant proposals by having a pool of established partners from which to draw. In most of the regions mentioned here, a new approach to regionalism has at the very least enabled WIBs to undertake collaborative efforts. For some, these efforts will continue beyond the end of the grant. WIB respondents believe that their experience collaborating will ultimately strengthen their partnerships. Building Boundary-Spanning Partnerships The evaluation’s first Interim Report focused on partners’ structural roles in creating and implementing their regions’ initiatives – roles such as grantee, fiscal agent, project management organization, and Steering Committee. In the 2008 site visits, the evaluation team found that partnerships and roles that have emerged as important are those related to accomplishing the regions’ missions. Many of those efforts have been described in the sections above. What is in common among many of these efforts is that they required partners to reach beyond their accustomed “turf” and become knowledgeable about – and respectful of – the capabilities, priorities, funding constraints, and even vocabularies of organizations with which they previously had little in common or shared only a few interests. For many partners, this was a substantial journey. This section offers examples of partnerships that cross professional boundaries. In several regions, partnerships between economic development organizations and workforce organizations were virtually unknown prior to the initiative. Through participation in grant-funded committees and activities, economic development organizations have been exposed to workforce partners and as a result become increasingly aware that companies looking for possible new sites pay close attention to the skills and readiness of the workforce in the local areas they are considering. These economic development organizations have sometimes introduced “prospect” companies to WIB personnel, who can explain to the companies how WIBs can assist with recruiting and screening workers. Montana's Business Expansion and Retention (BEAR) teams are a way to link up new, expanding, or troubled businesses with a coordinated set of public and private resources at the local level. BEAR is a partnership of the Governor’s Office of Economic Development, Department of Commerce, Department of Labor, and the Montana Economic Developers Association. Locally, the program is supported by staff time and resources donated by the organizations that make up the network. Although BEAR predates the grant, it is very much in the collaborative spirit. The teams play an especially important role in remote rural areas. The BEAR team’s membership will vary, but generally includes banks, business associations like the Chamber of Commerce, local government and economic development corporations, Small Business Development Centers, community colleges or universities, and Job Service representatives, including grant-funded consultants. Any organization in a BEAR network can be the point of first contact and referral. Once a business has expressed interest in BEAR services, two team members will do a detailed business needs assessment. The team then meets and makes recommendations for appropriate services and resources, including employee training. Team members follow up with business-level case management, helping to make
The Power of Partnerships: American Regions Collaborating for Economic Competitiveness, 2009 Interim Report
B e r k e l e y P o l i c y A s s o c i a t e s
34
specific connections to public, private and non-profit assistance (including other BEAR teams) as needed. Initiative-funded staff members are active players in several existing BEAR teams and have been instrumental in getting new teams started in several parts of the region. Some respondents see BEAR as a key to sustaining transformative-type operations in the longer term. Another type of cross-functional collaboration begun in many areas around the nation prior to the grant is business-education partnerships. Such partnerships often focus on the connection between what young people are learning while enrolled in K-12 schools and the talent of workers who will be available to the business community several years in the future. Several such partnerships have become active, often joining as advisors to specific funded projects. One very active business-education partnership is the Finger Lakes Advanced Manufacturing Enterprise (FAME). While FAME was in place before funding, the grant’s funding has facilitated its growth, and its leader – the president of a manufacturing company – is a staunch partner and advocate for the initiative. Finger Lakes is home to another type of partnership involving educators and private business, specifically in the area of technology commercialization. Over the past year, the university-based R&D centers, entrepreneurship education centers, operators of incubators, and entrepreneurship experts have come together to create the Technology Commercialization (TC) Project. TC Project partners include High Tech Rochester, University of Rochester, The Technology Farm (Cornell Agriculture & Food Technology Park), Infotonics, and Rochester Institute of Technology. The project trains researchers, students, faculty, and entrepreneurs in ways to increase skills and realize success with technology commercialization. The TC project also provides an integrated approach among partners to improve business development and demonstrates how to integrate research and new product design with the benchmarks associated with key industries. The project helps start-up companies develop business plans and raise capital. Participants in this grant-supported project believe it may well be key to the future revitalization of the region as a nationally known center for innovation and business success. WAEM's partner colleges have become an important tool for attracting large manufacturers to the region, a role typically filled by economic development entities. From a business standpoint, WAEM's credentialed training removes many concerns about labor force quality; thus, companies are more likely to accept the “local first hires” policies that states typically attach to their industry attraction subsidies. The more progressive colleges have helped employers organize their initial screening and hiring programs and have provided other forms of relocation assistance as well. The community colleges have also become more proactive partners in Rapid Response activities, working closely with the WIBs and local government in providing assistance to workers affected by large-scale lay-offs. West Michigan’s Health Care Regional Skills Alliance (RSA) brings together five of the region’s six WIBs, along with health care employers, local universities, and other advocates to develop and retain the health care workforce in the region. The RSA formed a Health Care Workforce Employer’s Council, which held its first meeting in July 2007. The Health Care RSA identified strategies to meet employer needs in six key occupations and initiated a career ladder program between Montcalm Community College and Ferris State University that allows nursing students to move seamlessly from an Associate degree to a Bachelor of Science degree in nursing.
The Power of Partnerships: American Regions Collaborating for Economic Competitiveness, 2009 Interim Report
B e r k e l e y P o l i c y A s s o c i a t e s
35
The California Corridor partnership that formed between the workforce system, economic development agencies, and higher education to develop 21st Century Job Profiles gave all of the partners a more complete understanding of the skills the future workforce needs. The profiles revealed that technicians in the high tech industries soon will be required to have higher education and skill levels; they will need a combination of conceptual and applied knowledge and skills and will need to bring business skills to the workplace. Employee candidates need the ability to obtain high security clearances, which means that prospective job seekers in high tech (at least aerospace and defense) will need to focus greater attention on lifestyle choices and decisions. These sorts of boundary spanning partnerships represent an important platform for the future. Groups that have had the experience of working together on these activities are well positioned to work together beyond the grant period. Most are having positive experiences based on new forms of respect and trust as well as evidence that sharing resources can enhance and even enlarge their success. In sum, during the evaluation’s second visits to the regions, the evaluators found that partnerships were evolving in a number of ways. They were 1) expanding beyond the original inner circle; 2) being forged among traditional competitors; 3) solidifying among workforce investment boards and 4) building boundary-spanning activities. Strategies for Fostering Collaboration Of the many possible strategies for building collaboration that emerged from this experience, regions report the most successful approaches included: thinking creatively about common goals; allowing relationships to develop over time; building on personal relationships; and making expectations clear while expecting the best of collaborators. This section discusses each of these strategies. Think Creatively About Common Goals Many of the regions began their initiatives successfully by beginning slowly. After a group of “insiders” determined initial and specific goals and strategies, they invited other stakeholders to participate in early planning and then made noticeable changes between the initial proposals and the implementation plans. Regions that skipped this early “visioning” or extensive planning process, (e.g., the California Corridor) reported that their initiatives might have benefited from the teambuilding that naturally would have occurred during the slower process. The most notable example of a group that spent considerable time thinking about the goals of the regional economy, and how they might be achieved, is the Piedmont Triad Leadership Institute (PTLI), a grant-funded activity that encompassed both an intensive leadership course and development of projects to improve the region’s economy. The Leadership Council, a group of more senior regional leaders, identified “up and coming” leaders within the region and invited them to participate in PTLI. The first step was a four-day session delivered by the Center for Creative Leadership that consisted of individual development and team-building exercises based on action learning in a no-boundary, no leader setting. PTLI teams then explored the needs of
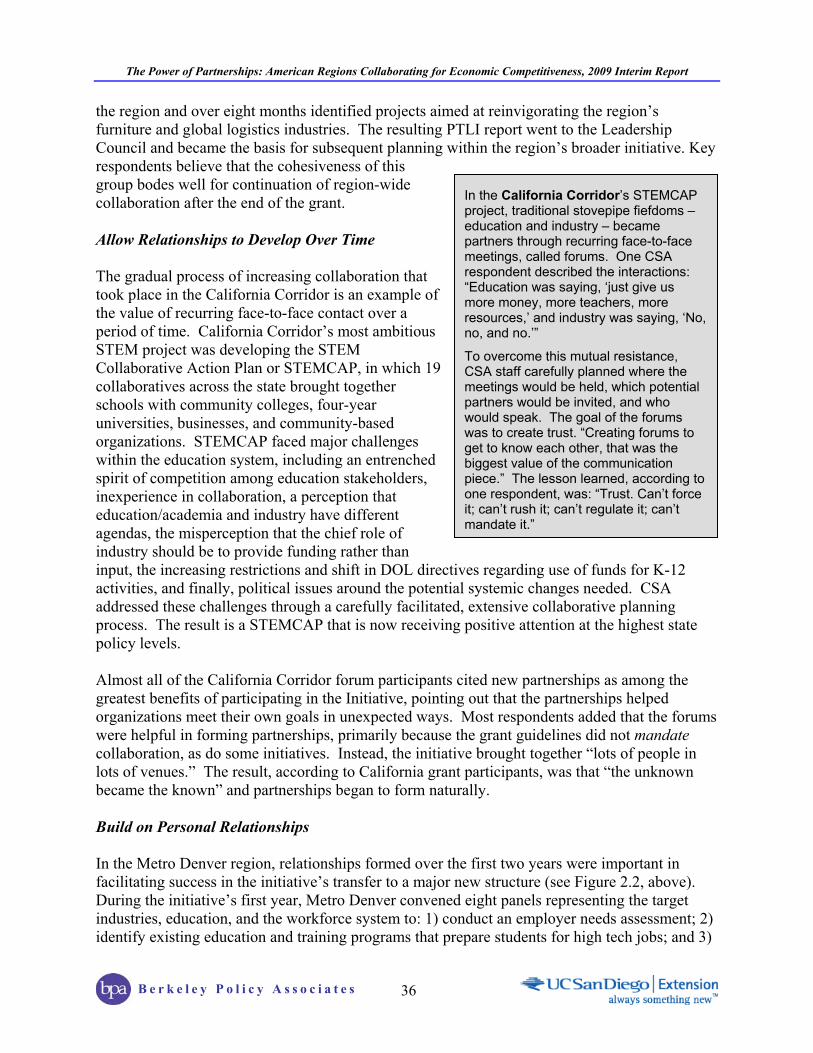
The Power of Partnerships: American Regions Collaborating for Economic Competitiveness, 2009 Interim Report
B e r k e l e y P o l i c y A s s o c i a t e s
36
the region and over eight months identified projects aimed at reinvigorating the region’s furniture and global logistics industries. The resulting PTLI report went to the Leadership Council and became the basis for subsequent planning within the region’s broader initiative. Key respondents believe that the cohesiveness of this group bodes well for continuation of region-wide collaboration after the end of the grant. Allow Relationships to Develop Over Time The gradual process of increasing collaboration that took place in the California Corridor is an example of the value of recurring face-to-face contact over a period of time. California Corridor’s most ambitious STEM project was developing the STEM Collaborative Action Plan or STEMCAP, in which 19 collaboratives across the state brought together schools with community colleges, four-year universities, businesses, and community-based organizations. STEMCAP faced major challenges within the education system, including an entrenched spirit of competition among education stakeholders, inexperience in collaboration, a perception that education/academia and industry have different agendas, the misperception that the chief role of industry should be to provide funding rather than input, the increasing restrictions and shift in DOL directives regarding use of funds for K-12 activities, and finally, political issues around the potential systemic changes needed. CSA addressed these challenges through a carefully facilitated, extensive collaborative planning process. The result is a STEMCAP that is now receiving positive attention at the highest state policy levels. Almost all of the California Corridor forum participants cited new partnerships as among the greatest benefits of participating in the Initiative, pointing out that the partnerships helped organizations meet their own goals in unexpected ways. Most respondents added that the forums were helpful in forming partnerships, primarily because the grant guidelines did not mandate collaboration, as do some initiatives. Instead, the initiative brought together “lots of people in lots of venues.” The result, according to California grant participants, was that “the unknown became the known” and partnerships began to form naturally. Build on Personal Relationships In the Metro Denver region, relationships formed over the first two years were important in facilitating success in the initiative’s transfer to a major new structure (see Figure 2.2, above). During the initiative’s first year, Metro Denver convened eight panels representing the target industries, education, and the workforce system to: 1) conduct an employer needs assessment; 2) identify existing education and training programs that prepare students for high tech jobs; and 3)
In the California Corridor’s STEMCAP project, traditional stovepipe fiefdoms –education and industry – became partners through recurring face-to-face meetings, called forums. One CSA respondent described the interactions: “Education was saying, ‘just give us more money, more teachers, more resources,’ and industry was saying, ‘No, no, and no.’”
To overcome this mutual resistance, CSA staff carefully planned where the meetings would be held, which potential partners would be invited, and who would speak. The goal of the forums was to create trust. “Creating forums to get to know each other, that was the biggest value of the communication piece.” The lesson learned, according to one respondent, was: “Trust. Can’t force it; can’t rush it; can’t regulate it; can’t mandate it.”
The Power of Partnerships: American Regions Collaborating for Economic Competitiveness, 2009 Interim Report
B e r k e l e y P o l i c y A s s o c i a t e s
37
identify and address gaps in these programs. Collectively these panels were called the High Skills Innovation Network. The High Skills Leadership Council consisted of the 16 co-chairs for each of the eight panels represented the region’s key industry sectors—aerospace, bioscience, energy, information technology, and K-12 school districts, higher education, the workforce system, and local small businesses. Once the work of the High Skills Innovation Network was done, that structure gave way to a new set of Solutions Teams. Some members remained from the previous leadership group, and new faces were added. The collaboration that started in the High Skills Leadership Council continues with the current Leadership Council. Making such a major shift in Metro Denver’s structure would have been difficult without the relationships built over the two previous years of work. Several respondents in Montana noted that the policy of encouraging staff to attend conferences has been invaluable for promoting collaboration. Said one, “Conferences are such an obvious tool that we sometimes forget how important they are for improving relations with other folks face-to-face. It’s not that people don’t try to communicate by other means, but phone and email only gets you so far. With our distances, face-to-face opportunities are essential. That's where you build personal bonds that pay off in real action. That's where you share the excitement that keeps you going.” Making Expectations Clear – Expecting the Best of Collaborators At least two of the regions laid out their expectations of how partners should behave. NCI leaders created a collaborative framework for the region – a Regional Compact – designed to serve as ground rules for working together in the region (see Figure 3.1, below). The Compact is one component of NCI’s strategy of developing civic habits of collaboration through leadership training offered in various communities across the region. As described earlier in this chapter, the collaboration of local economic development organizations across county lines was a significant “win” for NCI, particularly as the LEDOs now pursue joint projects and exchange information. In addition to collaboration across geographic and political boundaries, collaboration among the region’s higher education institutions has increased significantly over the past year. Similarly, the North Star Alliance crafted a set of ground rules called the Partnership Principles2 that clearly expressed the commitment of the partners to the Alliance and to each other. These include:
1. Maine’s North Star Alliance Initiative is industry-driven, industry-led. 2. Maine’s North Star Alliance Initiative’s partners all have an equal voice. 3. Maine’s North Star Alliance Initiative’s partners will be treated respectfully and
professionally and be shown due courtesy.
2 Maine’s North Star Alliance. “A Partnership to Transform the Workforce and Economy of Coastal Maine,” (WIRED implementation plan), September 2006.

The Power of Partnerships: American Regions Collaborating for Economic Competitiveness, 2009 Interim Report
B e r k e l e y P o l i c y A s s o c i a t e s
38
Figure 3.1 The NCI Regional Compact
4. Maine’s North Star Alliance Initiative’s partners will make every attempt to resolve conflicts
where they occur and accordingly be responsible for their actions. 5. Maine’s North Star Alliance Initiative’s partners will be encouraged to actively participate
in all Initiative activities by bringing forth pertinent and creative thought while demonstrating a “universal” and open approach to new information, and by a demonstration of positive support of the Initiative, both within the partnership structure and to the State of Maine as a whole.
These guidelines along with the region’s commitment to decision-making by consensus, clearly stated roles and responsibilities for key players in the initiative, and a conflict of interest policy helped shape a highly collaborative initiative.
We are dedicated to leaving our region more prosperous than we found it. To do that, we need to encourage innovation and entrepreneurship by following these simple rules of civic behavior: 1. Tell the truth and build trust and mutual respect. We are committed to behavior that builds trust and
mutual respect. 2. Do not steal, poach, or plagiarize. We will not behave in ways that a reasonable person would consider
deceitful or dishonest. 3. Commit to learning and sharing information. No one can predict our future. Our economy depends on
our collective ability to learn and act quickly. We learn more quickly when we share information and insights.
4. Focus on new ideas, our assets, and our opportunities. We will build our future prosperity on the foundation of our current assets. We will appreciate and invest in new ideas to develop and connect our assets.
5. Listen, link, and leverage. We will find the new opportunities in our region by listening to each other and then “linking and leveraging” our assets in new and different ways.
6. Collaborate and cross boundaries. We are dedicated to building an inclusive region with people who value diverse viewpoints. We are committed to crossing organizational, ethnic, social, and political boundaries.
7. Disclose conflicts of interest. We agree to disclose any personal or professional conflict of interest that may compromise our objectivity and damage the trust others have in us. We share a responsibility to avoid even the appearance of impropriety.
8. Resolve controversies quickly. Controversies are inevitable in our communities and region. We are committed to working through these controversies quickly by focusing on our underlying interests, not personalities. We are dedicated to finding solutions that promote mutual benefits.
9. Concentrate on outcomes, not activities. We will focus on our outcomes. While we will take responsibility for completing our activities and tasks, our outcomes will teach us “what works”.
10. Teach our next generation. Our children are messages we send to a world we will not see. We have a responsibility to pass on simple rules of civility to the next generation. Civility is strategic. It fosters trust, and trust accelerates the speed with which we can learn and act in a complex world.

The Power of Partnerships: American Regions Collaborating for Economic Competitiveness, 2009 Interim Report
B e r k e l e y P o l i c y A s s o c i a t e s
39
While the evaluation team does not have enough data to draw conclusions about cause and effect, one can hypothesize that committing to these “simple rules of civic behavior” set a high standard within both regions and facilitated the growth of a collaborative culture. The next section of this report describes the evaluation’s analysis of the social interactions that make up collaboration within the regions. Social Network Analysis The evaluation’s 2007 Interim Report provided a first look at social network data to explore ways of analyzing and characterizing the interactions among each region’s partners. This first effort to adapt social network analysis methods to the Initiative laid the groundwork for a more comprehensive social network analysis that the research team will conduct through surveys and future site visits, and will present in the evaluation’s Final Report. Social network analysis is based on the assumption that relationships among interacting units are important. The unit of analysis is not the individual, but the network that consists of a collection of individuals and the linkages among them. The evaluation explores the hypothesis that regions that build strong collaborative networks with many connections will be more competitive in the new economy than those with weak networks. By mapping these networks, the evaluation team can better understand the connections that make up the networks, and their overall strength. A network map shows the nodes (e.g., people or organizations) and links (e.g., relationships or flows) in the network. Social network analysis can help answer many key questions in the collaboration-building process, such as Are the right connections in place? Are any key connections missing? Who is playing leadership roles in the community? Are there facilitators who are linked with a very large number of people, and/or isolated people who are only linked with one or two others? How do patterns of association among entities evolve over time?3
Two approaches can be used when conducting a social network analysis –a personal (egocentric) network assessment or a group (bounded) network assessment.4 Under the personal network approach, a person is asked to identify other people who are important for a given function or task; the nature of these relationships are then explored through a series of additional questions. The drawback of such an approach is that creating accurate network maps is difficult because no defined, closed network exists. The bounded network approach first defines a network of interest. For the purposes of the Initiative, the network includes anyone who is involved in each region’s initiative. Each person in the network is then surveyed about their relationship with every other member in that group.
3 Krebs, Valdis and June Holley. “Building Smart Communities through Network Weaving,” http://www.orgnet.com/BuildingNetworks.pdf 4 Cross, Robert L. and Parker, Andrew. The Hidden Power of Social Networks, Boston, MA: Harvard Business Press, 2004.
The Power of Partnerships: American Regions Collaborating for Economic Competitiveness, 2009 Interim Report
B e r k e l e y P o l i c y A s s o c i a t e s
40
In order to produce accurate network maps, the group (bounded) network approach is the most desirable, yet it is the most challenging approach for the evaluation. Typically, a group (bounded) network assessment is appropriate for analyzing a closed system in which the total universe of respondents is easily identified (e.g., a single organization). The regions, however, do not have closed systems; furthermore, the universe of players is constantly changing over time. To capture the most complete network possible for each region, the evaluation team planned to administer a survey in 2008 that would include a much more comprehensive set of respondents than is interviewed during any single site visit. The survey would have mitigated the challenges and potential limitations to the kinds of analysis that can be done with the data. Unfortunately, the research team just received OMB approval for the evaluation’s survey of initiative partners and collaborators in late July 2009, after this report was drafted. Thus, the second round of social network data collected during the 2008 site visits shares the same limitations as the first round of data the evaluation team collected social network data only from those individuals interviewed by the evaluation team during site visits. The team calculated the proportion of individuals from each region who were included in the social network analysis data sets from both 2007 and 2008. In all of the regions, this percentage was under 50%, which serves as a reminder that the evaluation team captured different portions of the actual network in each year. For this reason, this report does not compare the social network responses or maps from 2007 and 2008. The extent to which the any differences are due to changes over time versus differences in respondents from one year to the next is impossible to tell. Instead, like the 2007 maps, the 2008 social network maps should be interpreted as “snapshots” of a portion of the network that the evaluation was able to capture for each region. Once the evaluation team collects survey data from a much larger number of individuals involved in the regions, a more complete picture of the social networks in the regions will be apparent. Nevertheless, given that these networks are constantly changing over time, these interim glimpses of the regional networks provide a valuable tool for beginning to look at change over time. Collection of Social Network Data from the Regions The evaluation team asked each site visit respondent to identify “five individuals with whom you have significant contact in the context of the Initiative, outside of your own organization,” and to provide the contact’s organization, job title, and frequency of contact. (The term “significant” was defined to include meaningful and important contact, but not necessarily the most frequent contact.) Thus, the social network dataset consisted of the name, type of organization, and level within organization for a respondent and his or her five important contacts, plus the frequency of contact that a respondent reported for each contact. Several important limitations in this data collection are worth reiterating here:
Only site visit respondents were asked to name contacts. The contacts named by the respondents were not in turn asked to name their contacts, so the data does not include reciprocal information;
Respondents were asked to name only five individuals, which for some was too few to accurately reflect their significant interactions; and

The Power of Partnerships: American Regions Collaborating for Economic Competitiveness, 2009 Interim Report
B e r k e l e y P o l i c y A s s o c i a t e s
41
Although the quality of the data collection was improved for this Interim Report, unfortunately members of the evaluation team were inconsistent in how hard they pressed respondents for complete data.
In collecting social network data throughout the remainder of the evaluation, the study team’s emphasis will be on identifying and securing responses from as many relevant individuals as possible in order to provide a more accurate picture of the regions’ collaborative networks. Overview of the Social Network Data This section summarizes the overall results for the key variables of interest (organization type, level within organization, and frequency of contact) across all of the regions for the 2008 data collection. Because of concerns about the quality of the data collected, however, the evaluation team did not calculate measures of statistical significance for these comparisons. Appendix C includes a set of tables that break out results by region. Social network maps for the regions can be found beginning on page 52 at the end of this chapter. The maps provide a visual display of the networks and linkages among collaborators as of the evaluation’s second round of site visits.
Organizational Type In 2008, the evaluation team refined the organization categories to decrease the number of organizations categorized as “Other.” In 2008, the code formerly called “business and industry” was separated into two distinct codes – “business and industry association” and “for profit business.” A code for business incubators was added and economic development agencies were classified into three distinct codes – local, state, and regional economic development agencies. The decrease in the number of individuals from “Other” organizations in the data from 2007 to 2008 suggests that the refined typology of organizations improved the quality of the data collected. The organization codes from 2007 and 2008 are presented in Appendix C, Table C.1. Figure 3.2 shows the organizational affiliation of all the individuals in the regional networks reported during the evaluation’s second round of site visits, including both the respondents and the individuals with whom they have contact. The largest numbers of network members are from business and industry (29%), followed closely by those from education (26%) and then workforce investment (14%) and economic development (14%). While the figures in this chapter summarize data across regions, tables in Appendix C show the variations between regions in the values for each data item. Table C.2 shows that the proportion of collaborators of each organizational type varied significantly across regions: Business and Industry – from 18% to 42%; Education – from 11% to 33%; Workforce Development – from 5% to 19%; Economic Development – from 7% to 21%; Research – from 0% to 12%;

The Power of Partnerships: American Regions Collaborating for Economic Competitiveness, 2009 Interim Report
B e r k e l e y P o l i c y A s s o c i a t e s
42
Figure 3.2 Types of Organizations in Regional Networks
14%
14%
28%3%
26%
6%
9%
Econ. Dev. WorkforceIndustryResearchEducationOther Govt.Other
Source: BPA/UCSD Evaluation Team site visit interviews
Government – from 1% to 16%; and Other5 – from 1% to 20%.
As Figure 3.3 illustrates, the frequency distribution by type of organizations for respondents as a group differs somewhat from that of all individuals in the 2008 sample. For example, while only 19% of the respondents themselves are from business or industry (Figure 3.3), 28% of all individuals in the regional networks are from industry organizations (Figure 3.2). This difference is consistent with regions’ reported efforts to reach out and engage increasing numbers of business and industry partners in their initiatives. Table C.3 in Appendix C breaks out the respondents’ type of organization by region. Level Within Organization In order to learn more about how partnerships work, the evaluation team collected data on a simplified indicator of organizational roles categorized into three levels:
Tier 1 – Leaders, Strategists, Visionaries, Decision-Makers (i.e., initiative leadership, company presidents, CEOs, upper level managers, executive directors, members of boards of directors, benefactors and foundations, civic leaders, and chancellors of academic institutions);
Tier 2 – Implementers, Managers, Administrators (i.e., individuals with the authority to make things happen, such as initiative program managers, partner organization managers, directors of operations, mid-level management, division heads, and college deans); and
Tier 3 – Day-to-Day Staff (i.e., individuals who conduct the day-to-day business of the organization, including front-line employees, clerical and supporting staff, professors, project service providers, instructors, and trainers).
5 The “Other” category includes media, foundations, and faith- or community-based nonprofit organizations.
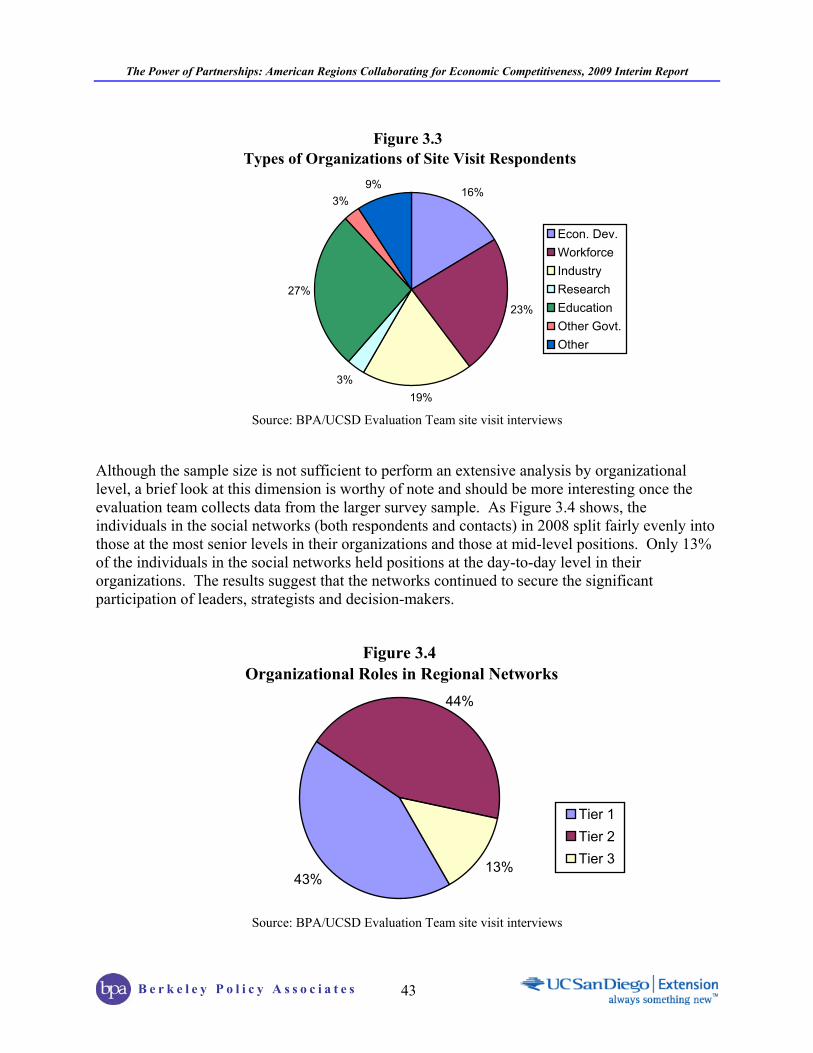
The Power of Partnerships: American Regions Collaborating for Economic Competitiveness, 2009 Interim Report
B e r k e l e y P o l i c y A s s o c i a t e s
43
Figure 3.3 Types of Organizations of Site Visit Respondents
16%
23%
19%3%
27%
3%9%
Econ. Dev. WorkforceIndustryResearchEducationOther Govt.Other
Source: BPA/UCSD Evaluation Team site visit interviews
Although the sample size is not sufficient to perform an extensive analysis by organizational level, a brief look at this dimension is worthy of note and should be more interesting once the evaluation team collects data from the larger survey sample. As Figure 3.4 shows, the individuals in the social networks (both respondents and contacts) in 2008 split fairly evenly into those at the most senior levels in their organizations and those at mid-level positions. Only 13% of the individuals in the social networks held positions at the day-to-day level in their organizations. The results suggest that the networks continued to secure the significant participation of leaders, strategists and decision-makers.
Figure 3.4 Organizational Roles in Regional Networks
43%13%
44%
Tier 1Tier 2Tier 3
Source: BPA/UCSD Evaluation Team site visit interviews

The Power of Partnerships: American Regions Collaborating for Economic Competitiveness, 2009 Interim Report
B e r k e l e y P o l i c y A s s o c i a t e s
44
The site visit respondents were slightly more likely to be mid-level staff than were their contacts (Figure 3.5), reflecting the importance of the mid-level participants in implementing the local initiatives. While 45% of the whole 2008 sample worked at the mid-level of their organizations, 49% of respondents played such roles in their organizations.
Figure 3.5 Organizational Roles in Site Visit Respondents
38%
13%
49%
Tier 1
Tier 2
Tier 3
Source: BPA/UCSD Evaluation Team site visit interviews
The distribution across organizational roles of individuals in the regional networks varies significantly by region. Table C.4 in Appendix C presents the distribution for each region. Proportions vary within the following ranges:
Tier 1 – from 25% to 55%;
Tier 2 – from 32% to 56%; and
Tier 3 – from 3% to 29%.
Appendix C also includes data on the organizational roles of the site visit respondents alone (see Table C.5). Who Interacts with Whom? Figure 3.6 explores the extent to which respondents at particular levels within their organizations communicate with contacts at the same organizational level. Respondents at the top-level in their organizations were most likely to communicate with partners at the same level (58% reported contact with a collaborator in a top-level position). The results differ for individuals at the mid-level and day-to-day level in their organizations, however. Among respondents at the mid-level in their organizations, less than half (47%) of the contacts they reported were at the same level while almost as many of their contacts (43%) were at the top level in their organizations. For respondents serving at a day-to-day level in their organizations, the largest group of contacts was at the mid-level within their organizations (46%), followed by 32% at the
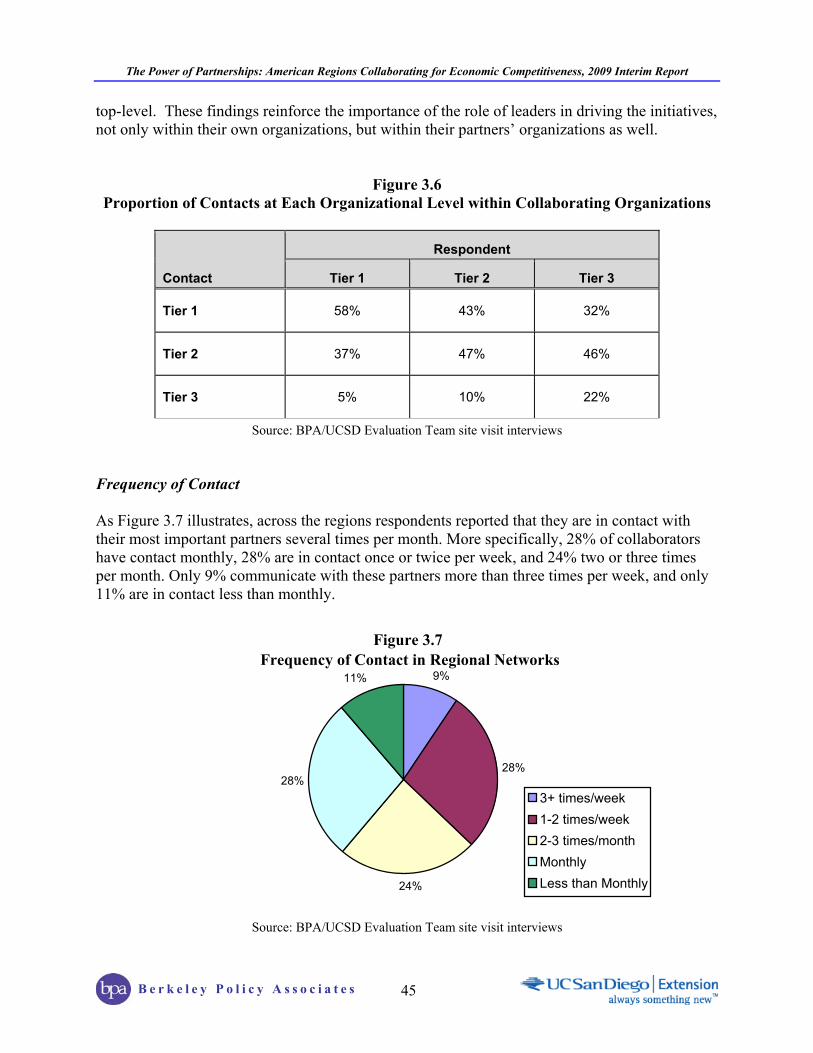
The Power of Partnerships: American Regions Collaborating for Economic Competitiveness, 2009 Interim Report
B e r k e l e y P o l i c y A s s o c i a t e s
45
top-level. These findings reinforce the importance of the role of leaders in driving the initiatives, not only within their own organizations, but within their partners’ organizations as well.
Figure 3.6 Proportion of Contacts at Each Organizational Level within Collaborating Organizations
Contact
Respondent
Tier 1 Tier 2 Tier 3
Tier 1 58% 43% 32%
Tier 2 37% 47% 46%
Tier 3 5% 10% 22%
Source: BPA/UCSD Evaluation Team site visit interviews Frequency of Contact As Figure 3.7 illustrates, across the regions respondents reported that they are in contact with their most important partners several times per month. More specifically, 28% of collaborators have contact monthly, 28% are in contact once or twice per week, and 24% two or three times per month. Only 9% communicate with these partners more than three times per week, and only 11% are in contact less than monthly.
Figure 3.7 Frequency of Contact in Regional Networks
9%
28%
24%
28%
11%
3+ times/week1-2 times/week2-3 times/monthMonthlyLess than Monthly
Source: BPA/UCSD Evaluation Team site visit interviews
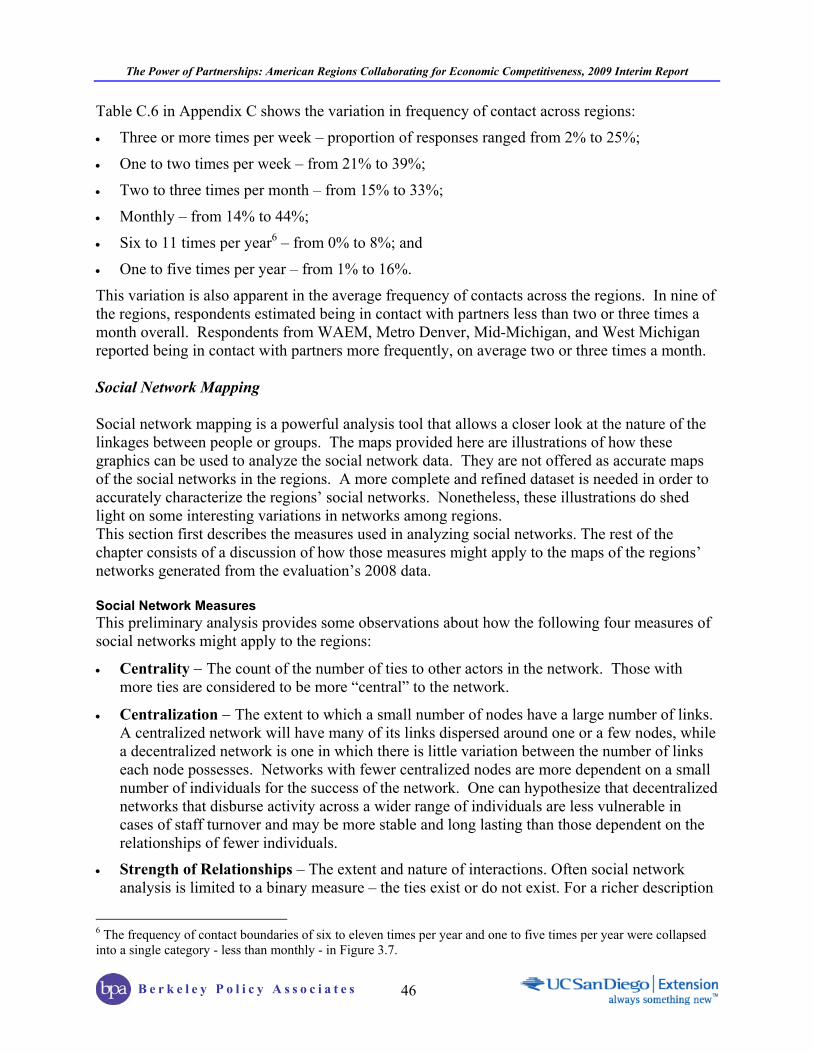
The Power of Partnerships: American Regions Collaborating for Economic Competitiveness, 2009 Interim Report
B e r k e l e y P o l i c y A s s o c i a t e s
46
Table C.6 in Appendix C shows the variation in frequency of contact across regions:
Three or more times per week – proportion of responses ranged from 2% to 25%;
One to two times per week – from 21% to 39%;
Two to three times per month – from 15% to 33%;
Monthly – from 14% to 44%;
Six to 11 times per year6 – from 0% to 8%; and
One to five times per year – from 1% to 16%.
This variation is also apparent in the average frequency of contacts across the regions. In nine of the regions, respondents estimated being in contact with partners less than two or three times a month overall. Respondents from WAEM, Metro Denver, Mid-Michigan, and West Michigan reported being in contact with partners more frequently, on average two or three times a month. Social Network Mapping Social network mapping is a powerful analysis tool that allows a closer look at the nature of the linkages between people or groups. The maps provided here are illustrations of how these graphics can be used to analyze the social network data. They are not offered as accurate maps of the social networks in the regions. A more complete and refined dataset is needed in order to accurately characterize the regions’ social networks. Nonetheless, these illustrations do shed light on some interesting variations in networks among regions. This section first describes the measures used in analyzing social networks. The rest of the chapter consists of a discussion of how those measures might apply to the maps of the regions’ networks generated from the evaluation’s 2008 data. Social Network Measures This preliminary analysis provides some observations about how the following four measures of social networks might apply to the regions:
Centrality The count of the number of ties to other actors in the network. Those with more ties are considered to be more “central” to the network.
Centralization The extent to which a small number of nodes have a large number of links. A centralized network will have many of its links dispersed around one or a few nodes, while a decentralized network is one in which there is little variation between the number of links each node possesses. Networks with fewer centralized nodes are more dependent on a small number of individuals for the success of the network. One can hypothesize that decentralized networks that disburse activity across a wider range of individuals are less vulnerable in cases of staff turnover and may be more stable and long lasting than those dependent on the relationships of fewer individuals.
Strength of Relationships – The extent and nature of interactions. Often social network analysis is limited to a binary measure – the ties exist or do not exist. For a richer description
6 The frequency of contact boundaries of six to eleven times per year and one to five times per year were collapsed into a single category - less than monthly - in Figure 3.7.
The Power of Partnerships: American Regions Collaborating for Economic Competitiveness, 2009 Interim Report
B e r k e l e y P o l i c y A s s o c i a t e s
47
of the nature of networks, however, documenting variation in the strength of the relationships is helpful. The strength of relationships is usually defined as the extent and nature of the interactions. In-depth analysis of a smaller or closed social network might include a range of measure of the extent, duration, and nature of relationships and whether they are reciprocated. Given the size and scope of the regions, for this analysis the evaluation uses frequency of contact as a proxy for the strength of a relationship. This variable is relatively easy to collect with minimal burden on respondents, and while it does not give a full picture of the extent and nature of the relationships, it does provide descriptive information about the networks beyond the simple presence or absence of linkages. This is especially valuable for an open-ended or “snowball” social network analysis, where the full universe of potential members of the network is not bounded or defined, and where reciprocation is not being captured, and absence of linkages is not identifiable.
Between-ness The degree to which an individual lies between other individuals in the network; the extent to which a node is directly connected to nodes that are not directly connected to each other, i.e., intermediaries; liaisons; bridges. A node with high between-ness has great influence over what flows and does not flow in the network, and if that individual leaves the network, these connections might be broken.
These measures can be calculated statistically, however, the discussion below of their relevance to the regions is not based on statistical analysis. Once the samples are more comprehensive, these statistics, while of interest in and of themselves, may also turn out to be analytically interesting in terms of their relationship to regional success. Observations on the Regions’ Social Network Maps The following are observations and possible explanations for the portion of the social network map captured in 2008 for each region. These observations are purely qualitative and do not reflect rigorous quantitative analysis, rather they are based on observations and interpretation of the diagrams themselves. Like the 2007 maps, the 2008 social network maps should be interpreted as “snapshots” of a portion of the network that the evaluation was able to capture for each region. For confidentiality reasons, names of individual respondents or their contacts are not included. The subset of the social network map captured in 2008 for WAEM displays a center composed of just one node, reflecting The Montgomery Institute’s continuing role in overall leadership and coordination. Its “reach” demonstrates expansive partnerships, particularly with business and industry involved in the workforce training programs developed as part of the initiative. Community colleges are central to the initiative and are well represented throughout the network; in a number of places, the colleges are at the center of local collaborations with industry and economic development organizations. At the edges of the network, the WIA-funded workforce system is connected to the initiative mainly via the colleges. Interconnections among the community college partners that were crucial to the intense coordination needed for planning appear to have given way to more localized outreach and coordination. Efforts are now underway to increase collaboration between WAEM and the workforce system, so this will be something to watch for in future network maps.

The Power of Partnerships: American Regions Collaborating for Economic Competitiveness, 2009 Interim Report
B e r k e l e y P o l i c y A s s o c i a t e s
48
The portion of California Corridor’s network shown for 2008 features a high frequency of contact but appears to lack an obvious center or hub. This observation is consistent with the initiative’s experience in covering a large, complex geographic area where one would expect to see multiple “mini-hubs,” as illustrated in the network map. A substantial number of interconnections exist among clusters, drawing them closer to the center of the map. The region’s key partners are from business, industry, and education. Between 2007 and 2008, Metro Denver underwent major structural changes that represent the most visible shift in focus from research to implementation among the Generation I regions. Denver’s 2008 social network map shows many complex connections among clusters. The subset of the region’s network shown in the map includes a sizable representation of education partners, which reflects the region’s increased focus on education. The map also has several links between education and industry, reflecting industry’s interest in the talent development pipeline. The Northwest Florida initiative has a large and extremely engaged Governance Council, many of whom were respondents in 2007, resulting in a network map showing a dense, tightly connected center with many two-way connections. In 2008, the evaluation team made an effort to meet with new partners and with individuals with whom site visitors were unable to meet the previous year, and thus obtained social network data from a new set of respondents. The 2008 map shows a wide-ranging network that expands far beyond the central organization. This subset within the region’s network also appears to be relatively decentralized, which may be a result of the evaluation team obtaining responses from a much smaller number of Governance Council members than in 2007. Most of the individuals in the network are top-level executives, business owners, decision-makers, and managers, consistent with the Northwest Florida initiative’s vision of regional collaboration for economic development. In 2007, some NCI respondents reported concern that little collaboration occurred outside of key educational partners. The portion of its network depicted in the 2008 map demonstrates, however, that although education remains well represented, partners from this field are dispersed throughout the network and serve as bridges to collaboration among many different types of organizations. The map shows a substantial amount of collaboration taking place, nonetheless a few education partners still do not appear to be connected to the rest of the network. One possible explanation for the presence of these outliers may be the fact that several of these partners are located in the largely rural area outside of Lafayette/West Lafayette. Local economic development organizations appear to act as bridges to outside clusters, which is consistent with their role as “networkers” offering services across county lines. In 2007, Kansas City had a very small and centralized group of key players who mainly collaborated among themselves. In 2008, however, the initiative took on the role of convener, hiring four liaisons to build bridges among post-secondary institutions, high schools, and industry. These bridges have translated into a broad and decentralized network in the map for 2008. Various bridges appear between the clusters, which is a sign that Kansas City is succeeding in bringing various sub-networks together to facilitate collaboration.
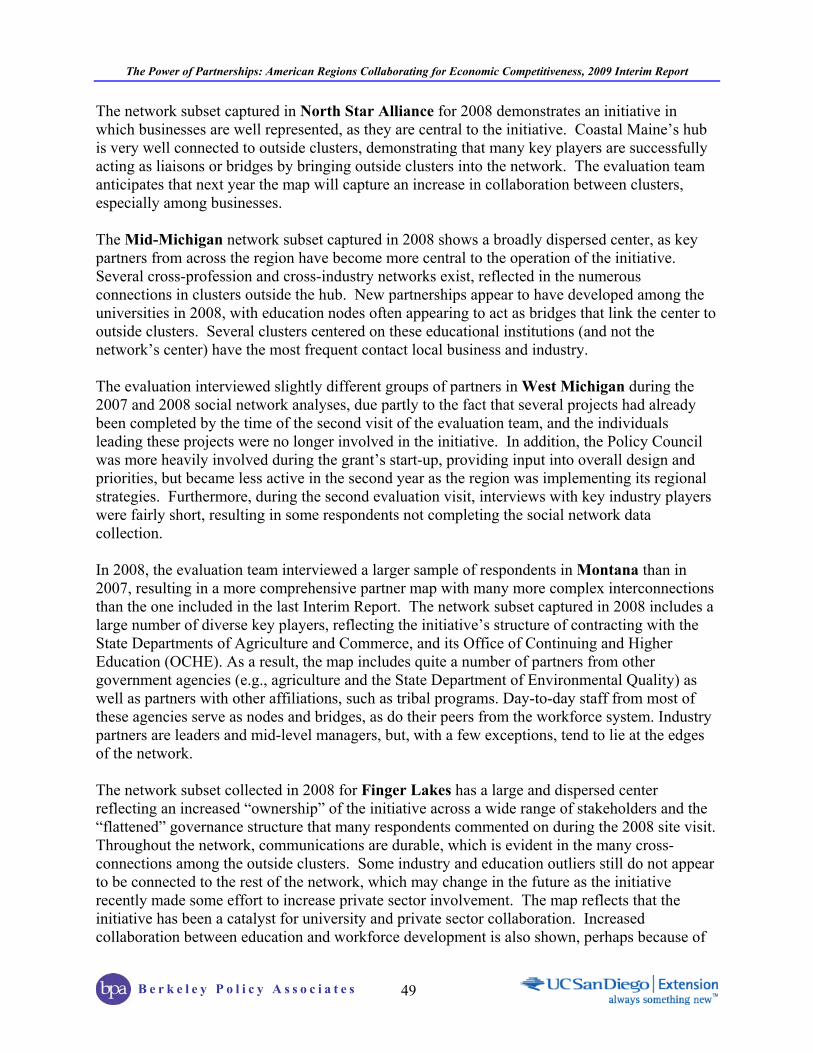
The Power of Partnerships: American Regions Collaborating for Economic Competitiveness, 2009 Interim Report
B e r k e l e y P o l i c y A s s o c i a t e s
49
The network subset captured in North Star Alliance for 2008 demonstrates an initiative in which businesses are well represented, as they are central to the initiative. Coastal Maine’s hub is very well connected to outside clusters, demonstrating that many key players are successfully acting as liaisons or bridges by bringing outside clusters into the network. The evaluation team anticipates that next year the map will capture an increase in collaboration between clusters, especially among businesses. The Mid-Michigan network subset captured in 2008 shows a broadly dispersed center, as key partners from across the region have become more central to the operation of the initiative. Several cross-profession and cross-industry networks exist, reflected in the numerous connections in clusters outside the hub. New partnerships appear to have developed among the universities in 2008, with education nodes often appearing to act as bridges that link the center to outside clusters. Several clusters centered on these educational institutions (and not the network’s center) have the most frequent contact local business and industry. The evaluation interviewed slightly different groups of partners in West Michigan during the 2007 and 2008 social network analyses, due partly to the fact that several projects had already been completed by the time of the second visit of the evaluation team, and the individuals leading these projects were no longer involved in the initiative. In addition, the Policy Council was more heavily involved during the grant’s start-up, providing input into overall design and priorities, but became less active in the second year as the region was implementing its regional strategies. Furthermore, during the second evaluation visit, interviews with key industry players were fairly short, resulting in some respondents not completing the social network data collection. In 2008, the evaluation team interviewed a larger sample of respondents in Montana than in 2007, resulting in a more comprehensive partner map with many more complex interconnections than the one included in the last Interim Report. The network subset captured in 2008 includes a large number of diverse key players, reflecting the initiative’s structure of contracting with the State Departments of Agriculture and Commerce, and its Office of Continuing and Higher Education (OCHE). As a result, the map includes quite a number of partners from other government agencies (e.g., agriculture and the State Department of Environmental Quality) as well as partners with other affiliations, such as tribal programs. Day-to-day staff from most of these agencies serve as nodes and bridges, as do their peers from the workforce system. Industry partners are leaders and mid-level managers, but, with a few exceptions, tend to lie at the edges of the network. The network subset collected in 2008 for Finger Lakes has a large and dispersed center reflecting an increased “ownership” of the initiative across a wide range of stakeholders and the “flattened” governance structure that many respondents commented on during the 2008 site visit. Throughout the network, communications are durable, which is evident in the many cross-connections among the outside clusters. Some industry and education outliers still do not appear to be connected to the rest of the network, which may change in the future as the initiative recently made some effort to increase private sector involvement. The map reflects that the initiative has been a catalyst for university and private sector collaboration. Increased collaboration between education and workforce development is also shown, perhaps because of

The Power of Partnerships: American Regions Collaborating for Economic Competitiveness, 2009 Interim Report
B e r k e l e y P o l i c y A s s o c i a t e s
50
the two new region-wide grants awarded in 2008 – one awarded to a collaborative among WIBs, and another that involved collaboration among community colleges. The network subset obtained in 2008 for Piedmont Triad features frequent contact throughout and many bridges among clusters. Many respondents attributed Piedmont Triad’s initial successful collaboration to their pre-initiative Vision Plan, which gave legitimacy to the grant’s goals and activities. The Piedmont Triad Partnership is an established and recognized region-wide organization that facilitates collaboration and breaks down barriers to collaboration. This is reflected in the many economic development nodes that act as bridges in the 2008 map. A few industry outliers still exist, which may speak to the large diversity of sectors in the region and a disproportionate representation of certain sectors over others. In addition, the initiative has increased its outreach to minority and underrepresented workers over the past year, and relatively new partners may not yet be connected to many other members of the network. Several workforce development respondents are centrally located on the 2008 map, perhaps reflecting the initiative’s efforts to include the workforce system in its activities. In 2008, the Wall Street West initiative created new partnerships with education partners, as reflected in the numerous education nodes appearing in the center of the 2008 network map. The lines connecting the nodes are relatively thin in the 2008 data, indicating a low frequency of contact. This is consistent with a site visit respondent’s comment that the first year was about “planning the work” and the second year was “working the plan,” indicating less need for frequent contact in the implementation stage than the planning stage. Indeed, Wall Street West’s Legislative Affairs and Industry and Community Engagement committees have become inactive, and a low frequency of contact among collaborators may reflect that change.
Conclusion: Partnerships and Collaboration Foster Global Competitiveness The 13 regions have worked diligently for three years to build partnerships and develop habits of collaboration. As they and other regions around the country confront the seemingly overwhelming uncertainties that accompany the current recession, many of the lessons the regions have learned will benefit them. Lessons related to partnerships and collaboration include: Collaborating with organizations unlike one’s own creates learning opportunities.
Collaborators have learned by necessity to see and be open to perspectives other than their own. The collaboration between industry and the private sector in the Finger Lakes region is an example of boundary spanning partnerships that have given both university and private sector players an opportunity to bring additional perspectives to bear on their planning efforts. The Health Care Regional Skills Alliance in West Michigan brings together the workforce development expertise and perspective of five of the region’s six WIBs, with the expertise of health care employers and other advocates to develop and retain the health care workforce in the region.
Collaborative groups enjoy the benefits of a readily available and diverse base of expertise, and they have learned to call upon that expertise when needed. For example the key role of the workforce system in the California Corridor has brought a whole new range of knowledge and expertise that industry and economic development partners knew
The Power of Partnerships: American Regions Collaborating for Economic Competitiveness, 2009 Interim Report
B e r k e l e y P o l i c y A s s o c i a t e s
51
little about prior to WIRED. The Northwest Florida initiative has assembled experts from among its partners in each of its target industries to create Industry Advisory Councils that provide expertise and resources to support the regional economic development efforts.
Effective collaboration requires time for partners to develop trusting relationships by working together on joint activities and common goals. Having invested considerable time in identifying and building collaborative relationships over the past three years, the regions are primed to grasp future collaborative opportunities quickly. For example, as mentioned earlier, the collaborative work on identifying common goals in Piedmont Triad seems to be providing a potentially sustainable group cohesiveness. The governing bodies of both the Northstar Alliance and NCI established common ground rules for working together that have provided a structure for developing trust between partners.
Working together has allowed organizations that previously regarded themselves as competitors to recognize the extent to which they share goals. Many discovered that they are stronger working together than in isolation or in competition with each other. For example, WAEM developed partnerships among community colleges that had previously not collaborated with each other even within their respective states, much less across the state line. Economic development organizations in Midland, Bay, and Saginaw counties in Mid-Michigan are now collaborating on a new photovoltaic study for the initiative.
The experience of the past year suggests that while effective collaboration is not ubiquitous in the regions, the regions have worked hard to prepare themselves for projects that will serve their local economies well. The next chapter details some of the specific activities in the regions that have also helped them learn, grow, and begin to develop resilient economies.
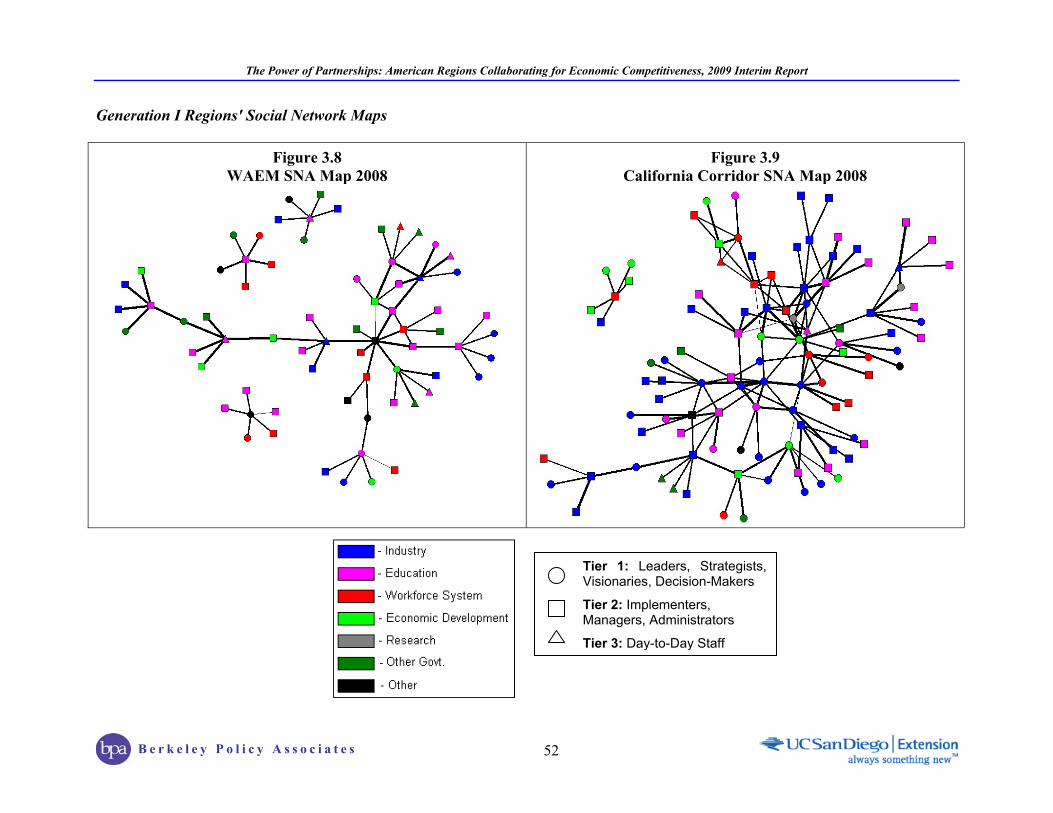
The Power of Partnerships: American Regions Collaborating for Economic Competitiveness, 2009 Interim Report
B e r k e l e y P o l i c y A s s o c i a t e s
52
Generation I Regions' Social Network Maps
Figure 3.8 WAEM SNA Map 2008
Figure 3.9 California Corridor SNA Map 2008
Tier 1: Leaders, Strategists, Visionaries, Decision-Makers
Tier 2: Implementers, Managers, Administrators
Tier 3: Day-to-Day Staff
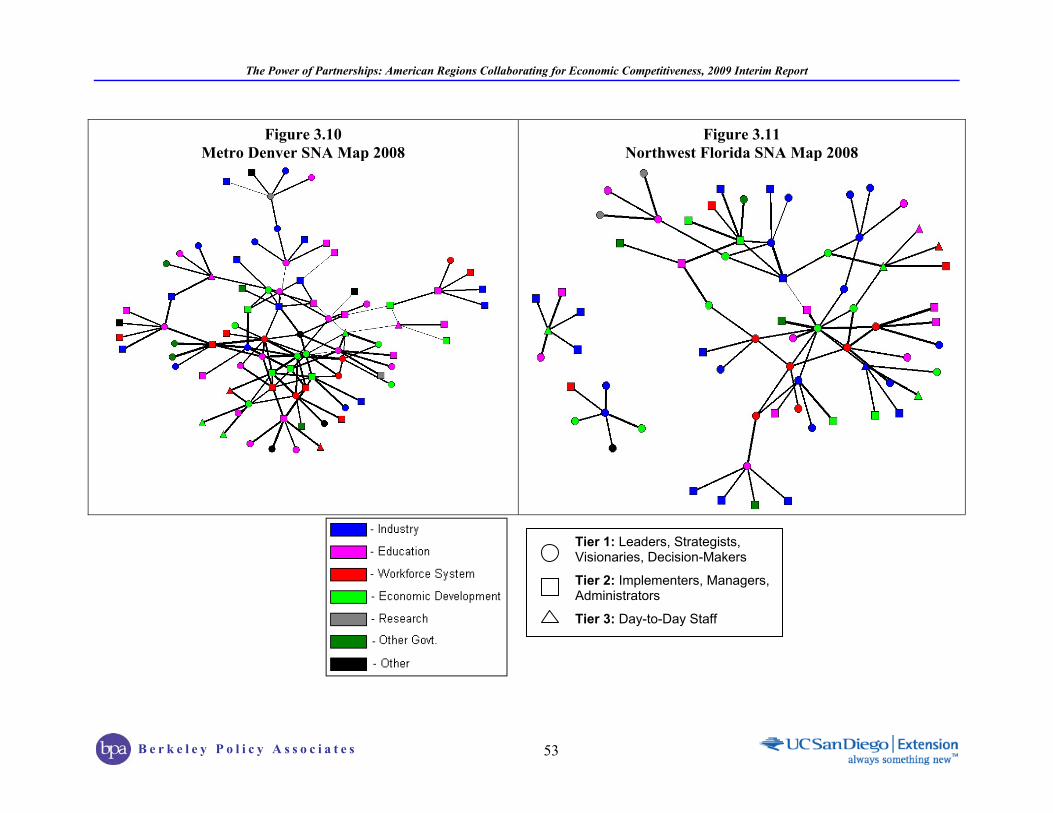
The Power of Partnerships: American Regions Collaborating for Economic Competitiveness, 2009 Interim Report
B e r k e l e y P o l i c y A s s o c i a t e s
53
Figure 3.10
Metro Denver SNA Map 2008
Figure 3.11 Northwest Florida SNA Map 2008
Tier 1: Leaders, Strategists, Visionaries, Decision-Makers
Tier 2: Implementers, Managers, Administrators
Tier 3: Day-to-Day Staff

The Power of Partnerships: American Regions Collaborating for Economic Competitiveness, 2009 Interim Report
B e r k e l e y P o l i c y A s s o c i a t e s
54
Figure 3.12 2008 North Central Indiana SNA Map
Figure 3.13 Kansas City 2008
Tier 1: Leaders, Strategists, Visionaries, Decision-Makers
Tier 2: Implementers, Managers, Administrators
Tier 3: Day-to-Day Staff
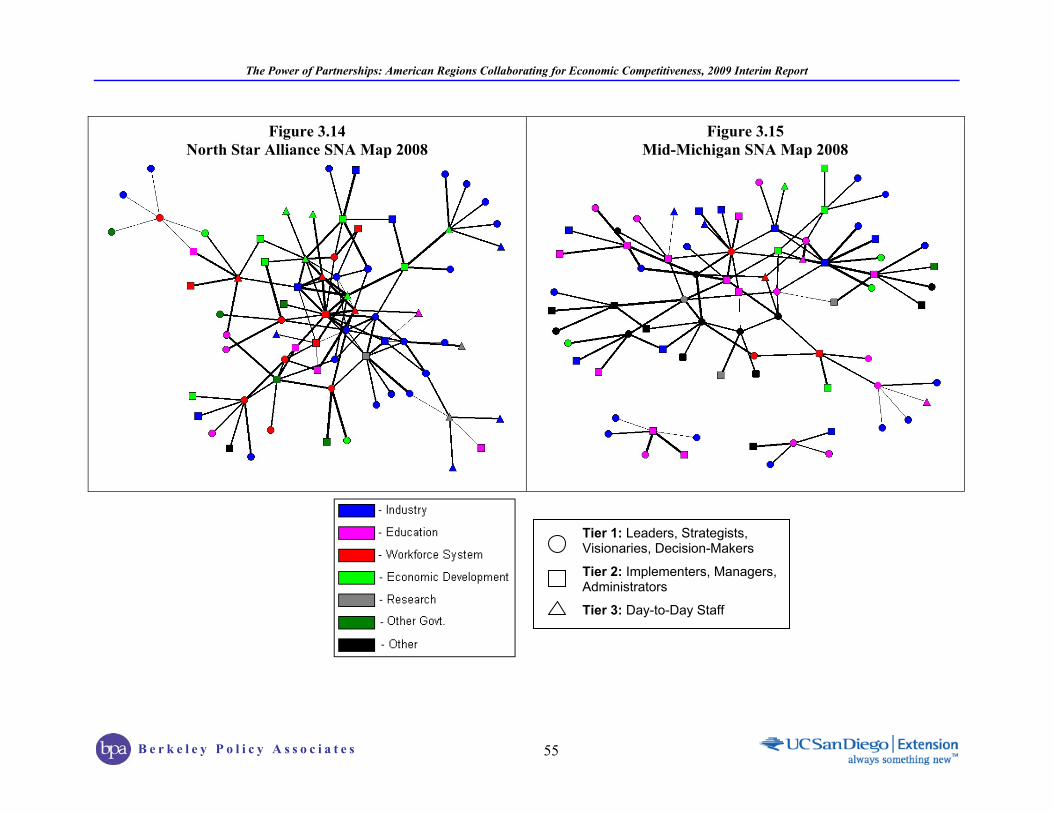
The Power of Partnerships: American Regions Collaborating for Economic Competitiveness, 2009 Interim Report
B e r k e l e y P o l i c y A s s o c i a t e s
55
Figure 3.14 North Star Alliance SNA Map 2008
Figure 3.15 Mid-Michigan SNA Map 2008
Tier 1: Leaders, Strategists, Visionaries, Decision-Makers
Tier 2: Implementers, Managers, Administrators
Tier 3: Day-to-Day Staff
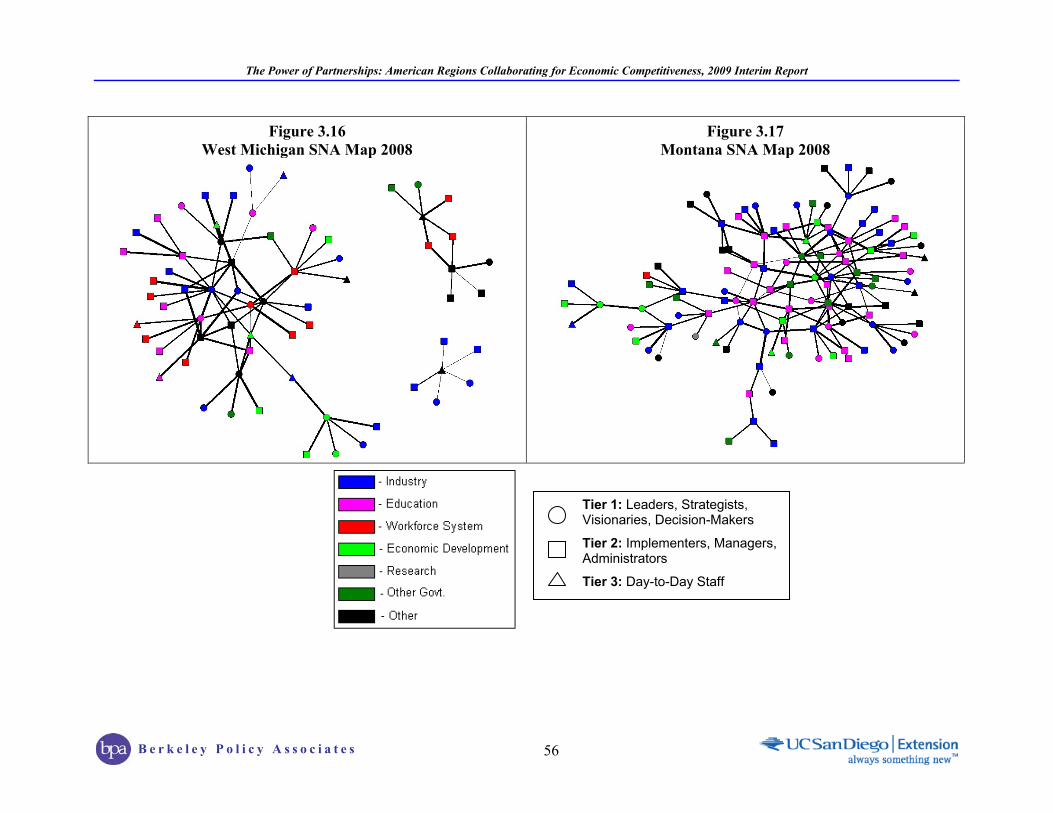
The Power of Partnerships: American Regions Collaborating for Economic Competitiveness, 2009 Interim Report
B e r k e l e y P o l i c y A s s o c i a t e s
56
Figure 3.16 West Michigan SNA Map 2008
Figure 3.17 Montana SNA Map 2008
Tier 1: Leaders, Strategists, Visionaries, Decision-Makers
Tier 2: Implementers, Managers, Administrators
Tier 3: Day-to-Day Staff

The Power of Partnerships: American Regions Collaborating for Economic Competitiveness, 2009 Interim Report
B e r k e l e y P o l i c y A s s o c i a t e s
57
Figure 3.18
Finger Lakes SNA Map 2008
Figure 3.19 Piedmont Triad SNA Map 2008
Tier 1: Leaders, Strategists, Visionaries, Decision-Makers
Tier 2: Implementers, Managers, Administrators
Tier 3: Day-to-Day Staff
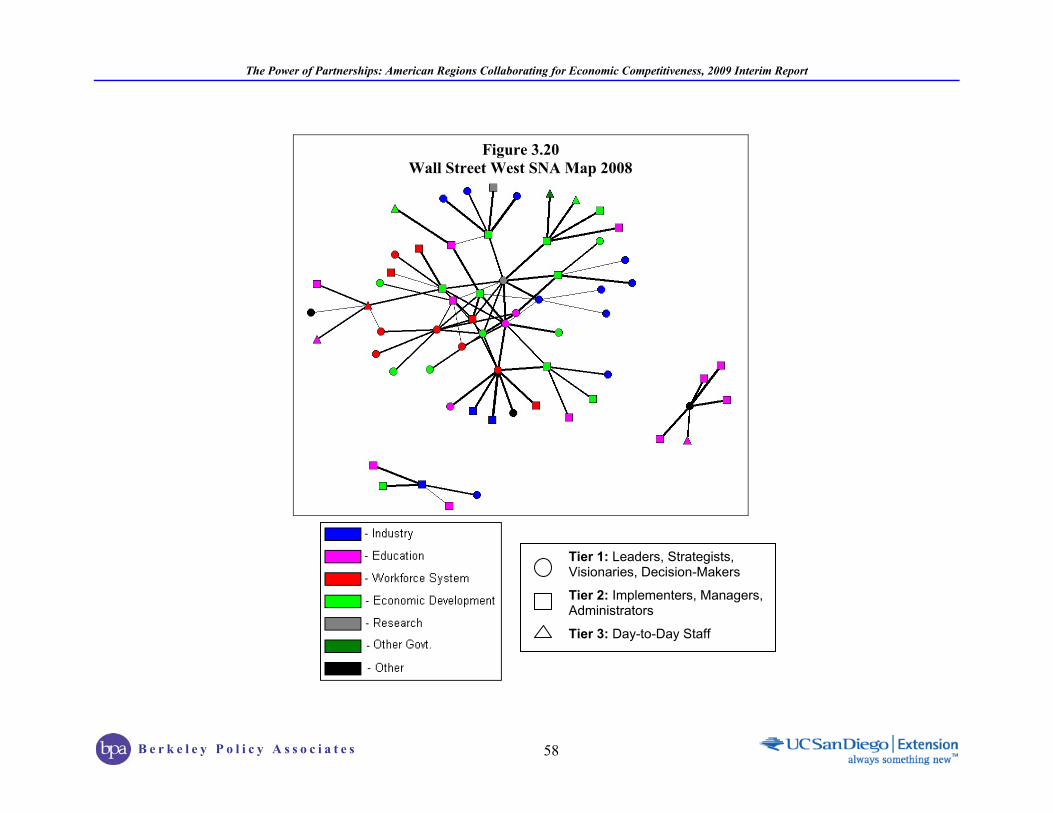
The Power of Partnerships: American Regions Collaborating for Economic Competitiveness, 2009 Interim Report
B e r k e l e y P o l i c y A s s o c i a t e s
58
Figure 3.20
Wall Street West SNA Map 2008
Tier 1: Leaders, Strategists, Visionaries, Decision-Makers
Tier 2: Implementers, Managers, Administrators
Tier 3: Day-to-Day Staff
The Power of Partnerships: American Regions Collaborating for Economic Competitiveness, 2009 Interim Report
B e r k e l e y P o l i c y A s s o c i a t e s
59
Chapter 4: Strategies, Activities, and Funding This chapter reviews the policies, programs, and resources of the regions as they were in late fall/early winter 2008, the time of the second round of evaluation visits. The first section presents an overview of the on-going and new projects in the regions, but is not intended to be a comprehensive catalogue of each and every undertaking of the regions. Instead, it offers examples of the different types of key activities conducted by the initiatives, with an emphasis on how those efforts have evolved over time as the regions learned what did and did not work. The second part of this chapter discusses the funding of these activities and the challenges faced by regions in implementing their visions within the H-1B funding restrictions.
Regional Strategies and Activities The regions are implementing activities designed to grow and develop their identified industry clusters. These target industries can be grouped into four main categories:
1) Advanced manufacturing (including aerospace, defense, automobiles, and shipbuilding);
2) Energy (including alternative energy, biofuels, and extractive fuels);
3) Life sciences, health sciences, and agricultural science (including medicine, pharmaceuticals, food processing, and animal health); and
4) Information technology (IT) applications, software, and telecommunications.
In addition, a number of regions target industries outside of these categories. For example, WAEM's target industries also include tourism and wood products, while the California Corridor includes transportation/logistics and business management services among its industry targets. Only two of the regions – Wall Street West and Montana –changed the type of industries they targeted in 2008. In both cases, the shift resulted in an increase in the number of workers being trained. In June 2008, Wall Street West submitted to ETA a grant modification request to expand the region’s target industries to include: information technology; life sciences and health care; advanced materials and diversified manufacturing; logistics and transportation; and STEM occupations. In diversifying the targeted industries, Wall Street West recognized that its plan to attract investment from financial services firms depended on completion of a fiber optic cable linking Northeastern Pennsylvania to Lower Manhattan, and that that link was unlikely to be completed within the initiative’s timeframe. Montana broadened its target industries beyond a narrow focus on biofuel production. Because this initiative is facilitating the birth of a new industry in the state and is contending with economic factors that have impeded its growth, the initiative added target industries related to and supportive of its original focus on biofuels and lubricants. The initiative now also targets
The Power of Partnerships: American Regions Collaborating for Economic Competitiveness, 2009 Interim Report
B e r k e l e y P o l i c y A s s o c i a t e s
60
value-added agriculture/bioproducts and energy industries, along with industries that support these sectors such as transport and construction. The idea was to create a bridge between the existing economy and the alternative fuels economy of the future, particularly since many of the relevant skill-sets are the same.
The remainder of this section focuses on strategies and activities that have emerged in the 13 regions since the evaluation’s last visit. Those strategies and activities fall into four categories: 1) workforce activities; 2) entrepreneurship and businesses services; 3) talent development activities; and 4) data analysis and planning. Workforce System Activities The initiatives adopted a range of activities aimed at improving the education and occupational skills of their regions’ workforce. These strategies may include worker “re-skilling,” continuing education, apprenticeships, and on-the-job training, as well as any supportive services provided to trainees to supplement their ability to complete a program or acquire and
hold employment. This section first discusses job training approaches, followed by credential and certification programs, training for underserved populations, incumbent worker training, and “green jobs.” Job Training As other chapters of this report describe, worker training has become more prominent in the portfolio of activities throughout the regions over the last year, due in part to ETA issuing further guidance on the allowable costs of H-1B funds. Examples of the types of job training programs that the Generation I regions are funding include the following:
Metro Denver built on the success of its first-year JumpStart grant program by funding two more rounds of grants in its second year. The Workforce Innovation Grant Program addresses specific industry needs by funding innovative workforce development, training, entrepreneurship, and other industry-specific education and training partnership projects. In March 2008, the region funded nine projects for a total of $2.7 million, and then awarded another $1.2 million to six grantees in June 2008.
In the California Corridor, a Bay Area-based WIB worked with industry and education partners to train software engineers laid off from jobs in Silicon Valley so that they can qualify for the more plentiful jobs in the aerospace-focused software engineering field.
Montana’s shift in target industries resulted in an expansion of the range of occupational skills training offered to include truck driving, operation of heavy equipment, and welding.
The North Star Alliance worked with both industry and the State of Maine to create the new Maine Marine Trades Association Maine Apprenticeship Program. The program represents a change to the established apprenticeship program from one that requires a person to attain a credential from a community college to achieve journeyperson status, to one that requires attainment of an industry-recognized certificate. Trainees can apprentice in six occupations –
Montana’s initiative is not targeting an industry; it is seeking to create one. Montana’s Agro Energy Plan has expanded its focus to include the construction and transportation (trucking) trades. In order to support a biofuels cluster, policy makers in Montana realized that investment is needed in infrastructure (construction) and supportive services (transportation), to supplement current investments in value- added agriculture and biofuels.

The Power of Partnerships: American Regions Collaborating for Economic Competitiveness, 2009 Interim Report
B e r k e l e y P o l i c y A s s o c i a t e s
61
marine tradesperson, marine engine service technician, marine electrician, marine-certified composites technician, boat builder-wood, and marine joiner.
Credentials and Certifications Many of the regions’ workforce training programs include assessments, certifications, and credentialing. In particular, programs that result in career readiness certification have proven popular in the regions, and a number of the regions have implemented or adapted WorkKeys,® a job skills assessment system that provides certification of an individual’s competence in basic skills. WAEM's Career Readiness Credential (CRC), for instance, is based on WorkKeys. Adoption of such credentials throughout a region provides recognizable “proof” to employers of the existence of a qualified workforce. In the Kansas City region, the same tools assess the skills and readiness of job seekers – whether in Independence, Missouri, or Leavenworth, Kansas – and employers such as Harley Davidson (in Missouri) and Garmin (in Kansas) can rely on the validity and usefulness of the assessments. Other examples of career readiness certification found in the regions include:
WAEM developed the Modern Multi-skill Manufacturing (M3) credential – a regional performance-based credential based on national standards – for entry-level and advanced skills in advanced manufacturing. Administered by the WAEM Alliance, training and assessment for the M3 is organized around a series of virtual training laboratory modules developed by Amatrol, a provider of learning systems for technical education. By late 2008, about 1,200 students had enrolled in training leading to an M3 credential.
In order to develop a pipeline of qualified workers with the skills needed in today’s advanced manufacturing setting, NCI supports the Manufacturing Skill Standard Council Certification (MSSC), a national certification recognized by employers. Workers with the MSSC certification are recognized as meeting industry standards for excellence and possessing cutting-edge skills needed for manufacturing firms to be competitive.
A collaborative effort initiated by the West Michigan region led to the State of Michigan enacting the School Aid Bill, SB-1107, which implements a statewide career readiness credential, the National Career Readiness Certificate (NCRC), based on ACT’s WorkKeys system. The annual NCRC assessment will be mandatory for high school students throughout the state.
The North Star Alliance provided start-up funding for the new Marine Systems Training Center (MSTC) in Thomaston. The MSTC offers high quality training in marine systems
WorkKeys® WorkKeys is a well-established and validated assessment system for the workplace that is used by companies to assess and certify individuals’ job skill levels and overall employability. A product of ACT (formerly, The American College Testing Program, Inc.), WorkKeys can be used not only to certify an individual’s skill level in ten foundational workplace skills, but also to identify skill gaps so that he or she can receive training to develop the needed skills. A key component of the WorkKeys system is a database with information on thousands of jobs and the skills (and skill levels) required for each. Using these job profiles, ACT has identified three skills important to most jobs Reading for Information, Applied Mathematics, and Locating Information and developed the National Career Readiness Certificate (NCRC), which uses WorkKeys test results in these three areas to certify that an individual has the job skills needed for up to 90% of the jobs in the WorkKeys database.
The Power of Partnerships: American Regions Collaborating for Economic Competitiveness, 2009 Interim Report
B e r k e l e y P o l i c y A s s o c i a t e s
62
and specialties, including courses that lead to certification in various skills by the American Boat and Yacht Council and other organizations related to the boatbuilding industry. Courses at the MSTC complement training provided at the Maine Applied Technology Center (MATC), which this grant also partially funded. MATC provides courses in composites, including those providing certification from the American Composites Manufacturers Association.
Incumbent Worker Training In addition to training new and prospective employees, the regions also funded training for current workers of their business partners. In addition to the range of mechanisms that regions used to provide this training, the degree to which regions emphasized the training of individuals who were already employed varied across regions. For example:
The Montana Department of Labor and Industry, the home organization for the state’s initiative, contracted with the Department of Commerce to provide incumbent worker training. Workers across a range of industries participated in training that, in most cases, occurred at their usual work places with the employer’s in-house trainers providing the training.
The North Star Alliance provides incumbent worker training via several mechanisms, including through the two training centers started with grant assistance, and via reimbursing employers for the cost of skills upgrade training that they provided to their workers.
Northwest Florida’s Employee Skills Training Grant Awards address the immediate training needs of businesses and allow for development and implementation of customized skills training.
Mid-Michigan has funded a number of initiatives that train incumbent workers, including a project in which the region partnered with organized labor to provide skills upgrade training to employees of a manufacturing company. Another effort is the Greater Flint Health Coalition, which offers career exploration and advancement services for current health care workers. A third example from Mid-Michigan is an advanced manufacturing project at Mott Community College that provides training to the employees of five companies in using advanced technology tools.
Green Jobs Interest in “green” jobs has increased steadily over the last few years, and several of the Generation I regions created programs that train workers for employment in some aspect of environmentally conscious business sectors. Some of the programs – like the Green Workforce Development in NCI – seek to develop workers trained and ready to work for environmentally responsible companies across industries. Other programs train workers for specific green industry jobs, such as windmill construction and solar panel fabrication in Metro Denver, or recycling in West Michigan. The energy sector is one of Metro Denver’s targeted industries. There, the Clean Energy
Manufacturing and GIS Technology Manufacturing project will develop and implement two state-of-the-art courses in clean energy manufacturing and GIS technology industries for 50 high school students, and develop workforce skills booster lessons for an estimated 120

The Power of Partnerships: American Regions Collaborating for Economic Competitiveness, 2009 Interim Report
B e r k e l e y P o l i c y A s s o c i a t e s
63
students. The program will assist these students to enter internship programs or entry-level employment.
In Montana, training for emerging alternative energy industries is at the core of the regional collaboration effort. Grant-funded training covers a wide range of occupations associated with alternative energy production and distribution. For example, students at Montana State University, Northern are learning how to conduct the tests necessary to determine whether biofuels meet ASTM standards,7 a certification needed before the fuel can be sold commercially.
A variety of interesting “green” initiatives are taking place across Mid-Michigan, all related to the promise of alternative energy sources such as biofuels, wind energy, and construction remediation in order to assure that public buildings and infrastructure are certified according to the Leadership in Energy and Environmental Design (LEED) Green Building Rating System.™ Two opportunities inspired job training projects in these areas: construction of 40 new wind farms in northern Michigan; and new requirements for LEED-certified paint on the Mackinaw Bridge involving a year’s work for 600 painters. Michigan had no qualified
machinists, craftspeople, or painters to fill these jobs. Mott Community College developed workforce training and certification programs to assure that Michigan workers who had lost their jobs in automobile manufacturing or the construction trades would be qualified for jobs in these new sectors.
Underserved Workers The focus on training underserved workers has intensified between 2007 and 2008 in response to changing ETA priorities. Below are descriptions of some of the growing number of programs in the regions that provide supportive services to workers, reach out to minority businesses, or target hard-to-serve populations.
Piedmont Triad created a minority advisory committee tasked with identifying options to engage the region’s minority communities. The committee funds pilot projects that increase the number and capacity of minority-owned businesses and help identify business opportunities that support success and growth. Piedmont Triad’s Director of Outreach has made communicating with diverse community groups about grant funding opportunities a
7 American Society for Testing and Materials
Green Jobs A green-collar worker is employed in the environmental sectors of the economy. Green collar workers include professionals such as workers in the conservation movement, environmental consultants, environmental or biological systems engineers, green building architects, holistic passive solar building designers, solar energy and wind energy engineers and installers, nuclear engineers, green vehicle engineers, "green business" owners, green vehicle manufacturers, organic farmers, environmental lawyers, ecology educators, ecotechnology workers, and sales staff working with these services or products. Green collar workers also include vocational or trade-level workers: electricians who install solar panels; plumbers who install solar water heaters; construction workers who build energy-efficient green buildings and wind power farms; construction workers who weatherize buildings to make them more energy efficient; or other workers involved in clean, renewable, sustainable future energy development.
Source: http://en.wikipedia.org/wiki/Green_jobs
The Power of Partnerships: American Regions Collaborating for Economic Competitiveness, 2009 Interim Report
B e r k e l e y P o l i c y A s s o c i a t e s
64
priority this past year. The region’s 2008 Transformation Grants similarly included a focus on reaching out to rural and underserved communities.
Metro Denver has two new projects targeted at ex-offenders. First, the Turnabout Project is a prisoner reentry employment program that provides training in solar panel installation, wind power equipment, OSHA certification, and a commercial driver’s license for the energy sector. This program also provides ongoing support for six months after employment. Second, the Colorado Division of Corrections is making available to prisoners who are about to be released a grant-supported seven-week, computer-based training program for production line workers and technicians in the renewable energy industry. Ex-offenders who complete the program will be placed in four-year paid apprenticeships with industry partners.
The Piedmont Triad funds Career Start, which aims to increase graduation rates among at-risk students. Teachers help students see how course content is useful in the real world by incorporating illustrations, examples, and vocabulary from real-world jobs and careers into their lesson plans. Evaluations of the program have found a high correlation between career relevant content and improved academic performance, and future studies will also track graduation rates.
The West Michigan TEAM program, a successful collaboration between the public, private and nonprofit sectors, assists small businesses by: 1) providing a state social worker for case management services to employees leaving welfare; 2) connecting employees with social services to assist with transportation, housing, and other potential barriers to work; and 3) helping workers when they are ready to advance to new positions. The project has received national attention and was highlighted at a Workforce Innovations panel on outreach to TANF recipients, moderated by the Assistant Secretary of DOL/ETA. This region also funds a recycling program for ex-offenders that provides transitional employment, cognitive behavioral therapy, and job search assistance.
Through its grant, Montana’s Job Service has made special efforts to build lasting partnerships on the Crow reservation. Virtually no businesses exist on the reservation, and the tribal Chair made a request for training in technical skills and entrepreneurship. The Montana staff coordinated a course in heavy equipment operations held on the reservation with the collaboration of the Tribal Transportation Department and Employment Rights Office. Grant-funded outreach was a key element in bringing about a closer relationship between the Crow Nation and workforce/economic development organizations in the surrounding area.
Entrepreneurship and Business Services Many regions pay substantial attention to developing and supporting entrepreneurs, whether they are dislocated automotive engineers, farmers, or high school students. The regions support a range of services for entrepreneurs including training and technical assistance, business incubators, assistance for rural businesses, youth entrepreneurship training, cluster initiatives, small business assistance, and help in accessing investment capital. This section presents examples of each type of services.
The Power of Partnerships: American Regions Collaborating for Economic Competitiveness, 2009 Interim Report
B e r k e l e y P o l i c y A s s o c i a t e s
65
Entrepreneur Training and Technical Assistance Mid-Michigan supports an entrepreneurship certificate program at Lansing Community
College (LCC). Program participants can take courses that range from a two-hour workshop to a 22-credit hour certificate sequence. LCC assists participants in launching new small businesses through its Small Business Technology Development Center (SBTDC). In Spring 2008, LCC and the SBTDC celebrated the start of more than 80 businesses, 20 of which resulted directly from the grant.
The Center for Entrepreneurship and Commercialization at Saginaw Valley State University is another important effort in the Mid-Michigan region. The Center’s mandate is to encourage diversification in both customer base and products, and to help entrepreneurs develop internal capacity. In addition to the technical assistance in entrepreneurship provided by the Center itself, more than 20 partners and subcontractors offer training and technical assistance throughout the region. Important partners include: Delta College, which provides skills training in advanced manufacturing; the Michigan Manufacturing Technology Center (MMTC), which trains businesses in how to find new customers (and is part of the Manufacturing Extension Partnership system); the Mid-Michigan Innovation Center (MMIC), a business incubator and networking resource; and the WIB for the Thumb Area of the state, which is a regional leader in training, technical assistance, and networking for entrepreneurs.
The Finger Lakes region invests heavily in entrepreneurship training delivered by the two major Rochester-based universities. The initiative also sponsors The Entrepreneurs Network (TEN), a six-month intensive program designed to bolster economic growth by supporting life sciences, early stage technology, and scalable, high-revenue potential start-up companies. Based on best practices of leading entrepreneurial training, education, and networking programs, TEN promotes job growth and business creation and provides its members with access to national experts and funding resources. Its maximum class size of 20 allows for maximum interaction and mentoring.
In Montana, Miles Community College has developed a 30-credit hour, two-semester certificate course in entrepreneurship. It can be taken in person at the MCC and partner college campuses, or through a combination of online and ITV (interactive TV) courses. Apart from the hybrid delivery system, the innovative aspect of this course is that it is being developed in partnership with two tribal colleges: Chief Dull Knife College (Cheyenne) and Little Big Horn College (Crow). Classes from any of the partner colleges will be accepted towards certification and the certificate can be awarded from any of the colleges. The online version not only serves to make the training accessible to remote locations, but also provides a common base of expertise for all partner colleges.
Business Incubators Business incubators are designed specifically to support start-up companies and firms. Many of the regions have business incubators affiliated with or subsidized by the grant. For example:
When layoffs at the Delphi Automotive Plant in Kokomo, Indiana, resulted in the loss of 800 engineering and technical jobs, NCI created a “Skunk Works” business incubator targeted to unemployed white-collar workers from the Delphi plant. The NCI Skunk Works is located in the Inventrek Technology Park where the NCI operations office is located, and is one of two research and technology parks in the region associated with the grant. The other, Purdue
The Power of Partnerships: American Regions Collaborating for Economic Competitiveness, 2009 Interim Report
B e r k e l e y P o l i c y A s s o c i a t e s
66
Discovery Park, is home to NCI projects related to training, technical assistance, and technology transfer in the areas of nanotechnology, energy, supply chain innovation, and health care costs.
The Mid-Michigan Innovation Center (MMIC) requires that prospective tenants have the ability to create new jobs in the Mid-Michigan region, especially for individuals who are unemployed or underemployed. Tenants must also agree to partner actively with the other tenants in the incubator, and “graduate tenants” are encouraged to serve as mentors. MMIC is unusual in having “virtual tenants” who have access to services without a physical presence in the facility.
Kansas City leveraged a small investment of $30,000 into a $3 million dollar grant from the U.S. Department of Commerce for a Regional Technology Transfer Network biotech business incubator with wet lab facilities, located on the Kansas University Medical Center Campus.
Over the life of its grant, Finger Lakes has developed a highly complementary and integrative approach to incubators and research parks across the region that enables each to serve particular business development challenges and encourages referrals and resource sharing. These include an incubator at Rochester Institute for Technology, Infotonics (an effort to work with large employers such as Corning, Kodak, and Xerox), the Cornell Tech Farm (agriculture-based and food-processing companies), and the High Tech Research Park (begun as a collaborative between Monroe County and two universities). In 2008, representatives from incubators and research parks met with university-based experts to share approaches to innovation that are increasingly complementary, rather than competitive.
Rural Business Programs Many of the regions also target mature small businesses and, increasingly, small, family-owned enterprises in rural areas.
Montana operates several rural small business and entrepreneurship programs. Annie's Project offers management and financial training for farm wives who traditionally serve as the farm’s business manager. The project holds seminars at the four Bio Products Innovation Centers (or by teleconference), providing training in estate planning, financial software, business ownership structures, and banking for small businesses. A second type of rural business management course, designed for farmers and existing small businesses, combines practical business management fundamentals (balance sheets, cash flow, cost-benefit analysis) with entrepreneurial “how to grow a business” skills. Along with weekly night classes over two semesters, each participant gets 40 hours of one-on-one consulting time at his or her home or business to develop individual business ideas. The goal is to get farmers to think beyond mere commodity production and recognize value-added opportunities, including diversification into biofuels crops.
West Michigan recently launched two programs geared towards entrepreneurship in rural areas. The Rural Initiative provides technical assistance and training to local farmers to get their produce into major local markets such as Whole Foods and Meijer. Agriculture is one of the major industries in the rural parts of the region, and this initiative is notable for its consideration of agriculture as an engine of economic development for rural areas. The other rural initiative is Rural Prosperity and Enterprise Development, run out of the Newaygo

The Power of Partnerships: American Regions Collaborating for Economic Competitiveness, 2009 Interim Report
B e r k e l e y P o l i c y A s s o c i a t e s
67
County Economic Development Office. This initiative offers business counseling, training, and skills development to new and existing small businesses in four rural counties.
Youth Programs Young people are an important target group for entrepreneurship programs throughout the regions. The following programs seek to motivate the next generation of economic pioneers:
Several of NCI's entrepreneurship education programs, including the Entrepreneurship Youth Institute and the STEM-focused Entrepreneurship Summer Camps, are geared towards high school students.
Finger Lakes offers in-school and extra-curricular high school entrepreneurship instruction. The grant also sponsors the Young Entrepreneurs Academy (YEA!), an innovative program for high school students in which students start their own businesses during an intensive nine-month course of project-based, hands-on entrepreneurial education. The program guides students through developing a business plan, pitching to an investor panel, obtaining funding, launching the venture, managing media campaigns, and managing e-commerce and web activities, sales events, and trade shows. The end result is a fully formed and functioning business that can be carried on by students after graduation.
Wall Street West sponsored an event in the fall of 2008 modeled after the “American Idol” television show in which young entrepreneurs (typically graduate students) present their concepts to a large audience. The audience votes on a winner, and the winner receives seed capital.
WAEM offers several types of youth entrepreneurship programs. One of the Mississippi community colleges hosted “How to Become an Entrepreneur in One Week,” a one-day youth entrepreneurship camp that 94 participants from both Mississippi and Alabama attended. In conjunction with the University of Alabama’s REAL (Rural Entrepreneurship through Action Learning) program, WAEM has offered high school teachers in rural communities training on how to incorporate entrepreneurial concepts into science, social science, other classes, or after-class activities. Additionally, a section of WAEM’s website for entrepreneurship, MyBiz.am, is being designed for young people.
Accessing Investment Capital In addition to skill and inspiration, entrepreneurs’ most important need is for investment capital. Often these financial (as well as technical and motivational) resources reside within the entrepreneurs’ own communities. Many of the regions attempt to connect entrepreneurs to these sources.
In the California Corridor, the Los Angeles Economic Development Council developed an Innovation Resources Guide to help entrepreneurs and business operators access the wide range of resource agencies that can help support commercialization of innovation.
The California Corridor also held entrepreneurship/venture capital forums and events that provided the opportunity for entrepreneurs to pitch their ideas to investors, and developed a
The Power of Partnerships: American Regions Collaborating for Economic Competitiveness, 2009 Interim Report
B e r k e l e y P o l i c y A s s o c i a t e s
68
guide to conducting these kinds of events, Holding a Venture Capital Pitching Event or Starting an Angel Investor Network.8
WAEM's approach to entrepreneurship in its largely rural region has been to focus more on building local and regional resource networks for business than on individual entrepreneurship training. The initiative’s emphasis has been developing the MyBiz website and entrepreneur network, and training local Connectors and Navigators to help entrepreneurs access and make best use of the website and its resources. The website features links to resources and information at the community level, a Resource Navigator with region-wide links, and calendars of training and events offered by community colleges and other providers. A key element of this effort has been the creation of Start It! cards that list local resources for business start-ups. By late 2008, the MyBiz website had logged over 240,000 unique hits and Start It! cards had been developed for more than 140 communities in the region.
Purdue University’s Krannert Management and Economics Library in the NCI region contains invaluable information resources for existing and emerging entrepreneurs. NCI, in partnership with Purdue Extension and the regional Small Business Development Center, is making available computer terminals connected to the Library that are located in each county in the region, at Purdue’s County Extension Offices, and other facilities.
Business Cluster Initiatives The discussion that follows highlights the supportive activities targeted to the industry and not the business owner. These endeavors also differ from entrepreneurship support because of their focus on process how to streamline manufacturing or bring new products to market while entrepreneurship programs tend to focus on managerial issues such as how to write a business plan or attract angel investment. The following are examples of technical assistance programs that engage clusters of similar businesses within a given region, instead of one-on-one services.
A major focus of the California Corridor initiative has been to improve the international competitiveness of the region’s supply chain by developing and executing a “Smart Supplier
8 An angel investor is an individual who invests in start up firms. As opposed to venture capitalists who invest from a pool of funds, angel investors provide their own money as capital.
As part of the California Corridor grant, the Los Angeles Economic Development Council (LAEDC) developed a new online interactive real-time database system to support targeting high technology growth clusters and outreach to the county’s innovative business base. This “innovation support architecture” was designed to be replicable throughout the state and the nation as part of a regional economic development toolkit. The underlying premise of the project is that innovative companies make a greater positive impact on the economic vitality of the region than other businesses. (Using the Pollack Retention and Relocation model, California Corridor calculated that the economic impact of jobs created by small and medium aerospace manufacturing firms is more than 4.5 times greater than the return on investment in hotel jobs.) By integrating and enhancing the various database tools into one integrated county-wide database, regional managers can now track and monitor not only the results of their region’s business surveys and contacts, but also management data needs for all of the high tech industry clients they serve. LAEDC reports that this effort has provided them with a valuable tool to identify business trends and effect positive change on the Los Angeles County economy.
The Power of Partnerships: American Regions Collaborating for Economic Competitiveness, 2009 Interim Report
B e r k e l e y P o l i c y A s s o c i a t e s
69
Strategy” that supports small businesses, manufacturers, and entrepreneurs in adapting to global manufacturing transformation. “No region can successfully compete in the 21st century global economy with 20th century suppliers.” In this effort, the California Space Authority, along with Antelope Valley and El Camino Colleges, joined forces with other supply chain project partners to develop and deliver “Introduction to Supply Chain Management” sessions. The seminars featured: suppliers and the global supply chain perspective; dynamic complex networks; compliance issues around International Traffic in Arms Regulation (ITAR) and other regulations; systems engineering; project management; life cycle support along with high performance computer modeling; and product/process simulation.
NCI funded the start-up of the Indiana Energy Systems Network, which aims to catalyze Indiana as a global leader in the energy industry. IESN facilitates business creation, market expansion, and talent development in energy conversion, power storage, distributed power generation, and alternative energy. Their approach is to leverage the existing intellectual capital – people and technology – of the automotive industry in Indiana. IESN actually extends beyond the NCI region and throughout the state of Indiana. An IESN respondent commented that currently people are “stuck in vertical pillars and do not talk to others outside this sphere,” and stressed the importance of business and individuals connecting outside their regular spheres to encourage the innovation necessary to change the economic course of Indiana’s future.
Small Business Services Small businesses are a vital element of the national economy. Several regions engaged in services to support small companies, with a focus on technology and process versus operations and management.
Finger Lakes' Small Business Innovation Research (SBIR) services provide training and assistance to regional technology companies to improve their success with SBIR and Small Business Technology Transfer (STTR) programs. SBIR training services assisted regional firms to win five SBIR/STTR awards of almost $1.3 million in federal dollars. High Tech Rochester (HTR) provided hands-on training to 33 companies in the region. HTR drafted and edited proposals and reviewed proposed budgets for ten proposals submitted for SBIR/STTR grants.
The grant-funded Finger Lakes Scholarship Grants program provides direct assistance to small companies and has outperformed all expectations. The maximum award of $25,000 must be matched on at least a one-to-one basis. By late 2008, the program had provided businesses in targeted industries with over $3 million, funding worker training and skills upgrade for more than 5,000 workers. Training is short-term and leads to industry-
In early 2007, Mastro Graphic Arts (MGA) might have been described as an “average” small family-owned printing company. With the help of the Finger Lakes Scholarship program, MGA has become a specialized, sophisticated, and highly efficient company that now competes nationally and globally. The company’s first grant-funded training covered lean manufacturing to improve overall efficiency and quality control. Subsequent grants have allowed the company to train employees who operate a new specialized machine – a high-speed digital lenticular printer. Grant-funded training has helped MGA land new multimillion-dollar accounts, compete “on a new playing field,” and create additional jobs.
The Power of Partnerships: American Regions Collaborating for Economic Competitiveness, 2009 Interim Report
B e r k e l e y P o l i c y A s s o c i a t e s
70
recognized certifications/credentials, supervisory and managerial skills training, process/productivity improvement, and/or in-demand technical and occupational skills. The training has made a critical difference in the sustainability and future of the grant recipient companies.
Montana funds the Bio-Products Innovation Centers (BPICs) to assist farmers and other agrobusinesses. The BPICs provide a range of services, including identifying what is needed for a venture to move from idea to implementation, reviewing business plans, assisting businesses to find suitable sites, and linking them to funding and worker training. For example, if a farm housewife wants to grow and market herbs, BPIC staff provide technical assistance to address markets, financing, and commercial-scale production. One of the BPIC contractors also operates a revolving loan fund with non-grant capital.
The North Star Alliance and its partners recently began the Marine Industry Owner Operator College, which uses the agricultural cooperative extension model to provide access to local expertise in specific topics at centrally located venues. The long-term goal of this effort is to provide and promote ongoing, continuing education to owners and operators to enhance their management skill levels and to ensure the long-term health of their firms and subsequently the industry. The College’s first set of courses focus on upper-level management training, and later will expand into training for mid-level managers and supervisors.
Talent Development Activities Talent development activities include any projects that largely focus on training future entrants to the workforce. This strategy includes science, technology, engineering, and math (STEM) education in both K-12 and postsecondary schools, internships, curriculum development, and teacher training and professional development. This section presents examples of programs for youth in high school, career awareness programs, and postsecondary programs. Programs for High School Youth Several initiatives began STEM education programs targeting students in secondary and even primary schools. ETA clarified its guidance on the allowable uses of the H-1B funds that support the Initiative in November 2007, stating that monies could not be spent on students under the age of 16 years without the expressed permission of ETA.9 In response, regions curtailed or revised some talent pipeline activities, and received waivers allowing them to continue others. Several programs in the regions targeted or included secondary school-aged youth; eight of these requested waivers and five received exemptions. Figure 4.1 presents examples of the youth programs that the regions offered, identifying those for which a waiver was granted, including.
Project Lead the Way – a nationally recognized pre-engineering program with hands-on activity-based components and rigorous technical content – operates in several regions, including the California Corridor, Metro Denver, Kansas City, and NCI. This program received a blanket exemption from ETA’s restriction on youth activities.
9 WIRED Policy on Investments in Activities For Secondary School Aged Youth. Memorandum dated November 19, 2007 signed by Assistant Secretary Emily Stover DeRocco
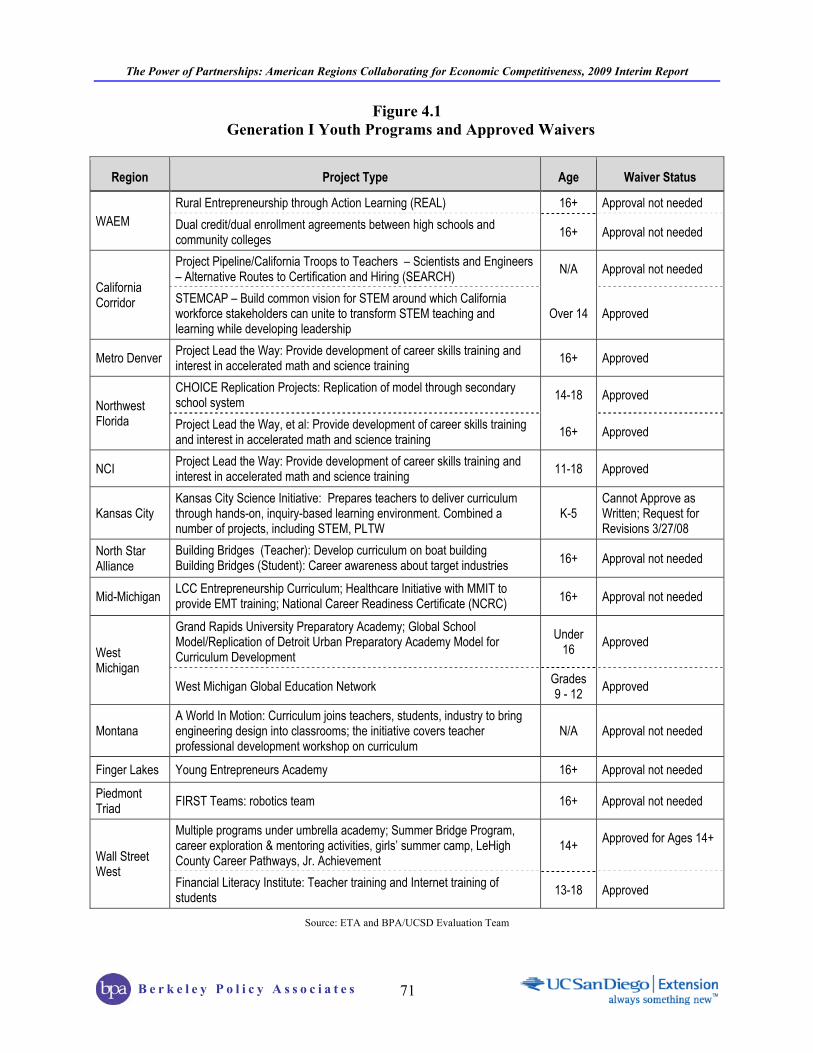
The Power of Partnerships: American Regions Collaborating for Economic Competitiveness, 2009 Interim Report
B e r k e l e y P o l i c y A s s o c i a t e s
71
Figure 4.1 Generation I Youth Programs and Approved Waivers
Region Project Type Age Waiver Status
WAEM Rural Entrepreneurship through Action Learning (REAL) 16+ Approval not needed Dual credit/dual enrollment agreements between high schools and community colleges 16+ Approval not needed
California Corridor
Project Pipeline/California Troops to Teachers – Scientists and Engineers – Alternative Routes to Certification and Hiring (SEARCH) N/A Approval not needed
STEMCAP – Build common vision for STEM around which California workforce stakeholders can unite to transform STEM teaching and learning while developing leadership
Over 14 Approved
Metro Denver Project Lead the Way: Provide development of career skills training and interest in accelerated math and science training 16+ Approved
Northwest Florida
CHOICE Replication Projects: Replication of model through secondary school system 14-18 Approved
Project Lead the Way, et al: Provide development of career skills training and interest in accelerated math and science training 16+ Approved
NCI Project Lead the Way: Provide development of career skills training and interest in accelerated math and science training 11-18 Approved
Kansas City Kansas City Science Initiative: Prepares teachers to deliver curriculum through hands-on, inquiry-based learning environment. Combined a number of projects, including STEM, PLTW
K-5 Cannot Approve as Written; Request for Revisions 3/27/08
North Star Alliance
Building Bridges (Teacher): Develop curriculum on boat building Building Bridges (Student): Career awareness about target industries 16+ Approval not needed
Mid-Michigan LCC Entrepreneurship Curriculum; Healthcare Initiative with MMIT to provide EMT training; National Career Readiness Certificate (NCRC) 16+ Approval not needed
West Michigan
Grand Rapids University Preparatory Academy; Global School Model/Replication of Detroit Urban Preparatory Academy Model for Curriculum Development
Under 16 Approved
West Michigan Global Education Network Grades 9 - 12 Approved
Montana A World In Motion: Curriculum joins teachers, students, industry to bring engineering design into classrooms; the initiative covers teacher professional development workshop on curriculum
N/A Approval not needed
Finger Lakes Young Entrepreneurs Academy 16+ Approval not needed
Piedmont Triad FIRST Teams: robotics team 16+ Approval not needed
Wall Street West
Multiple programs under umbrella academy; Summer Bridge Program, career exploration & mentoring activities, girls’ summer camp, LeHigh County Career Pathways, Jr. Achievement
14+ Approved for Ages 14+
Financial Literacy Institute: Teacher training and Internet training of students 13-18 Approved
Source: ETA and BPA/UCSD Evaluation Team
The Power of Partnerships: American Regions Collaborating for Economic Competitiveness, 2009 Interim Report
B e r k e l e y P o l i c y A s s o c i a t e s
72
Piedmont Triad’s advanced manufacturing cluster is funding FIRST Teams. These teams, each of which works after school for several months to build a robot using advanced manufacturing techniques, have been established in at least one high school in each of the 12 counties. The teams enter their robots in regional and national competitions that generate considerable excitement among students. Teams present their work and robots within their own and other high schools, and at meetings of Scout troops and other local youth groups.
WAEM's youth focus is on dual high school/community college enrollment and dual credit vocational courses, bringing access to the Career Readiness Credential and introductory advanced manufacturing skills to high school juniors and seniors. The courses cover auto technology, computer-assisted drafting, machine tool trades, telecommunications, and electronics.
Career Readiness Along with STEM education programs, activities that increase young people’s awareness or preparation for employment in targeted industries were quite common across the regions.
Wall Street West plans to create a website with tools and resources for career education. The site includes Career Cruising, a software-based tool for middle and high school students that allows every student to develop and maintain an individualized electronic career portfolio containing records of academic achievements, interest inventories, assessments, skills, and career exploration. The site also describes opportunities for mentoring, job shadowing, apprenticeships, service learning, and volunteer experiences.
Piedmont Triad’s Promoting Logistics to Youth project markets logistics to kids with appropriate “give-a-ways” at industry events. A summer institute at the North Carolina Agricultural and Technical University invites rising high school juniors and seniors to spend five weeks learning about logistics and visiting businesses. One institute activity for students, teachers, and guidance counselors is a tour of career opportunities in logistics at the Wilmington and Charlotte ports. Another Piedmont Triad program is the Elon Academy, in which high school juniors and seniors spend time on the Elon University campus, both after school and in a summer residential program. The program combines academic improvement programs, mentoring, and placement in internships with local companies. Supported primarily by local business, the Academy targets youth with good records of academic achievement who lack the resources to continue their education.
Northwest Florida awarded grants to fund the development of career skills programs in high schools. The Wakulla County High School Medical Academy has fostered new partnerships between education and the region’s medical community. Nearly a third of the school’s 1,200
A “hybrid” between talent development and workforce training are internship programs. Internships provide actual work experience but are targeted to students, not workers. Many regions have used internships as a means of developing young talent and creating awareness of careers in targeted industries. West Michigan funds a statewide Internship Initiative, which intends to create 3,000 internships in West Michigan by the end of 2011. The Internship Initiative plans to launch a website portal to help match college students with internship opportunities. West Michigan also developed a public education plan to promote the internship concept to employers, students, and educational institutions. Components of the plan include an employer needs assessment survey and the use of on-campus student interns to promote internships to their peers.
The Power of Partnerships: American Regions Collaborating for Economic Competitiveness, 2009 Interim Report
B e r k e l e y P o l i c y A s s o c i a t e s
73
students are enrolled in Academy courses and another 400 potential students attended a recent Academy open house. Grant funds supported the launch of an Aerospace and Flight Academy in the Jefferson County School District. The Gadsden County School District is working with the Banner Center of Excellence for Career Academies Secondary Education to create an information technology institute at West Gadsden High School.
Postsecondary Programs Several regions funded the development of curricula that resulted in a new degreed program. For example:
In Montana, Miles Community College has created two-year Associate of Applied Science (AAS) degrees in Biofuels and Energy Technology, and a two-year Associate of Science degree (AS) degree with a biofuels emphasis. The AS is designed so that students can transfer credits toward a four-year Bachelor of Science degree. The biofuels programs are partnered with MSU-Missoula College of Technology’s (COT) online Renewable Energy program. Dawson Community College is designing a wind energy and maintenance course. The school has purchased a wind monitoring tower, two small wind generators, and Amatrol electronics and hydraulics teaching modules.
The California Corridor secured the approval of the state’s Community College Chancellor to establish two new A.S. degrees – A.S. in Electronics Technology, Emphasis in Mechatronics and an A.S. degree in Engineering Technology, Emphasis in Mechatronics.
Very recently, Northwest Florida funded the University of West Florida to implement an Executive Master of Science program in computer science/software engineering. Students will earn a master’s degree through an accelerated, on-line curriculum. Students will also have the option of simultaneously earning a Certificate of Medical Informatics.
Data Analysis and Planning The regions conducted a host of research activities that continue to guide the implementation of the initiatives, such as asset mapping,10 gap analysis, employer surveys, and other strategic planning efforts. During the second evaluation visits, site visitors observed less emphasis on research and planning than during the first round of visits. As the regions’ programs continue to mature, however, they undertake new and more targeted data analysis tasks to support the planning needed for their next projects. All of the 13 regions revisited their Implementation Plans since the evaluation’s first Interim Report was released. Generally, the reviews resulted in minor changes that refine existing tactics, and not in tectonic shifts in philosophy or method. For this and other efforts, the regions have taken on a variety of types of workforce research, including the examples discussed below.
In at least two regions, data collection provided real insight into the needs of industry, both for talent development and workforce training. In both Florida and California, data clearly
10 An asset map can be defined as an inventory of the resources in a given geographical area. In the context of regional transformation, the asset-mapping concept has been used to identify stakeholders and partners, enumerate facilities and programs, or assess regional economic conditions.
The Power of Partnerships: American Regions Collaborating for Economic Competitiveness, 2009 Interim Report
B e r k e l e y P o l i c y A s s o c i a t e s
74
indicated that employers put a high priority on training workers in non-technical skills, i.e., written and verbal communication skills. The employers considered these soft skills equally important whether they were hiring a systems engineer or a manufacturing technician.
The Piedmont Triad conducted a survey of the working poor, interviewing 13,000 people who receive state childcare subsidies to determine their need for social services.
Wall Street West made several investments in assessing the region’s assets and needs. The Workforce and Workforce Development Gap Analysis identified gaps in the workforce and workforce system in the skills needed to grow the financial services industry. Respondents said the gap analysis was very important in identifying occupations within clusters and the level of demand, and helped the region develop better and more appropriate training. The Regional Innovation Asset Map compiled data on regional innovation assets to grow financial services and other industries; compiled a TORQ report (summary of transferable skills) for financial services occupations; and identified educational programs leading to employment in financial services. The initiative also awarded a grant to develop competency models with definitions and behavioral indicators for managerial, non-managerial, and information technology (IT) positions. They have also contracted for a Wall Street West Impact Analysis to be completed at the end of 2009.
Northwest Florida conducted a comprehensive data collection and analysis effort to drive policy, moving over the past two years from identifying the region’s needs to identification of programs to fill those needs. A target industry occupational analysis of the anticipated workforce demand for 118 target industry occupations – along with face-to-face interviews conducted by the collaborative’s economic development and workforce board partners – provided the foundation for the award of new employee skills training and entrepreneur grants, as well as skills training at regional high schools. The University of West Florida's Haas Center for Business Research and Economic Development recently completed a grant-funded gap analysis of the educational credentials required for the identified target occupations and the region and state’s current output of those credentials. The gap analysis data is being used to inform the initiative’s final round of grant funding in post-secondary education. One contractor recently collaborated with the U.S. Forestry Service to map the sources of renewable energy in the region, information that the region’s Renewable Energy Advisory Council is using to solicit grant funds to determine the availability of woody biomass feedstock and an efficient means of harvesting the forest product.
Initially, many workforce system partners in the California Corridor were leery of participating in some of its labor-intensive, data-gathering projects. “There was a bit of resistance there, because the money went to somebody none of us knew,” one workforce partner said.“ But after completing projects ranging from a survey of 21st century skills to profiles of 21st century employers, workforce partners reported that: “Sometimes EDD (the state employment service agency) data is just data with no meaning; they’re still saying roofers is a top occupation. WIBs can now give meaning to data; we can say, ‘this is what we found here and we know it’s true, so take a look at it.’” Another WIB director added: “It’s easier to get people jobs if you can focus on the jobs out there –doing research on projects told me: “This is what employers are saying they want or need. I learned so much."

The Power of Partnerships: American Regions Collaborating for Economic Competitiveness, 2009 Interim Report
B e r k e l e y P o l i c y A s s o c i a t e s
75
The California Corridor’s 21st Century Workforce Profile project defined future workforce skill needs and facilitated effective planning by workforce training providers by creating advanced technology job profiles and a skills matrix for technology fields. The project also developed strategies to identify training and education gaps and share best practices across the region. The region’s new Regional Economic Development Toolkit calls for a collaborative and interactive approach to collecting and using data. One-on-one surveys of industry are increasingly difficult to administer, as companies are overwhelmed with survey requests from multiple stakeholders. Collaborative data collection and analysis efforts between the economic development and workforce development agencies have been very successful in securing industry cooperation and improving the accuracy of the resulting information.
Summary The industries targeted by the regions have not changed substantially since the inception of the initiatives. As projects evolved and as new opportunities arose, several regions shifted their focus to the emerging alternative energy sector. The result has been increased support for entrepreneurship and business development in environmentally friendly companies, as well as an overall increase in training for green jobs. The regions now fund more workforce training activities than previously, due in part to H-1B funding requirements, but also because workforce training was a natural next step after the initial planning and implementation efforts. WorkKeys®, a job skills assessment system, has become a critical tool for many regions. Increased attention has been given to training underserved workers in response to changes at ETA. Many regions devote significant effort and resources to supporting entrepreneurs, and increasingly to small rural companies. Research parks and business incubators are key facilities in regions’ support for emerging entrepreneurs. At the same time, regions have also invested considerable energy in supporting mature businesses through cluster-based technical assistance and the small business sector. The talent pipeline remains a chief concern in all of the regions. Given the H-1B funding restrictions on serving youth, fewer regions are offering STEM programs for K-12 students, and regions have correspondingly increased career awareness activities targeting older youth. Between 2007 and 2008, the initiatives moved from start-up to an operational phase. While much of the strategic planning efforts necessary in the start-up phase have concluded, the regions continue to learn and adjust their programs accordingly. Some of the variation in activities is simply a function of the passage of time, as initiative objectives and milestones are met. Other changes are responses to the changes in the regulatory and economic environments in which the regions operate.
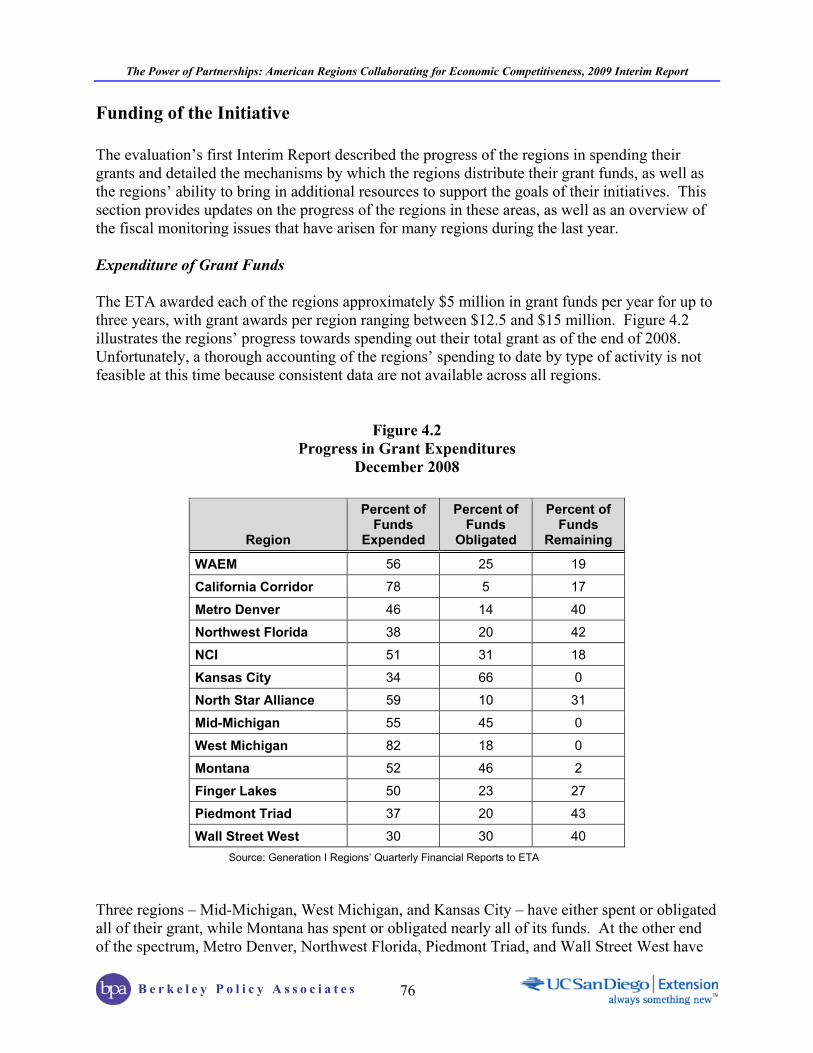
The Power of Partnerships: American Regions Collaborating for Economic Competitiveness, 2009 Interim Report
B e r k e l e y P o l i c y A s s o c i a t e s
76
Funding of the Initiative The evaluation’s first Interim Report described the progress of the regions in spending their grants and detailed the mechanisms by which the regions distribute their grant funds, as well as the regions’ ability to bring in additional resources to support the goals of their initiatives. This section provides updates on the progress of the regions in these areas, as well as an overview of the fiscal monitoring issues that have arisen for many regions during the last year. Expenditure of Grant Funds The ETA awarded each of the regions approximately $5 million in grant funds per year for up to three years, with grant awards per region ranging between $12.5 and $15 million. Figure 4.2 illustrates the regions’ progress towards spending out their total grant as of the end of 2008. Unfortunately, a thorough accounting of the regions’ spending to date by type of activity is not feasible at this time because consistent data are not available across all regions.
Figure 4.2 Progress in Grant Expenditures
December 2008
Region
Percent of Funds
Expended
Percent of Funds
Obligated
Percent of Funds
Remaining
WAEM 56 25 19
California Corridor 78 5 17
Metro Denver 46 14 40
Northwest Florida 38 20 42
NCI 51 31 18
Kansas City 34 66 0
North Star Alliance 59 10 31
Mid-Michigan 55 45 0
West Michigan 82 18 0
Montana 52 46 2
Finger Lakes 50 23 27
Piedmont Triad 37 20 43
Wall Street West 30 30 40 Source: Generation I Regions’ Quarterly Financial Reports to ETA
Three regions – Mid-Michigan, West Michigan, and Kansas City – have either spent or obligated all of their grant, while Montana has spent or obligated nearly all of its funds. At the other end of the spectrum, Metro Denver, Northwest Florida, Piedmont Triad, and Wall Street West have
The Power of Partnerships: American Regions Collaborating for Economic Competitiveness, 2009 Interim Report
B e r k e l e y P o l i c y A s s o c i a t e s
77
at least 40% of their funds remaining. As their grants wind down, some regions may find that they have more unspent funds than they anticipated. For example, as the California Innovation Corridor prepared its final report, staff projected that approximately $600,000 of grant funds remained. Recent project reviews, however, indicate that unspent funds across all of their sub-grants could total more than $3 million. CSA submitted for ETA approval a new Sustainability Plan expanding their sustainability activities and partners to take advantage of these remaining funds. Changes in the Distribution of Funds within Regions As described in the first Interim Report, the regions use a range of mechanisms for distributing grant funds to their partners, including sole-source contracts, memoranda of understanding (MOUs), and competitive RFP processes for grants or contracts. Notable changes in the last year include both adjustments in distribution mechanisms and reallocation of funds to reflect changed priorities within the regions and at the federal level. Several regions have introduced new programs for distributing funds. For example, Piedmont Triad is now awarding Transformation Grants, and Northwest Florida developed Workforce Innovation I grants, awarded to local workforce boards and Workforce Innovations II grants awarded to post-secondary institutions and their business partners. Both of these programs are described in more detail earlier in this chapter. As mentioned above, although the California Corridor was writing its final report at the time of the second evaluation visit, no agreement has been reached between the region’s program management and DOL on how to best distribute the region’s unspent grant funds. The grant program manager wants to use these funds for projects that best demonstrate the institutionalization of transformational principles. In some cases, that will mean forming new partnerships among current California Corridor partners. Other regions have redistributed existing funds or made new distributions to address shifts in funding priorities. For example, West Michigan issued a new RFP in August 2008 and funded two different projects addressing the workforce needs of ex-offenders. Staff in West Michigan stated that these projects were selected in part because they wanted to fund more projects for this population after the ETA leadership emphasized the importance of integrating this population into the workforce system. In Finger Lakes, on the other hand, the Steering Committee reallocated funds and initiated an RFP process to encourage applications for workforce investment initiatives from a more diverse range of providers. In its original grant proposal, the Mid-Michigan region pre-allocated their resources to nine partners. When the grant was awarded, however, the funded partners decided that the newly created Prima Civitas Foundation (PCF) should manage the grant, and each agreed to contribute a proportion of their funding to PCF for that function. Other than this “give-back” to PCF, the original pre-allocations stood for the first two years of the initiative. Over time, the partners realized that the initiative needed more flexibility than the pre-allocated budget allowed. The opportunity arose to take over a research and production facility that Pfizer, Inc. had closed down in the city of Holland. Mid-Michigan received approval from ETA to shift $500,000 of the
The Power of Partnerships: American Regions Collaborating for Economic Competitiveness, 2009 Interim Report
B e r k e l e y P o l i c y A s s o c i a t e s
78
funds allocated to Michigan State University for training to “re-purpose” the Pfizer facility into an R&D and educational facility centered on the bioeconomy. The region also obtained permission from ETA to use additional funds allocated to MSU for other purposes such as the National Career Readiness Certificate (NCRC) initiative, on-the-job training, and continued funding for PCF. Finally, some regions have reclaimed previously allocated funds. For example, Northwest Florida funds grants to businesses in its target industries to train employees for new positions that meet specific wage and benefit requirements. As of August 2008, the region had awarded $1.1 million in Employee Skills Training grants. Some sub-grantees will be returning the funds, however, because the companies cannot create the jobs that are required, find enough skilled applicants, or have lost revenue as the economy declined. Similarly, NCI has also recaptured over $255,000 in unused funds from sub-grantees. Montana’s Grant Executive Committee reclaimed funds from the Departments of Commerce and Labor and Industry in order to increase the funds flowing through the Office of Continuing and Higher Education (OCHE) to Montana State University, Northern. The university operates the Bio-Energy Innovation and Testing Center, which required additional testing equipment for certifying biodiesel fuel. Furthermore, at the time of the evaluation visit, the Montana project director was planning to reevaluate the need to reclaim and reallocate funds in January 2009. At the time of its initial grant award, ETA notified the North Star Alliance that a number of the initiative’s planned activities were unallowable uses of H-1B funds. As a result, some funds originally budgeted for the Capitalization and Marketing Pillars were reclaimed and reallocated into training activities. This process continued over the second year of the grant, as the deteriorating conditions in the finance industry interfered with implementing projects under these Pillars that involved allowable costs. Issues Related to DOL/ETA Guidance The evaluation team previously found that a larger than anticipated proportion of implementation efforts among the grantees during the first grant year centered on complying with federal regulations governing the grant. The source of the grant funds is the fees paid by employers for securing H-1B visas for foreign workers needed in the U.S. As such, the use of the funds is restricted to covering: the costs of training; curriculum development and dissemination; other career and labor market information; outreach and recruitment; tools, equipment and supplies used for training purposes; and other related costs. Grant funds cannot be used to pay for product R&D; public infrastructure improvements; inventory acquisition; or general business capitalization or expansion, even though these activities may result in the creation of new jobs.11 Particularly for regions in which the grantee and/or fiscal agent was not familiar with ETA regulations, the Department’s clarifications of the allowable uses of these training funds required regions to redirect funds from some of the uses they anticipated during the proposal phase. For example, the restriction against using grant funds as investment capital for entrepreneurs has 11 WIRED Initiative: Uses of the H-1B Funding Revenue, updated June 2007.

The Power of Partnerships: American Regions Collaborating for Economic Competitiveness, 2009 Interim Report
B e r k e l e y P o l i c y A s s o c i a t e s
79
required several regions to seek other sources of support for their entrepreneurship efforts, while at least one region had to find sources of funding outside the grant to support development of a regional marketing plan. Subsequently, ETA released additional guidance to the grantees further delineating allowable costs. The first memorandum, released in November 2007,12 required regions to obtain approval from ETA leads for any activities targeted to youth under the age of 16. The second was a Training and Employment Guidance Letter (TEGL)13 released in December 2007 that clarified that grant funds could not be used for economic development activities “not directly related to training for eligible individuals.” While this guidance aimed to clarify the June 2007 memo, and while ETA did offer a webinar to address the regions’ questions about the implications, many regions had already planned, funded, and even begun to carry out activities that were deemed unallowable under this guidance. Since the release of the memorandum on services for youth under 16, regions have applied for and received waivers from ETA to either continue existing activities or execute planned activities involving youth under age 16. Not all submitted waiver applications were approved, however, and some projects had to be cancelled or modified; for example, the Wall Street West Academy was only approved for youth over age 14. Furthermore, some regions expressed frustration at having to wait while ETA reviewed applications for projects that had previously been approved and were now on hold. ETA also issued a fiscal monitoring report on each region’s use of funds in late 2008. Whether or not actual problems were uncovered, these audit investigations caused grantee staff to “go into a tailspin,” as a respondent in Maine described it, largely due to the fact that ETA had not provided much guidance in the beginning of the grant, and regions were concerned that they may have undertaken unallowable activities unintentionally. While some regions had only minor compliance issues, these audits posed significant concerns for other regions, and the implications of audit findings for some of the regions are not yet clear at the time of writing this report. In West Michigan, for example, the audit questioned $8 million of grant spending, several million of which appeared to be fully disallowed. During the evaluation’s second round of visits, respondents noted that this challenge continues to be an issue in executing their original vision for regional transformation. Specific concerns included:
Loss of stakeholders due to funding restrictions. Metro Denver, for example, reported a decline in employer interest in the initiative after ETA released its guidance on provision of services to youth. Many of the employers involved in the collaborative efforts are interested in the long-term talent pipeline and wanted to focus on interventions that targeted students as early as the fourth grade.
12 Stover DeRocco, Emily. WIRED Policy on Investments in Activities for Secondary School Aged Youth, November 19, 2007 13 Stover DeRocco, Emily. Use of Workforce Investment Act (WIA) Funds for Workforce Development Activities in Support of Economic Development, December 11, 2007, TEGL #13-07, http://wdr.doleta.gov/directives/corr_doc.cfm?DOCN=2560
The Power of Partnerships: American Regions Collaborating for Economic Competitiveness, 2009 Interim Report
B e r k e l e y P o l i c y A s s o c i a t e s
80
The ability to address regional priorities within the funding restrictions. In both Piedmont Triad and NCI, respondents stated that the restriction on serving youth under age 16 missed the main concern of regional stakeholders – high school dropouts, who are harder to reach after age 16. Wall Street West has had to review costs and priorities related to the economic development components of the region’s implementation plan. Given the region’s initial emphasis on attracting investments from New York-based financial services firms, a great deal of effort was expended on business outreach and related activities, and the uncertainty about how to cover the costs of supporting these efforts remains a critical concern.
Inconsistent guidance from DOL/ETA. Many regions were upset to find that projects that had been approved and even championed by ETA leads were later deemed unallowable under the H-1B restrictions. Some regions also had to delay issuance of funds and subcontracts because they had not received sufficient information on the regulations governing grant funds. In California, one program staff member reported that writing justifications for projects ETA had originally approved and getting approval for those projects took another six months, and still the confusion over what was allowed under H1-B funds brought some projects to a halt and limited what could be accomplished in others.
Grantees who had had previous experience with WIA funds stressed that they were encouraged to think of funds as a “different animal,” only to later discover that they were subject to metrics and restrictions more typical of past DOL funding.
Other Funding Issues In addition to planning and operational funding challenges that resulted from H-IB regulations, respondents in the regions also reported funding concerns related to delays and under-expenditures caused by slow and complex procurement procedures for capital equipment. ETA must approve the purchase of equipment costing at least $5,000, even if the Department has already approved the region’s budget containing a line item for equipment purchase. Inefficient procurement procedures within the regions have added to processing time. Delays in receiving crucial equipment often created a snowball effect on other expenditures; for example, teachers were not hired, and courses were not held until the required equipment arrived.
In WAEM, procurement hold-ups for Amatrol equipment delayed the full implementation of M3 training for an advanced manufacturing credential in several community colleges. As of late 2008, several sub-grantees projected that they would not be able to spend out their grant amounts, and without extending their period of performance may not have time to train as many individuals as they had projected.
In Montana, procuring equipment for the Bio-Energy Innovation and Testing Center took a year and a half. Mobile demonstration equipment is crucial for biofuels, hazardous materials, and similar training in this large region. Programs at the Montana State University, Billings College of Technology, and at Miles City Community College had been held up for months awaiting needed equipment. As a result, staff had to cancel some commitments at both colleges.

The Power of Partnerships: American Regions Collaborating for Economic Competitiveness, 2009 Interim Report
B e r k e l e y P o l i c y A s s o c i a t e s
81
Initiative-Connected Investments Another issue that affected planning and ongoing operations was leveraged funding. ETA did not require applicants to secure matching funds, or propose cost-sharing or cost participation, in order for a region to be eligible to receive a grant. Nonetheless, the original SGA encouraged applicants to leverage the resources of all strategic partners whenever possible. ETA subsequently made clear that the grants were to be considered seed money, and that regions should secure other sources of funding to cover the full range of activities needed to transform their local economies. The Department did not define “leveraged” for the regions, however, and the grantees varied in the definitions that they used. In 2008, ETA began defining leveraged funds according to the standard for other DOL grants: leveraged funds are those non-grant funds that are used for costs that are allowable under the federal grant. This definition is not how the regions had understood the term. For example, Metro Denver defined leveraged funds in its quarterly reports as “any resources that Metro Denver or partners provide to support the initiative in the implementation of grant activities. Leveraged resources include cash or in-kind donations and may include federal funds such as WIA, TAA, as well as other public or private investments.” In the California Corridor, CSA program managers reported that the region actually stopped reporting leveraged funds to ETA during the fourth quarter of 2008 because ETA and the state have yet to provide formalized guidance to CSA about the definition of funds that can be counted as leveraged, thus CSA has been unable to provide guidance to their partners on reporting leveraged funds. In order to capture the full range of funds available to the regions and their partners, this report uses the term Initiative-connected investments to refer to what the evaluation’s 2007 Interim Report called “leveraged funds.” The evaluation’s definition for both terms is the same: any funds other than the grants that are specifically supporting grant-related activities or any project within the region that is directly related to the vision and objectives of the region’s initiative. This report uses the last version of ETA’s leveraged funds report that conforms to this definition, compiled in August 2008. Because the data are not recent, the numbers may be artificially low, as regions may have secured additional resources that are not reflected here and may also be in the process of raising more funds. Nonetheless, these data include funds used for unallowable costs, which have enabled many regions to support planned activities that cannot be paid for with the grant. By August 2007, the regions had raised over $186 million in Initiative-connected investments (see Figure 4.3). Collectively through August 2008, the regions had increased their Initiative-connected investments to over $294 million. Northwest Florida, Montana, and Mid-Michigan reported the largest amounts of non-Initiative funds available; in total, these three regions represent 69% of the Initiative-connected investments that the regions reported. The Northwest Florida Initiative has the most Initiative-connected investments, largely because it is structured as a grant-making organization that expends most of its funds in grant awards and requires grantees to match their award amount 100% (i.e., every dollar that is awarded to an Initiative-funded grantee results in an Initiative-connected investment of one dollar). Its Initiative-connected investments increased significantly from 2007 to 2008 in part because of the number
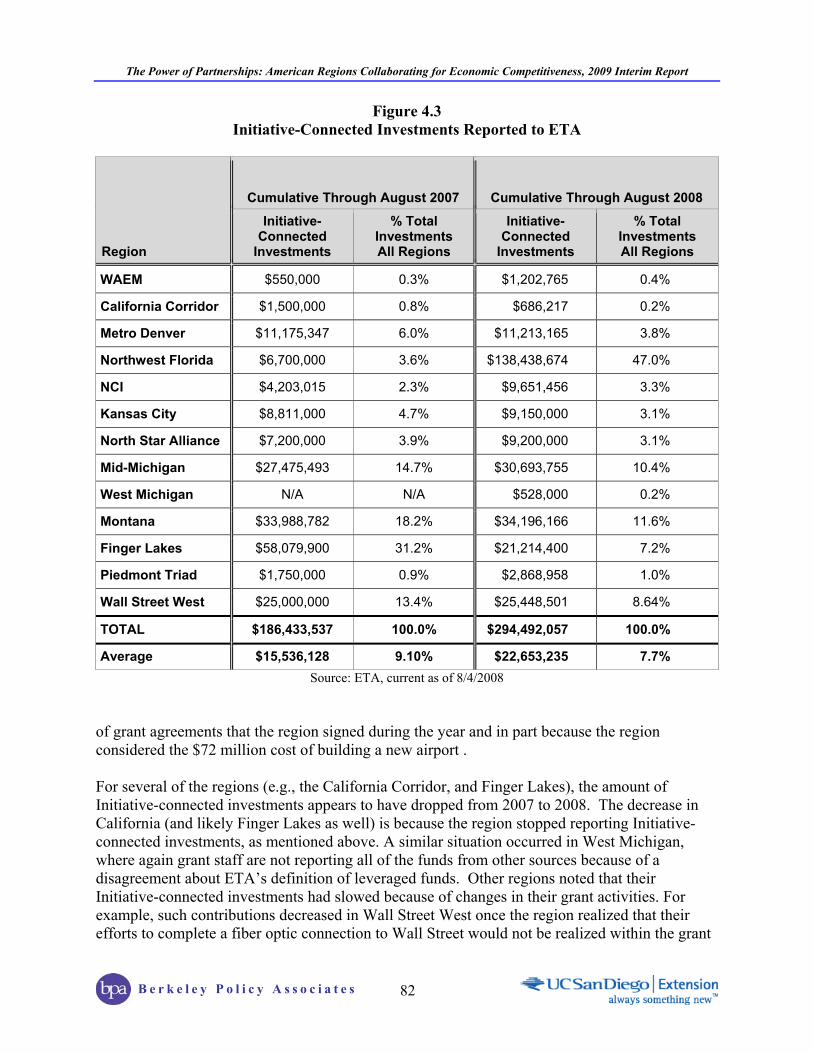
The Power of Partnerships: American Regions Collaborating for Economic Competitiveness, 2009 Interim Report
B e r k e l e y P o l i c y A s s o c i a t e s
82
Figure 4.3 Initiative-Connected Investments Reported to ETA
Cumulative Through August 2007 Cumulative Through August 2008
Region
Initiative-Connected
Investments
% Total Investments All Regions
Initiative-Connected
Investments
% Total Investments All Regions
WAEM $550,000 0.3% $1,202,765 0.4%
California Corridor $1,500,000 0.8% $686,217 0.2%
Metro Denver $11,175,347 6.0% $11,213,165 3.8%
Northwest Florida $6,700,000 3.6% $138,438,674 47.0%
NCI $4,203,015 2.3% $9,651,456 3.3%
Kansas City $8,811,000 4.7% $9,150,000 3.1%
North Star Alliance $7,200,000 3.9% $9,200,000 3.1%
Mid-Michigan $27,475,493 14.7% $30,693,755 10.4%
West Michigan N/A N/A $528,000 0.2%
Montana $33,988,782 18.2% $34,196,166 11.6%
Finger Lakes $58,079,900 31.2% $21,214,400 7.2%
Piedmont Triad $1,750,000 0.9% $2,868,958 1.0%
Wall Street West $25,000,000 13.4% $25,448,501 8.64%
TOTAL $186,433,537 100.0% $294,492,057 100.0%
Average $15,536,128 9.10% $22,653,235 7.7% Source: ETA, current as of 8/4/2008
of grant agreements that the region signed during the year and in part because the region considered the $72 million cost of building a new airport . For several of the regions (e.g., the California Corridor, and Finger Lakes), the amount of Initiative-connected investments appears to have dropped from 2007 to 2008. The decrease in California (and likely Finger Lakes as well) is because the region stopped reporting Initiative-connected investments, as mentioned above. A similar situation occurred in West Michigan, where again grant staff are not reporting all of the funds from other sources because of a disagreement about ETA’s definition of leveraged funds. Other regions noted that their Initiative-connected investments had slowed because of changes in their grant activities. For example, such contributions decreased in Wall Street West once the region realized that their efforts to complete a fiber optic connection to Wall Street would not be realized within the grant
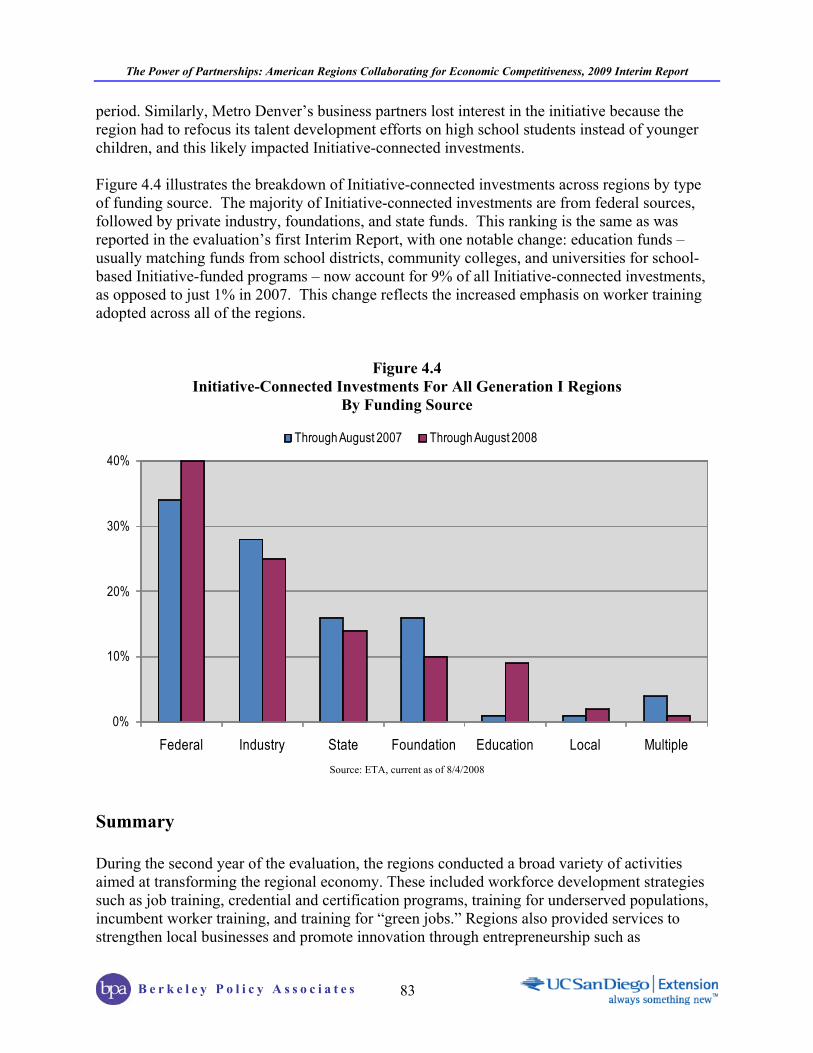
The Power of Partnerships: American Regions Collaborating for Economic Competitiveness, 2009 Interim Report
B e r k e l e y P o l i c y A s s o c i a t e s
83
period. Similarly, Metro Denver’s business partners lost interest in the initiative because the region had to refocus its talent development efforts on high school students instead of younger children, and this likely impacted Initiative-connected investments. Figure 4.4 illustrates the breakdown of Initiative-connected investments across regions by type of funding source. The majority of Initiative-connected investments are from federal sources, followed by private industry, foundations, and state funds. This ranking is the same as was reported in the evaluation’s first Interim Report, with one notable change: education funds – usually matching funds from school districts, community colleges, and universities for school-based Initiative-funded programs – now account for 9% of all Initiative-connected investments, as opposed to just 1% in 2007. This change reflects the increased emphasis on worker training adopted across all of the regions.
Figure 4.4 Initiative-Connected Investments For All Generation I Regions
By Funding Source
0%
10%
20%
30%
40%
Federal Industry State Foundation Education Local Multiple
Through August 2007 Through August 2008
Source: ETA, current as of 8/4/2008
Summary During the second year of the evaluation, the regions conducted a broad variety of activities aimed at transforming the regional economy. These included workforce development strategies such as job training, credential and certification programs, training for underserved populations, incumbent worker training, and training for “green jobs.” Regions also provided services to strengthen local businesses and promote innovation through entrepreneurship such as
The Power of Partnerships: American Regions Collaborating for Economic Competitiveness, 2009 Interim Report
B e r k e l e y P o l i c y A s s o c i a t e s
84
entrepreneur training and technical assistance, business incubators, assistance for rural businesses, youth entrepreneurship training, cluster initiatives, small business assistance, and help in accessing investment capital. Finally, the regions used talent development strategies such as STEM programs for youth in high school, career awareness programs, and postsecondary programs. While the regions were implementing these strategies, they were also strove to adjust their program activities and funding distributions to conform to the newly clarified H-1B funding restrictions. Similarly, ETA did not immediately make clear the measures that would be used to gauge progress in the regions, and the regions have thus also struggled to fit the progress they have made into the metrics. Metrics will be discussed in the next chapter, along with other measures of progress in the regions.

The Power of Partnerships: American Regions Collaborating for Economic Competitiveness, 2009 Interim Report
B e r k e l e y P o l i c y A s s o c i a t e s
85
Chapter 5: Progress Reported by Generation I Regions Given the breadth of the regions’ goals and activities, the grantees discuss many kinds of progress in their quarterly reports to ETA. Some of the types of progress are described in other chapters of this report, for example, building partnerships and organizational collaboration, and implementing activities in support of the transformation of their local economies. This chapter first describes the Initiative Accountability Framework and the quantitative measures that ETA is using to assess the outcomes of the regions; it then turns to qualitative measures for several specific types of changes within the regions. These include: 1) innovation; 2) progress toward regionalism; and 3) the sustainability of the initiative’s efforts within the region after the end of the grant period.
Initiative and Regional Metrics ETA developed the Initiative’s Accountability Framework14 early in 2007 to provide guidance to regions on how to approach the process of measuring their success. The goal of the framework is to ensure that the grantees systematically capture their initiative’s results and outcomes – both quantitative and qualitative – as well as any information that will help demonstrate their achievements and the value of their regional strategies to stakeholders. The three components of the Framework are:
1. The ETA Common Measures;
2. Initiative and region-specific metrics; and
3. The Initiative evaluation effort, of which this report is a part.
This section discusses the first two Framework components. Common Measures The Common Measures were designed to provide a singular definition for key outcomes measures for over 40 federally funded employment programs. The value of these measures is their ability to describe each region’s achievement of the core purposes of federal workforce investments, i.e., how many people find jobs, whether they remain employed, and how much they earn. The Common Measures serve as outcome metrics for the regions’ talent development goals. ETA acknowledged that the common measures are the conclusion of the “regional transformation success story” and not the beginning, nevertheless looking at these metrics is important because they allow for comparability across programs, which is why ETA uses them when monitoring all of its grants. 14 DeRocco, Emily. “WIRED Performance Reporting – Implementing Your Regional Accountability Framework (Generation I and II Grantees),” Memorandum to WIRED Regions, April 27, 2007.
The Power of Partnerships: American Regions Collaborating for Economic Competitiveness, 2009 Interim Report
B e r k e l e y P o l i c y A s s o c i a t e s
86
Three measures apply to programs serving adults and three measures apply to programs serving youth. The adult measures include:
Entered employment;
Employment retention; and
Average earnings.
The youth measures include:
Placement in employment or education;
Attainment of a degree or certificate; and
Literacy and numeracy gains. Unfortunately, very few of the regions even included the Common Measures in their quarterly metrics templates, and only one initiative (Piedmont Triad) reported its performance on these measures in its December 2008 quarterly report.15 Several factors may contribute to this lack of data. First, calculating the Common Measures requires the initiative and/or its partners to collect Social Security Numbers (SSNs) from participants in order for the local or state workforce agency to access Unemployment Insurance (UI) wage records for the data needed to calculate the measures. This often is an issue with service providers who have concerns about the confidentiality of their participants’ personal information. Second, because employers may submit wage records up to three months after the end of a quarter, a significant time lag is usually involved in accessing the UI wage records. Several of the regions noted that this was the reason that they had not provided data on the Common Measures in their December 2008 quarterly reports. Third, whether a state or local workforce agency is assisting the initiative in accessing the needed data, special arrangements will need to be made. Many state workforce agencies calculate the Common Measures only for the state as a whole. Similarly, local WIBs may calculate these metrics for their local workforce area, but most of the Generation I initiatives have a footprint that is larger than the geographic area for which a single WIB is responsible. In either case, calculating the Common Measures for the region is a separate step from what the workforce agency usually does. Finally, the Common Measures were not designed to adequately capture information on the Initiative’s networking strategies, or about two of the major activities of many regions – training for incumbent workers and for entrepreneurs. Since their primary metric is entering employment and incumbent workers are already employed, the Common Measures are an inaccurate tool for assessing this type of training. Similarly, they were not designed to reflect on the adequacy of 15 The North Star Alliance provided data on wages, but because many participants were incumbent workers, the region did not calculate placement and retention rates. Wall Street West referenced a separate Common Measures report, which the evaluation team has not been able to obtain yet. Hopefully, we will have this data before this Interim Report is finalized.
The Power of Partnerships: American Regions Collaborating for Economic Competitiveness, 2009 Interim Report
B e r k e l e y P o l i c y A s s o c i a t e s
87
entrepreneurship training. Many entrepreneurs start out as self-employed, and thus their wage information would not be included in the UI wage records. As the regions approach the end of their grant, the data needed to calculate the Common Measures for their early years should become available. The evaluation team looks forward to discovering whether more of the initiatives are able to provide information about these metrics in their quarterly reports for December 2009. Initiative Metrics The Accountability Framework presented a set of performance measures for the grantees to use in their quarterly reporting. ETA provided an “Addendum” to its regular grantee quarterly reporting format specifically for the Initiative grants. This spreadsheet provides a template for the grantee to report on the Initiative metrics, which are organized into three categories – education and training, capacity-building, and economic indicators. Each category includes a number of metrics to be completed by all regions. The metrics template also includes space within each of the three categories for regions to identify their own measures of progress. Site visit respondents made several observations about the metrics and the process by which they were rolled out; they suggest that both the metrics themselves and related communications have affected the consistency and quality of the data that the regions are able to provide. For example:
First, ETA suggested that the grantees use the metrics presented in the Accountability Framework, but did not require that the regions use these measures.
Second, the metrics were introduced a year after the grants started, and many regions thought that the metrics did not address the type of work they were doing at all.
Third, ETA encouraged the regions to define and adopt region-specific metrics to tell their story to complement information gathered via the suggested metric framework.
Each region uses additional measures to document their progress – usually the metrics drawn from their grant proposals and implementation plans. The remainder of this section discusses the three categories of metrics, and the data that grantees provided through December 2008. Education/Training Measures Data items in this category include: the number of individuals starting and completing workforce education and training programs using Initiative funds; the number attaining degrees, certificates, or industry certified credentials as a result of workforce education/training using WIRED funds; the number of individuals with Initiative-funded education or training who were placed into target industry employment; and the region’s total investment in incumbent worker training. Figure 5.1 shows the results that the regions reported for these measures in their December 31, 2008 quarterly metrics reports. Across all of the regions, the total number of individuals to begin education and/or training courses using grant funds was 31,499. Of those who started education/training courses, 19,104 (61%) had completed training by the end of 2008. A total of 4,473 graduates of training funded

The Power of Partnerships: American Regions Collaborating for Economic Competitiveness, 2009 Interim Report
B e r k e l e y P o l i c y A s s o c i a t e s
88
Figure 5.1 Progress on Initiative Metrics by Region: Education and Training,
Cumulative Through December 2008
# Began
education/ training using Initiative funds
# Completing education
/training using Initiative funds
# Attained degree,
certificate, or credential using Initiative funds
# Trained & entered jobs in target industry
Total $ invested
incumbent worker training Region Total
% of Target Total
% of Target Total
% of Target Total % of Target
WAEM 939 19% 132 5% 3,985 73% N/A N/A $4.10 million
California Corridor 1,687 125% 692 69% 63 119% 561 68% 016
Metro Denver 832 35% 475 23% 429 29% 146 10% N/A
Northwest Florida17 N/A N/A N/A N/A N/A N/A N/A N/A N/A
NCI 13,641 156% 6,594 108% 1,044 151% 3,130 125% N/A
Kansas City18 1,207 123% 1128 115% 6,424 N/A 95 N/A N/A
North Star Alliance 1,028 66% 256 16% 648 56% 170 15% $1.68 million
Mid-Michigan19 3,662 177% 3,363 159% 2,841 222% 28 13% $120,000
West Michigan 110 32% 110 32% 24,094 48% 0 N/A N/A
Montana20 1,984 N/A 1,476 N/A 912 N/A 593 N/A $2.41 million
Finger Lakes 5,629 80% 4,106 59% 2,975 85% N/A N/A $9.2 million
Piedmont Triad21 80 N/A 16 3% 26822 60% N/A N/A N/A
Wall Street West 700 47% 756 N/A 482 N/A 20 N/A N/A
Total 31,499 -- 19,104 -- 43,897 -- 4,743 -- $17.51 million
16 The definition of total investment in incumbent training is disputed in the California Corridor, and the region’s quarterly metrics report shows the amount as 0.
17 Northwest Florida does not report data ETA metrics table, and the figures detailed in the quarterly narrative report could not be translated into this format.
18 Kansas City metrics were calculated by adding up sections of the region’s narrative report; the figures are likely to underestimate the actual totals. Kansas City’s goals for certifications and entered employment were not available.
19 Mid-Michigan metrics were calculated by adding up the figures from the region’s quarterly metrics report and may underestimate the actual totals.
19 Goals for Montana metrics were not available. 20 Goals for Piedmont Triad metrics were not available. 21 Piedmont Triad has a Work Keys program, which explains the high figure compared to the number who began education/training
using WIRED funds.
The Power of Partnerships: American Regions Collaborating for Economic Competitiveness, 2009 Interim Report
B e r k e l e y P o l i c y A s s o c i a t e s
89
by the Initiative had gone on to be employed within a targeted industry, or 25% of those who completed training. The figure also shows that 43,897 individuals attained a degree, certificate, or credential via training funded by the Initiative. The last column in Figure 5.1 presents the available data on the funds that the grantees invested in incumbent worker training. Overall, the regions reported spending $17.5 million in training their partner’s employees. For example, through the end of 2008, Finger Lakes spent $9.2 million training employed workers, and WAEM spent $4.1 million. These numbers are likely to underestimate the influence of grant-funded training for several reasons. First, as Figure 5.1 illustrates, not all of the regions used (or reported) the ETA metrics, and some of the initiatives that did use them did not use all of the measures. Second, several regions provided relevant data about participants in a level of detail that was useful for internal tracking purposes but not for evaluation purposes. Others reported their metrics in only their quarterly report narratives. The evaluation team had to compile data for each measure from both of these types of reporting, which introduced the possibility that staff missed some data. Third, inconsistencies exist in the data in that some regions did not appear to include participants who were involved in degree, credential, or certificate programs in their count of trainees who enrolled and completed training. Finally, the numbers in Figure 5.1 do not take into account the substantial amount of incumbent worker training that the regions provided. For example, Montana contracted with the state’s Department of Commerce to identify and meet employers’ needs for worker training. In-house trainers provided most of this incumbent worker training, and to minimize the burden on employers, the Department of Commerce did not require the businesses to provide data on these trainees. The number of individuals who entered training varied widely across the regions, from over 13,000 enrolled in NCI-funded training, to 80 in the Piedmont Triad West Michigan. Many of the regions had stated their goals for the number of individuals that their initiatives would train in their Implementation Plans, and Figure 5.1 also presents the proportion of their goals that the number enrolled represented. While WAEM had only enrolled 19% of their training goal, several regions – including the California Corridor, NCI, Kansas City, and Mid-Michigan – had already achieved more than 100% of their targets Similar patterns held for the other measures included in the figure. Again, not all of the grantees had specified a target number for the employment and training measures because the initial emphasis of their implementation plans was on building collaborative relationships with partner organizations. As a result, quite a bit of data are missing on the degree to which the regions met their targets related to employment and training. In addition to the suggested metrics, many of the regions added their own employment and training measures that reflected the specific activities in their local areas. Some of these included the number of: incumbent workers trained; participants co-enrolled in WIA; participants retained in employment for six months; low income/minority participants to complete the program; youth introduced to target industries; and internships begun and completed.
The Power of Partnerships: American Regions Collaborating for Economic Competitiveness, 2009 Interim Report
B e r k e l e y P o l i c y A s s o c i a t e s
90
Capacity-Building Measures These measures focus on the degree to which the initiatives increase the capacity of their partner organizations to improve the skills of the region’s workforce. The measures that ETA suggested to capture this growth include:
Number of educators prepared for instruction in identified industries, along with the projected number of additional students that will be trained annually as a result;
New curriculum developed, and the projected number of additional students to be trained annually as a result;
Work-based strategies developed or implemented (clinical experiences, internships, etc.), and the number of additional students projected to be trained annually as a result;
Career guidance strategies developed or implemented; and
Instructional equipment purchased with grant funds, the and projected number of additional students to be trained annually as a result.
As Figure 5.2 illustrates, only one region (NCI) provided data for all of these measures in its December 2008 quarterly report, and another (Metro Denver) reported on all the metrics but one. On the other hand, four regions reported no data for any of these metrics. The rest of the grantees provided data for some measures but not others. The grantees were most consistent in reporting on the number of educators prepared for instruction in identified industries, the number of new curricula developed, and the number of students projected to be trained as a result of these two activities. The regions that provided data trained a total of 5,429 educators, and estimated that these instructors would in turn train 88,146 students per year. The initiatives developed 207 new curricula, which they projected would be used to train 6,278 students. Again, for most of the reasons cited above, these results are likely to underestimate the influence of grant-funded activities and should be considered cautiously. Data availability is spotty for the rest of capacity-building metrics. One challenge may be that ETA did not define such services as “work-based strategies (clinical experiences, internships, etc.),” and “career guidance strategies,” or clarify what might be included in instructional equipment. The information in Figure 5.2 about the purchase of instructional equipment seems to support this theory since in reporting on this measure, some regions provided the amount of funds they had spent on equipment, others indicated the number of pieces of equipment they had purchased, and yet another merely indicated that they had bought some without further detail. The regions again tailored their quarterly reporting templates to include a substantial number of additional capacity-building activities, for example:
California Corridor detailed 82 measures in 15 separate projects. The measures include a metric to track the number of supplier network transformation surveys completed, the incorporation of 150 innovation asset profiles into the California Corridor Connectory portal, and a minimum of ten new WIB partnerships supporting entrepreneurship.
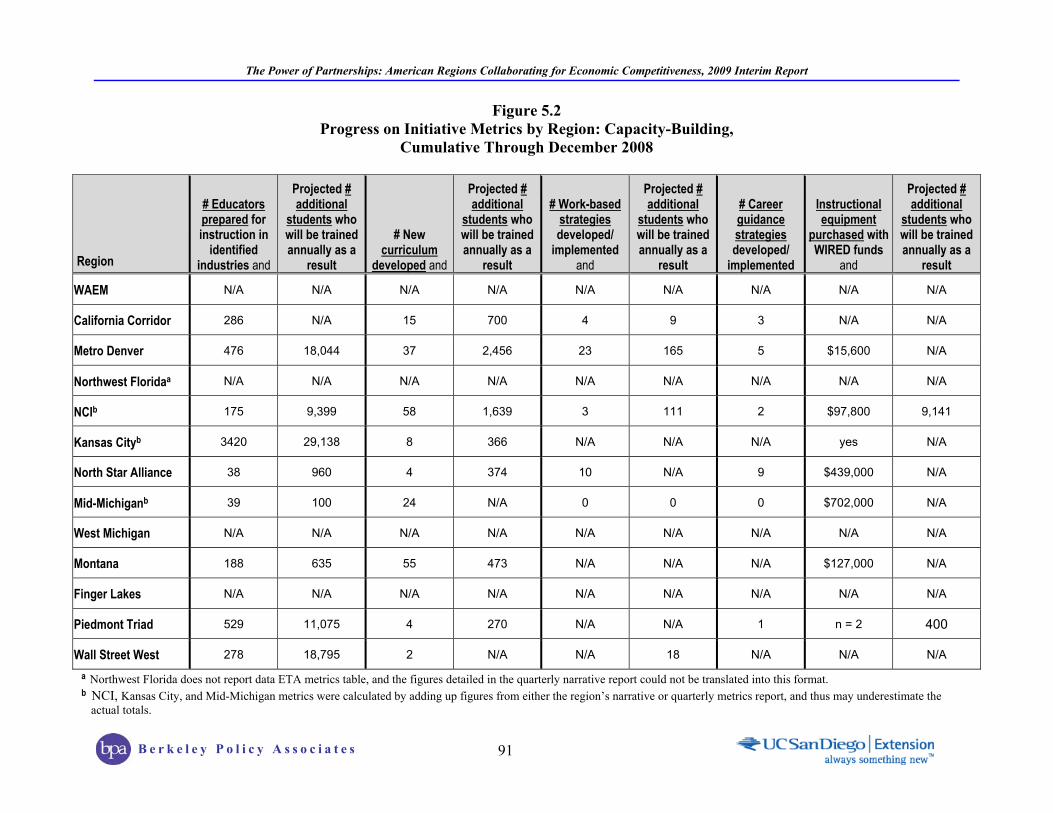
The Power of Partnerships: American Regions Collaborating for Economic Competitiveness, 2009 Interim Report
B e r k e l e y P o l i c y A s s o c i a t e s
91
Figure 5.2 Progress on Initiative Metrics by Region: Capacity-Building,
Cumulative Through December 2008
Region
# Educators prepared for instruction in
identified industries and
Projected # additional
students who will be trained annually as a
result
# New curriculum
developed and
Projected # additional
students who will be trained annually as a
result
# Work-based strategies developed/
implemented and
Projected # additional
students who will be trained annually as a
result
# Career guidance strategies developed/
implemented
Instructional equipment
purchased with WIRED funds
and
Projected # additional
students who will be trained annually as a
result
WAEM N/A N/A N/A N/A N/A N/A N/A N/A N/A
California Corridor 286 N/A 15 700 4 9 3 N/A N/A
Metro Denver 476 18,044 37 2,456 23 165 5 $15,600 N/A
Northwest Floridaa N/A N/A N/A N/A N/A N/A N/A N/A N/A
NCIb 175 9,399 58 1,639 3 111 2 $97,800 9,141
Kansas Cityb 3420 29,138 8 366 N/A N/A N/A yes N/A
North Star Alliance 38 960 4 374 10 N/A 9 $439,000 N/A
Mid-Michiganb 39 100 24 N/A 0 0 0 $702,000 N/A
West Michigan N/A N/A N/A N/A N/A N/A N/A N/A N/A
Montana 188 635 55 473 N/A N/A N/A $127,000 N/A
Finger Lakes N/A N/A N/A N/A N/A N/A N/A N/A N/A
Piedmont Triad 529 11,075 4 270 N/A N/A 1 n = 2 400
Wall Street West 278 18,795 2 N/A N/A 18 N/A N/A N/A a Northwest Florida does not report data ETA metrics table, and the figures detailed in the quarterly narrative report could not be translated into this format. b NCI, Kansas City, and Mid-Michigan metrics were calculated by adding up figures from either the region’s narrative or quarterly metrics report, and thus may underestimate the
actual totals.
The Power of Partnerships: American Regions Collaborating for Economic Competitiveness, 2009 Interim Report
B e r k e l e y P o l i c y A s s o c i a t e s
92
Montana included several unique metrics, including a measure to track the creation of a centralized information clearinghouse, including networking contacts, oil seed production information, biodiesel production information, and Montana industry news. Another metric is a career pathway map that identifies all related job opportunities.
Finger Lakes used a number of region-specific capacity-building metrics, including one to develop a specialized cadre of technology “business starters” and another to double business plan participation compared to the number of applicants for the region’s 2005 contest.
NCI ‘s quarterly metrics reporting template consists of four workbook pages in an Excel spreadsheet. One page summarizes the key employment and training measures discussed above, while the others include over 300 measures detailing the implementation of business innovation, talent development, civic leadership, and entrepreneurship strategies.
Because the capacity building measures were so unique to each region, compiling them across regions is virtually impossible. Economic Indicators ETA proposed that the regions report annually on a diverse assortment of measures that could reflect changes in the economic status of their local areas. In addition to the Common Measures, indicators in this group include:
Number of new jobs created by occupation/industry;
Average wage by industry;
Unemployment rate;
High school dropout rate;
Retention rates in all public education institutions;
Number of completers (received degree or certificate) in all public education institutions by industry;
Academic achievement in K-12 based on No Child Left Behind test scores;
Number of new business startups or expansions;
New seed and venture capital investments;
Government investments; and
Patents.
Half of the regions provided no data for any of these measures and did not add measures more directly related to their efforts of their specific initiatives. For this reason the data for individual regions is not included in this report. On the other hand, the other half of the regions provided at least some information on the economic indicators, and five initiatives added individualized economic indicators. For example:
Wall Street West includes the number of data center operators/site selectors/developers/ financiers.
Montana reports on the creation of a private equity investment group, the number of acres in oilcrop production, and business and job growth in the Tribal nations.
The Power of Partnerships: American Regions Collaborating for Economic Competitiveness, 2009 Interim Report
B e r k e l e y P o l i c y A s s o c i a t e s
93
As mentioned above, summarizing measures of progress across regions is difficult if not impossible because of the degree to which the regions tailored their metrics to their initiative’s implementation plan. The remainder of this chapter discusses important qualitative measures of progress. The next section explores the achievements of the Generation I regions related to innovation, followed by sections on regionalism and sustainability.
Innovation Transformation Innovation is about change – change in practices, processes, and products used by people and communities to solve problems, deliver services, improve productivity, achieve efficiencies and, ultimately, transform practice. By 2009, the world has become a global innovation economy. Whereas the old globalism focused on choosing locations based on low-cost land and labor to produce high volume products, the new globalism focuses on finding places with innovation networks and commercialization capacity to support high-value innovation-based activities. Innovation is about creating and developing new economic assets in a marketplace. In short, innovation is the predominant focus of these transformative efforts. In the context of the Initiative, innovation is first and foremost about changes in regional workforce and economic development strategies and practices. Stimulating innovative, collaborative initiatives to integrate high value-added strategies for business development and for workforce education and training can enhance economic growth. Such initiatives typically include creative approaches to engage new partners and funding sources that ensure sustainability. From this perspective, innovation describes originality in the things people make, what people do, and how they do it. In the most expansive sense, innovation can characterize significant attitudinal and behavioral changes in a region – in other words, the way people think and the manner in which people act. In this report, the evaluation team used these many interpretations of innovation in analyzing the products, services, ideas, and actions of the regions. The regions sought to enable transformative innovation in several different ways: support for innovative technological developments and business start-ups; new programmatic models; and social and organizational innovations. Technological innovation involves new or improved products and processes that generate revenue or reduce costs in traditional industries, or that represent technologies on which entrepreneurial start-ups can be built. With regard to programmatic innovation, all of the regions have been thinking outside of the box in designing and supporting their programs. Their approach has led to a variety of creative programs and strategies in regional cooperation, workforce development, STEM education, support for entrepreneurship, and other areas of concern to the regions. Importantly, the regions demonstrate innovation not only in the way the central partners in each region do their own work, but also in the way they encourage innovation in other actors at the edges of the network, for example, secondary school teachers, the state WIB, One-Stop case managers, businesses, and others.

The Power of Partnerships: American Regions Collaborating for Economic Competitiveness, 2009 Interim Report
B e r k e l e y P o l i c y A s s o c i a t e s
94
Diverse Examples of Innovation from Regions Below are some examples of the many ways in which innovation appears in the regions. Innovation in WAEM. A key feature of WAEM's advanced manufacturing training and the Modern Multi-skill Manufacturing (M3) credential is the adoption of an innovative online training delivery system, an “anytime, anywhere training system.” Amatrol, an internationally recognized provider of learning systems for technical education, offers a wide variety of manufacturing training modules based on national skill standards. Administered by the WAEM Alliance, training and assessment for the M3 is organized around a series of Amatrol’s virtual training laboratory modules. As an Internet-based system, the system allows workers to prepare for the M3 assessments at any location with broadband access – home, school, libraries, or the labs established at the WAEM colleges and allied high schools. Importantly, the online training modules may also be used for upgrade and individual skills training at an employer's worksite. The M3 credential is available to incumbent workers, dislocated workers, underemployed workers, and students seeking to certify their skills, whether or not they have taken Amatrol courses. Innovation in the California Corridor. California Innovation Corridor’s focus is not merely on increasing economic activity, it is on encouraging an innovation economy that creates an innovation infrastructure – an environment that fosters innovation, entrepreneurship, commercialization, and high value products and services that provide jobs with high productivity and that support a higher standard of living. The California Corridor has three goals:
Innovation Support – Create new companies and high-skill, high-wage jobs by designing a replicable and sustainable “innovation support architecture” to increase innovation and entrepreneurship. To this end, the region developed a Regional Innovation Economic Model, an inventory of “innovation assets,” that is, the identification of best practices in technology transfer and commercialization, profiles of workforce skills needed for 21st century jobs, and a WIB toolkit describing the intermediary role workforce investment boards can play in supporting entrepreneurial companies.
Industrial Rejuvenation – Improve the international competitiveness of the region’s supply chain by developing and executing a “Smart Supplier Strategy” that supports manufacturers, small businesses, and entrepreneurs in adapting to global manufacturing transformation.
Talent Development – Accelerate development of a highly skilled 21st century talent pool by creating pilot projects and activities to support a continuum of math, science, and engineering education (K-U), and lifelong learning relevant to the 21st century worker.
Innovation in Metro Denver. Several respondents in Metro Denver claimed that the initiative has caused a “buzz” about the regional economy, the targeted industries, and talent development in state and local policy circles, and noted that the goal of regional economic transformation has resulted in increased alignment of educational policy with workforce and economic development in Colorado. Recently, the state legislature increased general funds to support cluster-based economic development mirroring the Metro Denver efforts. The workforce system and education taken a broader view than in the past, are forming partnerships, and are changing in their thinking and conversations.
The Power of Partnerships: American Regions Collaborating for Economic Competitiveness, 2009 Interim Report
B e r k e l e y P o l i c y A s s o c i a t e s
95
Innovation in Northwest Florida. At the time of the evaluation visit in late Fall 2008, Northwest Florida had just awarded six Workforce Innovation I Grants to the region’s WIBs to provide innovative workforce training, including one to a rural WIB that planned to use its grant to facilitate student participation in a robotics competition in order to expose them to career possibilities in STEM fields. The RFP for the Workforce Innovations II grants had just been released. In reviewing these proposals, Northwest Florida has engaged an academic research institution to determine whether and how each bid connects with the analyses of the industry data. Finally, the Green Circle Bio-Energy wood pellet plant in Jackson County, recipient of an Initiative-sponsored Employee Skills Training Grant, represents a successful and innovative use of the region’s natural resources (pine forest plantations), existing transportation and logistics industry clusters (roads, rail, and ports, in particular, the Port of Panama City, Florida), and advanced technology for the production of energy wood pellets for use as a coal substitute in power plants. Production has already begun at what is expected to become the largest wood pellet plant in the world. Innovation in NCI. Purdue University, a premier engineering and scientific research institution, leads the NCI region. This resource, coupled with Perdue’s mission of community engagement as a land grant university, has translated into partnerships between academic researchers and industry practitioners to turn theory into practice. The preeminent example of this is NCI’s Nanotechnology Transfer project. This project works with a pilot group of 14 advanced materials firms in which tool and die work is an integral part of operations. These firms are provided with a new nano-technology coating for the surfaces of their cutting tools, reducing wear and tear and waste, and increasing machinery productivity. Innovation in the North Star Alliance. In Coastal Maine, the Advanced Engineering and Wood Composites Center (AEWC) at the University of Maine, Orono, is a partner of the North Star Alliance in the R&D Pillar. The Center is developing the next generation of cost effective, high-performance, hybrid composite materials. The Center has developed products ranging from bridge girders and power plant exhaust system components to skateboards. Participating industries include a vast range of enterprises that either make up or support the marine trades, or those that utilize advanced composite materials such as boat building, marine/waterfront infrastructure, building products, sporting goods, ballistic armor, and more. The fact that an initiative on the scale of the North Star Alliance has a commitment to consensus decision-making is also innovative. Innovation in Mid-Michigan. An important partner of Mid-Michigan’s Center for Entrepreneurship and Commercialization at SVSU is the Mid-Michigan Innovation Center (MMIC), a business incubator and networking resource. SVSU held an “Inventions to Market Day” (I2M) in Spring 2008 in collaboration with partners that included the Mid-Michigan Inventors’ Group, a newly established nonprofit organization. At this conference, teams of SVSU MBA students competed to develop commercialization strategies for local inventors. In addition, Prima Civitas Foundation (PCF) awarded ten organizations with Entrepreneurs and Inventors Day grants. Innovation in West Michigan. One of the most innovative strategies in West Michigan is not an individual project but rather the region’s approach to funding innovations. WMSA uses an
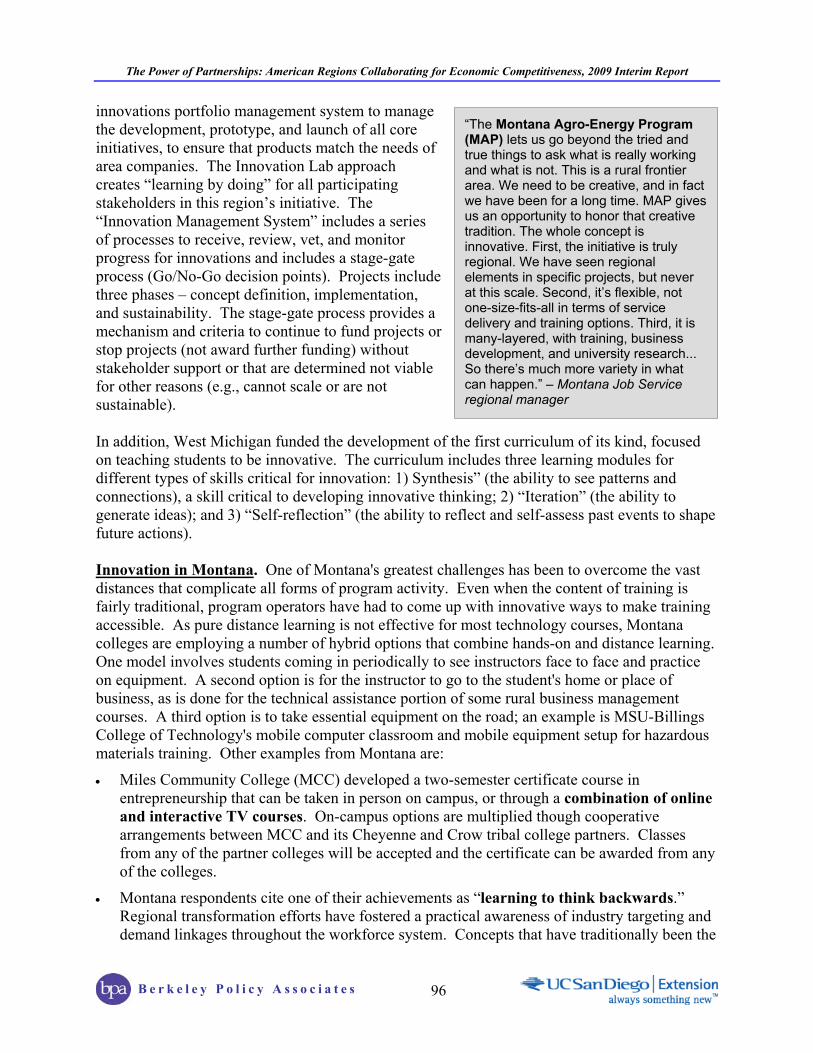
The Power of Partnerships: American Regions Collaborating for Economic Competitiveness, 2009 Interim Report
B e r k e l e y P o l i c y A s s o c i a t e s
96
innovations portfolio management system to manage the development, prototype, and launch of all core initiatives, to ensure that products match the needs of area companies. The Innovation Lab approach creates “learning by doing” for all participating stakeholders in this region’s initiative. The “Innovation Management System” includes a series of processes to receive, review, vet, and monitor progress for innovations and includes a stage-gate process (Go/No-Go decision points). Projects include three phases – concept definition, implementation, and sustainability. The stage-gate process provides a mechanism and criteria to continue to fund projects or stop projects (not award further funding) without stakeholder support or that are determined not viable for other reasons (e.g., cannot scale or are not sustainable). In addition, West Michigan funded the development of the first curriculum of its kind, focused on teaching students to be innovative. The curriculum includes three learning modules for different types of skills critical for innovation: 1) Synthesis” (the ability to see patterns and connections), a skill critical to developing innovative thinking; 2) “Iteration” (the ability to generate ideas); and 3) “Self-reflection” (the ability to reflect and self-assess past events to shape future actions). Innovation in Montana. One of Montana's greatest challenges has been to overcome the vast distances that complicate all forms of program activity. Even when the content of training is fairly traditional, program operators have had to come up with innovative ways to make training accessible. As pure distance learning is not effective for most technology courses, Montana colleges are employing a number of hybrid options that combine hands-on and distance learning. One model involves students coming in periodically to see instructors face to face and practice on equipment. A second option is for the instructor to go to the student's home or place of business, as is done for the technical assistance portion of some rural business management courses. A third option is to take essential equipment on the road; an example is MSU-Billings College of Technology's mobile computer classroom and mobile equipment setup for hazardous materials training. Other examples from Montana are:
Miles Community College (MCC) developed a two-semester certificate course in entrepreneurship that can be taken in person on campus, or through a combination of online and interactive TV courses. On-campus options are multiplied though cooperative arrangements between MCC and its Cheyenne and Crow tribal college partners. Classes from any of the partner colleges will be accepted and the certificate can be awarded from any of the colleges.
Montana respondents cite one of their achievements as “learning to think backwards.” Regional transformation efforts have fostered a practical awareness of industry targeting and demand linkages throughout the workforce system. Concepts that have traditionally been the
“The Montana Agro-Energy Program (MAP) lets us go beyond the tried and true things to ask what is really working and what is not. This is a rural frontier area. We need to be creative, and in fact we have been for a long time. MAP gives us an opportunity to honor that creative tradition. The whole concept is innovative. First, the initiative is truly regional. We have seen regional elements in specific projects, but never at this scale. Second, it’s flexible, not one-size-fits-all in terms of service delivery and training options. Third, it is many-layered, with training, business development, and university research... So there’s much more variety in what can happen.” – Montana Job Service regional manager
The Power of Partnerships: American Regions Collaborating for Economic Competitiveness, 2009 Interim Report
B e r k e l e y P o l i c y A s s o c i a t e s
97
province of specialists at the state level are being understood and put into practice at the branch office level. Local Job Service staff report that there is more “planning about what to do next” founded on a vision of the region's current and near-future industrial base. As one case manager put it, “Instead of just reacting, we are learning to think backwards. You start with the industrial base, trace the demand links between industries, and translate that demand into occupations. As the base shifts, new occupations come over the horizon. It's very powerful.”
Innovation in the Piedmont Triad. One of the key successes that emerged during the evaluation’s second visit to the Piedmont Triad was the involvement of the private sector and the initiative’s ability to ascertain what the private sector wants and needs to create economic transformation. Private companies are heavily represented on the region’s cluster roundtables and many representatives are high-ranking CEOs with limited free time. Grantee staff believe that the willingness of busy people to continue attending these meetings indicates just how valuable they perceive these efforts to be. One of the most striking successes in bringing together private companies is the logistics and distribution roundtable. This roundtable includes companies who ordinarily are in fierce competition and would not work together, but they are now willing to collaborate so that they can have the competitive advantage of being involved in this effort early on. Supporting and Using Business Incubators Finally, business incubators are geared specifically for start-up companies and firms in the nascent stages of their development. Many of the regions have business incubators affiliated with or subsidized by this Initiative. For example:
Kansas City leveraged a small investment of $30,000 into a $3 million dollar federal grant to operate a Regional Technology Transfer Network biotech business incubator with wet lab facilities located on the Kansas University Medical Center Campus.
As Chapter 3 describes, Finger Lakes has developed a highly complementary and integrative network of incubators and research parks across the entire region which enables each to serve particular business development challenges and encourages referrals and resource sharing.
In Mid-Michigan, the opportunity arose to take over a research and production facility that Pfizer, Inc. had closed down in the city of Holland. The MMIT received approval from ETA to shift $500,000 of the funds allocated to Michigan State University for training to “re-purpose” the Pfizer facility into an R&D and educational facility centered on the bioeconomy.
From its inception, the Initiative was conceived to be more than a series of job training programs. ETA leadership recognized that the existing workforce culture includes many attitudes and behaviors that need to be changed. At the core of the Initiative has been a commitment to transformation in the workforce system so that it will be better suited to the challenges of the 21st century economy. Fundamental to this type of transformation is how policy-makers, program managers, and citizens think about the alignment of talent and economic development at the regional level. Also fundamental is a focus on economic and workforce strategies that address the full range of existing and emerging industries and skill sets essential to regional

The Power of Partnerships: American Regions Collaborating for Economic Competitiveness, 2009 Interim Report
B e r k e l e y P o l i c y A s s o c i a t e s
98
prosperity. Ultimately, the regions are seeking tangible change in the way the U.S. develops the human capital so critical to global economic competitiveness.
Progress Toward Regionalism in the Generation I Regions One of the major challenges facing the regions from the beginning of their grants was building a regional identity: an awareness of the region as a cohesive economic unit and a willingness to prioritize regional issues and goals. When the Initiative began, only a few of the regions actually had pre-existing structures for planning and making decisions as a region. For most grantees, implementation of the principals of regional economic collaboration and transformation required creating new alliances among agencies, organizations, and companies that had previously operated in isolation – if not in competition – with each other. They considered the city, county, or state as the relevant geographical context in which to make decisions that would influence economic and social well being. At the time of the 2007 evaluation visits, several regions were working hard – in some cases struggling – to create a regional identity that would be widely accepted among stakeholders. The extent of regionalism in Generation I regions grew between the 2007 and 2008 site visits, as discussed in this section. The majority of partners and stakeholders in these regions now recognize the interdependencies and opportunities that make worthwhile the considerable effort required to work together on regional priorities. The concept of regionalism as used by social scientists is, first and foremost, an economic construct. It describes the economic interdependencies and synergies that characterize clusters of industrial or business activity in a particular geographical area. A particular supply chain may be the unit that defines a region – for example a core industry, such as automobile manufacturing, along with the companies that make and repair parts, as well as the caterers and accountants that serve them. A region may be an extended labor market, defined by commuting patterns in a metropolitan area. It may be a group of counties defined by the state as an economic development region, in which leaders have realized economies of scale by learning to work together across city and county lines. Many argue that the advent of global markets, outsourcing, and the existence of the Internet make the discussion of geographically defined regions irrelevant. Economic and sociological data suggest that this is not the case. Experience has shown that most innovations still come about through face-to-face interactions among highly skilled individuals with diverse knowledge and interests. The importance of “place” is a reflection of the importance of people, their skills, and their ability to collaborate. Increasingly, these highly interdependent and synergistic clusters of producers, suppliers, and labor are not limited to a narrowly defined geography such as a city or county – they are often spread across multiple jurisdictional and geographic locales. Central Michigan is a dramatic example: assembly plants in Flint and Lansing purchase components from a web of close to 200 suppliers distributed across multiple counties. Both the manufacturers and their suppliers draw on a labor pool made up of people who commute to work from farms and small towns. This ecology of economic activity can be identified empirically and, in many of the regions, was the factor that defined the region’s geographic boundaries.
The Power of Partnerships: American Regions Collaborating for Economic Competitiveness, 2009 Interim Report
B e r k e l e y P o l i c y A s s o c i a t e s
99
Some regions are not defined so much by geography as by a set of parallel, but not necessarily interdependent, economic activities and needs. The California Corridor provides a strong example of this phenomenon; its rationale as a region has to do with the commonalities within the aerospace industry, and the knowledge and competencies needed from both its workers and its suppliers. Spread across more than 400 miles, the California Corridor is a collection of sub-regional clusters that share common characteristics. Thus, they have learned together and developed parallel, though not tightly interconnected, strategies for industry growth and workforce development. California Corridor is often referred to as a "mega-region" because of its size and complexity, and because of the loosely related but similar character of its economic and workforce activities. Recognizing the differences (and often the rivalries) among different areas within the region, this initiative’s leaders did not focus significant effort on developing a unified regional identity for the Corridor. Instead they promoted cross-fertilization across different sub-regions within the Corridor. Numerous site visit respondents noted – and some were surprised to discover – how much they had learned though their involvement in collaborative activities, and the extent to which their own organizations had benefitted from that collaboration. Nearly all regions have made significant progress between 2007 and 2008 in their “journey” toward regionalism. Examples include:
Site visitors report that in Kansas City, regionalism – while not yet universal – has increased over the past year. Higher education institutions have become more collaborative in their non-Initiative ventures due in part to the relationships they developed through the initiative. Workforce partners in the metropolitan area have learned to “speak the same language” and have worked together to create “a common customer experience for both job seekers and employers.” While some of their traditional rivalries remain, these are decreasingly a barrier to collaboration.
In West Michigan, collaborative relationships that began under the initiative have benefited environment efforts in the region that were not funded by the grant. The Green Jobs Regional Skills Alliance will prepare West Michigan workers for jobs in the burgeoning alternative energy industry. The Clean Cities Coalition is another regional effort to expand local markets for alternative transportation fuels, refueling sites, and clean vehicle technologies. The Coalition also supports the development of alternative fuel corridor along the I-96 highway in West Michigan. The corridor will include both alternative fuel infrastructure and truck stops with idle reduction technologies
The area covered by NCI had never been considered as an integrated regional unit prior to these collaborative efforts. Recent developments have shown their willingness to think regionally, however. The two metropolitan areas in the region, traditionally competitive, have supported each other’s efforts to retain the talent base in the region during a period of layoffs.
When asked in 2007 about the prospects for regional transformation, respondents in the Piedmont Triad appeared not to believe such a thing was possible, nor even to know what transformation would look like. “We’re working on transition,” one said; “we’ll have to wait and see about transformation.” Asked the same question in 2008, another respondent was
The Power of Partnerships: American Regions Collaborating for Economic Competitiveness, 2009 Interim Report
B e r k e l e y P o l i c y A s s o c i a t e s
100
able to visualize successful transformation as “putting the region back in competition with Charlotte and the Research Triangle – if the region transforms economically, kids will realize that they can stay here and get a good education and a good job.”
One of the most dramatic examples of growing regionalism is in the Finger Lakes region. In 2007, site visitors observed real tensions as members of the Governing Board debated whether the region should be branded as “Greater Rochester” or “Finger Lakes.” Representatives of rural counties reported resentment that Rochester-based organizations were dominating the discussion. By 2008, two region-wide collaborative groups were operating significant projects; the region’s WIBs were creating a Regional Skills Alliance, while the region’s community colleges were creating a Regional Center for Workforce Excellence.
Mid-Michigan is the region in which regionalism represents the most profound change directly attributable to the initiative. Looking closely at three points in Mid-Michigan history is useful to appreciate fully the magnitude of this region’s journey:
o Prior to this initiative, the counties within the grant-identified boundaries had never been considered a region. In fact, the governor required them to come together as a region at the grant proposal stage.
o At the time of the 2007 site visits, regional identity was cited as the greatest challenge for Mid-Michigan. “Each of these communities has its own economy, requiring workers with varying education and skill levels. For example, Lansing is characterized by a highly educated, high-wage economy, while the economies of Flint and Saginaw are built upon small industrial supplier companies that use workers for manufacturing. Other parts of the region are rural, with economies driven by agriculture.” Furthermore, at that time the Mid-Michigan partners had no shared vision about transformation philosophy and goals; they were principally aware of the funded projects that directly affected them. Respondents made statements such as “How do you get people to work together when they have different images of what a prosperous future looks like?” “What are the common concerns, future options and the central synergies?” “You can’t take 100 years of history and wave a wand. How are you going to move this culture towards common goals and esprit de corps, when you have no regional council of government and these difficult jurisdictional boundaries?”
o The major indicator of grant-funded change at the time of the 2008 site visits was of a growing sense of regionalism. As one respondent said, “It puts an extreme multiplier on all of our individual strengths.” As a result of these transformation efforts, the state Department of Labor and Economic Growth has divided the state into 13 regions, promoting regionalism. The region has developed a shared vision and goals; the initiative has not yet been able to change the economy, but it did change the environment. “A culture of collaboration is now assumed and taken for granted.” Respondents believe that, because of the increased regional collaboration this has fostered, their region will fare better in the current recession than will other regions of the state. They also expect their regional economy to recover more quickly than others, given their increasingly diversified economic base.

The Power of Partnerships: American Regions Collaborating for Economic Competitiveness, 2009 Interim Report
B e r k e l e y P o l i c y A s s o c i a t e s
101
As the above examples suggest, the regions vary in the extent to which they themselves regard increased regionalism as being among their key successes. Yet nearly all regions have evolved between 2007 and 2008, with key partners learning to work together more effectively in a regional context. Proximity seems to matter in new ways in the globally traded sectors. One of the challenges for several regions has been to identify the ways a region can interact effectively with global partners and customers. As one interviewee noted, “There was a time when you never had to make a long-distance call to get a customer.” Boat builders in Maine, however, are now focused on the Chinese market, and producers of automobile components in Michigan are exploring global markets. Expert analysts of regional economic activity have noted the importance of networks in fostering innovation and economic growth.23 Boundary-spanning networks that engage in meaningful collaborative activities tend to outperform those communities in which industrial, business, and workforce development sectors are isolated from one another.24 In an era of high-paced global competition, decisions need to be made quickly; risks are high because of uncertainties about technology, markets, and competitors; and multiple resources need to be mobilized simultaneously.25 Regional partnerships have the benefit of building awareness of their collective capabilities and resources. Together, more effectively than in isolation, they can learn about and respond to new opportunities. Having established the required underlying trust, they can move quickly, even with imperfect information.26 For all these reasons, the progress the regions have made toward learning to think and act regionally – as well as across professional boundaries – will be likely to facilitate achievement of the goals they initially established. That progress is also likely to strengthen them during the current economic downturn and make the most of their regions’ competitive strengths. Finally, increasing regional collaboration has fostered new and stronger relationships among partners, relationships that will continue to enhance the regions’ ability to compete in a post-Initiative economy. The next section explores in more detail the elements of sustainability in the regions. It discusses the factors that, in many regions, have improved the prospects for sustainability of the vision and grant-funded projects since the evaluation’s 2007 site visits.
23 Gloor, Peter. Swarm Creativity: Competitive Advantage through Collaborative Innovation Networks, New York: Oxford University Press, 2006. 24 Garcia, Maria. Social Capital, Networks and Economic Development: An Analysis of Regional Productive Systems, New York: Edward Elgar Publishing, 2006. 25 Audretsch, David. The Entrepreneurial Society, New York: Oxford University Press, 2007. 26 Cross, R., A.B. Hagedon, and S. Parise. “Critical Connections: Driving Rapid Innovation with a Network Perspective,” Network Roundtable White Paper, University of Virginia, 2005; Powell, Walter and Stine Grodal. “Networks of Innovators,” in The Oxford Handbook of Innovation, J. Fagerberg, D.C. Mowery, R.R. Nelson, editors, New York: The Oxford University Press, 2005; and Springer, Berlin, Robert Huggins, and Hiro Izhushi. Competing for Knowledge, London: Routledge, 2007.
The Power of Partnerships: American Regions Collaborating for Economic Competitiveness, 2009 Interim Report
B e r k e l e y P o l i c y A s s o c i a t e s
102
Sustainability The regional initiatives may be sustained in a variety of ways, in a continuum ranging from the sustainability of the overarching vision to sustainability of specific activities. The evaluation used four points along this continuum to organize the various activities and evidence of sustainability in the regions, including:
Philosophical Sustainability. The initiative represents a new way of thinking about economic competitiveness that considers human capital as a key element and the regional economy as its focus. The evaluation is looking for evidence that this philosophy is becoming a part of the ethos of regional actors tasked with and concerned about the economic vitality of their locales.
Relational Sustainability. Collaboration is the heart of transformation efforts. The initiative has encouraged partners to act regionally across geographical and jurisdictional boundaries as well as cross-functionally across organizational and professional and systemic boundaries. To identify relational sustainability, the evaluation is examining the durability of each region’s networks of stakeholders from different sectors working in concert and unified in purpose.
Institutional Sustainability. Transformation of the workforce system is one of the chief goals of the Initiative. As the workforce system transforms, so can the various education, economic development, and other collaborators also undergo their own transformation by institutionalizing change within their own organizations. The evaluation team is exploring the extent to which the partner agencies adopt different policies and activities that promote collaboration. Additionally, institutional sustainability can refer to the extent to which the institutional home of grant activities will be able to carry on the region’s work and support new regional partnerships after the life cycle of the grant is over.
Programmatic Sustainability. The Initiative has spawned many new and creative training, education, support, and outreach programs and activities across the country. The evaluation is assessing whether these will be likely continue beyond the grant.
This section presents examples of each of these types of sustainability found in the 13 regions. Philosophical Sustainability During the 2008 evaluation visits, respondents in many regions noted that a philosophical shift was already taking place in the region’s popular conscience. In Metro Denver, for example, the initiative has generated interest in the regional economy, the targeted industries, and talent development. Interview respondents reported that transformative principles have “changed the conversation” through its messages on regionalism, the talent pipeline, and aligning educational policy with workforce and economic development. In Kansas City, one interviewee noted that sustainability has been redefined in the industrial sector in a “a recycle-reuse-reduce model” in which workers in a declining industry (reduce) are retrained with new skills and cycled back into growing or emerging industries (“recycled”) or are able to transfer (“reuse”) their existing skills into new industries or new positions.
The Power of Partnerships: American Regions Collaborating for Economic Competitiveness, 2009 Interim Report
B e r k e l e y P o l i c y A s s o c i a t e s
103
One of the California Corridor’s industry partners described the palpable, albeit difficult to quantify, nature of philosophical change in that region: “There is a shift happening [in workforce/business relationships], but it can't be quantified and you can't put metrics to it.” The first year he gave a presentation at the California Workforce Association’s annual meeting, “they looked at me like I had two heads; nine months later, there was a good discussion. It’s a huge shift. When they talked about the economic innovation model developed as a project, the WIBs said, ‘Oh, okay, we understand that.’ There’s a better appreciation of being on parallel footpaths, or even on same footpaths, and out of silos.” Relational Sustainability The evaluation’s first Interim Report indicated that perhaps the most important measurement of transformation is not whether the specific strategies and activities started under the initiative can be sustained, but whether the underlying collaboration between disparate stakeholders to support economic innovation on a regional level is maintained. In all of the regions, partners have established strong boundary-spanning relationships, and site visit respondents in many of the regions reported that these relationships will endure. For example, the Maine Commissioner of Labor noted that the fundamental integration of services between economic development and workforce will continue beyond the end of the grant, as will the collaboration between Maine Department of Labor and the state Department of Education. All of these agencies have developed close working relationships with and through the North Star Alliance, and now have a shared trust and language upon which to build future collaboration. Relationships have grown at the local level as well as the state level. Respondents in Montana stated that one of the biggest accomplishments of the Montana Agro-Energy Plan is that local Job Service staff members have established relationships with both the tribal colleges and Montana State University, Northern. As one respondent said, “We are now a lifetime partnership.” Regions have made varying progress towards institutionalizing relationships formed through participation in the Initiative. Northwest Florida’s Entrepreneurship Council is collaborating with the National Business Information Clearinghouse to develop a web portal that addresses the core issues confronting entrepreneurs. The collaboration is one of two pilot demonstration projects funded by the U.S. Department of Labor. Wall Street West’s Sustainability Committee, whose members have agreed to meet monthly, represents community leaders’ commitment to developing the structures and momentum that will sustain the region’s achievements. In February 2008, Piedmont Triad invested in sustaining relationships by forming the Piedmont Triad Leadership Institute to build capacity in the region and bring others to the table. This group includes college presidents, hospital presidents, business leaders, university staff, and elected officials. Conveners have worked to ensure both representation across all 12 counties and a mix of “usual suspects” and emerging leaders. The group has met to explore the economy’s needs and strengths, visualize the impact they could make, narrow down exactly what they would do, and develop an action plan, which they completed in September 2008. The California Corridor’s education and industry partners who served together on the STEMCAP committee and advisory board also collaborated to fund summer institutes in which
The Power of Partnerships: American Regions Collaborating for Economic Competitiveness, 2009 Interim Report
B e r k e l e y P o l i c y A s s o c i a t e s
104
teachers and students can spend their summers working in NASA laboratories and at the Jet Propulsion Laboratory (JPL). Workforce partners in this region reported initial hesitance about collaboration. After two years of working together, however, these respondents reported positively on new partnerships formed, not only across systems, but within the workforce system as well. “We realized that businesses don’t care which side of the county line services are on,” noted one interviewee, “… we found out it’s us (the WIBs) that are in the way.” On the other hand, competition among stakeholders for money and credit remain a barrier to sustainability in California. Partners heard a university in the region was pursuing a large grant to write a STEM education plan and urged the university to align its proposal with the already-written STEMCAP. “But, there are the usual problems with territory,” one education partner said. “It would be best if, instead of developing a new plan, [the university] would have just taken STEMCAP, but then they would not have gotten the $750,000 to develop a new plan.” Institutional Sustainability Partner institutions have begun changing in various ways as a result of their participation in the Initiative. From the workforce system side, the Chair of the Montana State WIB has proposed rolling new transformation processes into the regular state WIB functions due to concerns about the sustainability after the grant ends. In addition, Montana’s Governor has proposed creating a new bureau within the Department of Labor and Industry specifically to coordinate with the state’s Office of Continuing and Higher Education, to institutionalize the link between the two agencies. In Michigan, the state has reorganized its cabinet so that the new Department of Energy, Labor and Economic Growth handles both workforce and economic development, ensuring that the mingling of these two priorities will be institutionalized in state policy. Institutional sustainability is also a priority for regions attempting to ensure that the organizations leading these efforts will be able to carry on their work and partnerships after the life cycle of the grant is over. Some regions located their initiative within a pre-existing regional collaborative. For these regions – for example, West Michigan with the West Michigan Strategic Alliance (WMSA) – sustainability will occur simply because the same organization will still be in place to carry out the priorities. Staff in West Michigan emphasized that their goal is to sustain the work that has been done, which will be facilitated by the continued existence of WMSA and the funded initiatives rather than by the Core Team. WMSA was doing this type of work before the grant, and can be counted on to continue these efforts after the grant expires. Similarly, Northwest Florida’s activities are congruent with the strategic plan of Florida's Great Northwest, and the organization will maintain them once the grant ends. In Mid-Michigan, the partners have always been thinking ahead. Respondents recalled that at the initiative’s first meeting, a key stakeholder asked, “This is a three-year project? What should we do in year four?” Institutional sustainability is a particularly important issue for the two-state regions. Kansas City’s grant leadership is drafting a framework for a stakeholder “oversight group” of CEOs (chosen for their power to commit organizational staff and resources) to oversee the continuance of the work begun under the initiative, and the Executive Committee plans to recommend a proposed framework within the next year.

The Power of Partnerships: American Regions Collaborating for Economic Competitiveness, 2009 Interim Report
B e r k e l e y P o l i c y A s s o c i a t e s
105
In WAEM, The Montgomery Institute is currently investigating the possibilities for transforming the present WAEM Governing Commission into a USDA Rural Investment Board with a mission to focus on regional development and talent development. Another example of institutional sustainability in this region is the WAEM Alliance, a permanent oversight and credentialing body for the M3 and other distinctly regional credentials that consists of the eight community colleges partners. Other functions of the Alliance are to support regional training programs and economic development projects, and to implement innovative training programs that are aligned with regional priorities. The North Star Alliance Grant Coordinator is currently drafting a sustainability plan for the initiative. Tentative plans are for the North Star Alliance to be incorporated as a nonprofit organization and operated by the Maine Marine Trades Association. Programmatic Sustainability The Generation I regions have adopted a range of strategies to ensure that the programs and activities they established remain after the ETA grant funding ends. These include embedding new programs and curricula in established colleges and universities, requiring sub-grantees to develop sustainability plans, identifying other funding sources to continue initiative activities, and lobbying for policy changes that will institutionalize key initiative strategies. These various approaches are discussed below. Montana developed curricula for several courses related to bioenergy and supporting industries. Many of these short community college courses – such as welding, hazardous materials, lockout-tagout, and similar training – are oriented to existing industries and are expected to be in steady demand after the grant ends. One respondent noted that these classes will have had three years to build a base of student interest by the time the initiative ends. Sustaining training initiatives for the biofuels cluster will require more public support, however, as those industries are still in their infancy. A likely source of future funding for biofuels classes based on grant-funded curricula is the state’s Green Campus initiative, which, although it is not currently linked to the initiative, involves online classes, degrees in energy conservation, and conservation-focused facilities improvement. Regions also have made structural changes to ensure programs are sustained beyond the grant period. WAEM’s strategies include requiring sustainability plans from all partners; “mainstreaming” new community college courses and youth programs so as to ensure their continued funding through the educational system; and tailoring activities in order to be eligible for state and other funding. WAEM's MyBiz and Start It! cards programs were expanded to all of Mississippi, a move that will ensure a more stable funding base. NCI partner organizations have incorporated key initiative activities into their ongoing programs, which will contribute to the sustainability of the initiative’s efforts beyond the grant period. The Purdue Center for Regional Development (PCRD) will continue to support development, Ivy Tech will continue its STEM career training program, and TAP will continue to operate its Reach Centers and offer the services of business services consultants.

The Power of Partnerships: American Regions Collaborating for Economic Competitiveness, 2009 Interim Report
B e r k e l e y P o l i c y A s s o c i a t e s
106
In Northwest Florida, grant funds have been used to methodically research, study, and analyze best practices for sustainability, including a study of targeted industry employers to be shared with the State Legislature in hopes of supporting the development of future regional efforts. In Mid-Michigan, the MMIT Steering Committee/Governing Board has taken on responsibility for exploring relationships with foundations, government, businesses, and others to secure long-term support for coordinated economic development within the region. Integrated business service approaches developed under the grants also will help to sustain local programs and training. Parts of the WAEM region have been very successful in attracting new large manufacturing employers. WAEM colleges in these areas are reaching out to the industrial base for sustainable partners, not only as customers for training, but also as donors for expanded facilities. WAEM's emphasis on developing enterprise-ready communities has also created stronger long-term ties to local government in some parts of the region. Regions have also attempted to ensure program sustainability by introducing features such as fees for services, rental income and membership dues for grant-funded projects. NCI required many of its funded programs to build-in mechanisms of sustainability in their program designs. For example, New Tech High in the Rochester Community School District is a demonstration site, charging fees to host tours and give workshops on how to institute a wall-to-wall high school technology program. The fees help pay for continued programming. Similarly, in West Michigan, funded projects are required to demonstrate plans for sustaining their work after the grant money disappears. Many of the region’s activities, such as the Manufacturing Skills Cooperative and West Michigan TEAM, derive revenue from employer or participant fees that will enable the projects to be self-sustaining after grant funding is gone. The director of West Michigan TEAM reported that companies like the program because they fund it, so it won’t “expire when the political winds change.” Another self-sustaining product in this region is the grant-funded Innovation Curriculum, which includes three learning modules on key entrepreneurial skills. Twelve community colleges are now paying to use the curriculum. The North Star Alliance established two training centers in Maine: 1) the Maine Advanced Technology Center focuses on composites and is operated by a community college; and 2) the Marine Systems Training Center focuses on various systems on boats and is operated by an industry trade group. Both training centers will continue to operate after the grant ends, funded by employers or workers paying tuition. Some regions are attempting to sustain their work through policy efforts at the state and local level. In Wall Street West, several respondents highlighted the statewide efforts to support STEM industry career pathways in Pennsylvania high schools as a potential forum for continuing many of the region’s objectives of demand-driven workforce development and regionalism. In West Michigan, the NCRC WorkKeys innovation is also being sustained through policy efforts in the education and workforce systems. In December 2007, the NCRC WorkKeys Innovation received a commitment from the Michigan Council for Labor & Economic Growth (CLEG) to develop an implementation plan for a statewide career readiness credential based on the ACT WorkKeys National Career Readiness Certificate (NCRC). In August 2008, Michigan’s governor signed the School Aid Bill, SB-1107, which added “Locating Information” to the Michigan Merit Exam. Now all three of the WorkKeys tests will be given annually to Michigan
The Power of Partnerships: American Regions Collaborating for Economic Competitiveness, 2009 Interim Report
B e r k e l e y P o l i c y A s s o c i a t e s
107
High School students, giving them the opportunity to earn a NCRC. Additionally, the Michigan CLEG committee endorsed making the NCRC the standard for all MichiganWorks agencies. The evaluation’s 2008 visits revealed that regions have attempted to ensure the work of the initiative through concerted efforts at philosophical sustainability, relational sustainability, institutional sustainability and programmatic sustainability. The final evaluation visits will likely uncover strengthened and new strategies in these areas as the projects conclude and as regional partners endeavor to enshrine the progress they have made towards regional economic transformation.
Summary The accomplishments of the regions include systems to support innovation that are likely to benefit their regional economies in the years to come. Most of the regions have also taken steps to assure that the partnerships and activities they have created will continue to operate and benefit their regions after funding for their initiatives ends.
The Power of Partnerships: American Regions Collaborating for Economic Competitiveness, 2009 Interim Report
B e r k e l e y P o l i c y A s s o c i a t e s
108
Chapter 6: Quantitative Measures of Progress: Changes in Extant Data Measures for the Generation I Regions
Introduction The Generation I regions all focus on economic transformation through new integrated approaches to collaboration, innovation, workforce investment, and economic development. Each region has a strategy to achieve this goal that is based on the region’s distinctive geography, assets, and economic history. Thus, the measures of progress that the evaluation is monitoring over time include a highly diverse range of variables. To supplement the qualitative measures that the evaluation is collecting through site visits, analysis of existing quantitative data allows tracking of progress over time on specific goals both within regions and across regions, using a variety of existing reliable metrics as indicators of progress. The first Interim Report introduced a range of baseline indicators representing different aspects of long-term economic transformation, variables that are reliable and comparable across regions as well as years. These sorts of measures can provide external, independent, and unbiased information about the regions’ progress toward economic and workforce system transformation. Success should result in many shifts in each region; therefore the evaluation needs to track many variables, examine many correlations, and look for leading indicators of change across a wide range of potential outcome areas. To this end, the evaluation team has been collecting data on a number of measures beyond the usual workforce metrics. Since the evaluation is intended to track progress toward goals as well as achievement of goals, the team has focused on factors that are leading indicators of change, and has identified sources of data that track innovation, transformation, entrepreneurship, and education and talent development measures. The cost-effective way to achieve this in-depth analysis is to use data sets collected by others, usually for other purposes. The evaluation team has identified and selected national data sets, gathered at least annually using reproducible methods, and with geographic identifiers available so that data for the regions may be aggregated using zip code or county/state identifiers. When researchers use data in ways that were not envisioned by the gatherers, they must take care to identify any hidden assumptions that are not spelled out in the data dictionaries, and to assess the quality and completeness of all fields, particularly those fields that were not central to the original use. The evaluation team has been fortunate to enjoy the cooperation of nearly all of the third-party data providers in obtaining additional documentation of their data sets to ensure the validity of the data for evaluation purposes. In order for the analysis of extant data analysis to be reliable, the data collected by the owner organizations must be uniform over the years (one of the criteria used in qualifying data sources), and the evaluation team methods must also be exactly reproducible, year after year, so that even small changes in measures can realistically be attributed to actual change in the region, and not to a change in data collection or analysis methodology. The evaluation’s approach reflects these principles.

The Power of Partnerships: American Regions Collaborating for Economic Competitiveness, 2009 Interim Report
B e r k e l e y P o l i c y A s s o c i a t e s
109
Many exogenous changes in the national (and international) environment are occurring and will continue to occur throughout the grant period. Ideally, to clearly identify the impact of the Initiative within an environment in which other changes are occurring, the evaluation team would need to compare the region with the grant activities in place to the same region without these efforts, over the same time period. As that is clearly not possible, the study compares each region to its host state, and observes the changes in the difference between the region and state over time. Did the region change more along certain dimensions than the state as a whole? While this approach is not perfect, it is feasible for all of the regions, and thus is the one the evaluation team used. In the first year of this study, the baseline values for the selected indicators created a snapshot of the regions before transformation efforts began. The evaluation team again analyzed the full complement of indicators in the second year to track annual changes from the baseline values and thus assess the regions’ progress across the various dimensions of economic transformation. The details of this analysis can be found in Appendix D. The reader should note, however, that the study team began these analyses by examining data from years just previous to grant award to determine the existence of any trends that might influence or confound the evaluation’s measurement the grantees’ success. Thus, the second year data represents the very early implementation of the initiatives, and expecting visible changes due to regional transformational activities is not reasonable, particularly given that outcomes for training activities may lag enrollment by a substantial period (e.g., graduation from a STEM academic program may lag a student’s enrollment by two years for a community college degree, and by four years for bachelors’ level program). This brief chapter summarizes a few highlights from the evaluation’s second analysis of extant data. Again, because of the short period for comparisons (2006-7 or 2006-8), drawing conclusions about the initiatives’ influence on these measures is premature. The evaluation’s Final Report will compare extant data over four years, providing a better picture of the regions’ transformation.
Data Sources The analysis presented in Appendix D compares regions to their host states for the baseline and following year for extant data metrics covering:
Workforce Employment and Wages Data sources: National Bureau of Labor Statistics and U.S. Internal Revenue Service. Data items include
o Average annual wages;
o Number of employees by industry;
o Worker migration;
o Migration of adjusted gross income of workers.
Measures of Innovation and Commercialization Data sources: Dun and Bradstreet, National Science Foundation, National Institutes of Health. Data items include
The Power of Partnerships: American Regions Collaborating for Economic Competitiveness, 2009 Interim Report
B e r k e l e y P o l i c y A s s o c i a t e s
110
o Number of new business starts; o Number and dollar amounts of federal Small Business Innovation Research (SBIR) and
Small Technology Transfer (STTR) grants; o Number and dollar amounts of NIH and NSF awards; o Number patent applications; o Number patents granted; o Number of patents with foreign coauthors (measure of globalization); o Number angel investor networks.
Education and Talent Development Measures Data source: US Department of Education Integrated Postsecondary Education Data System (IPEDS). Data items include o Total enrollment in two-year and four-plus-year institutions of higher education; o Number of entering students; o Number of degree completions; o Number of degree completions in STEM subjects; o Number of instructional staff; o Number of new faculty hires.
Summary of Incremental Changes in Extant Data Measures
Regional transformation is likely to be reflected in changes in extant data measures over the course of many years, and single year-to-year changes would be small in most cases. Even so, the evaluation team’s analysis showed some statistically significant, incremental changes in the period between August 2007 and the end of 2008. These are presented in Figure 6.01, which summarizes a comparison of changes that occurred over the period in each region to changes that occurred in the region’s host states. The figure also includes the direction of the change in terms of achieving the region’s goals, a description of the change, and the type of goal that the measure is addressing. For example, the figure shows that new business starts in the Finger Lakes region (related to the goal of increasing innovation) decreased significantly more than did new business starts in the state. On the other hand, the NCI region experienced a decrease in SBIR/STTR funding (another measure linked to the goal of increasing innovation) that was significantly smaller than the decrease experienced in Indiana as a whole. These short-term changes should be cautiously interpreted for the reasons discussed above. Observing these measures over a longer period of time will provide more reliable evidence of the influence of each region’s activities on its economic health, and the evaluation’s Final Report will present the results of such an analysis.

The Power of Partnerships: American Regions Collaborating for Economic Competitiveness, 2009 Interim Report
B e r k e l e y P o l i c y A s s o c i a t e s
111
Figure 6.1 Regional Measures Compared to State:
Changes Between August 2007 & December 2008*
Region Measure Change** Description of Change Region's Related Goal
California Corridor 2-yr completions Region/state down less than 1% Create high skilled workforce
California Corridor New business starts Region/state increased 1% Increase innovation
Finger Lakes New business starts 100 fewer business starts in 2nd year Increase innovation
Finger Lakes Patent applications Region/state down 3% Increase innovation
Kansas City 2-yr completions Region/state down 2% Create high skilled workforce Kansas City 2-yr entering students Region/state up 1% Create high skilled workforce
Kansas City 2-yr STEM completions Region/state down but still above state Create high skilled workforce
Kansas City 4-year STEM completions Region/state up 3% Create high skilled workforce
Kansas City 4-yr entering students Decrease mainly due to smaller entering class in Univ. Missouri-KC
Create high skilled workforce
Kansas City 4-yr Instructional FTEs Region/state up 3% Create high skilled workforce
Metro Denver 2-yr entering students Region/state up < 1% Create high skilled workforce Metro Denver 4-year completions Region/state down 3% Create high skilled workforce
Metro Denver 4-year enrollment Region/state down 2% Create high skilled workforce
Metro Denver 2-yr Instructional FTEs Region/state down 4% Create high skilled workforce
Mid-Michigan 2-yr completions Region/state up 1% Increase graduation rates Mid-Michigan 2-yr Instructional FTEs Region/state down 3% Create high skilled workforce
Mid-Michigan New business starts Region/state down 2% Increase innovation
NCI Amount SBIR/STTR funding Decrease in Phase II funding in state Increase innovation
NCI New business starts Region/state down 2% from 7% to 5% Increase innovation
North Star Alliance 2-yr entering students Region/state up 1% Create high skilled workforce
Northwest Florida 2-yr completions Region/state up 1% Create high skilled workforce Northwest Florida New business starts Region/state < than 1% Increase innovation
Piedmont Triad 2-yr entering students Region/state down 4% but now in line w/enrollment Create high skilled workforce
Piedmont Triad 2-yr Instructional FTEs Region/state down 1% Create high skilled workforce
Piedmont Triad Patent applications Region/state down 1% Increase innovation
Wall Street West 2-yr entering students Region/state up 3% Create high skilled workforce Wall Street West 2-yr Instructional FTEs Region/state up 3% Create high skilled workforce
* All relationships shown are statistically significant at the 95% confidence level ** Moderate change denoted by single arrow; more marked change denoted by two arrows)

The Power of Partnerships: American Regions Collaborating for Economic Competitiveness, 2009 Interim Report
B e r k e l e y P o l i c y A s s o c i a t e s
112
Chapter 7: Workforce System Transformation Transformation of the workforce system – fundamental change in how the system functions in support of regional economic growth – is crucial if the existing DOL/ETA system is going to operate successfully in an increasingly global economy. Today, new workforce challenges are constantly emerging and the rules for success are changing quickly. The workforce system must be “re-imagined” if it is to work smoothly and effectively with economic development organizations, the educational system, and business and industry to meet the demands of the 21st century economy. ETA defined a vision of workforce system transformation for the Initiative (see Figure 7.1) that has the various components of the workforce system fully integrated with education and economic development, and fully aligned with the region’s vision for economic growth. This chapter identifies some of the key indicators of progress in the integration and alignment of the workforce system, and provides examples of how transformation of the workforce system has begun to take place as the implementation of transformation efforts in the regions has unfolded.
Figure 7.1 Elements of Workforce System Transformation
1. The workforce system operates as a talent development system; it is no longer defined as a job training system. Its goal is an educated and prepared workforce – on a U.S. or global standard.
2. Workforce system formula funds are transformed, providing significantly increased opportunity for post-secondary education for lifelong learning opportunities aligned with the region’s talent development strategy.
3. The workforce system no longer operates as an array of “silo-ed” programs and services. 4. The Workforce Investment Boards (WIBs) are structured and operate on a regional basis and are
composed of regional strategic partners who drive investments, aligning spending with a regional economic vision for talent development.
5. Economic and workforce regions are aligned, and these regions adopt common and innovative policies across the workforce, education and economic development systems and structures that support talent development and the regional economy.
6. The workforce system is agile enough to serve the innovation economy, recognizing the reality that 2/3 of all new jobs are created by small businesses.
7. The workforce system actively collaborates with economic development, business and education partners to gather and analyze a wide array of current and real-time workforce and economic data in order to create new knowledge about regional economies. The system supports strategic planning, routinely tracks economic conditions, measures outcomes, and benchmarks economic competitiveness in the global marketplace.
Source: ETA, July 17, 2007
The Power of Partnerships: American Regions Collaborating for Economic Competitiveness, 2009 Interim Report
B e r k e l e y P o l i c y A s s o c i a t e s
113
The Initiative and Workforce System Transformation The regions were not initially charged with achieving the transformation of the workforce system. The November 2005 SGA1 for the Initiative focused on supporting economic growth through regional collaboration, system integration, and innovation. Although the SGA referenced the need for the grantees to align their economic development efforts with workforce development and to create linkages with regional stakeholders, the SGA did not mention transforming the workforce system, nor even include an explicit requirement to include workforce partners in stakeholder partnerships.2 From ETA’s perspective, however, strong linkages between the regions and the workforce system were clearly expected, and the Department saw a re-focusing of the workforce system within the framework of the Initiative – if not actual transformation of the system – as an important goal for the Initiative. The funding authority for the regions, the American Competitiveness and Workforce Improvement Act (ACWIA) that funds the H-1B visa program for foreign workers needed in the U.S., has as a primary goal the expansion of American workers’ presence in high-skill and high-wage jobs. ETA leadership, therefore, may well have expected that any reader of the SGA would understand the importance of seeing the workforce system as integral to the regional effort, in order to meet the Initiative’s goals. As noted previously, the leadership and management of the Generation I regions largely comes from organizations outside of the workforce system; Finger Lakes and Montana are the only initiatives led by a workforce system entity. The other regions are led by organizations and partnerships from academia, economic development, community development, and industry. Several of these were managing a grant from a federal agency for the first time. The regions were surprised and, in many cases, quite taken aback, to learn – part way through the grant period and after their implementation plans were approved and operations were well underway – that they were expected to transform the workforce system in addition to accomplishing their other goals. Several aspects of the workforce transformation to which the regions were expected to contribute – specifically, a regional approach to workforce development and collaboration among Workforce Investment Boards (WIBs) and business and industry – were already in progress around the country prior to implementation of the Initiative. Under the Workforce Investment Act of 1998 (WIA) – the funding authority for the workforce system – state and local WIBs, One-Stop Career Centers, and state workforce agencies were required to implement a number of collaborative efforts that are similar to those of the Initiative. For example, the membership of the state and local WIBs must include regional stakeholders, with a focus on employers (the law requires that a majority of WIB members be representatives of businesses). In addition, WIA
1 DOL/ETA, Workforce Innovation in Regional Economic Development (WIRED) Initiative Solicitation for Grant Applications, http://www.doleta.gov/sga/sga/SGA-DFA-PY-05-04.pdf 2 “Regional stakeholders” were identified as “change agents representing an array of key interests including government, academia, business, community development and entrepreneurship.” (Initiative SGA p. 10)
The Power of Partnerships: American Regions Collaborating for Economic Competitiveness, 2009 Interim Report
B e r k e l e y P o l i c y A s s o c i a t e s
114
encourages sharing of labor market information and coordination of service delivery across WIBs. Furthermore, many state workforce agencies had already begun their own attempts at system integration prior to the Initiative. For example, the State of Michigan had already combined economic development and workforce programs into one department,3 and aligned the state workforce investment regions with its economic development regions. In Indiana, a realignment of the state’s workforce development regions just prior to the grant award resulted in the creation of 11 Economic Growth Regions (EGR) overseen by the state’s two WIBs; the boundaries of the NCI region were defined by the Governor’s Office to conform to EGR boundaries. In North Carolina, both the North Carolina Commission on Workforce Development, the state’s workforce development agency, and the North Carolina Economic Development Board were located within the state’s Department of Commerce. Other efforts to promote regional collaboration among WIBs were taking place prior to the Initiative. Over the last 15 years, California’s Labor and Workforce Development Agency had increasingly encouraged local WIBs to take a regional approach to service provision and to use strategies that combine workforce and economic development. Such efforts, according to California Corridor respondents, laid the groundwork for implementation of transformation activities within the state, and prepared members of the workforce system at all levels for change. The Indiana Department of Workforce Development had, in conjunction with the reconfiguration of the state’s workforce system, launched the Indiana Strategic Skills Initiative (SSI). This state initiative funded regional level research to identify skill shortages, understand the local economy, and assess areas of job growth. NCI respondents characterized the SSI as a “macro version of each region.” SSI prepared Indiana’s public workforce system for the types of change brought about by the Initiative; according to one respondent, the Initiative “only accelerated the process.” In several other regions, WIBs had already started to collaborate regionally prior to the Initiative. For example, in Finger Lakes, the One-Stops had met at the regional level, and in Northwest Florida, five of the six WIBs in the region were already meeting regularly as a group before the grant began. In addition to these early moves toward promoting regionalism within the workforce system, soon after the Initiative was underway DOL/ETA began an effort to support vertical integration – the alignment and collaboration among all workforce system entities in a state – and to transform the workforce system into a talent development system. ETA’s “Driving Transformation” initiative focuses on four areas that influence the ways these entities approach planning, program implementation, and service delivery:
Workforce system structure and governance;
Diversification of workforce funding;
3 The Department of Labor and Economic Growth (DLEG). On December 29, 2008, Michigan created a new agency, the Department of Energy, Labor & Economic Growth (DELEG), combining workforce and economic development efforts in order to prepare for Michigan's new energy economy.
The Power of Partnerships: American Regions Collaborating for Economic Competitiveness, 2009 Interim Report
B e r k e l e y P o l i c y A s s o c i a t e s
115
Understanding the economy and the talent pool; and
New service delivery strategies for One-Stop Career Centers. As part of the Driving Transformation initiative, ETA has held transformational forums and workshops across the country over the past two years, creating considerable awareness of the concepts associated with workforce system transformation, and sharing knowledge regarding strategies and approaches. Thus, any efforts by the regions to achieve the transformation of the workforce system have not occurred in a vacuum. The following section looks at the concepts embedded in “The Elements of Workforce System Transformation,” and provides examples of progress toward such transformation that may be occurring in the regions.
Progress toward Workforce System Transformation Between 2007 and 2008, the workforce systems within these regions made significant changes in their operations. They have made progress toward workforce system transformation, but their preliminary steps toward the desired goal may not (yet) rise to the level of “transformation.” In other cases, transformation is observable, but reaches only some parts of a region or some components of the system. The steps toward transformation reported here are organized by the “Elements of Workforce System Transformation” shown in Figure 7.1. Emphasizing Talent Development and Lifelong Learning A key element of transformation is that the workforce system is aligned with the education system and has an increased emphasis on talent development. The workforce system of the 21st century must, in addition to developing a trained workforce for the jobs of today, also seek to develop an educated workforce that, in alignment with regional economic development efforts, is prepared for the jobs of tomorrow. The Initiative stresses that the workforce system must go beyond being simply a collection of job training programs. It must not only train workers in job skills, but also provide them with educational opportunities that will help them succeed in employment and career advancement in high-growth fields. One example of the workforce system taking on this responsibility is in the Northwest Florida region, where the WIBs – key players in all of the region’s activities – play a particularly important role in talent development. The WIBs work closely with the secondary school Career Academies which must, as a condition of their grant funding from the Northwest Florida region, work closely with the WIBs and the One-Stop Career Centers to ensure that the skills training they provide is relevant to the employment needs of businesses in the region. In another example, Northwest Florida awarded $150,000 in Workforce Innovation I grants to the region’s WIBs to train individuals in the skills and competencies needed by the targeted industry sectors. The initiative in Northwest Florida requires a 100% match from award recipients, meaning that the WIBs themselves made a comparable investment in this talent development effort.
The Power of Partnerships: American Regions Collaborating for Economic Competitiveness, 2009 Interim Report
B e r k e l e y P o l i c y A s s o c i a t e s
116
Progress has also been made in the Wall Street West region, as the workforce system evolves from its traditional role as a job training system into a genuine talent development system. The Northeast Pennsylvania Business Education Workforce Partnership Transformation Initiative (NPBEWPTI) brings together the five WIBs in the region with 69 school superintendents, four business education partnerships, and the state Department of Education. Their goals are to develop business education partnerships, implement structured career exploration models, tailor K-12 curriculum to meet industry needs, and provide a regionalized career pathway awareness program throughout the nine-county region. The Lehigh Valley Workforce Investment Board is the lead organization for this grant-funded effort, and participation in the grant is perceived as having opened the WIBs up to working region wide with industry and education partners to achieve common goals and “actually change the face of education.” In Kansas City, WIBs have made a concerted effort to encourage training in career pathways in the targeted industry areas. In particular, the Workforce Partnership, in Kansas City, Kansas, has had success in reaching out to hospital human resource staff to identify incumbent workers who are moving up career ladders (CNA to LPN to RN) as candidates for training. They also were successful in working through training providers who had relationships with industry. According to one respondent, “Although there are still barriers to innovation within the system, the numbers are starting to kick in.” In the Finger Lakes region, the grant supports a highly regarded industry education partnership. The Finger Lakes Advanced Manufacturing Enterprise (or FAME) is a grass roots organization led by a manufacturing executive. FAME works with educators to shape pipeline development and assure long-term improvement in the quality of the preparation youth have received by the time they are ready to apply for jobs. The workforce system in the California Corridor region partnered with education and the aerospace industry to support a highly successful pre-engineering training program at El Camino College. The program provides technology-based education to high school students under concurrent enrollment in the college’s technical programs. Over 1,200 students have attended the pre-engineering Project Lead the Way courses on campus and at partner high schools. The Montana region has built partnerships that have multiplied the training options for participants. The workforce system has begun to work more closely with community colleges and four-year colleges, making a greater variety of both long-term and shorter-term training available. Similarly, the initiative has helped front-line case managers look beyond particular approaches to funding, and has expanded the use of supportive services to make training work for the participant. Eliminating Silos Like many other service systems that provide an array of programs and services funded by various sources that have different eligibility requirements, and reporting and accountability responsibilities, the workforce system has tended to operate as a collection of siloed programs (such as WIA, Wagner-Peyser, UI, and Apprenticeship). Transformation involves not just coordination of the siloed workforce programs, but true collaboration across program
The Power of Partnerships: American Regions Collaborating for Economic Competitiveness, 2009 Interim Report
B e r k e l e y P o l i c y A s s o c i a t e s
117
boundaries, so that all programs can operate at maximum efficiency. Bringing together funding from the different silos is a particularly important – and especially difficult – challenge in accomplishing collaboration. In 2008, the State of Michigan made a strategic decision to emphasize education and training rather than reemployment, making “a radical shift from a traditional structure organized by federal funding source and program to a structure organized by customer and strategy.”4 Within its Bureau of Workforce Transformation, Michigan now combines traditional workforce programs such as the Michigan Talent Bank and Veterans Services with career education programs such as Postsecondary Services and Adult Education, and employer programs such as the Regional Skills Alliances (RSAs).5 Both the Mid-Michigan and West Michigan regions are highly involved in the RSAs, which are industry-driven networks/partnerships in high-demand fields that focus on jobs and job training that will promote economic growth. Through the Information Technology RSA, the Mid-Michigan region signed a $100,000 contract with the Capital Area Works! WIB to provide on-the-job training in IT at a Lansing-based corporate server farm. In West Michigan, the West Michigan Strategic Alliance was recently awarded a $20,000 grant to serve as the convener for the region’s Green Jobs RSA, through which WIBs and other partners in the region will collaborate, and which will focus on jobs making alternative energy components and jobs supporting the production of alternative energy. Operating on a Regional Basis Before the workforce system can operate on a regional basis, a change in the ways the different individuals and organizations in the system think of themselves must occur. Instead of considering themselves as separate – and possibly competing – entities, they must recognize that while their local concerns are important, they are at the same time part of a bigger picture. They must see the benefits in both efficiency and effectiveness that they can achieve by combining resources and acting collectively. In addition, where a region’s partners include multiple WIBs, they can free up resources for training and other direct services to customers by coordinating activities, avoiding duplication of effort, and sharing responsibility for common administrative activities. As one respondent in the California Corridor region said, “Before this, [our board] focused on [itself], now we look at things at a regional level; it’s not tunnel vision like it was before.” Another noted: “[The Initiative] led to asking why everybody is doing the same thing, why there is so much duplication of effort?” The lead organization for the effort in Finger Lakes is RochesterWorks, one of the three local WIBs in the region. When the initiative began, the role of the other two WIBs was not clear; however, the three WIBs have a history of being cooperative with each other, and had already developed regional connections. By 2007, they were talking about acting regionally in a number
4 “State Announces New Bureau of Workforce Transformation: Unprecedented re-design will drive change to a system of lifelong learning; Radically restructures workforce efforts.” Michigan Department of Labor and Economic Growth, January 17, 2008. 5 Also based in the Bureau is the Governor’s No Worker Left Behind Initiative, which redirects state and federal worker training dollars to tuition payments at any Michigan community college or other approved training program, for use by displaced workers who need training in high demand skills while receiving unemployment benefits.

The Power of Partnerships: American Regions Collaborating for Economic Competitiveness, 2009 Interim Report
B e r k e l e y P o l i c y A s s o c i a t e s
118
of ways, including: establishing common eligibility standards; streamlining processes for selecting training providers; combining performance accountability efforts across the region; and making sure that funding requests to the state were done on a regional basis rather than by a local WIB. They now are operating one of the region’s major funded projects, to develop workforce system initiatives that are sustainable, region wide, and transformative. One WIB chair, the president of a manufacturing company, said, since participating in the Initiative: “There has been a lot of movement, silos broken down, a lot of collaboration. We are an agenda item at every WIB board meeting, and the discussion includes the future, how relationships strengthen, and the role of board member attitudes. We are becoming less parochial. We now accept the Initiative as a vehicle that advances our own goals. There is less anxiety among rural regions, more ‘we’ and less ‘I.’ The smaller communities see they are tied together.” In Spring 2007, recognizing the importance of creating regionalism as a core value within the workforce system, the North Carolina Commission on Workforce Development offered Regional Collaboration Grants to provide incentives and support for regional planning and to encourage local workforce development boards (WDBs) to join with each other and with economic and workforce partners to do regional strategic planning. Although thinking beyond geo-political boundaries was already common practice for most of the WDBs, the desired outcome of the grant program is the development of processes and infrastructures that would formalize regional collaboration. The six WDBs of the Piedmont Triad Region (with help from the initiative) are tasked with determining how to build a regional structure, how to make decisions on a regional basis, and “how to be ‘one voice’ when you need to.” Among other efforts, the Triad WDBs have built a regional web page to reflect their regional collaboration. They periodically operate regional “virtual job fairs” in which dozens of companies have on-line recruiting “booths” and hundreds of job seekers can learn about the employers that are hiring and submit resumes to them. All five Wall Street West WIBs are active in transformation efforts funded by the initiative, which has made a significant investment in the region’s workforce system through the grant-funded WIB Collaborative. The Collaborative’s goal is to bolster the workforce pipeline to financial services and information technology occupations and increase educational attainment levels by providing opportunities for individuals to attain higher degrees. To date, the Collaborative has established a common individual training account allocation, agreed on common rules governing details such as length of training, and developed common forms such as the training application. According to one respondent in the region, the important “residual benefits” of these investments include the improved relationships they have developed by working together. The challenge is ensuring these relationships are sustained even without funding when the grant ends. The five Wall Street West WIBs have also come together on a proposal for $500,000 and match for $1 million to provide a regional training program for workforce development. The WIBs came together easily; “Everyone got on board with the idea.” Previous interactions between the WIBs and the economic development groups had typically occurred at a sub-regional level rather than region-wide; however, regional collaboration for this program has generally gone well. Most respondents in this region understood that progress would take time and that the objectives would be met over the long-term.

The Power of Partnerships: American Regions Collaborating for Economic Competitiveness, 2009 Interim Report
B e r k e l e y P o l i c y A s s o c i a t e s
119
In some areas, regional structures exist in which the WIBs can and do operate, and some local WIBs have formed regional workforce alliances to coordinate their efforts across jurisdictional boundaries. This allows them to coordinate their efforts, and work more effectively together to address regional labor market needs. For example, in Metro Denver, a Regional Workforce Board of seven counties in the Denver metropolitan area was convened as a voluntary group just prior to the start of the grant, to look at aligning services and addressing broader needs. Since then, the Regional Workforce Board added representation from Larimer and Weld counties, mirroring the Metro Denver nine-county region. In West Michigan, prompted by the governor’s Regional Skills Alliance program, WIBs in the region are now collaborating on both the Health Care Regional Skills Alliance (RSA) and the Green Jobs RSA, partnering with employers and educational institutions to train the region’s workers for jobs in these industries. Serving the Innovation Economy To support the innovation economy and in collaboration with other partners, the workforce system must be actively engaged in nurturing the creation and development of new businesses, especially small businesses, in the region. That means they must “aggressively” promote and support entrepreneurship in the region. Learning to work effectively with entrepreneurs and small businesses requires the workforce system to move quite far from its traditional role of – and funding streams for – helping individuals find and maintain employment and providing businesses with the trained workforce they need. In most of the regions, the workforce system has been a participant in, although not often an initiator of, programs focused on entrepreneurship. The grant-funded Center for Entrepreneurship and Commercialization at Saginaw Valley State University has 20 partners in the Mid-Michigan region involved in small business support, business incubation, and entrepreneurship. One important partner is the WIB for the Thumb Area of the region that has developed a special focus on entrepreneurship. Among its other projects to support economic development initiatives in this very rural part of the region, the ThumbWorks! Michigan Works Agency hosted an Inventors Day to promote and facilitate inventions and innovations in the region and to develop resources (e.g., potential investors, non-financial supporters) for continuing the development of innovative, entrepreneurial opportunities. In virtually all the regions, services are being provided to the innovation economy. Chapter 4 reported that many of these were entrepreneurship and business services, as well as green jobs. Where WIBs are active partners – and where their staff and board members serve on collaborative steering committees – they are actively involved in supporting and shaping these efforts. Collaborating with Economic Development, Business, and Education Partners According to the “Elements of Workforce System Transformation,” in a transformed workforce system, workforce development is aligned with, and integrated into, a vision for the region’s economic development and growth. Members of the system see themselves as – and behave as – integral partners in a regional economic vision. Collaboration is key to the start of the transformative process. Many workforce system partners in the regions have made strategic
The Power of Partnerships: American Regions Collaborating for Economic Competitiveness, 2009 Interim Report
B e r k e l e y P o l i c y A s s o c i a t e s
120
collaborative partnerships a high priority, in recognition of their common interests with economic development, business, and education partners. One important collaboration involves the cross-membership of the initiative’s key players and of the WIBs themselves. Most of the regions include WIB chairs, directors, or staff in leadership and governance positions, often as members of the Steering Committee (e.g., Piedmont Triad, Mid-Michigan). Similarly, in almost all of the regions, the WIBs in the region include initiative partners as members (e.g., Finger Lakes).6 In a number of the regions – such as NCI, the Piedmont Triad, West Michigan, and Mid-Michigan – the state’s workforce and economic development agencies are formally aligned because they are both based in the same state agency, or because the geographical boundaries of the WIBs are aligned with those of the state’s economic development regions. Such organizational and jurisdictional alignment of workforce and economic development areas communicates a clear message to staff and the public, underlining the fact that both systems have shared goals, and facilitating collaboration between the two in addressing these goals. In those states where such restructuring or realignment predated the Initiative, the workforce system’s alignment with a regional vision for economic growth was clearly advanced through the efforts of the regional initiatives. For example, the successes of the regions in Mid-Michigan and West Michigan (and the Generation II region in Southeastern Michigan), caused the concepts of collaboration and regionalism to take firm hold in the Department of Labor and Economic Growth (DLEG) and become a strong focus for the state agency overall. DLEG also increasingly emphasizes talent development; within the agency, the state has created a Bureau of Workforce Transformation, which helps individuals not only obtain employment but also acquire the skills needed for “the jobs of today and the future.” In some regions, separate economic and workforce agencies have – as a result of these transformation efforts – formed partnerships and adopted common policies across the workforce, education and economic development systems that support talent development and the regional economy. Metro Denver, for example, has forged a partnership with the Governor’s Office of Policy Initiatives (OPI) to help strengthen STEM skills for all students in Colorado. OPI will communicate STEM skills development programs to high growth industries, the public workforce system, K-12 educational institutions, and higher education. Additionally, OPI will collaborate with partners to connect the Governor’s P-20 Policy Council’s education policy goals and the goals of the Colorado Department of Labor and Employment to economic development organizations, and will work to communicate the goals and objectives of STEM policies throughout the nine-county region. The grant provided funding of $100,000 to leverage a $500,000 STEM grant that the Governor’s Office received from the National Governors’ Association.
6 Several WAEM partners are members of Alabama’s Workforce Development Councils, which are sub-regional entities within the 65-county WIB that covers the non-urban areas of the state. Although they are different conceptually, these Councils have a number of responsibilities similar to those of a local WIB, such as oversight and fund disbursement.
The Power of Partnerships: American Regions Collaborating for Economic Competitiveness, 2009 Interim Report
B e r k e l e y P o l i c y A s s o c i a t e s
121
Almost all California Corridor respondents named new partnerships – and the unexpected value of those partnerships in meeting the goals of their own organizations – as among the top benefits of participating in the Initiative. One example of successful partnerships that was noted often was the pairing of WIBs and economic development entities on specific projects. These new partnerships are fostering better understanding of the economic development community among WIB staff, and of the workforce community within economic development agencies. A key aspect of the collaboration with the WIBs has been the region’s work with the California Workforce Association (CWA) to incorporate the ”Innovation Agenda” into CWA activities. The effort addresses the lack of a common language and set of tools for local workforce agencies, and the need to recognize the different levels of “sophistication” among the WIBs in the Corridor. Additionally, CSA included workforce system partners in almost every project undertaken under the grant, and every quarterly meeting of the CWA had something on the agenda related to the grant. CWA has used the WIB Toolkit developed under the grant as way to get everyone talking about the role of WIBs in regional collaboration. Piedmont Triad successfully launched the TriadWorks Project, a collaborative initiative of six WDBs in the region. In conjunction with the project, the WDBs have come together to promote regional economic development, building upon each individual WDB’s strengths, and committed to building a workforce and support system for the region that can meet the needs of any employer in the world. One of the major successes in Piedmont Triad is the initiative-led Piedmont Alliance for Triad Health (PATH), which works directly with health care employers to address their workforce needs. It serves as a model for the state’s effort to support Regional Skill Partnership development in other industry sectors. The Partnership is over 30 members strong, supported by the six WDBs, eight community colleges, and currently 12 employers, and is strongly positioned to secure funds that will assure sustainability beyond the grant. Kansas City respondents report that “one of the most innovative things” they are seeing in the region is that the workforce system has begun listening to businesses, which “had not occurred much in the past.” Participation of the workforce system in these efforts has redefined how the system is perceived by industry. One respondent in Metro Denver made a similar observation, that industry in that region is beginning to see the workforce system in a different way: “Industry, education and workforce partnerships are incredible…the players have shown a real commitment.” Similarly in NCI, partnerships between the workforce system and industry have developed and deepened. In the opinion of one respondent, the workforce system has moved from being reactive, whether to good news (plant openings) or bad (plant closings), and is becoming more proactive in working to understand the workforce needs of business and industry in the region, and to address them through training and education.
The Power of Partnerships: American Regions Collaborating for Economic Competitiveness, 2009 Interim Report
B e r k e l e y P o l i c y A s s o c i a t e s
122
Challenges to Workforce System Transformation As noted above, fundamental changes in how the workforce system operates – and thinks of itself – are needed if it is to continue to operate successfully in the 21st century global economy. Evidence can be seen that some progress has been made toward such transformation in the regions, in many cases thanks to these efforts. Many challenges remain, however, including those described below. Challenges Attributable to the Economic Downturn The economic downturn that became acute during the last half of 2008 has begun to dominate the thinking of workforce system leaders, along with other Initiative partners and stakeholders. They have begun asking each other questions such as the following: How do you ensure positive employment outcomes during times of rising unemployment? How does the workforce system achieve the training needed to reorient frontline staff to new ways of thinking during a time of severe economic downturn such as we are in today? At a time when unemployment is sharply rising, businesses are folding, and layoffs are spiking, how do staff at the One-Stop career centers and other front-line people in the workforce system keep their focus on developing the talent pipeline, working with industry to create new jobs, and thinking about economic growth over the longer term? Neither leaders in regional transformation nor the nation’s top economists can provide easy answers to this set of seemingly overwhelming challenges. In Northwest Florida, one respondent believed he had a partial answer. This region is characterized by very close collaboration between the workforce system and the economic development professionals who work within the lead organization. According to this respondent, the lead organization told the workforce system professionals that they should take care of immediate needs, and that activities supported by the initiative would take care of the long-term. Another possible answer is for WIBs to look for opportunities to support others in the region who are building the support systems that will facilitate economic recovery. They must also keep in mind that talent development in support of growing industry clusters is crucial to long-range economic growth. Challenges to Regional Cooperation among WIBs WIBs in a few regions are struggling with how they should balance the unique challenges and opportunities they confront at the local level with the use of common strategies, policies, and procedures for approaching challenges and opportunities across the region. They question how local-level entities in the workforce system can engage in regional thinking and collective action, while at the same time meeting their responsibilities under WIA to address WIB-level needs. For instance, in Metro Denver and in Missouri and Kansas, WIBs are reluctant to follow the Indiana model, in which they moved from local WIBs to a larger regional body. While they may be able to cooperate with other WIBs in the region, they fear losing their autonomy and worry that their focus on local issues will be diminished. Additionally, individual WIBs may have difficulty making sense of conflicting mandates in regions where the state’s WIA jurisdictions do not match up with its geographic and economic development regions.
The Power of Partnerships: American Regions Collaborating for Economic Competitiveness, 2009 Interim Report
B e r k e l e y P o l i c y A s s o c i a t e s
123
In some cases the extent of partnership achieved through transformation efforts, and even the ability to partner at all, was highly dependent upon the existing structure of the state workforce system. In several regions, the structure of the state’s workforce system was not a good match for efforts to work collaboratively (for example, WIB boundaries and initiative-defined regional boundaries did not sufficiently match), or the state’s priorities for the workforce system limited any efforts with regard to economic development or regional collaboration. Challenges to Collaboration Across Professional Boundaries To accomplish the goals of transformation, true collaboration – and not just a token effort – is needed among workforce professionals, educators, economic developers, and business. In some of the regions, workforce and economic development people work closely together, following a shared vision and recognizing their common goals. In others, however, efforts to work together have not reached that level. In one region, site visitors heard from workforce professionals that, although they had been invited to participate in some initiative activities, the invitation came too late and they were not offered a meaningful role: “We came as partners but were turned into stakeholders.” Some workforce professionals were deterred from collaborating fully with economic development organizations because they felt “stretched” to address competing priorities simultaneously. They expressed concern about working to achieve the economic development goals while at the same time working hard to meet the federal requirements to provide training to help individuals obtain high-skill, high-wage occupations. They worried that efforts diverted to economic development concerns would leave them unable to address the OMB Common Measures. In other regions, the structure of the workforce system within the state was not well suited to collaboration, or the state’s priorities for the workforce system did not include economic development. Another concern about competing priorities was highlighted by the views expressed by one respondent from Kansas City. The challenge for the public workforce system, according to this respondent, is the need “to transform from an order taker to an order maker.” In other words, the system needs to select the markets they are going to serve based on research and on employer needs and opportunities, rather than shaping its services based on the workers and job seekers who “happen to walk through its doors.” This point of view elicited concerns from those workforce professionals who prioritize services to workers and job seekers, and who worry about the needs of the people who don’t fit into the available job opportunities. Many of the organizations and individuals centrally involved in implementing (and even managing) regional transformation efforts have never before been involved in a grant from a federal agency, much less a grant from ETA. Workforce professionals in some regions, who have been working with ETA for many years, were surprised by the amount of education these organizations required in order to implement activities funded under the grant. For example, the California Workforce and Labor Agency worked in partnership (often on a daily basis) with CSA to fill in the gaps in CSA’s knowledge about how the state’s workforce programs worked. “It’s a full-time job. They don’t know what DOL will let you do and not let you do,” said one state worker, adding that most of the dozens of partners were not familiar with the workforce system. By the same token, representatives of CSA explained that working with economic development
The Power of Partnerships: American Regions Collaborating for Economic Competitiveness, 2009 Interim Report
B e r k e l e y P o l i c y A s s o c i a t e s
124
organizations in a contract environment was sometimes difficult. “EDCs just weren’t used to working like that,” one CSA employee said.
Summary Notwithstanding the significant challenges noted here, the workforce organizations that serve as implementers or partners have made substantial progress toward transformation of their systems at the local and regional level. In fact, many of the goals articulated in the “Elements of Workforce System Transformation” policy document are quite consistent with the goals of the Generation I regions. Finally, as one respondent noted, “transformation is continuous – the job is never done.” Now that important transformational structures are in place, partnerships are developing, and progress appears to be occurring. The evaluation team will continue to monitor these dimensions of transformation and the challenges involved in implementing them over the final months of the grant’s operations. The trends toward transformation reported here may continue; or perhaps contextual and policy changes will take the workforce system in new and as yet unforeseen directions.

The Power of Partnerships: American Regions Collaborating for Economic Competitiveness, 2009 Interim Report
B e r k e l e y P o l i c y A s s o c i a t e s
125
Chapter 8: Conclusions and Observations The preceding chapters described in detail the progress the regions have made in their collaborative efforts to reinvigorate and transform their regional economies through an integrated approach to economic development and workforce development. These efforts have been significantly affected by the changing context, particularly, changes in overall economic conditions, in the opportunities or constraints existing within specific regions, and in leadership and grant management guidance from ETA. In sum, the Initiative has not been implemented in a vacuum. As the evaluation’s first interim report conveyed, the journey from grant award to the time of the first site visits differed dramatically from one region to another. The regions had extremely diverse starting points with respect to their social and economic histories, their goals, their regional identity, their leaders and partners, their management organizations, their access to non-Initiative funding. The first interim report noted variation also in the “distance” the regions had traveled since startup in their functioning as a region and in collaboration across jurisdictional boundaries and across institutional systems. In contrast, the 2008 evaluation site visits revealed nearly as many similarities as differences in the progress made from region to region. One factor contributing to commonalities across regions may be that regions had attended numerous conferences aimed at propelling regional economic transformation in which they learned from each other and outside experts. Another factor may be the increasing emphasis from ETA on workforce development outcomes and system transformation, which – due to the common funding streams and reporting requirements for the regions – often took somewhat similar forms. ETA’s ambitious goals for the transformation of regional economies are important to understand. Genuine economic transformation involves a lengthy process of repositioning numerous siloed organizations, building trust among previously competitive agencies (and often, leaders), and delivering programs in the near term with transformative effects that are likely to be visible only after many years. For example, shifting a region from a traditional manufacturing economy – such as the auto industry – to a new economic order that is equally robust requires enormous investments, new technologies (and their commercialization), and the time to build new enterprises, as well as a variety of initiatives to ensure management know-how and workforce competency in a new industrial domain. In the short term, documenting business startups, early investments, workforce training, and early job placements in specific companies may be possible; however, the long-term and sustainable effects of transformation on a regional economy are not easily documented in two- to three-year time horizons. As one method of documenting progress toward transformation, Chapter 5 of this report summarizes the employment and training successes that the performance metrics capture. A number of the regions demonstrated successes in training individuals and assisting them to find employment in a position that took advantage of the training they had completed. Regions also
The Power of Partnerships: American Regions Collaborating for Economic Competitiveness, 2009 Interim Report
B e r k e l e y P o l i c y A s s o c i a t e s
126
were successful in launching a variety of innovative programs with a broad range of partnerships with colleges and universities, WIBs, economic development organizations, business and industry, and many, many, others. This evaluation also explores a variety of what may be termed “uncommon measures,” or assessments of social processes and regional dynamics that are still in the process of being broadly acknowledged and accepted as reliable indicators of progress. These qualitative measures include such things as the transformations taking place in the workforce system within the regions; the extent of collaboration across multiple agencies occurring within the region; and the extent of regionalism, which is both a way of thinking – “buying into” regional priorities – and a way of working collaboratively to plan and carry out new programs. Another “uncommon measure” is the evaluation team’s assessment of the long-term sustainability of the gains made in each region, both in terms of programmatic sustainability and in the creation of sustainable regional systems for promoting economic growth. The evaluation team continues to describe the transformation experience as a journey, evaluating the progress each region has made on its unique path toward economic transformation, relative to the place at which it began, and the contextual forces with which it has had to deal. Some summary observations about the twists and turns these journeys have taken are discussed below.
Regionalism The concept of regionalism is central to the overall effort. With an overarching goal of transforming regional economies, the focus of the initiative has been on creating regional clusters of synergistic businesses – primarily in high value-added industries and services – and aligning both public and private resources so as to achieve a unified regional workforce and economic development strategy. As a consequence, an important part of this evaluation has been to track the extent to which the spirit and practice of regionalism is taking hold among the regions. Regionalism is a cultural and identity issue as well as an operational strategy. At the time of the initial site visits, many of the regions were trying to develop or enhance a sense of shared identity; by the second site visits, the issues of “branding” and regional identity had largely been resolved and were no longer prominent in the conversation. The issue of achieving synergy among organizations and agencies with complementary competencies and resources, however, was of more concern. Although, theoretically, regions with a clearly defined identity are the more likely to engage in a wide range of collaborative activities, the evaluation team observed that many regions were finding ways to collaborate across traditional geographic and institutional boundaries, even though a clear, shared identity had not yet been established. This collaboration, often among previously unconnected organizations, represents a promising platform for future development. Within the regions that have accomplished strong collaboration, findings from the second round of evaluation visits suggest that networks have widened and become more diverse. People appear to know many more people than they knew
The Power of Partnerships: American Regions Collaborating for Economic Competitiveness, 2009 Interim Report
B e r k e l e y P o l i c y A s s o c i a t e s
127
beforehand, including professional counterparts in other counties, potential collaborators in other organizations, and, importantly, potential advocates and investors. Many individuals and organizations that engaged in one of the Initiative’s collaborative activities reported the experience as a positive one, adding that it gave them both the knowledge and the trust to repeat the experience in the future. Given the enormous uncertainties that exist in today's economic environment, the rapidity with which new technologies rise and fall, and the rapid changes in market opportunities and conditions, this regional ability to work together could provide a very positive basis for adapting to change in these regions in the future.
Transformation of the Workforce System The transformation of the workforce system has become a high priority for these regions. Chapter 7 of this report summarizes the evaluation team’s findings about the extent to which workforce systems within the regions strove to achieve the types of transformation outlined in ETA’s “The Elements of Workforce System Transformation” (see Figure 7.1). The evaluation team found that transformation of the workforce system was occurring in highly visible ways in some regions and in more subtle ways in others. Not all of the changes can be attributed to the Initiative, however, because state-level efforts to transform the workforce system were taking place at the same time as the Initiative in a number of regions. Some of these projects used strategies such as mandating collaboration across WIBs, while others pursued aligning the workforce system with economic development and other economic growth assets. Thus, a number of workforce institutions were already showing understanding of – and support of – economic development goals even before the grant began. In other regions, regional transformation activities were able to catalyze new models of workforce investment, particularly by turning the attention of the workforce system toward economic development goals, as well as by encouraging partnerships at the regional, rather than local, level. Thinking and acting regionally is an important component of transformation in the workforce system. At least in some portions of each region, the workforce systems in each of the regions are beginning to think regionally and engage in collaborative activities across jurisdictional boundaries. Numerous examples in this report show that collaboration is occurring and that workforce professionals are now less isolated than they previously were from both their counterparts in other local areas and from economic developers, educators, and business and industry from across the region. One of the more promising developments across the regions was the workforce system’s increased focus on talent development. An important example of this is the major involvement of the workforce system in the use of work readiness assessments such as WorkKeys (especially notable in the state of Michigan) and the development of credentials for career readiness and skills attainment. In many regions, site visitors found examples of increasing articulation between the WIBs and K-12 education and training, community colleges, and universities. In Metro Denver, for example, multiple WIBs work with a variety of training organizations to focus
The Power of Partnerships: American Regions Collaborating for Economic Competitiveness, 2009 Interim Report
B e r k e l e y P o l i c y A s s o c i a t e s
128
on training initiatives in “high value added” sectors. Although such collaboration has typically not been led by the workforce (nor the educational) system, the impetus for an integrated vision of talent development was anchored in the regions’ collaborative mechanisms, usually the governance group formed through the Initiative, which had brought together organizations that had never worked together before. The emphasis ETA placed on the workforce system to “serve the innovation economy” appears to have created an incentive for state agencies, state and local WIBs, and other entities in the workforce system to focus their attention on, and align their priorities with, entrepreneurship, new business formation, and – in some few cases – even new technology development. As part of the Initiative, the workforce systems in several regions – for example, Finger Lakes and Maine – participated in programs to help both adults and youth to develop entrepreneurial and business startup skills. Some regions have provided seminars and workshops focused on financing and managing entrepreneurial technology companies. In most of the regions, the workforce system was becoming involved in emerging industries such as alternative energy, clean tech, and green jobs, and, as part of the initiative, began developing training programs for new and incumbent workers for jobs in these and other industries that utilized new technologies in more efficient and globally competitive ways.
Leadership Collaboration in the regions took a variety of forms, beginning with the development of the initial grant proposals, early implementation plans, and in the establishment of governance structures. These governance structures were highly variable at startup, especially in the workforce system’s role. Many of the regions used the first years of their grants to define partnership roles and program priorities, an effort that appears to have been valuable in framing the focus and later activities of the regions. By the time of the second site visits, all of the regions were quite clear about what they could accomplish, governance structures for implementation and – in some cases – sustainability, were well-established, and numerous regional collaborations were underway. Leadership of the initiatives emerged as a significant issue affecting implementation. As Chapter 2 of this report points out, leadership at the federal and state levels clearly set the tone as to what was possible, as well as what was desirable, throughout the life of the Initiative. At the regional level, the evaluation team identified three different types of leadership that were critical to successful implementation of transformative principles in the regions: “championing,” “catalyzing,” and “integrating.” The presence of all three leadership types are essential in order to launch, implement, and sustain new forms of collaboration and keep partners focused on common goals instead of diverging interests. All three leadership types do not necessarily need to be embodied in a single individual or organization, however, and very few of the regions have leaders that have mastered all three. All of the regions have found the leadership they need, sometimes in the person of various key partners, and have engaged a wide range of additional partners to assist in creating fundamental system changes aimed at regional transformation.
The Power of Partnerships: American Regions Collaborating for Economic Competitiveness, 2009 Interim Report
B e r k e l e y P o l i c y A s s o c i a t e s
129
Sustainability The issue of sustainability, which involves not only attitudinal and organizational dimensions but also major investment decisions at all levels, has been central to the Initiative. All of the regions stated their clear intention to use the grant as the foundation for regional economic transformation, not as a one-time funding source for program implementation. In addition, the early guidelines provided by the ETA, and the ongoing monitoring of performance over time by ETA regional leads, emphasized the importance of building new sustainable models of regional dialogue, planning, and implementation of initiatives to produce economic transformation through integrated talent development and business development efforts. By the second site visit, more clarity existed about the directions in which the various regions were approaching planning for sustainability. Chapter 5 reports on sustainability in terms of four dimensions. The first dimension is described as philosophical sustainability, meaning a new way of thinking about the relationships and strategies that can potentially enhance competitiveness and economic growth at the regional level. While this type of sustainability is the most diffuse and hardest to measure, it may actually be the most durable because the ideas have become second nature to the partners and will become part of the culture of the region. The second dimension is relational sustainability, which is truly at the heart of the transformation concept, because it focuses on the growth of boundary spanning relationships across traditionally siloed jurisdictional, geographic, and institutional entities. The third dimension is institutional sustainability, which is about new organizational models involving new mechanisms for integrating the workforce system with economic development, education, and other growth-focused entities. In several regions – such as Kansas City, Metro Denver, Northwest Florida, and West Michigan – regional organizations that became the home organization for the initiative existed prior to the grant and evolved because of it. These organizations are positioned to continue beyond the grant period many of the workforce, economic development, and talent development activities implemented by their respective initiatives. In other regions – such as Mid-Michigan and Finger Lakes – regional civic organizations developed simultaneous with the Initiative, and are expected to be the home for continuing initiative-related activities. The final dimension is programmatic sustainability, which has to do with new and creative workforce development, talent development, and economic development activities that are predicted to remain operational long after funding ends. All of the regions have articulated a commitment to sustaining many of these integrative talent development and entrepreneurial support programs. In sum, sustainability is playing itself out in different ways in different locales, but clearly the majority of the regions have discovered the benefits of regionalism, collaboration, and leveraging complementary competencies and resources in important ways.
Next Steps As they come to the end of their federal funding in January 2010, the next steps for the regions are to continue expanding their partnerships, use the relationships and collaborative mechanisms that they have formed through the grant as a basis for collaboration in support of other activities, and continue their journey toward a new economy. As one respondent noted, “Transformation is continuous – the job is never done.”

The Power of Partnerships: American Regions Collaborating for Economic Competitiveness, 2009 Interim Report
B e r k e l e y P o l i c y A s s o c i a t e s
130
The evaluation’s next steps include surveying the regions’ partners to capture as complete a picture of the Generation I social networks as is possible. The research team will conduct this survey twice: once in late Summer 2009, and again in Fall 2010, approximately six months after the grants have ended. In Fall 2009, the evaluation team will conduct a final round of visits to each of the regions. Interviews during these visits will again examine changes in the workforce system and focus on transferable lessons learned and the sustainability of the initiatives’ philosophies, relationships, programs, and institutional influences. The research team will continue collecting existing data from various data sources to assess any economic changes that the initiatives may have inspired in their communities. Because the true impacts of the grants on their regions may not be apparent for another ten years, the evaluation’s final report will summarize this data for the longest possible observation period within the evaluation. As Chapter 6 discussed, the research team will consider leading as well as other types of indicators to examine whether progress or changes can be attributed to the grants. Finally, the evaluation’s Final Report will summarize the findings from these data collection efforts; the report’s tentative date of availability is in Spring 2011.


![[In]Sights for Competitive Regions: Innovation · [In]Sights for Competitive Regions: Innovation October- 2015 7 Innovation and Competitiveness in Regional Australia Figure 1 shows](https://static.fdocuments.us/doc/165x107/5f05a17f7e708231d413eb88/insights-for-competitive-regions-insights-for-competitive-regions-innovation.jpg)