The potential benefits of Green Water Credits Part 1: Quantifying the role and advantages for...
20
The potential benefits of Green Water Credits Part 1: Quantifying the role and advantages for upstream farmers Johannes Hunink Peter Droogers Wilco Terink Sjef Kauffman Godert van Lynden
-
Upload
maryann-watson -
Category
Documents
-
view
218 -
download
0
Transcript of The potential benefits of Green Water Credits Part 1: Quantifying the role and advantages for...

The potential benefits ofGreen Water Credits
Part 1: Quantifying the role and advantages for
upstream farmers Johannes HuninkPeter Droogers
Wilco TerinkSjef Kauffman
Godert van Lynden

First: the basic principles1) Water always flows downhill2) So do sediments and nutrients It follows that land/water management upstream:
a) Can positively influence food security upstream b) Can positively influence water supply downstream

Quantifying GWC
Water Demand?
Water Consumption?
Water Supply?
Impact Changes?
Productive Use?
Soil Water Conservation impact?

Example of potential benefits

WHAT to quantify?
• Supply Biophysicial assessment
• Supply vs. Demand Cost-benefit analysis
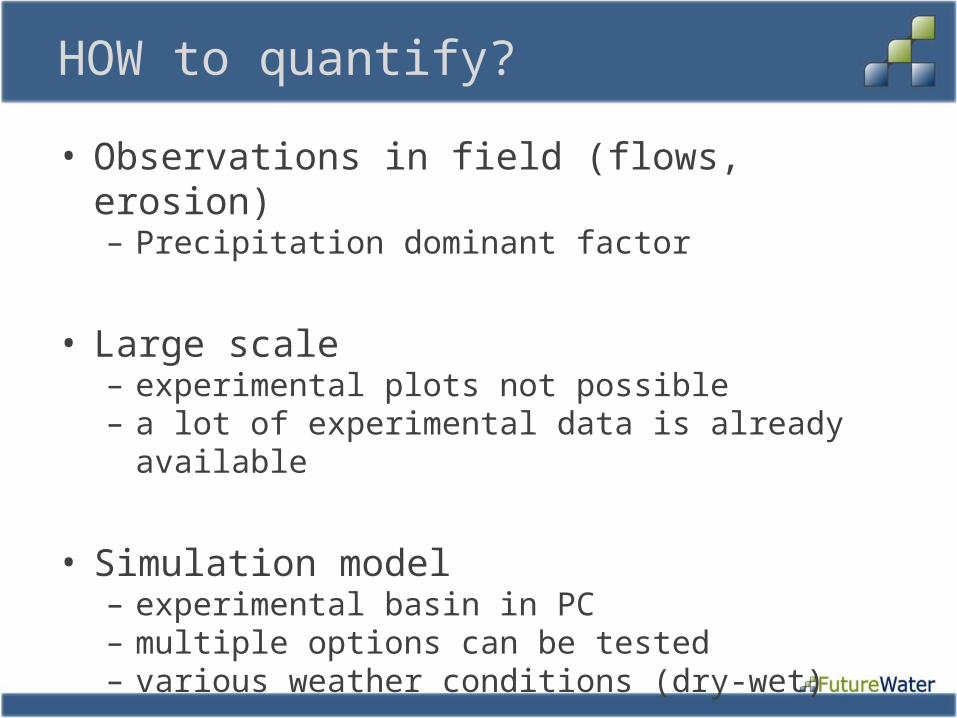
HOW to quantify?
• Observations in field (flows, erosion)– Precipitation dominant factor
• Large scale– experimental plots not possible– a lot of experimental data is already available
• Simulation model– experimental basin in PC– multiple options can be tested– various weather conditions (dry-wet)

RIVER BASIN SOIL AND WATER CONSERVATION


Methodology
• Hydrological models as a tool to simulate the paths of water and soil movement
• Upstream-downstream interactions

Methodology
• Soil and Water Assessment Tool (SWAT)
• Physically based• Focus on water-erosion-land
management processes• Public domain• Large user-group worldwide• Successfully applied in many
other studies worldwide as well as in Kenya

Data
Elevation
Landuse
SoilsClimate

Model Reliability

Selection of GWC options
• 11 options explored• Bench terraces• Conservation tillage • Contour tillage• Fanya Juu terraces• Grass strips• Micro-catchments for planting fruit trees• Mulching• Rangelands• Ridging • Riverine protection• Trash lines
• Labor: intensive vs. extensive• Investment: low vs. high• Implementation on 20% of area ~ 100,000 farmers

Results: temporal
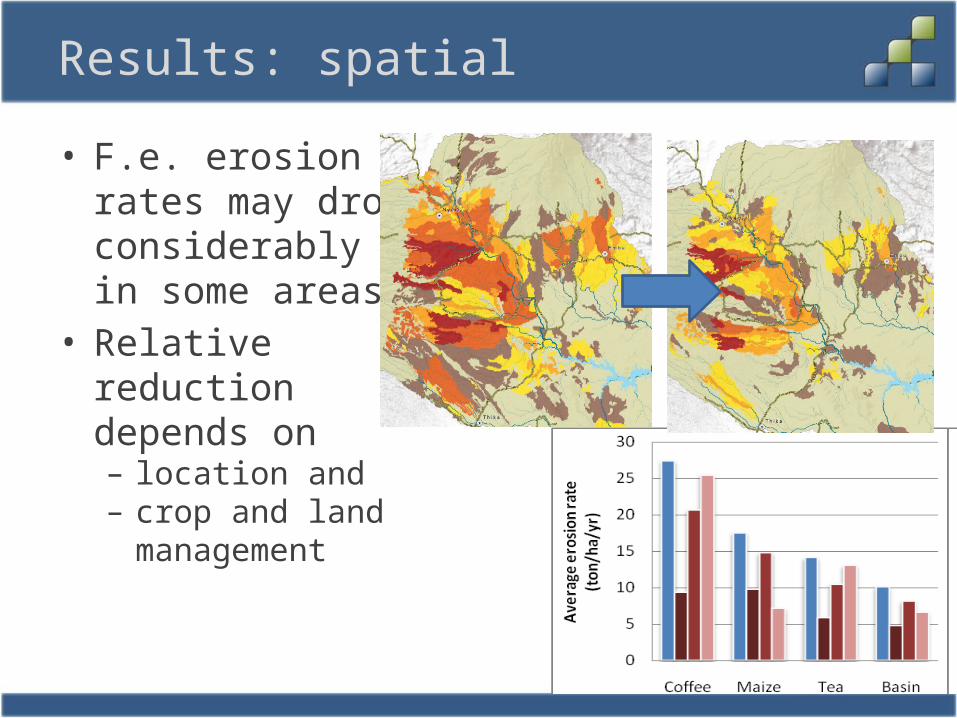
Results: spatial
• F.e. erosion rates may drop considerably in some areas
• Relative reduction depends on – location and – crop and land
management

Results: Spatial
targeting

Results: Key Indicators
• Upstream– Crop transpiration– Soil evaporation– Groundwater recharge– Erosion
• Downstream– Inflow Masinga– Sediment load Masinga
• Climate– dry (2005)– wet (2006)
Results: Key Indicators
Inflow Masi
nga
Sedim
ent inflow M
asinga
Crop tr
ansp
iration
Soil e
vaporation
Groundwate
r rech
arge
Erosio
n
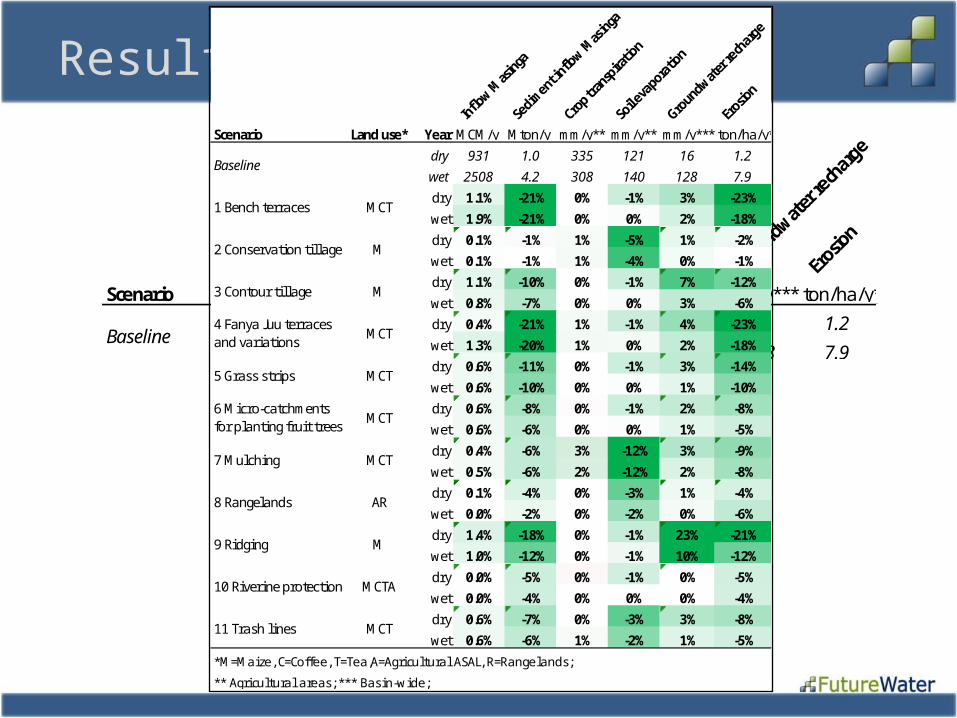
Scenario Land use* Year MCM/y Mton/y mm/y** mm/y** mm/y*** ton/ha/y***
dry 931 1.0 335 121 16 1.2
wet 2508 4.2 308 140 128 7.9
dry 1.1% -21% 0% -1% 3% -23%
wet 1.9% -21% 0% 0% 2% -18%
dry 0.1% -1% 1% -5% 1% -2%
wet 0.1% -1% 1% -4% 0% -1%
dry 1.1% -10% 0% -1% 7% -12%
wet 0.8% -7% 0% 0% 3% -6%
dry 0.4% -21% 1% -1% 4% -23%
wet 1.3% -20% 1% 0% 2% -18%
dry 0.6% -11% 0% -1% 3% -14%
wet 0.6% -10% 0% 0% 1% -10%
dry 0.6% -8% 0% -1% 2% -8%
wet 0.6% -6% 0% 0% 1% -5%
dry 0.4% -6% 3% -12% 3% -9%
wet 0.5% -6% 2% -12% 2% -8%
dry 0.1% -4% 0% -3% 1% -4%
wet 0.0% -2% 0% -2% 0% -6%
dry 1.4% -18% 0% -1% 23% -21%
wet 1.0% -12% 0% -1% 10% -12%
dry 0.0% -5% 0% -1% 0% -5%
wet 0.0% -4% 0% 0% 0% -4%
dry 0.6% -7% 0% -3% 3% -8%
wet 0.6% -6% 1% -2% 1% -5%
*M=Maize, C=Coffee, T=Tea,A=Agricul tura l ASAL, R=Rangelands ;
** Agricul tura l areas ; *** Bas in-wide;
Baseline
Inflow Masi
nga
Sedim
ent inflow M
asinga
Crop tr
ansp
iration
Soil e
vaporation
Groundwate
r rech
arge
Erosio
n
Scenario Land use* Year MCM/y Mton/y mm/y** mm/y** mm/y*** ton/ha/y***
dry 931 1.0 335 121 16 1.2
wet 2508 4.2 308 140 128 7.9
dry 1.1% -21% 0% -1% 3% -23%
wet 1.9% -21% 0% 0% 2% -18%
dry 0.1% -1% 1% -5% 1% -2%
wet 0.1% -1% 1% -4% 0% -1%
dry 1.1% -10% 0% -1% 7% -12%
wet 0.8% -7% 0% 0% 3% -6%
dry 0.4% -21% 1% -1% 4% -23%
wet 1.3% -20% 1% 0% 2% -18%
dry 0.6% -11% 0% -1% 3% -14%
wet 0.6% -10% 0% 0% 1% -10%
dry 0.6% -8% 0% -1% 2% -8%
wet 0.6% -6% 0% 0% 1% -5%
dry 0.4% -6% 3% -12% 3% -9%
wet 0.5% -6% 2% -12% 2% -8%
dry 0.1% -4% 0% -3% 1% -4%
wet 0.0% -2% 0% -2% 0% -6%
dry 1.4% -18% 0% -1% 23% -21%
wet 1.0% -12% 0% -1% 10% -12%
dry 0.0% -5% 0% -1% 0% -5%
wet 0.0% -4% 0% 0% 0% -4%
dry 0.6% -7% 0% -3% 3% -8%
wet 0.6% -6% 1% -2% 1% -5%
*M=Maize, C=Coffee, T=Tea,A=Agricul tura l ASAL, R=Rangelands ;
** Agricul tura l areas ; *** Bas in-wide;
11 Trash lines
Baseline
1 Bench terraces
2 Conservation tillage
3 Contour tillage
4 Fanya Juu terraces and variations
5 Grass strips
6 Micro-catchments for planting fruit trees
7 Mulching
8 Rangelands
9 Ridging
10 Riverine protection
MCT
M
M
MCT
MCT
MCT
MCT
MCT
AR
M
MCTA

Results: Increase in Benefits

The potential benefits ofGreen Water Credits
Part 2:Quantifying profits for
downstream water usersPeter Droogers
Wilco TerinkJohannes Hunink
Sjef KauffmanGodert van Lynden