
Parleremo English-Portuguese Portuguese-English Dictionary 1ed
The Portuguese Tomato Processing sector: market structure, concentration and firm behaviour
Maria de Fátima Martins and Lorena De Oliveira [email protected]
Paper prepared for presentation at the I Mediterranean Conference of Agro-Food Social Scientists. 103rd EAAE Seminar ‘Adding Value to the Agro-Food Supply Chain in the Future Euromediterranean Space’. Barcelona, Spain, April 23rd - 25th, 2007 Copyright 2007 by [Maria de Fátima Martins and Lorena De Oliveira]. All rights reserved. Readers may make verbatim copies of this document for non-commercial purposes by any means, provided that this copyright notice appears on all such copies.
The Portuguese Tomato Processing sector: market structure, concentration and
firm behaviour
Maria de Fátima Martins Lorena DE OLIVEIRA1
Abstract
The purpose of this paper is to study the evolution and the structure of the Portuguese
processing tomato industry. We intend to pick up the dynamics, the strategic behaviour and
structural the changes in the tomato industry in Portugal during the period of 1990-2005. An
overview of world and domestic production and trade in the last two decades is followed by
the descriptive analysis and by the development of the market structure. The market structure
analysis was carried out during 1990 - 2002, under the Structure-Conduct-Performance
framework. This paper examines the concentration effect on the performance and firm’s
strategy. The result indicates that, market concentration in tomato processing industry in
quantity is a moderate concentrate market but the concentration level has increased over the
years. In contrast the seller concentration has always been higher. The CR4 and HHI ratio
indicates values between 75% - 91% and between 0.20-0.30 respectively. On some years, the
power market measured by an approximation to the index Lerner indicates negatives values
resulting from the negative net income. The results of the Index Lerner below 0,06, indicate,
that the firms lacks market power. We did not find linkage between the market share and
R&D expenses. Marketing costs are concentrated in four biggest companies but the
concentration increase didn’t change the marketing costs evolution and profits. The use of
market share on advertising or research development is not observed.
Key-Words: Tomato processing industry; Concentration; Firm Strategy; market
power; Competitiveness
1 Professor of Agricultural Economics
CERNAS/Escola Superior Agrária, Institute Polytechnic of Coimbra
Address: Departamento de Ciências Sociais e Humanas, Escola Superior Agrária, Bencanta 3040-316
– Coimbra, Portugal Telf:+ 351 239 802 940 Fax: +351 239 802 979, E-mail: [email protected]
1
The Portuguese Tomato Processing sector: market structure, concentration and firm
behaviour
1. Introduction
This paper examines the strategic behaviour of processed tomato industry in Portugal in the
last two decades. The structure of the paper is as follows. Firstly, we outline both some theoretical
considerations and a framework that bear upon the problem. Secondly, we summarize the evolution
of the processed tomato sector to demonstrate the crucial importance of the tomato sector on the
agro-food Portuguese industry and the role of the world tomato situation on the Portuguese tomato
sector. Finally, we intend to pick up the dynamics of industry, the strategic behaviour and the
structural changes in the agro-food sector in Portugal during a period of twenty years under the
Structure -Conduct-Performance (SCP).
The traditional approach in Industrial Organization (IO) is known as the SCP paradigm.
Economists, as Bain (1951) have examined performance differences among private manufacturing
industries based on the SCP paradigm and assume that there is a stable, causal relationship between
the structure of an industry, firm conduct and market performance (Church and Ware. 2000, pp.
425). The SCP model predicts that the structure of an industry indirectly affects its performance
through its impact on the market conduct. Since conduct is difficult to observe directly, the focus is
on identifying market structure elements such as firm’s size (market concentration of sellers) and
tested their impact, on profitability, on market power1 and on strategic behaviour (Collins and
Preston, 1969; Weiss, 1974; Bradburd and Over, 1980). Most of these studies have found out that
industry profits are higher in more concentrated markets. The SCP paradigm predicts that if there
are only a few firms in a market and if there are entry barriers, then these firms may collude to raise
the product price and their profits. However, in the last decade a number of studies have
demonstrated that, correlations between profitability and concentration are spurious.
Recent studies suggest that the relationship between profitability and concentration is
1 Market power refers as the ability of a firm (or group of firms) to profitability raise and maintain price above the
marginal cost. The exercise of market power leads to reduced output and loss of economic welfare
2
discontinuous and found critical level of concentration where changes in concentration above or
bellow this had little effect on the structure-performance. A positive relationship between
advertising intensity, research and development2 (R&D) and increases in profitability has been
found. Studies on the SCP have developed and the differences on results showed the need to
introduce other explanatory variable. A variety of additional variables determining profitability is
tested to explain profit differences across firms and industries such as product differentiation,
foreign trade, and growth rate of market demand. To describe the structure of an industry we need a
measurement tool that takes into account both the number and the size distribution of firms in a
market, and presents the result in a form simple enough that it esay to interpret (Caves, 1992, pp. 8).
Two measures of seller concentration are the most widely used in SCP: the Four-Firm
concentration ratio (CR4) and the Herfindahl-Hirschman Index (HHI). The CR4, which consists of
the market share, as a percentage, of the four largest firms in the industry and changes in CR4 ratios
is widely used to summarise indicators of structural change. The HHI, is a measure of the size of
firms in relationship to the industry and an indicator of the amount of competition among them. It is
defined as the sum of the squares of the market shares of each individual firm (H=∑=
n
i 1Si
2, where
Si is the market share of firm i in the market, and n is the number of firms). Decreases in the HHl
index generally indicate a loss of pricing power and an increase in competition, whereas increases
imply the opposite. A HHI index <0.1 indicates an unconcentrated index, a H index between
0.1<HHI<0.18 indicates moderate concentration. A HH index above 0.18 indicates high
concentration: The CR4 do is not ajust as HHI does for variation in firm size. The HHI reflect the
larger variation in relative firm size even thought the number of firms is greater (Church and Ware,
2000, pp. 429).
To measure the profitability we shall applies to the Sales and Equity Capital Profitability. To
measure the market power an approximation for the Lerner index will be applied. The Lerner Index
2 Estimates of the effects barriers entry (measures of entry barriers are based on advertising or research and
development) on profitability are more robust and significant than for concentration (Church and Ware, 2000, p.431).
3
facing by firm i, can be defined as Li = (Pi - MCi)/Pi, where P is the Price and MC the firm’s
marginal cost, i. e P-MC is firm’s profit margin. When P = MC, the Lerner Index is zero and the
firm has no market power. A Lerner Index closer to 1 indicates relatively weak price competition
and the firm has market power. Nevertheless, since accounting data on marginal cost is not usually
available there are several approximations for the Lerner Index. An alternative is to measure the
market power through the price-cost margin [PCM = (Sales Revenue – Payroll Costs – Cost of
Material)/ Sales Revenue] (Church and Ware, 2000, p. 435). If the marginal cost is constant, due to
constant returns to scale (technology is characterized by constants returns to scale), we can multiply
both members of the Lerner ratio by the Q (quantity or output) we find that Li=[[[[(P - MC)*Q/
(P*Q)]]]] ⇔⇔⇔⇔ Li =[[[[(P*Q – MC*Q)/ (P*Q)]]]] ⇔⇔⇔⇔ L =[[[[Sales revenue – operational costs /Sales
Revenues]]]] ⇔⇔⇔⇔ Li= [[[[Net income/Sales Revenues]]]] .On the other hand, if the technology there are not
constant returns to scale (for example are significant fixes costs), the Lerner index can be written as
Li = [[[[Net income- Variable costs/Sales Revenues]]]] (Cabral, pp.28-29). In this work we assumes
that, tomato processing industry is characterized by constants returns to scale and we sell apply to
the approximation of Lerner index= Net income/Sales. The Lerner index facing by the industry is a
weighted average of each firm’s Lerner index, and it can be written as: L= ∑=
n
I 1
Li* Si, where Si is
the market share.
2. The tomato processed industry in Portuguese food industry
The industry of tomato for processing is one the most important sectors in agro-food
Portuguese industry. In value, the processed tomato industry represents, 1,2% of the food and
beverage industry and 30,8% of the fruit and vegetables processed sector (average value between
1993/04). In figure1, we observe the evolution of the tomato processing industry in the food
industry. In more recent years, the food and beverage industry has shown stability (growth annual
rate of 0.76% between 1993(05) and 2002(04) centred average), and represents about 6 % (average
of 2001/03) of the Portuguese exports. Exports and imports have grown at the same level (the
4
growth rate of food and beverage in current value (constant value) was 6.9% (3.0%) and 6.7%
(2,8%) for the exports and imports, respectively between 1993(05) and 2002(04) (centred average).
Processed tomato products are the main exports of the fruit and vegetable processing sector
(represents 5% of the production and exports of the food industry, in value) and nearly all the
Portuguese production is oriented for exportation.
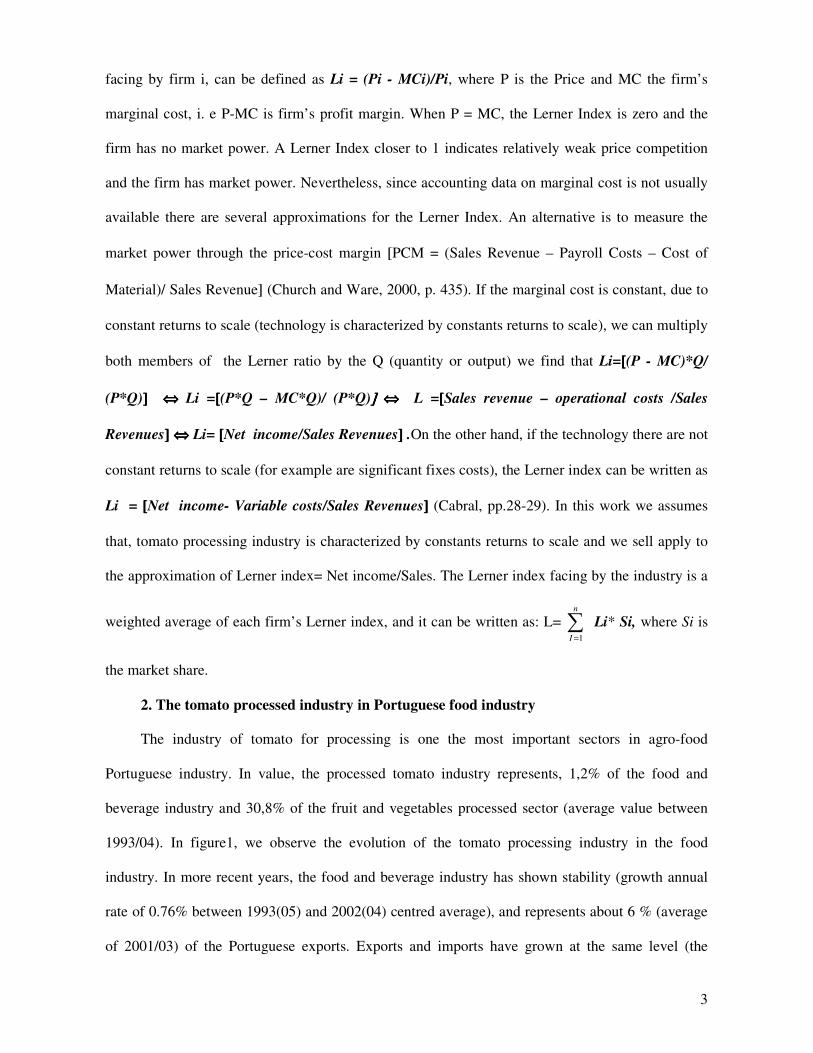
Figure 1. Value of the Portuguese food industry and tomato products in current and constant
values (103 Euros)
0
500
1000
1500
2000
2500
3000
3500
4000
1993 1994 1995 1996 1997 1998 1999 2000 2001 2002 2003 2004
Mill
ion E
uro
s
0
20
40
60
80
100
120
140
Mill
ion E
uro
s
Food and Beverage products imports (current value) Food and Beverage products exports (current value)
Food and Beverage products exports (constant value)
Tomato processed exports (current value) Tomato processed exports (constant value)
Production of Tomato processed prod. (current value) Production of Tomato processed prod. (const. value)
Source: INE
The value weight of tomato products in vegetable and fruit processed production has
decreased from 33% in 1997 to 25% in 2004, at the same time the weight of tomato exportation on
the tomato products production and in food and beverage exportation has decreased from 81% to
75% and 5,9% to 4,6%, respectively between 1997 and 2004. Despite the importance and the role of
the tomato processed sector in domestic and in international agro-food industry, this sector has only
an annual growth rate of -0,29% for a weigh of 1,23% in the food industry value production.
3. The world tomato processing industry
The production of tomatoes for processing rose from 21.159 in 1989 to 35.216 thousand
metric tonnes in 2005 (for.). This represents a growth rate of 25% and 37% if we apply the centred
average (annual growth rate of 2,2% in centred averages). The development of the World

5
production is, not only due to the production increase of traditional suppliers European Union (EU),
United States of America (USA) and Turkey, but it is also due to the entry of new suppliers such as
China. Between 1989 and 1999, China represented around 3% of the world’s production but this
value has increased to 10% in 2005. China’s annual growth rate between 1989(91) and 2003(05)
was about 23% for a weigh of 11% (centred average 2003/05) in the world production, but in
2005/06 the exports of tomato paste have only progressed 2%. This is a very poor result for a sector
more used to spectacular annual increases in previous years (Tomatoland, 2006). In the EU it is
important to observe the industry’s development in some countries, such as Italy and Spain: In
2005, Italy accounted for about 17% of the world’s production and 55% of the EU’s production.
This value remained stable and Italy relative position in the world between 1989 and 2005 hasn’t
changed. Italy, in spite of its highest production has an annual growth rate of about 3%. Spain is
another important producer in the EU, and its relative position has become more and more
important in the last few years and it is the EU country with the higher annual growth rate. Between
2003/05 the average production was 2.283 thousand tonnes (23% of EU production), but in the
marketing year of 2005/06 the Spanish production were drops due to the effects of the subsidy
penalties derived from the overshooting of the national production quota in previous years. Portugal
has an annual growth rate of 2,5% for a weight of 10% in the EU production and represents about
3% and 11% of the world and of the European production, respectively. The Portuguese relative
position in the world tomato for the processing sector remained stable between 1989 and 2005.
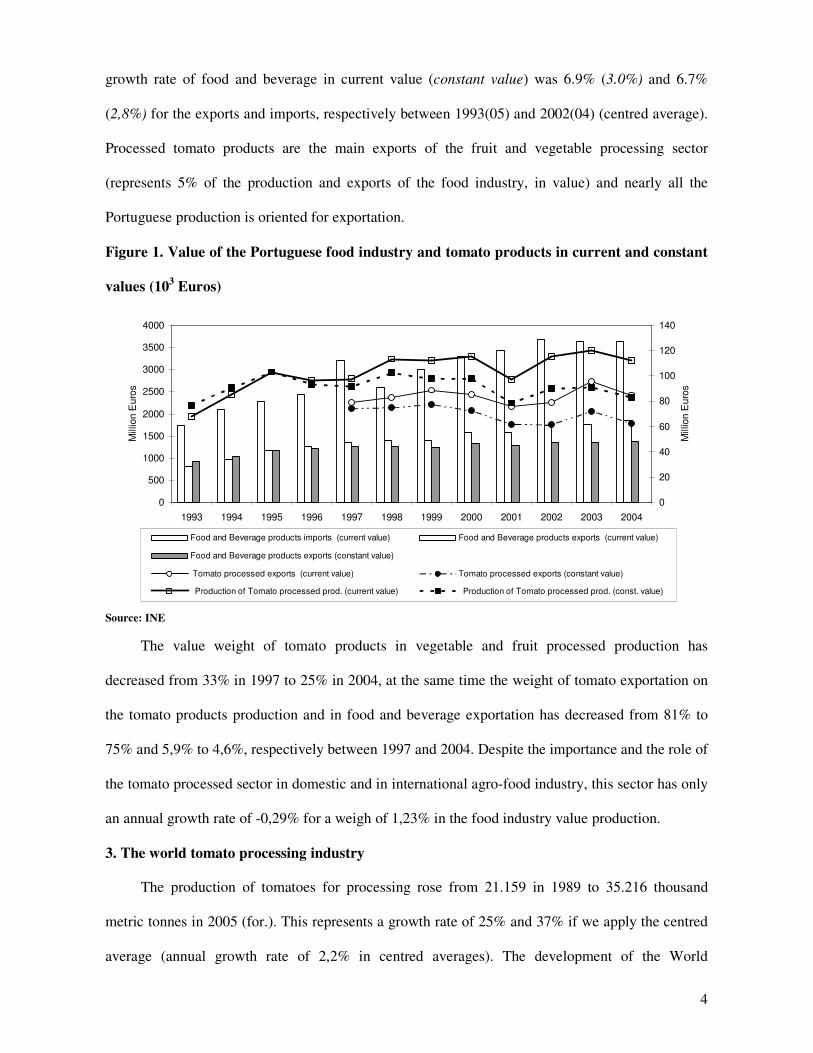
According to the FAO database the world exports rose 174% since 1980 and 82% since
1990 in quantity (annual growth rate of 4,7%, centred average ) while in value the exports rose 229
% and 49% since 1980 and 1990, respectively (annual growth rate of 5,6%) in current values
(centred average). Between 2002/04 the tomato paste exports decreased 16% in quantity and the
exports increased 35% in value (Figure 2).
6
Figure 2. Evolution of tomato paste trade by volume and value (in this work the values are in
US $ dollars in current values represented as in FAO Database).
Source: FAO Database
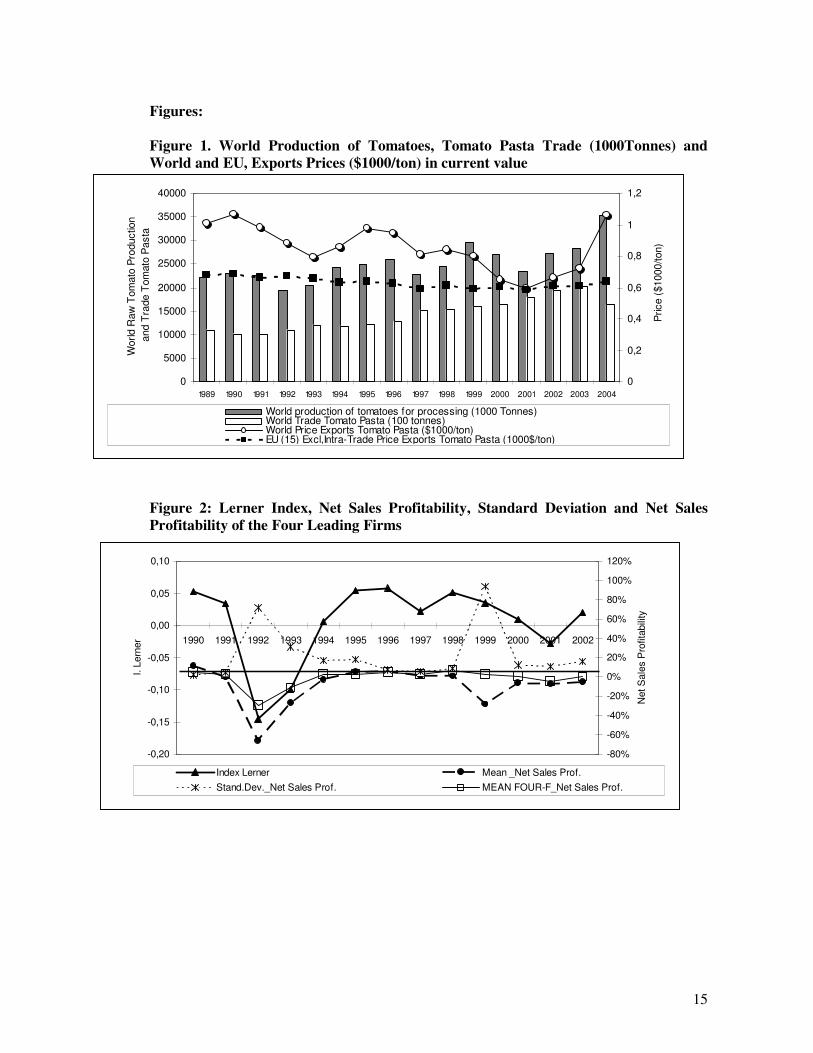
Despite the price decrease of tomato processed trade, after 2001, we observe a change in the
price evolution (Figure 1 on appendix). Therefore, the behaviour of countries such as Spain and
China (increases in tomato processing may further flood the market and continue to drive down
prices), in the last three years (2001 to 2004), the tomato price showed a recuperation while Spain
and China’s production dropped. Globalisation and world legislation have affected not only world
production and trade (relation between Italy and China) but also the relationship between
neighbouring countries such as Portugal and Spain. The behaviour (expansive production) of some
countries such as Spain, China and Turkey in the early 90s shows a cyclical movement but the
equilibrium between countries is set up in the long term.
3. The Portuguese tomato for processing sector
3.1- Production of tomatoes for processing
The bulk of the Portuguese tomato crop is produced under irrigation in the “Ribatejo-e-
Oeste” region. The planted acreage and the production have changed significantly between 1996
and 2005. Since 1999 it has been possible to observe improvements in yields and in production
stability as well as in the increased surface by farmer. The replacement of small farms by modern
farms with more than 15 ha, permits the use of modern technology and irrigation as we referred
0
500.000
1.000.000
1.500.000
2.000.000
2.500.000
1980
1981
1982
1983
1984
1985
1986
1987
1988
1989
1990
1991
1992
1993
1994
1995
1996
1997
1998
1999
2000
2001
2002
2003
2004
Ton.
0
200.000
400.000
600.000
800.000
1.000.000
1.200.000
1.400.000
1.600.000
1.800.000
2.000.000
Valu
e
World Exports - Qty (Mt) Europe Exports - Qty (Mt)
World Exports - Val (1000$)
Europe Exports - Val (1000$) Exports EU (15) Excl,Intra-Trade (Val (1000$)
7
before. In recent years we have seen a slow growth of the production and according to official
sources it will expects the decline of total processing tomato production. In 2004/05 the processed
tomato production was slightly higher than the level of total tomato production processed by
industry, as some of the local production is processed in Spain. In November 2000 the EU approved
changes on the Common Agricultural Policy (CAP) and under these changes, the remuneration
producers is made through aid plus free price (price is freely negotiated between PO and
processors). In 2005 the price pay to the producer is less than the minimum price in 1978 (in current
value). Between 2000/05 the producer price decreased 19,5% (annual growth rate -4,2%. ).
3.2. Processing tomato for industry
The aim of this section is to analyze the relations between the SCP elements. The focus will
be in market structure measured by the concentration ratio. The market power and the firm’s
performance will be analysed. The numbers present in this industry decreased from 25 firms to 11
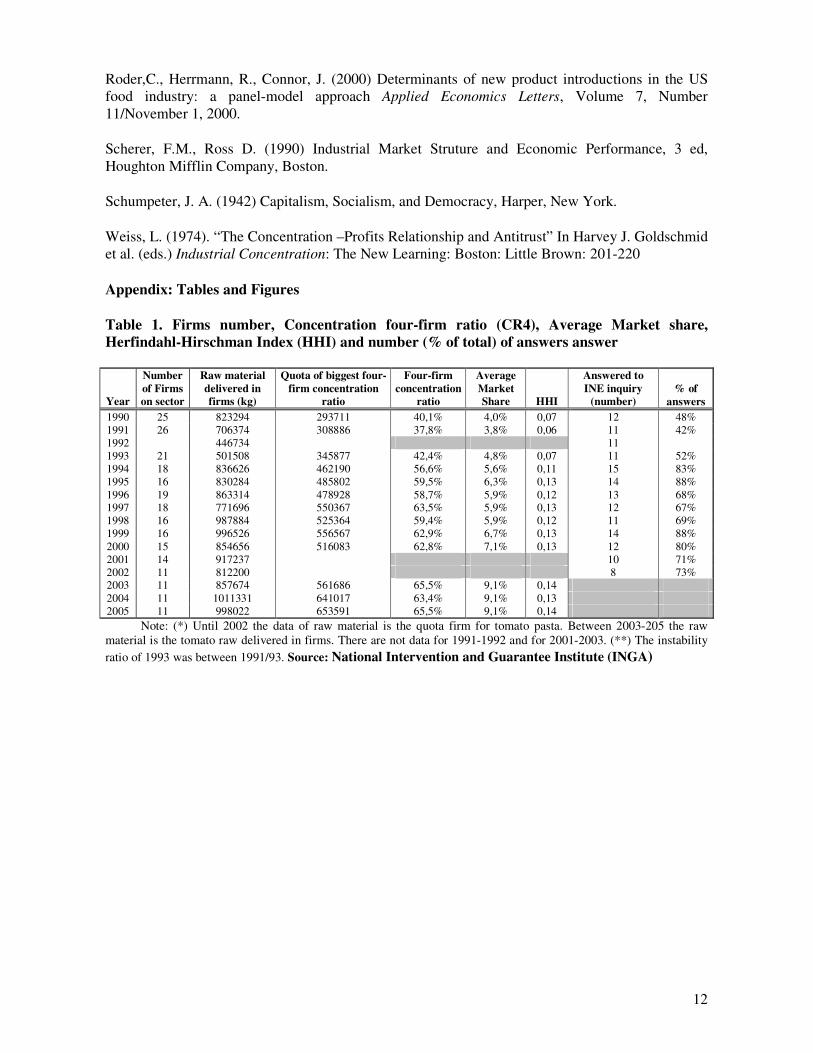
firms and have found some stability in the last three years. On table 1 (appendix), we observe an
exponential increase of the raw tomato delivered by firm and this is essential due to the decrease of
the firm number and not to the production increase. The increase of the concentration quota on the
four biggest firms is visible. The quota of the four leading enterprises (built with the quota and with
the raw tomato delivered in firm), has increased from 40 % to 65 % between 1990 and 2005, which
indicates a strong concentration, but after 2001 it is possible to observe stability. The evolution of
the HHI ratio is similar (Table 1 on appendix).
The analyses carried out, with the above cited pointers is criticisable because the quotas are
expressed in terms of installed capacity and the analysis of the concentration depends on the
production capacity used. Only in the case where the use of the installed capacity is equal between
the different firms can the analyse of the concentration provide a correct idea of the concentration in
production terms (Barros, 1999, pp. 55). Tomatoes for processing are under the Common
Agricultural Policy and until 2000 the subsidy was delivered to the processors. In this moment the
production subsidy is provided directly to the growers via producer organizations (POs) rather than
8
to processors. For this reason it is reasonable to suppose that the installed capacity will be similar
between different firms.
The data for the firm’s analysis come from a longitudinal file of manufacturing firms that was
built upon the Annual Manufacturing Industry Survey carried out by the National Institute of
Statistics (INE). For this study we used the dataset of the firms whose main activity is “processing
tomato” (Vegetables and fruit processed: exclusion of processed potatoes and fruit juices: CAE
1533). The results of this survey were chosen for this study because of their high answer rate and
truthfulness, based on the accounting sheets (Table 1 on appendix). From 1990-2002, the average
was 69% and in the last five years the rank was 76% which constitutes a fairly high response rate.
Statistics secret prevents me from revealing the company’s identity as well as comparing the data of
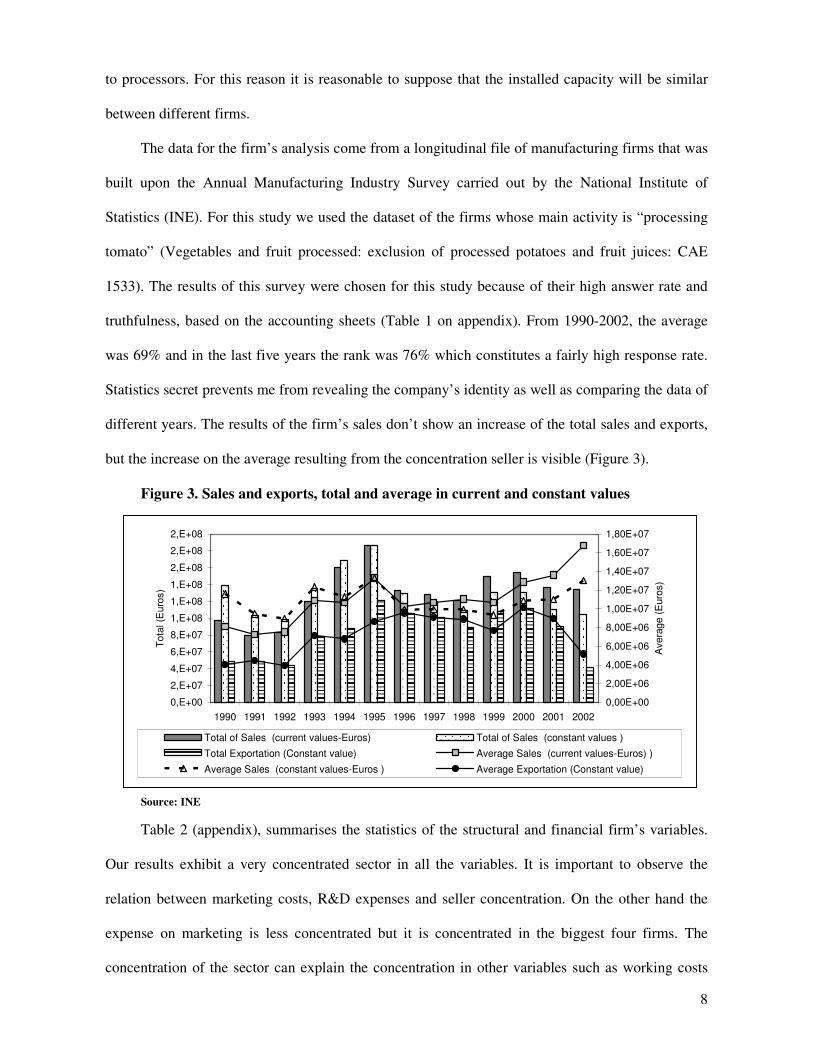
different years. The results of the firm’s sales don’t show an increase of the total sales and exports,
but the increase on the average resulting from the concentration seller is visible (Figure 3).
Figure 3. Sales and exports, total and average in current and constant values
Source: INE
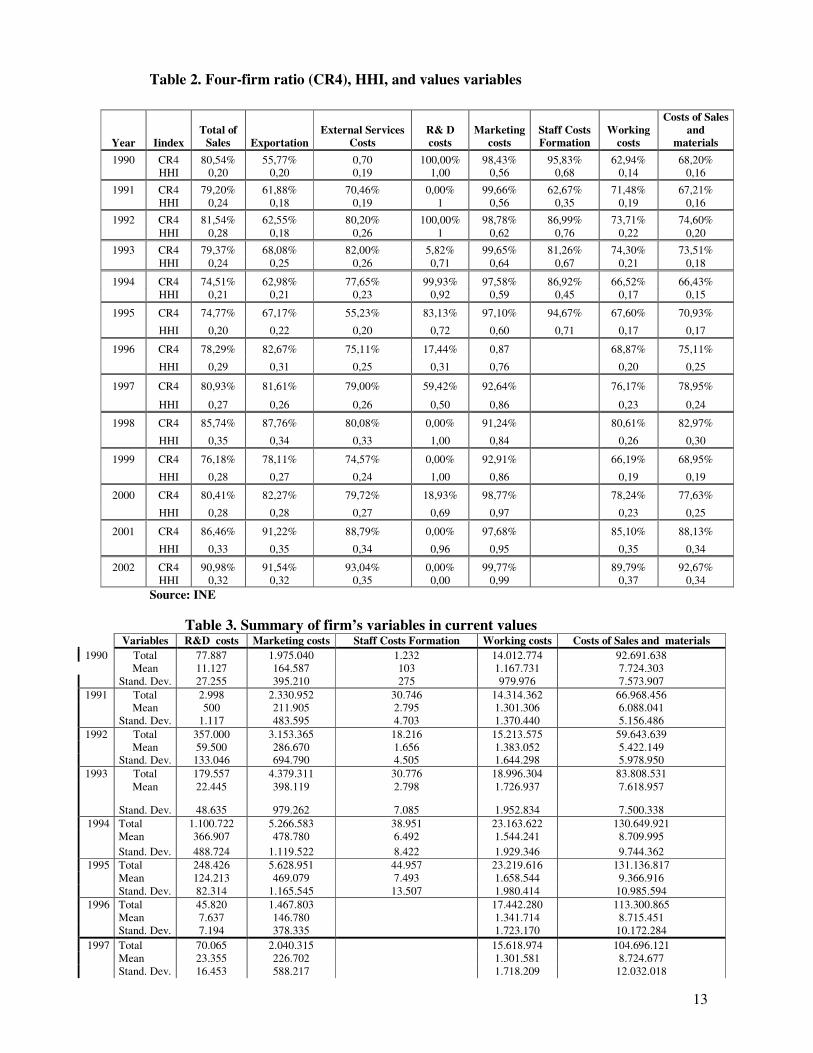
Table 2 (appendix), summarises the statistics of the structural and financial firm’s variables.
Our results exhibit a very concentrated sector in all the variables. It is important to observe the
relation between marketing costs, R&D expenses and seller concentration. On the other hand the
expense on marketing is less concentrated but it is concentrated in the biggest four firms. The
concentration of the sector can explain the concentration in other variables such as working costs
0,E+00
2,E+07
4,E+07
6,E+07
8,E+07
1,E+08
1,E+08
1,E+08
2,E+08
2,E+08
2,E+08
1990 1991 1992 1993 1994 1995 1996 1997 1998 1999 2000 2001 2002
Tota
l (E
uro
s)
0,00E+00
2,00E+06
4,00E+06
6,00E+06
8,00E+06
1,00E+07
1,20E+07
1,40E+07
1,60E+07
1,80E+07
Avera
ge (
Euro
s)
Total of Sales (current values-Euros) Total of Sales (constant values )
Total Exportation (Constant value) Average Sales (current values-Euros) )
Average Sales (constant values-Euros ) Average Exportation (Constant value)
9
and External Services Costs. The decrease on staff costs formation variable it is visible, until this
disappears on sheets accounting. Nevertheless the expense on the strategic variables such as
marketing and research & development has decreased in the period studied. This decline is more
clear on R&D expenses. We observe stability on marketing cost (Table 2, 3, appendix).
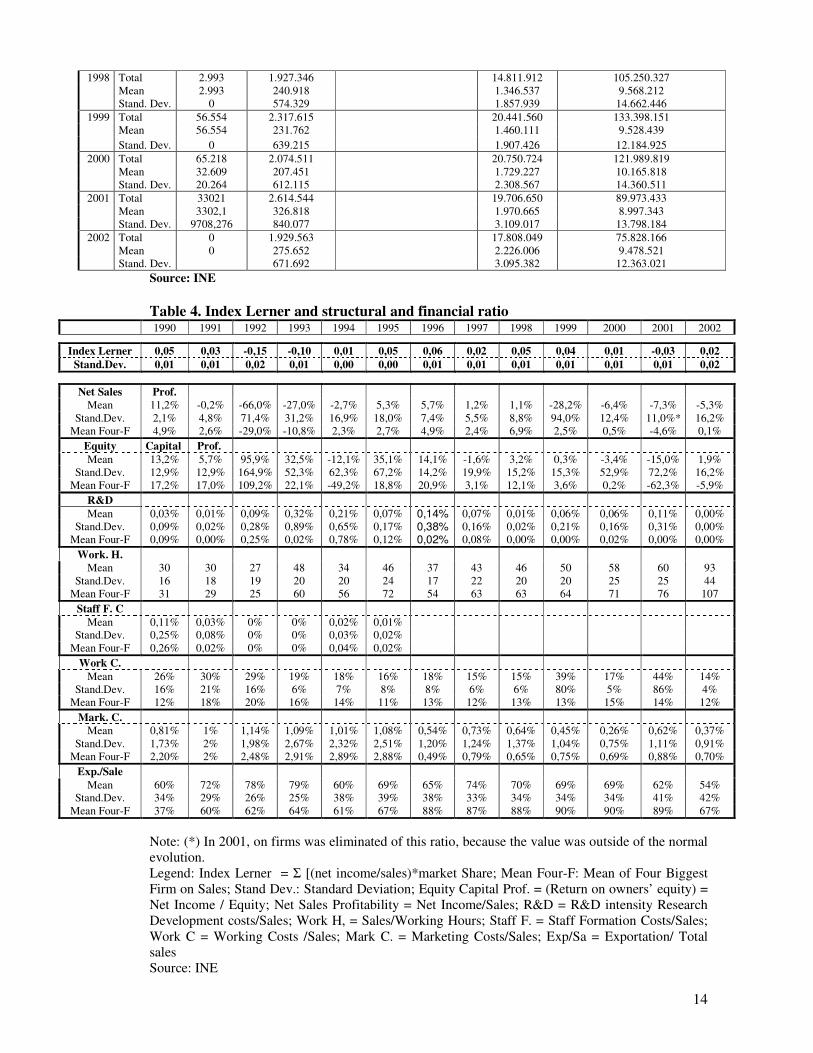
Table 4 and figure 2, appendix clearly indicates that firms have no market power. The Index
Lerner is close to zero, and reveals a negative profitability in some years. Between 1991/ 1994 and
between 1999/2001, we observe a strong decline on the firm’s profitability. This evolution
coincides with the decrease of firm’s number in the same period from 26 to 18 in the first period
and from to 16 to 11 firms, in the second period. The four leading firms seem to have supported
better the period appointed above. The results reveal that it is not possible to find a positive
correlation between concentration and firm’s profit. An accepted question is whether industry
consolidation increased firms’ abilities to generate operating profits. Industry consolidation is
expected to improve efficiency by reducing production costs through greater economies of scale, as
well as by technological innovations through larger R&D investments. There are plausible
hypotheses of a positive as well as a negative impact of the number of firms on new products
introduction. Schumpeter (1942), Dasgupta and Stiglitz (1980) argues that innovations increase
with a declining number of firms. Other authors emphases the importance of oligopolistic market
structures and argue that the relationship between the number of firms and innovation is not linear
(see Scherer and Ross, 1999, pp.637). Roder et al. (2000) finds that new product introductions are
driven by market structure variables and industry-specific characteristics. The number of firms, the
degree of existing product differentiation and the size of the market show a positive influence on the
number of innovations. To sum up, in at least some industries, there are appreciable economies of
scale in several aspects of sales promotion and product differentiation, nevertheless, the product
differentiation or innovation can also cut in opposite direction. Through innovation, smaller firms
may be able to carve out for themselves small but profitably niche market (Scherer and Ross, 1990,
pp. 137).
10
The differences between the CR4 and the HH index measure by the quantity of the tomato
raw processed and measure by the sales firm’s can suggest that, biggest firms’ sales tomato
products with high value added. The differences between the sale price of the biggest firm and the
other firms can explain the differences between these ratios. The declining on R&D and the not
investment on marketing costs can be explained by the quality recognition of the Portuguese tomato
pasta by international market. This thrust on actual buyers and in Portuguese tomato quality can
explain the data evolution, but not justify the low investment on marketing and staff formation.
The demand growth can explain some the market structure changes. Economists have offered
two different scenarios and the answers point in to different directions: The first scenario says if the
market demand grows fast enough that firms can expanding their production capacities, even if new
entrants are coming in, there is little incentive to fight for market share. This scenario brings high
profits. The second scenario assumes that the product is differentiated, and that having market share
this year makes it easier for firm to claim a large market share next year, consequently fast growth
implies more competition and brings low profits. This is a growing market. The general trend is the
increase of differentiated products with high value added, such as sauces, Ketchup and “Other
products” such peeled frozen, peeled crushed and diced, unpeeled whole, unpeeled crushed and
diced, sauces, juice, flakes. If we observe the evolution of the production of Portuguese tomato
products we don’t observe a positive evolution on value added on products. Most tomato products
are tomato pasta. Between 1986 and 2005, 93% of the tomato products are tomato pasta and in last
three years this ratio range between 90 and 95% in 2005 .If we apply to the FAO exports data
between 1980 and 2004 nearly 99% of the Portuguese tomato products exports in value are tomato
pasta. Only between 1989 and 2001 an increase on tomato juice was visible (1% in 1999 of the
value of tomato products exports).
4. Conclusion
The world tomato processing is progressing but this evolution has not apparent effects on the
3 Between 1994/1995 and 2004/05 the apparent consumption of tomato paste in the European Union increased by 66%
from 5.3 to 8.9 million tonnes from 5.3 to 8.9 million tonnes (Tomato News, Dec, 2006)
11
Portuguese tomato industry. It is difficult to draw simple conclusion concerning the relationship
between the market structure and performance, when the firms show a negative net income in
several years. We saw that the Portuguese sales exports didn’t increase as it could be expected in a
growing market, such as the tomato processing market. The declining price in world market can
explain the behaviour and results of some firms. Portuguese firms don’t show a strategic behaviour.
Besides this uncompetitive behaviour, the Portuguese tomato processing industry maintains a stable
position on the world competition. The results don’t indicate any correlation between concentration,
profits and development on strategic variables. The future of this system will be possible if there is
an increase in tomato price through industry with restructuring in the aim to produce higher value
added processed products and reduction of land value in the production costs (Avillez et al., 2004).
The product differentiation is also important because it “expands the market strategies open to the
producers and it makes the firm’s demand less elastic….. The firm’s strategic options also expand,
because it can now react to changing market conditions by changing the traits of the product as well
as its price”. (Caves, 1992, pp.20). The lower strategic firm behaviour, the development of
consumer needs and the development of world tomato products suppliers can put the Portuguese
industry in difficulties and can be dangerous in the future
References
Bain, J.S. (1951), Relation of Profit Rate to Industry Concentration: American Manufacturing,
1936-1940, Quarterly Journal of Economics, Vol.65. No.3, pp.293-324.
Barros, P. (1999), Exercícios de Economia Industrial, McGraw-Hill, Portugal.
Bradburd, R., Over, A. (1980) “Organizational costs , ‘Sticky’ Equilibria and Critical Levels of
Concentration, Review of Economics and Statistics, 64: 50-58.
Cabral, L., (2000), Economia Industrial , McGraw-Hill, Portugal.
Caves, R. (1992), Americam Industry: Struture, Conduct, Perfornance, Havard University.
Church J., Ware, P., (2000) Industrial Organization: A Strategic Approach, McGraw-Hill.
Collins, N.R. and Preston, L.E. (1969), "Price-Cost Margins and Industry Structure", Review of
Economics and Statistics, Vol.51, August , pp.224-242.
Dasgupta P., Stiglitz JE. (1980). Industrial Structure and the nature of innovative activity. Economic
Journal : 90: 266-293.
12
Roder,C., Herrmann, R., Connor, J. (2000) Determinants of new product introductions in the US
food industry: a panel-model approach Applied Economics Letters, Volume 7, Number
11/November 1, 2000.
Scherer, F.M., Ross D. (1990) Industrial Market Struture and Economic Performance, 3 ed,
Houghton Mifflin Company, Boston.
Schumpeter, J. A. (1942) Capitalism, Socialism, and Democracy, Harper, New York.
Weiss, L. (1974). “The Concentration –Profits Relationship and Antitrust” In Harvey J. Goldschmid
et al. (eds.) Industrial Concentration: The New Learning: Boston: Little Brown: 201-220
Appendix: Tables and Figures
Table 1. Firms number, Concentration four-firm ratio (CR4), Average Market share, Herfindahl-Hirschman Index (HHI) and number (% of total) of answers answer
Year
Number of Firms on sector
Raw material delivered in firms (kg)
Quota of biggest four-firm concentration
ratio
Four-firm concentration
ratio
Average Market Share HHI
Answered to INE inquiry
(number) % of
answers
1990 25 823294 293711 40,1% 4,0% 0,07 12 48%
1991 26 706374 308886 37,8% 3,8% 0,06 11 42%
1992 446734 11
1993 21 501508 345877 42,4% 4,8% 0,07 11 52%
1994 18 836626 462190 56,6% 5,6% 0,11 15 83%
1995 16 830284 485802 59,5% 6,3% 0,13 14 88%
1996 19 863314 478928 58,7% 5,9% 0,12 13 68%
1997 18 771696 550367 63,5% 5,9% 0,13 12 67%
1998 16 987884 525364 59,4% 5,9% 0,12 11 69%
1999 16 996526 556567 62,9% 6,7% 0,13 14 88%
2000 15 854656 516083 62,8% 7,1% 0,13 12 80%
2001 14 917237 10 71%
2002 11 812200 8 73%
2003 11 857674 561686 65,5% 9,1% 0,14
2004 11 1011331 641017 63,4% 9,1% 0,13
2005 11 998022 653591 65,5% 9,1% 0,14
Note: (*) Until 2002 the data of raw material is the quota firm for tomato pasta. Between 2003-205 the raw
material is the tomato raw delivered in firms. There are not data for 1991-1992 and for 2001-2003. (**) The instability
ratio of 1993 was between 1991/93. Source: National Intervention and Guarantee Institute (INGA)
13
Table 2. Four-firm ratio (CR4), HHI, and values variables
Source: INE
Table 3. Summary of firm’s variables in current values
Variables R&D costs Marketing costs Staff Costs Formation Working costs Costs of Sales and materials
1990 Total 77.887 1.975.040 1.232 14.012.774 92.691.638
Mean 11.127 164.587 103 1.167.731 7.724.303
Stand. Dev. 27.255 395.210 275 979.976 7.573.907
1991 Total 2.998 2.330.952 30.746 14.314.362 66.968.456
Mean 500 211.905 2.795 1.301.306 6.088.041
Stand. Dev. 1.117 483.595 4.703 1.370.440 5.156.486
1992 Total 357.000 3.153.365 18.216 15.213.575 59.643.639
Mean 59.500 286.670 1.656 1.383.052 5.422.149
Stand. Dev. 133.046 694.790 4.505 1.644.298 5.978.950
1993 Total 179.557 4.379.311 30.776 18.996.304 83.808.531
Mean 22.445 398.119 2.798 1.726.937 7.618.957
Stand. Dev. 48.635 979.262 7.085 1.952.834 7.500.338
1994 Total 1.100.722 5.266.583 38.951 23.163.622 130.649.921
Mean 366.907 478.780 6.492 1.544.241 8.709.995
Stand. Dev. 488.724 1.119.522 8.422 1.929.346 9.744.362
1995 Total 248.426 5.628.951 44.957 23.219.616 131.136.817
Mean 124.213 469.079 7.493 1.658.544 9.366.916
Stand. Dev. 82.314 1.165.545 13.507 1.980.414 10.985.594
1996 Total 45.820 1.467.803 17.442.280 113.300.865
Mean 7.637 146.780 1.341.714 8.715.451
Stand. Dev. 7.194 378.335 1.723.170 10.172.284
1997 Total 70.065 2.040.315 15.618.974 104.696.121
Mean 23.355 226.702 1.301.581 8.724.677
Stand. Dev. 16.453 588.217 1.718.209 12.032.018
Year Iindex Total of
Sales Exportation External Services
Costs R& D costs
Marketing costs
Staff Costs Formation
Working costs
Costs of Sales and
materials
1990 CR4 80,54% 55,77% 0,70 100,00% 98,43% 95,83% 62,94% 68,20%
HHI 0,20 0,20 0,19 1,00 0,56 0,68 0,14 0,16
1991 CR4 79,20% 61,88% 70,46% 0,00% 99,66% 62,67% 71,48% 67,21%
HHI 0,24 0,18 0,19 1 0,56 0,35 0,19 0,16
1992 CR4 81,54% 62,55% 80,20% 100,00% 98,78% 86,99% 73,71% 74,60%
HHI 0,28 0,18 0,26 1 0,62 0,76 0,22 0,20
1993 CR4 79,37% 68,08% 82,00% 5,82% 99,65% 81,26% 74,30% 73,51%
HHI 0,24 0,25 0,26 0,71 0,64 0,67 0,21 0,18
1994 CR4 74,51% 62,98% 77,65% 99,93% 97,58% 86,92% 66,52% 66,43%
HHI 0,21 0,21 0,23 0,92 0,59 0,45 0,17 0,15
1995 CR4 74,77% 67,17% 55,23% 83,13% 97,10% 94,67% 67,60% 70,93%
HHI 0,20 0,22 0,20 0,72 0,60 0,71 0,17 0,17
1996 CR4 78,29% 82,67% 75,11% 17,44% 0,87 68,87% 75,11%
HHI 0,29 0,31 0,25 0,31 0,76 0,20 0,25
1997 CR4 80,93% 81,61% 79,00% 59,42% 92,64% 76,17% 78,95%
HHI 0,27 0,26 0,26 0,50 0,86 0,23 0,24
1998 CR4 85,74% 87,76% 80,08% 0,00% 91,24% 80,61% 82,97%
HHI 0,35 0,34 0,33 1,00 0,84 0,26 0,30
1999 CR4 76,18% 78,11% 74,57% 0,00% 92,91% 66,19% 68,95%
HHI 0,28 0,27 0,24 1,00 0,86 0,19 0,19
2000 CR4 80,41% 82,27% 79,72% 18,93% 98,77% 78,24% 77,63%
HHI 0,28 0,28 0,27 0,69 0,97 0,23 0,25
2001 CR4 86,46% 91,22% 88,79% 0,00% 97,68% 85,10% 88,13%
HHI 0,33 0,35 0,34 0,96 0,95 0,35 0,34
2002 CR4 90,98% 91,54% 93,04% 0,00% 99,77% 89,79% 92,67%
HHI 0,32 0,32 0,35 0,00 0,99 0,37 0,34
14
1998 Total 2.993 1.927.346 14.811.912 105.250.327
Mean 2.993 240.918 1.346.537 9.568.212
Stand. Dev. 0 574.329 1.857.939 14.662.446
1999 Total 56.554 2.317.615 20.441.560 133.398.151
Mean 56.554 231.762 1.460.111 9.528.439
Stand. Dev. 0 639.215 1.907.426 12.184.925
2000 Total 65.218 2.074.511 20.750.724 121.989.819
Mean 32.609 207.451 1.729.227 10.165.818
Stand. Dev. 20.264 612.115 2.308.567 14.360.511
2001 Total 33021 2.614.544 19.706.650 89.973.433
Mean 3302,1 326.818 1.970.665 8.997.343
Stand. Dev. 9708,276 840.077 3.109.017 13.798.184
2002 Total 0 1.929.563 17.808.049 75.828.166
Mean 0 275.652 2.226.006 9.478.521
Stand. Dev. 671.692 3.095.382 12.363.021
Source: INE
Table 4. Index Lerner and structural and financial ratio 1990 1991 1992 1993 1994 1995 1996 1997 1998 1999 2000 2001 2002
Index Lerner 0,05 0,03 -0,15 -0,10 0,01 0,05 0,06 0,02 0,05 0,04 0,01 -0,03 0,02
Stand.Dev. 0,01 0,01 0,02 0,01 0,00 0,00 0,01 0,01 0,01 0,01 0,01 0,01 0,02
Net Sales Prof. Mean 11,2% -0,2% -66,0% -27,0% -2,7% 5,3% 5,7% 1,2% 1,1% -28,2% -6,4% -7,3% -5,3%
Stand.Dev. 2,1% 4,8% 71,4% 31,2% 16,9% 18,0% 7,4% 5,5% 8,8% 94,0% 12,4% 11,0%* 16,2%
Mean Four-F 4,9% 2,6% -29,0% -10,8% 2,3% 2,7% 4,9% 2,4% 6,9% 2,5% 0,5% -4,6% 0,1%
Equity Capital Prof. Mean 13,2% 5,7% 95,9% 32,5% -12,1% 35,1% 14,1% -1,6% 3,2% 0,3% -3,4% -15,0% 1,9%
Stand.Dev. 12,9% 12,9% 164,9% 52,3% 62,3% 67,2% 14,2% 19,9% 15,2% 15,3% 52,9% 72,2% 16,2%
Mean Four-F 17,2% 17,0% 109,2% 22,1% -49,2% 18,8% 20,9% 3,1% 12,1% 3,6% 0,2% -62,3% -5,9%
R&D Mean 0,03% 0,01% 0,09% 0,32% 0,21% 0,07% 0,14% 0,07% 0,01% 0,06% 0,06% 0,11% 0,00%
Stand.Dev. 0,09% 0,02% 0,28% 0,89% 0,65% 0,17% 0,38% 0,16% 0,02% 0,21% 0,16% 0,31% 0,00%
Mean Four-F 0,09% 0,00% 0,25% 0,02% 0,78% 0,12% 0,02% 0,08% 0,00% 0,00% 0,02% 0,00% 0,00%
Work. H. Mean 30 30 27 48 34 46 37 43 46 50 58 60 93
Stand.Dev. 16 18 19 20 20 24 17 22 20 20 25 25 44
Mean Four-F 31 29 25 60 56 72 54 63 63 64 71 76 107
Staff F. C Mean 0,11% 0,03% 0% 0% 0,02% 0,01%
Stand.Dev. 0,25% 0,08% 0% 0% 0,03% 0,02%
Mean Four-F 0,26% 0,02% 0% 0% 0,04% 0,02%
Work C. Mean 26% 30% 29% 19% 18% 16% 18% 15% 15% 39% 17% 44% 14%
Stand.Dev. 16% 21% 16% 6% 7% 8% 8% 6% 6% 80% 5% 86% 4%
Mean Four-F 12% 18% 20% 16% 14% 11% 13% 12% 13% 13% 15% 14% 12%
Mark. C. Mean 0,81% 1% 1,14% 1,09% 1,01% 1,08% 0,54% 0,73% 0,64% 0,45% 0,26% 0,62% 0,37%
Stand.Dev. 1,73% 2% 1,98% 2,67% 2,32% 2,51% 1,20% 1,24% 1,37% 1,04% 0,75% 1,11% 0,91%
Mean Four-F 2,20% 2% 2,48% 2,91% 2,89% 2,88% 0,49% 0,79% 0,65% 0,75% 0,69% 0,88% 0,70%
Exp./Sale Mean 60% 72% 78% 79% 60% 69% 65% 74% 70% 69% 69% 62% 54%
Stand.Dev. 34% 29% 26% 25% 38% 39% 38% 33% 34% 34% 34% 41% 42%
Mean Four-F 37% 60% 62% 64% 61% 67% 88% 87% 88% 90% 90% 89% 67%
Note: (*) In 2001, on firms was eliminated of this ratio, because the value was outside of the normal
evolution.
Legend: Index Lerner = Σ [(net income/sales)*market Share; Mean Four-F: Mean of Four Biggest
Firm on Sales; Stand Dev.: Standard Deviation; Equity Capital Prof. = (Return on owners’ equity) =
Net Income / Equity; Net Sales Profitability = Net Income/Sales; R&D = R&D intensity Research
Development costs/Sales; Work H, = Sales/Working Hours; Staff F. = Staff Formation Costs/Sales;
Work C = Working Costs /Sales; Mark C. = Marketing Costs/Sales; Exp/Sa = Exportation/ Total
sales
Source: INE
15
Figures: Figure 1. World Production of Tomatoes, Tomato Pasta Trade (1000Tonnes) and World and EU, Exports Prices ($1000/ton) in current value
Figure 2: Lerner Index, Net Sales Profitability, Standard Deviation and Net Sales Profitability of the Four Leading Firms
-0,20
-0,15
-0,10
-0,05
0,00
0,05
0,10
1990 1991 1992 1993 1994 1995 1996 1997 1998 1999 2000 2001 2002
I. L
ern
er
-80%
-60%
-40%
-20%
0%
20%
40%
60%
80%
100%
120%
Net S
ale
s P
rofita
bili
ty
Index Lerner Mean _Net Sales Prof.
Stand.Dev._Net Sales Prof. MEAN FOUR-F_Net Sales Prof.
0
5000
10000
15000
20000
25000
30000
35000
40000
1989 1990 1991 1992 1993 1994 1995 1996 1997 1998 1999 2000 2001 2002 2003 2004
Worl
d R
aw
Tom
ato
Pro
ductio
n
and T
rade T
om
ato
Pa
sta
0
0,2
0,4
0,6
0,8
1
1,2
Price (
$1000
/ton)
World production of tomatoes for processing (1000 Tonnes)World Trade Tomato Pasta (100 tonnes)World Price Exports Tomato Pasta ($1000/ton)EU (15) Excl,Intra-Trade Price Exports Tomato Pasta (1000$/ton)