THE POPULATION PREVALENCE OF - uleth.ca · 1 30024Ca1.2BelB THE POPULATION PREVALENCE OF PROBLEM...
273
THE POPULATION PREVALENCE OF PROBLEM GAMBLING: Methodological Influences, Standardized Rates, Jurisdictional Differences, and Worldwide Trends Robert J. Williams, Ph.D. Professor, Faculty of Health Sciences, and Coordinator, Alberta Gambling Research Institute University of Lethbridge, Lethbridge, Alberta, Canada Rachel A. Volberg, Ph.D. President, Gemini Research Northampton, Massachusetts, United States Rhys M.G. Stevens, M.L.I.S. Librarian, Alberta Gambling Research Institute University of Lethbridge, Lethbridge, Alberta, Canada REPORT PREPARED FOR THE ONTARIO PROBLEM GAMBLING RESEARCH CENTRE & THE ONTARIO MINISTRY OF HEALTH AND LONG TERM CARE 2012 May 8 2012
Transcript of THE POPULATION PREVALENCE OF - uleth.ca · 1 30024Ca1.2BelB THE POPULATION PREVALENCE OF PROBLEM...

1
30024Ca1.2BelB
THE POPULATION PREVALENCE OF PROBLEM GAMBLING: Methodological Influences, Standardized Rates, Jurisdictional Differences, and Worldwide Trends
Robert J. Williams, Ph.D. Professor, Faculty of Health Sciences, and Coordinator, Alberta Gambling Research Institute University of Lethbridge, Lethbridge, Alberta, Canada
Rachel A. Volberg, Ph.D. President, Gemini Research Northampton, Massachusetts, United States
Rhys M.G. Stevens, M.L.I.S. Librarian, Alberta Gambling Research Institute University of Lethbridge, Lethbridge, Alberta, Canada
REPORT PREPARED FOR THE ONTARIO PROBLEM GAMBLING RESEARCH CENTRE & THE ONTARIO MINISTRY OF HEALTH AND LONG TERM CARE
2012
May 8 2012

2
Citation
Williams, R.J., Volberg, R.A. & Stevens, R.M.G. (2012). The Population Prevalence of Problem Gambling: Methodological Influences, Standardized Rates, Jurisdictional Differences, and Worldwide Trends. Report prepared for the Ontario Problem Gambling Research Centre and the Ontario Ministry of Health and Long Term Care. May 8, 2012. http://hdl.handle.net/10133/3068
Contact Information
Dr. Robert J. Williams Professor, Faculty of Health Sciences & Research Coordinator, Alberta Gambling Research Institute 3017 Markin Hall University of Lethbridge Lethbridge, Alberta, Canada T1K 3M4 403-382-7128 [email protected] Dr. Rachel Volberg President, Gemini Research PO Box 1390 Northampton, Massachusetts, United States 01061-1390 413-584-4667 [email protected] Rhys M.G. Stevens Librarian, Alberta Gambling Research Institute University of Lethbridge Lethbridge, Alberta, Canada T1K 3M4 403-329-5176 [email protected]
Acknowledgments
The authors would like to thank the anonymous external reviewers as well as Beverly West (Research Associate, University of Lethbridge) for their very helpful critiques of earlier versions of this document. Lauren Williams was also very helpful in collecting some of the data.

3
SUMMARY 5
INTRODUCTION 8
IDENTIFICATION AND COLLECTION OF ALL EXISTING PREVALENCE STUDIES 10
METHODOLOGICAL IMPACTS ON PROBLEM GAMBLING PREVALENCE RATES 13
Instrument and Scoring Thresholds used to Assess Problem Gambling 13
Time Frame used to Assess the Presence of Problem Gambling 22
Method of Survey Administration 29
How the Survey is Described to Potential Participants 33
Threshold used to Administer Questions about Problem Gambling 35
STANDARDIZED PROBLEM GAMBLING PREVALENCE RATES 36
DIFFERENCES IN STANDARDIZED PROBLEM GAMBLING PREVALENCE RATES BETWEEN JURISDICTIONS
41
National (Between Country) Differences 41
Australian State/Territorial Differences 42
Canadian Provincial Differences 42
U.S. State/Territorial Differences 42
CHANGES IN STANDARDIZED PROBLEM GAMBLING PREVALENCE RATES WITHIN JURISDICTIONS OVER TIME
43
Framing the Issue 43
Casino Employees 44
Proximity to Gambling Opportunities 45
Replication Studies 47
National Differences 52
Australian State/Territorial Differences 52
Canadian Provincial Differences 52
U.S. State/Territorial Differences 53
Summary of Changes Within Jurisdictions over Time 53

4
REFERENCES 57
APPENDICES 63
A. National Adult Prevalence Studies of Problem Gambling 63
B. Australian State/Territorial Adult Prevalence Studies of Problem Gambling 131
C. Canadian Provincial Adult Prevalence Studies of Problem Gambling 158
D. United States State/Territorial Adult Prevalence Studies of Problem Gambling 198
E. Demographic Correlates of Problem Gambling 265
F. Characterological and Environmental Correlates of Problem Gambling 267
G. Gambling Format Correlates of Problem Gambling 268
H. Problem and Pathological Gambling Measure (PPGM) 269

5
SUMMARY
The primary purpose of the present research was to standardize problem gambling prevalence rates so as to facilitate comparisons between jurisdictions as well as within the same jurisdiction over time.
The first step in this process was the identification and collection of all published and unpublished studies that involve a jurisdiction-wide adult prevalence survey of problem gambling. A total of 202 studies were conducted between 1975 and 2012. All pertinent information was extracted from each of these 202 studies and is reported in Appendices A, B, C, and D. These Appendices represent the most complete collection of problem gambling prevalence studies to date and will serve as a database for future researchers. In addition, the demographic, characterological, environmental, and gambling format correlates of problem gambling in these 202 studies are summarized and reported in Appendices E, F, G, and H.
The second step in this process was the examination of the impact of methodological differences on obtained problem gambling prevalence rates. The main methodological elements influencing obtained problem gambling prevalence are: a) which assessment instrument is used; b) the time frame used to assess the presence of problem gambling (i.e., past year, lifetime); c) how the survey is described to prospective participants; d) how the survey is administered (i.e., face-to-face, telephone, self-administered); and e) the threshold criterion that determines when problem gambling questions are asked. The methodological approach (within each of these elements) that produced the most valid prevalence rate was identified, as well as weighting factors that could be applied to obtain rates that would have been obtained using the more valid approach.
The third part of this report presents the results of applying these weighting factors to create standardized past year problem gambling prevalence rates for all studies. Between Jurisdiction Comparisons Depending on the specific country and the survey year, the standardized past year rate of problem gambling ranges from 0.5% to 7.6%, with the average rate across all countries being 2.3%. In general, the lowest standardized prevalence rates of problem gambling tend to occur in Europe, with intermediate rates in North America and Australia, and the highest rates in Asia. More specifically, the lowest standardized prevalence rates occur in Denmark, the Netherlands, and Germany. Lower than average rates are seen in Great Britain, South Korea, Iceland, Hungary, Norway, France, and New Zealand. Average rates occur in Sweden, Switzerland, Canada, Australia, United States, Estonia, Finland, and Italy. Above average rates occur in Belgium and Northern Ireland. The highest rates are observed in Singapore, Macau, Hong Kong, and South Africa.

6
Within Australia, the lowest standardized rates occur in Western Australia. Other states appear to have average rates. Sampling problems preclude definitive statements about the Northern Territory. Within Canada, the lowest standardized rates occur in Quebec and Prince Edward Island. Nova Scotia’s rates have also been below average. The rates in Alberta, New Brunswick, and British Columbia have tended to be slightly higher than average. Intermediate rates are observed in other provinces. No prevalence studies have been conducted in the 3 Canadian territories (Yukon, Nunavut, Northwest Territories). A total of 31/50 U.S. states have conducted a prevalence study of gambling, with these studies being more common in states with higher levels of gambling availability. For states where prevalence rates are available, lower than average rates have been obtained in Florida, Indiana, New Mexico, Wisconsin, Delaware, Kentucky, North Dakota, South Dakota, and Iowa. The prevalence rate in Puerto Rico is significantly higher than all other rates. Mississippi, Louisiana, and Nevada have also had higher than average rates, as did Minnesota and New Jersey prior to 1995. Intermediate rates have been obtained in all other states. Within Jurisdiction Comparisons The final part of this report focuses on within-jurisdiction changes in standardized rates over time. No significant changes in prevalence rates over time were observed in the countries of Estonia, Germany, South Korea, and Sweden. However, recent prevalence rates were significantly lower than earlier prevalence rates in Finland, Hong Kong, New Zealand, Singapore, and Switzerland. In contrast, recent rates were significantly higher than earlier prevalence rates in Great Britain, Iceland, and the United States. (The increased U.S. rate is partly due to the relatively early comparison years: 1998 versus 2000). In Norway, the prevalence rate in 2005 was significantly higher than previous rates in 1997 and 2002, as well as subsequent rates in 2007 and 2008. In Canada, the prevalence rate in 2002 was significantly lower than in 2000 and 2007 (which may be due to the lack of anonymity in the 2002 study). As indicated, the U.S. and Canadian results may be artifactual, and, in any case, the state and provincial changes over time in these two jurisdictions provide better data sets to evaluate whether significant changes have occurred over time. Within Australia, significant changes in prevalence rates over time were observed in all states and territories except Western Australia. In all cases except Victoria this change represented a significant decrease in recent years compared to earlier years. Within Canada, significant changes in prevalence rates over time were found in 7 out of 10 provinces. The failure to find significant changes in Newfoundland, Nova Scotia, and Prince Edward Island may be due to the recency of the survey year comparisons in the case of Newfoundland, and the small sample sizes used in the Nova Scotia and Prince Edward Island

7
studies. In all cases of significant change over time in the 7 other provinces, the changes represented decreases in recent years compared to earlier years. Only about one-third of U.S. states that assessed prevalence rates at more than one time period found significant differences between time periods: Connecticut, Delaware, Iowa, Louisiana, Minnesota, and Oregon. All of these states except Iowa and Minnesota found significant decreases in recent years compared to earlier years. Iowa’s peak rate occurred in 1995 relative to 1989 and 2011. Minnesota’s rate in 1994 was significantly higher than its rate in 1990. In general, the evidence indicates that problem gambling rates started increasing in North America and Australia beginning in the late 1980s to early 1990s prior to achieving a peak in the late 1990s/early 2000s. This time interval is roughly coincident with the most rapid introduction and expansion of legal gambling opportunities in these countries (particularly electronic gambling machines (EGM) and casinos), the greatest increase in per capita gambling expenditure, and a significant increase in the overall rate of gambling participation. There has been a general worldwide downward trend in both gambling and problem gambling rates beginning in the late 1990s for North America and the early 2000s for Australia and other Nations. Current rates are now very similar to where they were in the late 1980s prior to gambling expansion. In Canada, the rise and fall of problem gambling prevalence has been more dramatic than in other jurisdictions, which is likely attributable to Canada having very limited legal gambling prior to the late 1980s, as well as having a more pervasive introduction of new forms of gambling when they were introduced. Considering that gambling availability has steadily increased in most jurisdictions over the past 30 years, the present results provide support both to the contention that increased gambling availability is related to increased problem gambling, as well as the contention that populations tend to adapt over time. There are several mechanisms likely responsible for decreasing problem gambling prevalence. They include: a) increased population awareness of the potential harms of gambling (creating less susceptibility); b) decreased overall population participation in gambling (due to greater wariness as well as the novelty having worn off); c) people being removed from the population pool of problem gamblers due to severe adverse consequences deriving from their gambling (e.g., bankruptcy, suicide); d) increased industry and/or government efforts to provide gambling more safely, to enact programs to prevent problem gambling, and to provide treatment resources; and e) increasing age of the population.

8
INTRODUCTION
Population prevalence studies of gambling serve several important purposes. They establish the current prevalence of gambling, the prevalence of each form of gambling, personal expenditures on each form of gambling, and the prevalence of problem gambling1. This information, in turn, is very useful in understanding the overall recreational value of gambling to society, the negative social impacts of providing legalized gambling, the number of problem gamblers that would benefit from treatment, the proportion of gambling revenue derived from problem gamblers, and the types of gambling most strongly associated with problem gambling (Volberg, 2007; Williams & Volberg, 2012). Changes in the prevalence of problem gambling from one time period to the next, and/or differences between the prevalence rate in one jurisdiction relative to another, provide important information about the incidence of problem gambling and the potential effectiveness of policies implemented to mitigate gambling’s harm (Volberg, 2007; Williams & Volberg, 2012). However, there are several survey methodology variants that impact problem gambling prevalence rates and make comparisons between prevalence studies difficult. Some of the more important ones are as follows:
Differences in the problem gambling assessment instrument used (e.g., South Oaks Gambling Screen (SOGS), Diagnostic and Statistical Manual of Mental Disorders (DSM), Canadian Problem Gambling Index (CPGI), Problem and Pathological Gambling Measure (PPGM), etc.) and differing scoring thresholds to designate problem gambling within the same instrument (e.g., 3+, 5+, 8+, 10+, etc.).
Differences in time frame used to assess the presence of problem gambling (i.e., lifetime, past year, past 6 months).
Differences in method of survey administration (i.e., face-to-face residential interviews, telephone interviews, self-administered mail-out/mail-in surveys, self-administered online surveys).
Differences in how the survey is described to potential participants prior to their decision to participate (i.e., “gambling survey”, “health and recreational activities”, etc.).
Differences in the threshold used before administering questions about problem gambling (i.e., any past year gambling, weekly gambling, etc.)
1 Problem gambling is defined as having difficulties limiting money and/or time spent on gambling which leads to
adverse consequences for the gambler, others, or for the community. It includes ‘pathological gambling’ (equivalent to severe problem gambling) that is characterized by severe difficulties in controlling gambling behaviour leading to serious adverse consequences.
9
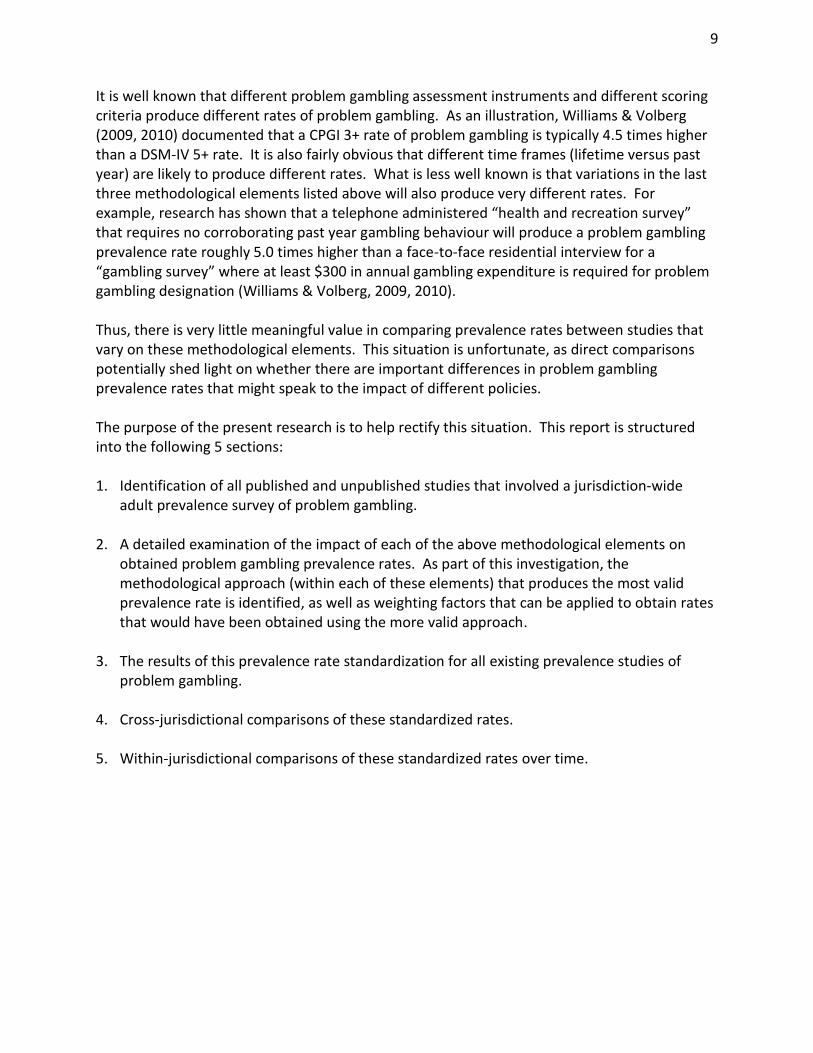
It is well known that different problem gambling assessment instruments and different scoring criteria produce different rates of problem gambling. As an illustration, Williams & Volberg (2009, 2010) documented that a CPGI 3+ rate of problem gambling is typically 4.5 times higher than a DSM-IV 5+ rate. It is also fairly obvious that different time frames (lifetime versus past year) are likely to produce different rates. What is less well known is that variations in the last three methodological elements listed above will also produce very different rates. For example, research has shown that a telephone administered “health and recreation survey” that requires no corroborating past year gambling behaviour will produce a problem gambling prevalence rate roughly 5.0 times higher than a face-to-face residential interview for a “gambling survey” where at least $300 in annual gambling expenditure is required for problem gambling designation (Williams & Volberg, 2009, 2010). Thus, there is very little meaningful value in comparing prevalence rates between studies that vary on these methodological elements. This situation is unfortunate, as direct comparisons potentially shed light on whether there are important differences in problem gambling prevalence rates that might speak to the impact of different policies. The purpose of the present research is to help rectify this situation. This report is structured into the following 5 sections: 1. Identification of all published and unpublished studies that involved a jurisdiction-wide
adult prevalence survey of problem gambling. 2. A detailed examination of the impact of each of the above methodological elements on
obtained problem gambling prevalence rates. As part of this investigation, the methodological approach (within each of these elements) that produces the most valid prevalence rate is identified, as well as weighting factors that can be applied to obtain rates that would have been obtained using the more valid approach.
3. The results of this prevalence rate standardization for all existing prevalence studies of
problem gambling. 4. Cross-jurisdictional comparisons of these standardized rates. 5. Within-jurisdictional comparisons of these standardized rates over time.
10
IDENTIFICATION AND COLLECTION OF ALL EXISTING PREVALENCE STUDIES
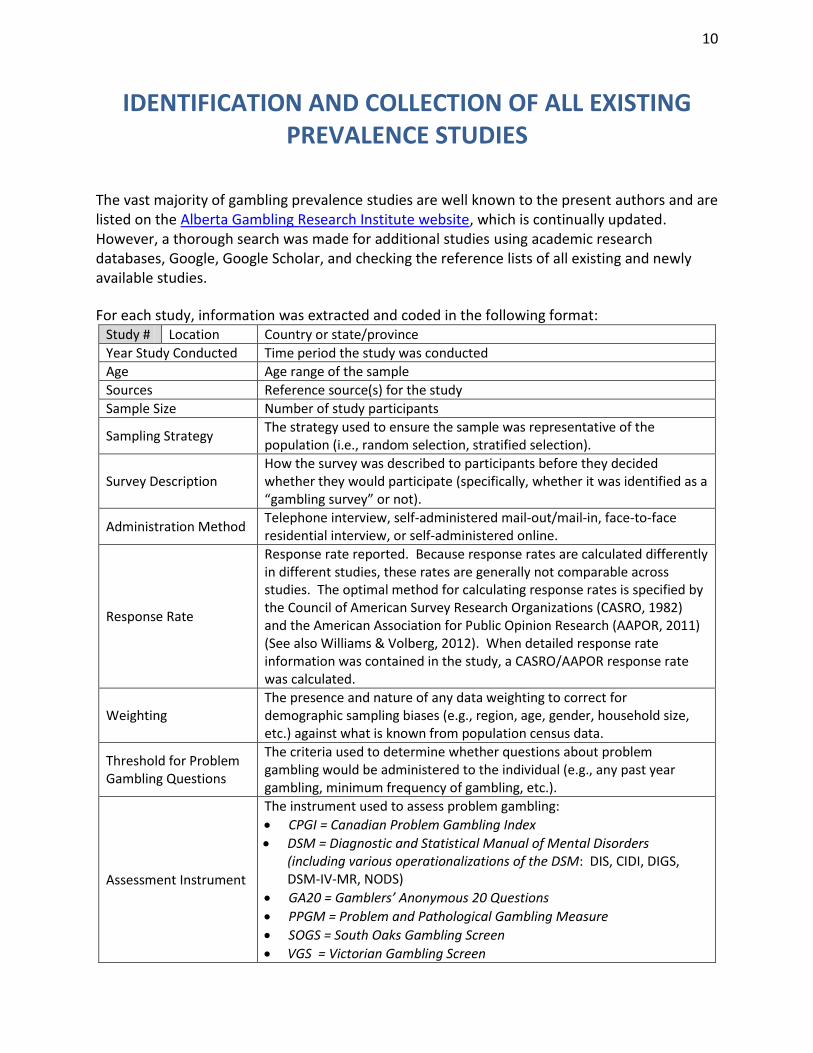
The vast majority of gambling prevalence studies are well known to the present authors and are listed on the Alberta Gambling Research Institute website, which is continually updated. However, a thorough search was made for additional studies using academic research databases, Google, Google Scholar, and checking the reference lists of all existing and newly available studies.
For each study, information was extracted and coded in the following format: Study # Location Country or state/province
Year Study Conducted Time period the study was conducted
Age Age range of the sample
Sources Reference source(s) for the study
Sample Size Number of study participants
Sampling Strategy The strategy used to ensure the sample was representative of the population (i.e., random selection, stratified selection).
Survey Description How the survey was described to participants before they decided whether they would participate (specifically, whether it was identified as a “gambling survey” or not).
Administration Method Telephone interview, self-administered mail-out/mail-in, face-to-face residential interview, or self-administered online.
Response Rate
Response rate reported. Because response rates are calculated differently in different studies, these rates are generally not comparable across studies. The optimal method for calculating response rates is specified by the Council of American Survey Research Organizations (CASRO, 1982) and the American Association for Public Opinion Research (AAPOR, 2011) (See also Williams & Volberg, 2012). When detailed response rate information was contained in the study, a CASRO/AAPOR response rate was calculated.
Weighting The presence and nature of any data weighting to correct for demographic sampling biases (e.g., region, age, gender, household size, etc.) against what is known from population census data.
Threshold for Problem Gambling Questions
The criteria used to determine whether questions about problem gambling would be administered to the individual (e.g., any past year gambling, minimum frequency of gambling, etc.).
Assessment Instrument
The instrument used to assess problem gambling:
CPGI = Canadian Problem Gambling Index
DSM = Diagnostic and Statistical Manual of Mental Disorders (including various operationalizations of the DSM: DIS, CIDI, DIGS, DSM-IV-MR, NODS)
GA20 = Gamblers’ Anonymous 20 Questions
PPGM = Problem and Pathological Gambling Measure
SOGS = South Oaks Gambling Screen
VGS = Victorian Gambling Screen

11
Gambling Availability
In most cases this is reported as the number of people per Electronic Gambling Machine (EGM) in the jurisdiction at the time of the survey (used as a rough proxy of overall gambling availability). This information was derived from other sources rather than the prevalence study itself. 2
Past Year Gambling Prevalence
Percentage of the adult population that participated in any form of gambling in the past year. Because different studies had different definitions of ‘gambling’, the rates between studies are not strictly comparable (e.g., some studies included raffles and high risk stocks, other did not).
Problem Gambling Prevalence
Reported prevalence of problem gambling in the general adult population along with the scoring criteria and time frame used to assess prevalence.
Standardized Problem Gambling Prevalence
Standardized past year prevalence of problem gambling after adjusting for methodological differences in assessment instrument, time frame, administration format, survey description, and response rates. This rate was determined as part of the present investigation and constitutes the primary data for this report.
Demographic Correlates of Problem Gambling (PG)
Demographic characteristics reported in the study to be most strongly associated with problem gambling.
Game Correlates of Problem Gambling (PG)
Types of gambling reported in the study to be most strongly associated with problem gambling.
Comments
The present investigation identified 202 jurisdiction-wide adult prevalence studies of problem gambling conducted between 1975 and 2012. The 68 National studies are listed in Appendix A, the 27 Australian state and territorial studies are listed in Appendix B, the 40 Canadian provincial studies are listed in Appendix C, and the 67 United States state and territorial studies are listed in Appendix D. The sample sizes and response rates for these studies are reported below. There is a significant positive association between sample size and survey year (Kendall tau-b = .45, p < .001) and a significant negative association between response rate and survey year (Kendall tau-b = -.22, p < .001). Response rates also vary significantly as a function of administration method, with an average response rate of 77.1% for face-to-face residential interviews; 52.5% for telephone interviews; 29.0% for self-administered online and/or mail-in surveys; and 50.8% for studies that employed mixed methods of survey administration.
2 EGM data per country (and states/provinces within each country) was primarily derived from the 1999, 2002,
2004, 2006, 2008, and 2010 World Count of Gaming Machines reports of the Gaming Technologies Association http://www.gamingta.com/ (known as the Australian Gaming Machine Manufacturers Association prior to 2008). For Canada, the numbers were usually derived directly from government sources or from the annual Canadian Gambling Digest published by the Canadian partnership for Responsible Gambling. In some cases the population records for the jurisdiction were consulted to derive # people per EGM.

12
Sample Size Response Rate
National Prevalence Studies M = 5799 (SD = 4779) M = 56.1% (SD = 19.3)
Australian Prevalence Studies M = 7137 (SD = 8153) M = 49.4% (SD = 17.5)
Canadian Prevalence Studies M = 4394 (SD = 7344) M = 51.5% (SD = 16.4)
U.S. Prevalence Studies M = 2016 (SD = 1636) M = 53.3% (SD = 19.1)
Most prevalence studies have also reported correlates of problem gambling. These correlates are reported in Appendices E, F, and G. Cells in each table list the number of each study that found that particular variable to be associated with problem gambling. This data is presented for information only, and not discussed in the present report, as these correlates are not central to the purpose of the present investigation.

13
METHODOLOGICAL IMPACTS ON PROBLEM GAMBLING PREVALENCE RATES
Instrument and Scoring Thresholds Used to Assess Problem Gambling
There are many instruments used to assess problem gambling. In alphabetic order, the main ones are the:
CPGI = Canadian Problem Gambling Index (the specific nine item sub-scale used to assess problem gambling is also known as the Problem Gambling Severity Index (PGSI)) (Ferris & Wynne, 2001).
DSM = Diagnostic and Statistical Manual of Mental Disorders published by the American Psychiatric Association (DSM-III published in 1980; DSM-III-Revised in 1987; DSM-IV in 1994). The various operationalizations of the DSM criteria for pathological gambling include the:
o DIS = Diagnostic Interview Schedule (Robins et al., 1981) o CIDI = Composite International Diagnostic Instrument developed by the World
Health Organization in 1990 o DIGS = Diagnostic Interview for Gambling Severity (Winters, Specker, &
Stinchfield, 1997) o DSM-IV-MR = DSM-IV Multiple Response (also known as the ‘Fisher Screen’
(Fisher, 2000)). o NODS = National Opinion Research Centre (NORC) DSM-IV Screen for Gambling
Problems (Gerstein et al., 1999)
GA20 = Gamblers’ Anonymous 20 Questions
PPGM = Problem and Pathological Gambling Measure (Williams & Volberg, 2010).
SOGS = South Oaks Gambling Screen (Lesieur & Blume, 1987).
VGS = Victorian Gambling Screen (Wenzel et al., 2004) There were 242 assessment instruments administered in the 202 jurisdictional prevalence studies (as some studies used more than one instrument). As shown in Table 1, the SOGS was used 42.6% of the time (103/242), the DSM 26.4% of the time (64/242), the CPGI 22.7% of the time (55/242), and Other Instruments (e.g., PPGM, GA20, VGS) were used 8.3% of the time (20/242). There is significant variation in instrument usage as a function of jurisdiction. Australia has predominantly used the SOGS (48.4%) and the CPGI (45.2%). Canada has predominantly used the CPGI (46.7%) and the SOGS (42.2%). The United States has predominantly used the SOGS (54.2%) and the DSM (36.1%). National studies have a more even split, with the DSM being used 39.8% of the time, the SOGS 28.9% of the time, the CPGI 21.7% of the time, and Other Instruments 9.6% of the time.

14
Table 1. Use of the SOGS, DSM, CPGI, and Other Problem Gambling Assessment Instruments as a Function of Jurisdiction and Year. (Each cell indicates the number of times a particular instrument was used in a jurisdiction-wide prevalence study in that year.)
19
75
19
76
19
77
19
78
19
79
19
80
19
81
19
82
19
83
19
84
19
85
19
86
19
87
19
88
19
89
19
90
19
91
19
92
19
93
19
94
19
95
19
96
19
97
19
98
19
99
20
00
20
01
20
02
20
03
20
04
20
05
20
06
20
07
20
08
20
09
20
10
20
11
Tota
l
%
Nat
ion
al SOGS
1
2 3 1 1 1 1 2 2 1 4 1 2
2 24 28.9%
DSM
1
1 2 1 3 1 2 2
4 3 5 2 1 2 3 33 39.8%
CPGI
1
1
2
5 3 1 4 1 18 21.7%
OTHER 1
1
1
1 1 1 1
1 8 9.6%
TOTAL 1 0 0 0 0 0 0 0 0 1 0 0 0 0 0 0 1 0 0 0 0 0 1 4 4 5 3 4 4 2 9 5 15 7 4 6 3 83
Au
stra
lian
Stat
e/Te
rr. SOGS
1
2 1 2 1 1 2 1 1
1
1
1
15 48.4%
DSM
0 0.0%
CPGI
1
1 1 2 1 3 2 3
14 45.2%
OTHER
1
1
2 6.5%
TOTAL 0 0 0 0 0 0 2 0 0 0 0 0 0 0 0 0 0 0 0 2 1 2 1 1 2 1 2 0 3 1 3 1 3 2 4 0 0 31
Can
adia
n
Pro
vin
ces SOGS
1
1 6
2 4 1
1
1 2
19 42.2%
DSM
1
1 2.2%
CPGI
2 2 2
3 1 2 4 4
1 21 46.7%
OTHER
1
1 1
1 4 8.9%
TOTAL 0 0 0 0 0 0 0 0 0 0 0 0 0 0 1 0 0 1 6 0 3 4 1 0 1 0 4 4 2 0 3 1 2 3 5 0 2 45
U.S
. Sta
tes SOGS
1
2 2 2 2 4 1 2 3 3 5 5 1 3 3 1 1
1 1
2
45 54.2%
DSM
1
1
2
1 1 3 3
3 2
2 1 2 3 1 2
1 1 30 36.1%
CPGI
1
1 2 2.4%
OTHER 1
1
2 1
1
6 7.2%
TOTAL 1 0 1 0 0 0 1 0 0 2 1 2 0 2 2 4 2 4 1 2 4 4 8 8 1 6 5 1 3 1 4 5 1 4 0 1 2 83
All
Juri
sdic
tio
ns SOGS
1
1
2 3 2 3 5 7 4 6 9 7 8 7 5 6 4 3 2 4 2 4 3 3
2 103 42.6%
DSM
1
1
1
2
2 1 4 5 1 6 3 2 4 1 6 6 6 4 1 3 4 64 26.4%
CPGI
1 1 3 3 3 1 7 3 10 9 8 4 3 55 22.7%
OTHER 2
1
1
2 1
2
2
2 1 1 2 1
2 20 8.3%
TOTAL 2
1
3
3 1 2
2 3 4 3 5 7 4 8 10 11 13 8 12 14 9 12 4 19 12 21 18 13 7 11 242

15
There is also significant variation in instrument usage as a function of time, as seen in Figure 1. From 1986 to about 2000 the SOGS was the dominant instrument. However, since 2001 the SOGS has largely been replaced in favour of the CPGI and the DSM.
Figure 1. Frequency of Problem Gambling Assesssment Instrument use as a Function of Year
It is apparent from this analysis that to standardize rates between jurisdictions it is necessary to understand the relationship between the three main instruments: SOGS, DSM, and CPGI. One way of doing this is by examining the subset of prevalence studies that have measured problem gambling with two or more of these instruments simultaneously. These studies are presented below. Table 2 lists prevalence studies that have used the SOGS-Past Year (PY) and the DSM-IV-PY; Table 3 lists studies using the CPGI along with the SOGS-PY; and Table 4 lists studies using the CPGI and DSM-IV-PY simultaneously (an additional Table 5 lists studies using the CPGI and PPGM simultaneously). The obtained prevalence rate with each instrument is reported, as well as the ratio of the rate obtained with one instrument relative to the other.
0
5
10
15
20
25
19
75
19
77
19
79
19
81
19
83
19
85
19
87
19
89
199
1
19
93
19
95
19
97
19
99
20
01
20
03
20
05
20
07
20
09
20
11
SOGS DSM CPGI OTHER
# Ti
mes
Inst
rum
ent
Use
d

16
Table 2. Problem Gambling Prevalence Rates Obtained with Simultaneous Administration of the SOGS-PY and DSM-IV-PY.
JURISDICTION YEAR SAMPLE SIZE SOGS 3+ PY DSM-IV 3+ PY SOGS/DSM RATIO New York 1996 1,829 3.60 2.50 1.440 Colorado 1997 1,810 2.50 2.20 1.136 Oregon 1997 1,502 3.30 3.30 1.000 Louisiana 1998 1,810 3.90 2.80 1.393 Montana 1998 1,227 3.60 2.50 1.440 Sweden 1998 7,139 2.00 0.90 2.222 Washington 1998 1,501 2.30 1.50 1.533 Great Britain 1999 7,770 2.10 0.60 3.500 North Dakota 2000 5,002 2.10 0.70 3.000 Oregon 2000 1,500 2.30 0.50 4.600 Florida 2001 1,504 2.00 1.10 1.818 Nevada 2001 2,217 6.40 2.10 3.048 Norway 2002 5,235 0.60 0.70 0.857 Arizona 2003 2,750 2.30 1.00 2.300 Denmark 2005 8,153 1.00 0.40 2.500 Canada 2007 2,124 2.40 2.00 1.200 Connecticut 2008 3,099 1.60 1.40 1.143 AVERAGE 2.59 1.54 1.679 SD
1.32 0.90 1.036
Table 3. Problem Gambling Prevalence Rates Obtained with Simultaneous Administration of the CPGI and SOGS-PY.
JURISDICTION YEAR SAMPLE SIZE CPGI 3+ PY SOGS 3+ PY CPGI/SOGS RATIO Canada 2000 3,120 3.40 2.60 1.308 British Columbia 2002 2,500 4.60 3.80 1.211 Canada 2007 2,124 3.20 2.40 1.333 Sweden 2009 15,000 2.20 2.00 1.100 AVERAGE 3.35 2.70 1.241 SD
0.98 0.77 0.106
JURISDICTION YEAR SAMPLE SIZE CPGI 3+ PY SOGS 5+ PY CPGI/SOGS RATIO Manitoba 2001 3,119 3.40 2.30 1.478 Victoria 2003 8,479 1.88 1.12 1.679 Tasmania 2005 6,048 1.75 1.41 1.241 AVERAGE 2.34 1.61 1.455 SD
0.92 0.61 0.219
JURISDICTION YEAR SAMPLE SIZE CPGI 8+ PY SOGS 5+ PY CPGI/SOGS RATIO Northern Territory 2005 5,264 0.64 1.06 0.604 AVERAGE 0.64 1.06 0.604

17
Table 4. Problem Gambling Prevalence Rates Obtained with Simultaneous Administration of the CPGI and DSM-IV-PY.
JURISDICTION YEAR SAMPLE SIZE CPGI 3+ PY DSM-IV 3+ PY CPGI/DSM RATIO
Iceland 2005 3,358 1.60 1.10 1.455 New Mexico 2006 2,850 2.80 1.30 2.154 Canada 2007 2,124 3.20 2.00 1.600 Great Britain 2007 9,003 2.00 0.60 3.333 Great Britain 2010 7,756 2.50 0.90 2.778 Iowa 2011 1,700 3.20 0.50 6.400 AVERAGE 2.55 1.07 2.953 SD
0.65 0.55 1.831
Table 5. Problem Gambling Prevalence Rates Obtained with Simultaneous Administration of the CPGI and PPGM.
JURISDICTION YEAR SAMPLE SIZE CPGI 3+ PY PPGM3 CPGI/PPGM RATIO Canada 2007 2,124 3.20 1.80 1.778 Alberta 2008 3,001 3.80 2.10 1.810 Alberta 2009 1,004 4.90 3.10 1.581 AVERAGE 3.97 2.33 1.700 SD
0.86 0.68 0.124
These tables illustrate that different instruments consistently give higher or lower rates compared to other instruments. In virtually every study CPGI 3+ rates are higher than rates obtained with the SOGS 3+, SOGS 5+, DSM-IV 3+, and PPGM; and SOGS 3+ rates are higher than rates obtained with the DSM-IV 3+. On the other hand, it is evident that there is some variability in the specific instrument ratio between different studies. It is possible that this variability represents different relationships between the instruments in different jurisdictions. However, arguing against this theory is the fact that there is no significant difference in the SOGS3+/DSM3+ ratios for U.S. state studies compared to these ratios in the National studies (t (15) = .12, p = .906). Another possibility is that these ratios may vary as a function of time. However, arguing against this possibility is the fact there is no significant correlation between the SOGS3+/DSM3+ ratios as a function of survey year (r = -.024, p = .928). Rather, the most plausible explanation for the variability in ratios between studies is simply the small numbers of problem gamblers in each (52 is the median number of problem gamblers in these studies). With such a small number, a relatively
3 Problem gambling designation on the PPGM requires endorsement of one or more questions indicative of loss of
control and one or more questions indicative of significant problems deriving from gambling (Williams & Volberg, 2010)
18
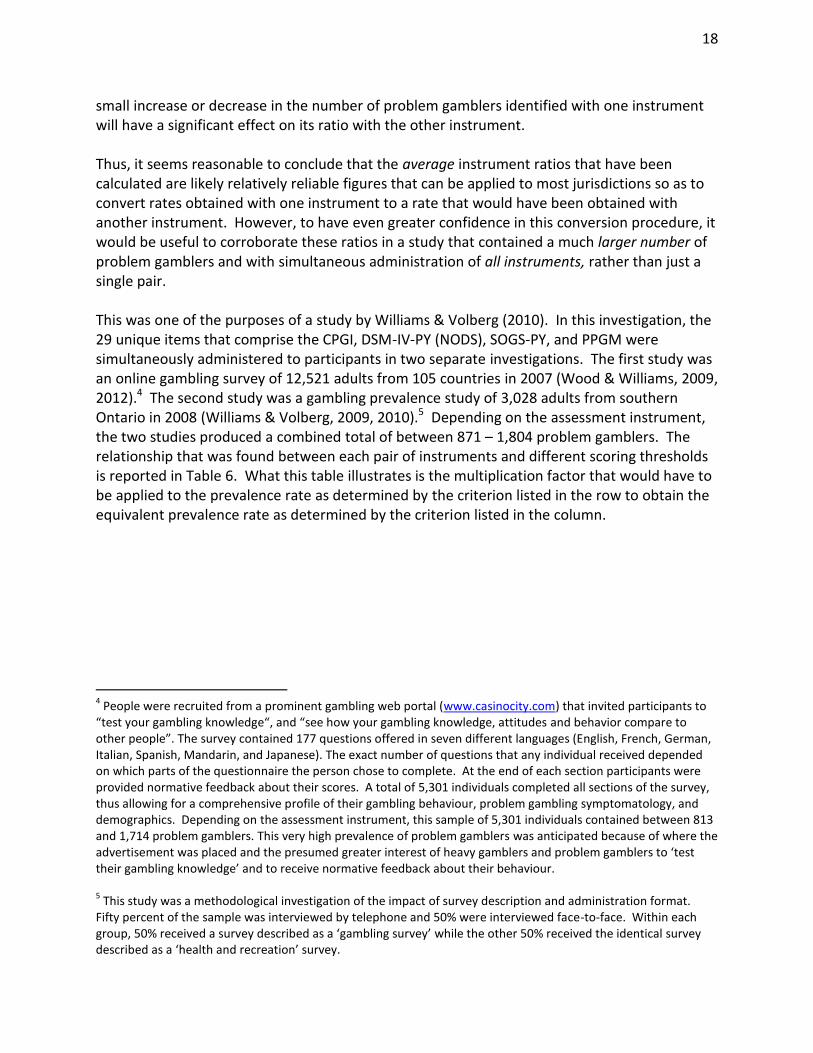
small increase or decrease in the number of problem gamblers identified with one instrument will have a significant effect on its ratio with the other instrument. Thus, it seems reasonable to conclude that the average instrument ratios that have been calculated are likely relatively reliable figures that can be applied to most jurisdictions so as to convert rates obtained with one instrument to a rate that would have been obtained with another instrument. However, to have even greater confidence in this conversion procedure, it would be useful to corroborate these ratios in a study that contained a much larger number of problem gamblers and with simultaneous administration of all instruments, rather than just a single pair. This was one of the purposes of a study by Williams & Volberg (2010). In this investigation, the 29 unique items that comprise the CPGI, DSM-IV-PY (NODS), SOGS-PY, and PPGM were simultaneously administered to participants in two separate investigations. The first study was an online gambling survey of 12,521 adults from 105 countries in 2007 (Wood & Williams, 2009, 2012).4 The second study was a gambling prevalence study of 3,028 adults from southern Ontario in 2008 (Williams & Volberg, 2009, 2010).5 Depending on the assessment instrument, the two studies produced a combined total of between 871 – 1,804 problem gamblers. The relationship that was found between each pair of instruments and different scoring thresholds is reported in Table 6. What this table illustrates is the multiplication factor that would have to be applied to the prevalence rate as determined by the criterion listed in the row to obtain the equivalent prevalence rate as determined by the criterion listed in the column.
4 People were recruited from a prominent gambling web portal (www.casinocity.com) that invited participants to
“test your gambling knowledge“, and “see how your gambling knowledge, attitudes and behavior compare to other people”. The survey contained 177 questions offered in seven different languages (English, French, German, Italian, Spanish, Mandarin, and Japanese). The exact number of questions that any individual received depended on which parts of the questionnaire the person chose to complete. At the end of each section participants were provided normative feedback about their scores. A total of 5,301 individuals completed all sections of the survey, thus allowing for a comprehensive profile of their gambling behaviour, problem gambling symptomatology, and demographics. Depending on the assessment instrument, this sample of 5,301 individuals contained between 813 and 1,714 problem gamblers. This very high prevalence of problem gamblers was anticipated because of where the advertisement was placed and the presumed greater interest of heavy gamblers and problem gamblers to ‘test their gambling knowledge’ and to receive normative feedback about their behaviour. 5 This study was a methodological investigation of the impact of survey description and administration format.
Fifty percent of the sample was interviewed by telephone and 50% were interviewed face-to-face. Within each group, 50% received a survey described as a ‘gambling survey’ while the other 50% received the identical survey described as a ‘health and recreation’ survey.

19
Table 6. Problem Gambling Prevalence Rate Conversion Factors in Williams & Volberg (2010).
CPGI 3+ CPGI 5+ CPGI 8+ SOGS 3+ SOGS 5+ DSM-IV 3+ DSM-IV 5+ PPGM
CPGI 3+ TO 1.000 0.556 0.266 0.806 0.387 0.484 0.222 0.577
CPGI 5+ TO 1.797 1.000 0.478 1.449 0.696 0.884 0.399 1.036
CPGI 8+ TO 3.758 2.091 1.000 3.030 1.455 1.818 0.833 2.167
SOGS 3+ TO 1.240 0.690 0.330 1.000 0.480 0.600 0.275 0.715
SOGS 5+ TO 2.583 1.438 0.688 2.083 1.000 1.250 0.573 1.490
DSM-IV 3+ TO 2.067 1.150 0.550 1.667 0.800 1.000 0.458 1.192
DSM-IV 5+ TO 4.509 2.509 1.200 3.636 1.745 2.182 1.000 2.600
PPGM TO 1.734 0.965 0.462 1.399 0.671 0.839 0.385 1.000
For comparison purposes, Table 7 shows the instrument ratios from the Williams & Volberg (2010) study against the ratios from the jurisdictional prevalence studies where more than one instrument was simultaneously used.
Table 7. Problem Gambling Prevalence Ratios in Williams & Volberg (2010) Compared to Ratios Derived
from Jurisdictional Prevalence Studies.
Williams &
Volberg (2010)
Jurisdictional Prevalence
Studies
SOGS 3+/DSM-IV 3+ Ratio 1.667 1.679 (n = 17)
CPGI 3+/SOGS 3+ Ratio 1.241 1.241 (n = 4)
CPGI 3+/SOGS 5+ Ratio 2.584 1.455 (n =3)
CPGI 8+/SOGS 5+ Ratio 0.687 0.604 (n = 1)
CPGI 3+/DSM-IV 3+ Ratio 2.067 2.953 (n = 6)
CPGI 3+/PPGM Ratio 1.733 1.700 (n = 3)
As can be seen, there is good correspondence between the two ratios in most cases. One disparity is that Williams & Volberg (2010) found a much higher CPGI 3+/SOGS 5+ ratio compared to the ratio derived from the jurisdictional prevalence studies (i.e., 2.584 versus 1.455). The ratio derived from Williams & Volberg (2010) is likely more reliable because of the much larger sample size for this calculation, the small number of studies used to calculate the jurisdictional prevalence ratio (n = 3), and the fact that CPGI 3+/SOGS 5+ ratio derived from the prevalence studies is only slightly larger than the CPGI3+/SOGS 3+ ratio (1.455 versus 1.241). This latter fact is inconsistent with the considerably lower prevalence rate that is typically obtained with a SOGS 5+ criterion compared to a SOGS 3+ criterion in most prevalence studies (see Appendices A, B, C, D). A second discrepancy is that Williams & Volberg (2010) found a lower CPGI 3+/DSM-IV 3+ ratio compared to the ratio derived from the jurisdictional prevalence

20
studies (2.067 versus 2.953). There was one very divergent ratio of 6.4 obtain in Iowa in 2011 (with a relatively small sample). If this outlier is removed, or if the median ratio is used rather than the average ratio, then the Williams & Volberg (2010) figure and the jurisdictional prevalence figures are very close.
Although it appears we can have some confidence in the ratios and multiplication factors that have been derived, it is not clear which instrument provides the most ‘accurate rate’ (and to which the other instruments should be converted). Investigating this question was the second purpose of the Williams & Volberg (2010) investigation. One of the advantages of administering all four instruments simultaneously was that it provided fairly complete coverage of all the potential signs and symptoms of problem gambling. Thus, the second part of the Williams & Volberg (2010) investigation involved providing two independent clinicians with the answers to each of these problem gambling questions for each participant, as well as comprehensive information about the person’s gambling behaviour, the person’s responses to 12 validity questions, and relevant demographic characteristics of the individual (e.g., income, debt). This information was used by the clinicians to provide an assessment of the person’s problem gambling status, using a commonly accepted definition (Neal et al., 2005).6 As seen in Table 8, the ability of the DSM, SOGS, and CPGI to distinguish clinically assessed problem gamblers from non-problem gamblers was modest. By contrast, the PPGM had excellent classification accuracy with sensitivity, specificity, positive predictive power, and negative predictive power all above 90%. In general, all instruments correctly classified most non-problem gamblers. Because non-problem gamblers constitute the large majority in general population prevalence surveys, this also means that these instruments all have good overall diagnostic efficiency and level of agreement (kappa). However, a significant drawback to both the CPGI and SOGS is that roughly half of the people labelled as problem gamblers by these instruments (using a 3+ criterion) are not confirmed as such by clinical assessment. This also means that the prevalence rate obtained with these instruments is too high (1.85 times higher than the actual rate with the CPGI 3+ and 1.52 times higher with the SOGS 3+).7 The main problem with the DSM-IV (NODS) concerns the fact that it only correctly identifies 68.5% of the genuine problem gamblers, and, even with this lower rate of over-identification, its positive predictive power is still only 76.8%. On the other hand, relative to the SOGS and CPGI, the DSM has higher specificity, higher positive predictive power, better overall diagnostic efficiency, and it produces a problem gambling prevalence rate closest to the true rate. In addition to their modest overall classification accuracy, the classification accuracy of the CPGI, SOGS, and DSM was found to be poorer for people older than 30, and the DSM was found to have poorer
6 “Problem Gambling is characterized by difficulties in limiting money and/or time spent on gambling which leads
to adverse consequences for the gambler, others, or for the community. It includes the more severe ‘pathological’ forms characterized by severe difficulties in controlling gambling behaviour leading to serious adverse consequences.” 7 An 8+ threshold for the CPGI produces a diagnostic efficiency of 91.9%, a kappa of .55, but an instrument
prevalence to clinician prevalence ratio of only 0.49. A 5+ threshold for the SOGS produces a diagnostic efficiency of 92.9%, a kappa of .63, and an instrument prevalence to clinician prevalence ratio of 0.69.

21
classification accuracy with people of non-Western origins (Williams & Volberg, 2010). The classification accuracy of the PPGM was invariant across all demographic groups.
Table 8. Classification Accuracy of the CPGI, SOGS, DSM, and PPGM against Clinical Assessment.
CPGI 3+ SOGS 3+ DSM-IV 3+ PPGM
Sensitivity 91.20% 85.87% 68.47% 99.69%
Specificity 85.50% 90.42% 96.79% 98.92%
Positive Predictive Power 49.39% 56.52% 76.81% 93.47%
Negative Predictive Power 98.43% 97.78% 95.19% 99.95%
Diagnostic Efficiency 86.26% 89.84% 92.99% 99.02%
Kappa 0.56 0.62 0.68 0.96
Instrument Prevalence/ Clinician Prevalence
1.85 1.52 0.89 1.07
Because the PPGM produces rates that are closest to the rates that would be obtained with direct clinical assessment, problem gambling prevalence rates in all jurisidictional studies will be converted to a PPGM rate using the Williams & Volberg (2010) conversion factors (see Appendix H for more details about the PPGM). A PPGM problem gambler is equivalent to a rate that would be obtained using CPGI 5+, SOGS-PY 4+, and DSM-IV-PY 3+ (Williams & Volberg, 2010). Table 9 specifies what these multiplication factors are.
Table 9. Instrument Multiplication Factors Required to Produce a PPGM Rate of Problem Gambling.
Canadian Problem Gambling Index (CPGI) 3+ 0.58
Canadian Problem Gambling Index (CPGI) 8+ 2.17
South Oaks Gambling Screen – Past Year (SOGS) 3+ 0.72
South Oaks Gambling Screen – Past Year (SOGS) 5+ 1.49
DSM-IV – Past Year (NODS-PY, DSM-IV-MR, DIGS-PY, DIS-IV-PY) 1+ 0.45
DSM-IV – Past Year (NODS-PY, DSM-IV-MR, DIGS-PY, DIS-IV-PY) 3+ 1.19
DSM-IV – Past Year (NODS-PY, DSM-IV-MR, DIGS-PY, DIS-IV-PY) 5+ 2.60
Note. Studies that have used the DSM-III, DSM-III-R, or operationalizations of the DSM-III/III-R (e.g., DIS) to identify ‘pathological gambling’ are given the same conversion weight used to convert a DSM-IV 5+ rate to a PPGM rate. However, the validity of the resulting figure is unknown, as the DSM-III and III-R criteria are somewhat different from the DSM-IV. Compounding this problem is that the most common operationalization of the DSM-III (i.e., DIS-III) only uses four questions, whereas the DSM-III actually has eight criteria. (By comparison, the DIS-IV uses 13 questions to map unto 10 DSM-IV criteria). Consequently, the standardized rates for DSM-III and III-R studies are reported in the Appendices, but are not included in the Tables or the overall analysis.

22
Time Frame Used to Assess the Presence of Problem Gambling
Another important difference between prevalence studies is the use of different time frames in which to assess the prevalence of problem gambling. Most studies have used a Past Year (PY) frame. This is the standard time frame for the Canadian Problem Gambling Index (CPGI) and the Problem and Pathological Gambling Measure (PPGM), and is a commonly used time frame option for the revised South Oaks Gambling Screen (i.e., SOGS-R; Abbott & Volberg, 1996) as well as certain operationalizations of the Diagnostic and Statistical Manual of Mental Disorders – Version IV (DSM-IV) (i.e., NODS-PY, DSM-IV-MR, DIGS-PY). However, a minority of studies (especially older studies) have asked people about problem gambling symptomatology in their Lifetime (L). This was the default time frame of the original SOGS and the DIS-III (the term ‘ever’ was used for each question), and is a time frame option for certain DSM operationalizations (i.e., DIS-IV, CIDI, NODS-L, DIGS-L).8 The present study examined whether there was a reliable relationship between past year rates of problem gambling and lifetime rates of problem gambling that would potentially allow lifetime rates to be converted to approximate past year rates. This was done by assessing the degree of association between past year and lifetime rates in studies that assessed both of these time frames. In almost all cases, these studies used the SOGS-PY in combination with the SOGS-L and/or the DSM-IV-PY in combination with the DSM-IV-L. As seen in Figure 2, the overall correlation between past year and lifetime rates is exceptionally high (r = .920, p < .0001, N = 54 pairs), which lends support to the possibility that past year rates could be approximated if lifetime rates are known.
8 The general orientation of the DSM is that disordered gambling (called ‘pathological gambling’ in the DSM) is an
unremitting chronic condition. Thus, it is irrelevant whether a past year or a lifetime time span is being assessed. Hence, the current DSM-IV uses a mixture of present tense descriptors for seven of its criteria (i.e., “is”, “needs to”, “often returns”, “lies”, “relies on others”) and past tense descriptors for the other three criteria (“has”). However, more current thinking is that while problem gambling is chronic for some people, it is not for others (hence, the movement toward using past-year rather than lifetime time frames). The fact that past-year problem gambling prevalence rates are consistently lower than lifetime rates is further evidence that past-year and lifetime rates are not equivalent.

23
Figure 2. Correlation between Past Year 3+ Rates of Problem Gambling with Lifetime 3+ Rates of
Problem Gambling (Unstandardized Rates).
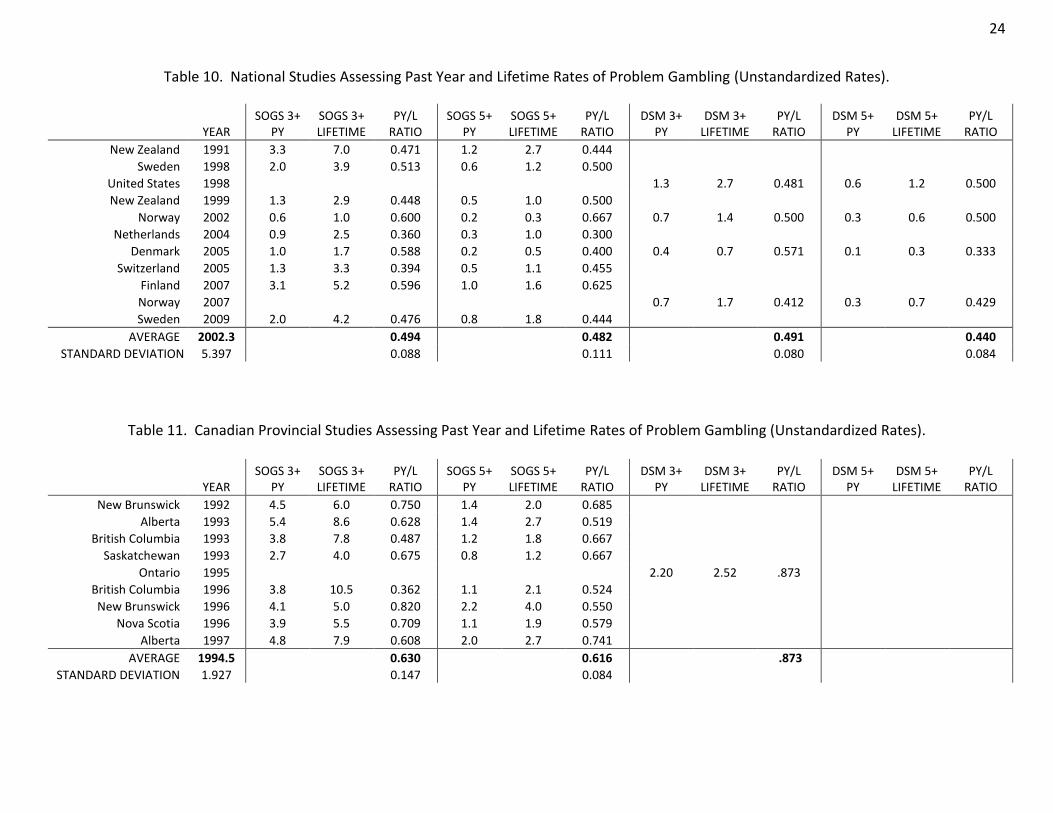
In the following tables, the obtained prevalence rate with each time frame is reported as well as the ratio of the rate obtained with one time frame relative to the other. The ratio of past year rates relative to lifetime rates is calculated for both a 3+ criterion for problem gambling and a 5+ criterion (as there is some debate about which criterion provides a better threshold for problem gambling). National studies are listed in Table 10, Canadian provincial studies in Table 11, and U.S. state studies in Table 12 (no Australian state studies have examined both PY and L time frames in the same study). Using a 3+ criterion for the designation of problem gambling, the obtained PY/L ratio is .485 for National studies, .630 for Canadian studies and .553 for U.S. studies (combining the SOGS ratios with the DSM ratios9).
9 If both ratios were available, then only the SOGS ratio was used, to ensure that each data point represented only
a single study.
0.0
2.0
4.0
6.0
8.0
10.0
12.0
14.0
16.0
0.0 2.0 4.0 6.0 8.0 10.0 12.0
Life
tim
e 3
+ P
reva
len
ce R
ate
Past Year 3+ Prevalence Rate
24
Table 10. National Studies Assessing Past Year and Lifetime Rates of Problem Gambling (Unstandardized Rates).
YEAR
SOGS 3+ PY
SOGS 3+ LIFETIME
PY/L RATIO
SOGS 5+ PY
SOGS 5+ LIFETIME
PY/L RATIO
DSM 3+ PY
DSM 3+ LIFETIME
PY/L RATIO
DSM 5+ PY
DSM 5+ LIFETIME
PY/L RATIO
New Zealand 1991 3.3 7.0 0.471 1.2 2.7 0.444
Sweden 1998 2.0 3.9 0.513 0.6 1.2 0.500
United States 1998 1.3 2.7 0.481 0.6 1.2 0.500
New Zealand 1999 1.3 2.9 0.448 0.5 1.0 0.500
Norway 2002 0.6 1.0 0.600 0.2 0.3 0.667 0.7 1.4 0.500 0.3 0.6 0.500
Netherlands 2004 0.9 2.5 0.360 0.3 1.0 0.300
Denmark 2005 1.0 1.7 0.588 0.2 0.5 0.400 0.4 0.7 0.571 0.1 0.3 0.333
Switzerland 2005 1.3 3.3 0.394 0.5 1.1 0.455
Finland 2007 3.1 5.2 0.596 1.0 1.6 0.625
Norway 2007
0.7 1.7 0.412 0.3 0.7 0.429
Sweden 2009 2.0 4.2 0.476 0.8 1.8 0.444
AVERAGE 2002.3
0.494
0.482
0.491
0.440
STANDARD DEVIATION 5.397
0.088
0.111
0.080
0.084
Table 11. Canadian Provincial Studies Assessing Past Year and Lifetime Rates of Problem Gambling (Unstandardized Rates).
YEAR
SOGS 3+ PY
SOGS 3+ LIFETIME
PY/L RATIO
SOGS 5+ PY
SOGS 5+ LIFETIME
PY/L RATIO
DSM 3+ PY
DSM 3+ LIFETIME
PY/L RATIO
DSM 5+ PY
DSM 5+ LIFETIME
PY/L RATIO
New Brunswick 1992 4.5 6.0 0.750 1.4 2.0 0.685
Alberta 1993 5.4 8.6 0.628 1.4 2.7 0.519
British Columbia 1993 3.8 7.8 0.487 1.2 1.8 0.667
Saskatchewan 1993 2.7 4.0 0.675 0.8 1.2 0.667
Ontario 1995
2.20 2.52 .873 British Columbia 1996 3.8 10.5 0.362 1.1 2.1 0.524
New Brunswick 1996 4.1 5.0 0.820 2.2 4.0 0.550
Nova Scotia 1996 3.9 5.5 0.709 1.1 1.9 0.579
Alberta 1997 4.8 7.9 0.608 2.0 2.7 0.741
AVERAGE 1994.5
0.630
0.616
.873
STANDARD DEVIATION 1.927
0.147
0.084

25
Table 12. U.S. State Studies Assessing Past Year and Lifetime Rates of Problem Gambling (Unstandardized Rates).
YEAR
SOGS 3+ PY
SOGS 3+ LIFETIME
PY/L RATIO
SOGS 5+ PY
SOGS 5+ LIFETIME
PY/L RATIO
DSM 3+ PY
DSM 3+ LIFETIME
PY/L RATIO
DSM 5+ PY
DSM 5+ LIFETIME
PY/L RATIO
South Dakota 1991 1.4 2.8 0.500 0.6 1.0 0.600
Montana 1992 2.2 3.6 0.611 0.7 1.3 0.538
North Dakota 1992 2.0 3.5 0.571 0.7 1.0 0.700
Texas 1992 2.5 4.8 0.521 0.8 1.3 0.615
Washington 1992 2.8 5.1 0.549 0.9 1.5 0.600
South Dakota 1993 1.2 2.3 0.522 0.5 0.9 0.556
Georgia 1994 2.3 4.4 0.523 0.8 1.6 0.500
Iowa 1995 3.3 5.4 0.611 1.0 1.9 0.526
Louisiana 1995 4.8 7.0 0.686 1.4 2.5 0.560
Texas 1995 3.0 5.4 0.556 0.8 1.8 0.444
Connecticut 1996 2.8 5.4 0.519 0.6 1.2 0.500
Mississippi 1996 4.9 6.8 0.721 2.1 3.1 0.677
New York 1996 3.6 7.3 0.493 1.4 2.6 0.538
Michigan 1997 3.4 5.2 0.654 1.3 2.0 0.650
Oregon 1997 3.3 5.1 0.647 1.4 1.8 0.778
Puerto Rico 1997 11.2 13.8 0.812 6.8 7.4 0.919
Colorado 1997 1.8 4.4 0.409 0.7 1.8 0.389
Montana 1998 3.6 5.7 0.632 1.6 2.8 0.571
Louisiana 1998 3.9 5.8 0.672 1.6 2.5 0.640
Washington 1998 2.3 5.0 0.460 0.5 1.3 0.385
Michigan 1999 3.2 4.9 0.653 1.2 1.8 0.667
North Dakota 2000 2.1 3.8 0.553 1.4 1.8 0.778 0.7 0.9 0.778 0.3 0.4 0.750
Oregon 2000 2.3 4.6 0.500 0.9 1.9 0.474 0.5 1.5 0.333 0.1 0.6 0.167
Florida 2001 2.0 3.6 0.556 0.6 1.0 0.600 1.1 1.6 0.688 0.7 1.0 0.700 Michigan 2001 2.8 4.5 0.622 1.0 1.7 0.588
Nevada 2001
2.1 5.1 0.412 0.3 2.1 0.143
Arizona 2003 2.3 5.5 0.418 0.7 1.9 0.368 1.0 2.1 0.476 0.3 0.5 0.600 Michigan 2006 2.0 4.1 0.488 0.9 1.4 0.643
Oregon 2006 2.7 4.3 0.628 1.0 1.9 0.526
California 2006
1.3 3.7 0.351 0.4 1.5 0.267
New Mexico 2006
1.3 2.2 0.591 0.6 1.1 0.545
Georgia 2007
1.5 4.0 0.375 0.4 1.4 0.286
Connecticut 2008 1.6 3.7 0.432 0.7 1.5 0.467 1.4 3.3 0.424 0.6 1.2 0.500
Iowa 2011
0.5 1.2 0.417 0.3 0.6 0.500
AVERAGE 1998.0 0.570 0.579 0.485 0.446
STANDARD DEVIATION 4.837
0.095
0.123
0.151
0.217

26
Table 13 lists the analyses that evaluated whether there were any statistically significant differences in the PY/L ratios as a function of: using a 3+ versus a 5+ criterion; using the SOGS versus the DSM; different time periods (1990s versus 2000s); and different jurisdictions (National versus Canadian versus U.S). As can be seen, t-tests found no significant differences in the 3+ ratios versus the 5+ ratios in any of the comparisons. Similarly, there was no significant different in the SOGS ratios compared to the DSM ratios. However, there was a significant difference as a function of time period, with the ratio being significantly higher in the 1990s (.592) compared to the 2000s (.488). Figure 3 shows this declining trend. A closer examination of the data shows that the PY/L ratios are decreasing because past year rates of problem gambling have been decreasing more quickly over the years (i.e., decreased incidence) than lifetime rates.10 There were also significant differences as a function of jurisdiction. National SOGS 3+ ratios (average = .494) were significantly lower than the ratios obtained in the Canadian provincial (average = .630) and U.S. state studies (average = .570). A potential confound is the fact that the National studies tended to be conducted in more recent years compared to the state and provincial studies. However, the difference in the National versus provincial and state ratios does not appear to be a time effect as much as it is a jurisdiction effect, as there was no significant difference in the National study ratios conducted in the 1990s versus 2000s, and there was no significant correlation between the year the National study was conducted and its PY/L ratio (see Table 13). Thus, to summarize, it is clear that past year rates are strongly correlated with lifetime rates but that the ratio is somewhat dependent both on time period and jurisdiction.
10
Researchers have concluded that the observed lifetime prevalence rates of problem gambling are much lower than they should be considering reported past-year rates (e.g., Shaffer & Hall, 2001; Slutske et al., 2003). It may seem counter-intuitive that lifetime adult rates could decrease over time, but the lifetime prevalence of most activities (e.g., smoking) does not steadily and inevitably increase with time in a population. Indeed, decreasing lifetime rates of problem gambling are quite possible if either a) the incidence of problem gambling is decreasing in an expanding adult population and/or if b) the prevalence of problem gambling is lower in older people who are living longer. In Western society both of these appear to be true.

27
Table 13. Statistical Analysis of Past Year Versus Lifetime Rates of Problem Gambling (Unstandardized Rates).
T-TESTS (equal variance) t df p (2 tail)
National SOGS 3+ PY/L ratios vs National SOGS 5+ PY/L ratios 0.26 16 0.797
Canadian SOGS 3+ PY/L ratios vs Canadian SOGS 5+ PY/L ratios 0.22 14 0.826
U.S. SOGS 3+ PY/L ratios vs U.S. SOGS 5+ PY/L ratios -0.11 54 0.914
U.S. DSM 3+ PY/L ratios vs U.S. DSM 5+ PY/L ratios 0.46 18 0.649
All Jurisdictions 3+ PY/L ratios (SOGS or DSM)11 vs All Jurisdictions 5+ PY/L ratios (SOGS or DSM) 0.57 106 0.571
All Jurisdictions SOGS 3+ ratios vs All Jurisdictions DSM 3+ ratios12 -0.27 12 0.789
All Jurisdictions 3+ PY/L 1990s ratios (SOGS or DSM) vs All Jurisdictions 3+ PY/L 2000s ratios (SOGS or DSM) 3.29 52 0.002*
National SOGS 3+ PY/L ratios vs Canadian SOGS 3+ PY/L ratios -2.34 15 0.033*
National SOGS 3+ PY/L ratios vs U.S. SOGS 3+ PY/L ratios -2.12 36 0.041*
Canadian SOGS 3+ PY/L ratios vs U.S. SOGS 3+ PY/L ratios 1.41 35 0.169
1990s National 3+ PY/L ratios (SOGS or DSM) vs 2000s National 3+ PY/L ratios (SOGS or DSM) 0.09 12 0.930
CORRELATIONS (Pearson) r N p (2 tail)
Correlation between National 3+ PY/L ratios and Study Year (SOGS or DSM) 0.25 14 0.396
Correlation between Study Year and 3+ Ratio (All Jurisdictions; SOGS or DSM) -0.40 54 0.003**
Correlation between PY 3+ Rate and L 3+ Rate (Unstandardized; All Jurisdictions; SOGS or DSM) 0.92 54 0.000**
* P < .05 ** p < .01
11
When both the SOGS and DSM are available in any of these analyses, only the SOGS ratio is used. 12
Limiting the sample to studies that administered both instruments at the same time.

28
Figure 3. PY/L Ratios as a Function of Survey Year.
Table 14 lists the factor weightings used in the present study to convert lifetime prevalence rates to past year rates. Australian state/territorial studies are given the average of the National, Canadian, and U.S. weightings combined, as there are no Australian studies that have simultaneously assessed past year and lifetime rates.
Table 14. Multiplication Factors for Conversion of SOGS-L 3+ to SOGS-PY 3+ or DSM-IV-L 3+ to DSM-IV-PY 3+.
National Study Conducted Prior to 2000 .53
National Study Conducted in 2000 or later .44
Australian State/Territorial Study Conducted Prior to 2000 .60
Australian State/Territorial Study Conducted in 2000 or later .51
Canadian Provincial Study Conducted Prior to 2000 .67
Canadian Provincial Study Conducted in 2000 or later .58
U.S. State Study Conducted Prior to 2000 .60
U.S. State Study Conducted in 2000 or later .51
Note. When a ‘lifetime’ frame is not explicitly mentioned in the administration of a DSM-IV based instrument, the obtained rates are presumed to be more reflective of ‘current’ behaviour and are reported as ‘past year’ prevalence (because 7/10 DSM-IV items use present tense descriptors).
0.00
0.10
0.20
0.30
0.40
0.50
0.60
0.70
0.80
0.90
1.00
1990 1995 2000 2005 2010
PY/
L R
atio
Survey Year

29
Method of Survey Administration
Prevalence surveys are most typically conducted as a telephone interview. However, they are also sometimes administered as a face-to-face interview at the person’s residence or as a self-administered survey completed online or mailed in. Among the 202 prevalence studies in the present paper, 73.0% conducted telephone interviews; 11.2% conducted face-to-face residential interviews; 4.1% used self-administered online and/or mail-in surveys; and 11.7% used a mix of administration methods. Survey research has generally found that a face-to-face interview at a person’s residence tends to elicit more candid/honest responding relative to a telephone interview because it fosters better rapport (de Leeuw & van der Zouwen, 1988; Holbrook, Green & Krosnick, 2003; Tourangeau & Yan, 2007). Similar results have been found in gambling surveys. Williams & Volberg (2009, 2010) administered a gambling survey to a random sample of 3,028 adults from Ontario in 2008, with half the sample receiving a face-to-face residential interview and the other half being interviewed by telephone. The obtained rates of problem gambling were found to be 2.18 times higher in the face-to-face survey compared to the telephone survey. One of the mechanisms for this effect was that face-to-face household sampling resulted in greater participation of certain demographic groups that have higher rates of problem gambling. More specifically, the face-to-face survey recruited significantly more fulltime students, young people, males, and single people. These demographic groups are traditionally harder to recruit into telephone surveys because they have higher refusal rates over the telephone and many of them have replaced telephone landlines with cell phones. Sampling biases are not uncommon in survey research. However, this type of bias is typically corrected by weighting the obtained sample so that it matches the age x gender distributions established by the federal census (Williams & Volberg, 2012). Nonetheless, even when this was done, the face-to-face problem gambling prevalence rate in Williams & Volberg (2009, 2010) was still 1.44 times higher than the telephone interview prevalence rate. This points to a second mechanism for this effect, which is that face-to-face interviewing tends to produce more honest/candid responding. In addition to reporting higher rates of problem gambling, people in the face-to-face interviews reported significantly lower rates of voting; a higher frequency of driving while intoxicated; a higher frequency of illicit drug use; a higher rate of alcohol use; a lower frequency of exercising; a lower frequency of indicating that their preferred vacation destination would be the Arctic; and lower refusal rates for divulging their income (Williams & Volberg, 2009, 2010).
To help correct for differences in method of survey administration and to produce rates closer to what would be obtained by face-to-face surveys, the problem gambling prevalence rates in telephone surveys can be multiplied by 2.18 in situations where no efforts have been made to correct for undersampling of harder-to-contact groups typically having higher rates of problem gambling. Alternatively, if corrective measures have been used (i.e., either stratified quota sampling of age x gender groupings, or data weighting to correct for demographic sampling biases) then a corrective weighting factor of 1.44 can be applied. The magnitude of the undersampling of high risk groups will depend on the overall response rate to the survey, with

30
less need for corrective weighting with high response rates and more need for corrective weighting with low response rates. Williams & Volberg (2009, 2010) had a response rate of 49% in their face-to-face survey and 36% in their telephone survey. Thus, in the present study, the prevalence rates in studies with undersampling of high risk groups and with response rates of 44% or less will receive the 2.18 multiplication factor. However, studies with undersampling of high risk groups and with response rates between 45% and 75% will receive a corrective weighting of half this much (i.e., 1.59). Studies with response rates 76% or higher will not receive any corrective weighting. Self-administered surveys are another method of survey administration that tends to produce more valid reports of sensitive behavior compared to responses given to an interviewer (Tourangeau & Smith, 1996; van der Heijden et al., 2000). This is mostly because of the greater anonymity, but also partly because of the additional time the person has to think about and answer questions. There is very little research on this issue specific to gambling. In a pilot study by Rönnberg et al. (1999), no significant difference in problem gambling prevalence rates were found among ~3,000 randomly selected Swedish respondents who were either interviewed by telephone or completed a self-administered postal questionnaire. In the subsequent main study, people who could not be contacted by phone were sent a postal questionnaire. In this case the rate of problem gambling was found to be significantly higher in the postal group (1.6% versus 0.5%), but this is at least partly a function of the higher risk demographic profile of people who completed mail-in surveys (Rönnberg et al., 1999). A similar methodology was used in a Norwegian prevalence study by Lund & Nordlund (2003). These investigators also found that people who could not be contacted by phone but returned postal surveys had higher problem gambling prevalence rates compared to the telephone sample (0.9% vs. 0.5%). However, here again, the telephone versus the mail-in groups had significantly different demographic profiles.
In the present study, no adjustments are made to the few gambling prevalence studies that have exclusively used self-administered mail-in surveys (i.e., Norway in 2005, 2007, 2008; Germany in 2006). This is partly because of uncertainty about the magnitude of correction that should be applied, and partly because it is presumed that self-administered surveys should produce fairly valid/accurate rates, and thus do not require an adjustment. Self-administered online surveys completed by a representative sample of the population are assumed to be equivalent to self-administered mail-in surveys (Ritter et al., 2004). However, this equivalency does not apply to online panel surveys. Beginning in the late 1990s, market research firms began creating ‘online panels’ composed of thousands of individuals who agreed to receive online solicitations to participate in various online surveys in return for compensation (most often, a collection of ‘points’ that have some cash value) (Göritz, 2007; Göritz et al., 2002). When an individual joins one of these panels, information is collected concerning his/her demographics. Subsequently, when a group is needed for a particular survey (e.g., ‘representative sample of Canadian adults’), the survey is only sent out to this selected subsample. Online panels are now commonly used in market research, and are starting to be used in academic studies. The advantages of online panel surveys are that a) the validity of answers to ‘sensitive questions’ (e.g., gambling) tends to be higher in self-

31
administered formats (Tourangeau & Smith, 1996; van der Heijden et al., 2000); b) everyone has agreed to be and expects to be contacted (unlike telephone surveys); c) the results can be obtained in a much shorter period of time; and d) they are roughly one-third the cost of telephone surveys. However, online panels have some serious problems. One concern has to do with the data quality of ‘professional respondents’ who may complete dozens of surveys within the span of a few months (Göritz, 2007; Toepoel, Das & van Soest, 2008). Another concern is the nonrepresentative nature of the online panel population. An obvious limitation is that a significant nonrandom minority of people still does not use the Internet, and thus, are not eligible to be part of an online panel.13 Furthermore, although online panelists are structured to be demographically representative in terms of age, gender, and geographic residence (and sometimes education, income, and other basic demographic variables), other important differences have been found to exist, as might be expected considering that only a very small minority of people invited to be part of an online panel agree to participate (Sparrow, 2006). As evidence of the non-equivalency of telephone versus online panel samples, research by Williams, Belanger & Arthur (2011) found that an online panel survey of 2,001 Albertans in 2008 produced a past year problem gambling prevalence rate 2.19 times higher (4.6% versus 2.1%) compared to an identically administered telephone survey of 3,001 participants (even with weighting to make each sample similar to Alberta census data). To examine the potential influence of the email subject line on oversampling gamblers, in a 2009 retest, the email solicitation to the online panelists changed the description of the study from a ‘gambling survey’ to a survey about ‘recreational activities’ (the telephone description continued to describe it as a ‘gambling survey’). Nonetheless, the 2009 results still found a rate of problem gambling 1.81 times higher (5.6% compared to 3.1%) among the Alberta online panelists (n = 1,092) compared to the telephone respondents (n = 1,004) (Williams, Belanger & Arthur, 2011). An even more dramatic difference was recently obtained in Williams, Lee & Back (submitted for publication) in South Korea, where an online panel survey of 4,000 South Koreans in 2011 produced a past year problem gambling prevalence rate 11.4 times higher (11.4% versus 1.0%) compared to an identical cell phone administered prevalence study of 4,000 people. Noticing that online panelists tended to have much higher rates of ‘pathology’ in all areas (i.e., substance use, mental health problems, etc.), a final manipulation by Williams & Volberg (in preparation) for a prevalence study of gambling in Ontario, required that the sample of online panelists have an equivalent rate of tobacco use compared to the Ontario population. This was in addition to their usual stratification based on age, gender, education, and not indicating the nature of the survey in the email solicitation. Nonetheless, the prevalence of past year problem gambling was still found to be considerably higher in the online panel sample compared to the identical telephone survey (that also included cell phones) (8.3% versus 1.0%).
13
For example, 21% of Canadian households did not have Internet access in 2010, with nonusers significantly more likely to be located in rural areas, have lower income, be older, and have a smaller household size (Statistics Canada, 2011).

32
In the present study, the few gambling prevalence surveys that have used an online panel method (Alberta in 2008, 2009; Connecticut in 2008; South Korea in 2011; Ontario in 2011) are included in the Appendices, but the online panel prevalence rates are not included in the Tables or the overall analysis because they are likely significantly inflated. Although correction factors could potentially be developed for these studies, it is not necessary, as these studies have all also employed a coincidental telephone survey, where more reliable conversion factors have been developed.
Table 15 summarizes the administration modality correction factors used to standardize prevalence rates between studies and produce a rate closest to a rate that would be likely obtained using face-to-face administration.
Table 15. Administration Modality Correction Weights.
Telephone Administration; No Evidence of Corrective Procedures to Avoid Undersampling of High Risk Groups; Response Rate < 45%
2.18
Telephone Administration; No Evidence of Corrective Procedures to Avoid Undersampling of High Risk Groups; Response Rate 45% - 75% or Unknown14
1.59
Telephone Administration; Presence of Corrective Procedures to Avoid Undersampling of High Risk Groups (regardless of Response Rates) OR Absence of Corrective Procedures to Avoid Undersampling of High Risk Groups but with Response Rate > 75%
1.44
Self-Administered survey that is mailed-in or completed online (not online panel); All Response Rates
1.00
Note 1. If the administration modality is unknown (i.e., not indicated in the report), then no multiplication factor is applied and the multiplication factor for the Survey Description (see next section) is also not applied. The reason for this is that these two weightings typically offset each other. Note 2. The survey is presumed not to have applied corrective procedures to avoid sampling biases if stratification or post-hoc weighting is not mentioned in the report.
14
If the response rate is unknown it is presumed to be a mid-range response rate.

33
How the Survey is Described to Potential Participants
Another important methodological variation that is known to have a significant impact on problem gambling prevalence rates concerns how the survey is described to potential participants prior to their decision to opt in or out. Research in other fields has shown that a primary reason for survey nonparticipation is lack of interest in the topic (Groves, Presser & Dipko, 2004; Tourangeau & Yan, 2007). Thus, it is reasonable to presume that describing the survey as a ‘gambling’ survey (as is typically done) creates a sampling bias by causing greater participation by gamblers who are interested in this topic and greater refusal by non-gamblers who are not interested. Indeed, this is exactly what was found by Williams & Volberg (2009, 2010), where the rates of problem gambling were approximately 2.27 times higher15 in a study described as a ‘gambling survey (G)’ compared to an identical survey that was described as a study about ‘health and recreational activities (HR)’ in a random sample of 3,028 adults from Ontario in 2008. This was the result without demographic weighting to correct for any sampling biases. However, demographic weighting does very little to correct this problem, as the prevalence rate is still 1.94 times higher after age x gender weighting. These findings were obtained with an overall response rate of 42%. Presumably the influence of survey description will be lower with higher response rates and higher with lower response rates.
In the present study, to correct for differences in how the survey is described so as to produce rates closer to what would be obtained with a nonspecific description, the problem gambling prevalence rates in ‘gambling surveys’ with response rates of 44% or less (and without corrective procedures to avoid demographic sampling biases) will have their problem gambling prevalence rate multiplied by 0.51.16 ‘Gambling surveys’ with a survey response rate of 45% to 75% will have their prevalence rates adjusted by half as much (i.e., multiplication factor of .74). ‘Gambling surveys’ with a survey response rate of greater than 75% will not receive any correction. ‘Gambling surveys’ with corrective procedures to avoid demographic sampling biases will have their problem gambling prevalence rate multiplied by 0.53 when they have a survey response rate of 44% or less and a multiplication factor of 0.76 when their response rates are between 45% and 75%.
Table 16 summarizes the survey description correction factors used in the present study to standardize prevalence rates between studies and produce a rate closest to the rate that would be obtained with a nonspecific description of the survey unlikely to cause sampling biases.
15
This is the G/HR problem gambling ratio averaged across the four assessment instruments: CPGI 3+, SOGS 3+, NODS 3+, and PPGM. 16
This is the multiplication factor averaged across the four assessment instruments (CPGI 3+, SOGS 3+, NODS 3+, PPGM) needed to convert a ‘gambling’ problem gambling prevalence to a ‘health and recreation’ problem gambling prevalence.

34
Table 16. Survey Description Correction Weights.
“Gambling Survey” or Survey Description Unknown; No Evidence of Corrective Procedures to Avoid Undersampling of High Risk Groups; Response Rate < 45%
0.51
“Gambling Survey” or Survey Description Unknown; No Evidence of Corrective Procedures to Avoid Undersampling of High Risk Groups; Response Rate 45% - 75% or Unknown
0.74
“Gambling Survey” or Survey Description Unknown; Presence of Corrective Procedures to Avoid Undersampling of High Risk Groups; Response Rate < 45%
0.53
“Gambling Survey” or Survey Description Unknown; Presence of Corrective Procedures to Avoid Undersampling of High Risk Groups; Response Rate 45% - 75% or Unknown
0.76
“Gambling Survey” or Survey Description Unknown; Presence or Absence of Corrective Procedures to Avoid Undersampling of High Risk Groups; Response Rate > 75%
1.00
Note 1. The survey is presumed to be described as a ‘gambling survey’ if survey description is not specifically mentioned in the study report and the survey was intended primarily to establish the prevalence of gambling and problem gambling. Note 2. The survey is presumed not to have applied corrective procedures to avoid sampling biases if stratification or post-hoc weighting is not mentioned in the report.

35
Threshold used to Administer Questions about Problem Gambling
A final important methodological variation that is known to have a significant impact on problem gambling prevalence rates concerns the threshold for administering problem gambling questions. Engaging in any gambling in the past year is a common criterion used to administer questions about problem gambling. However, research by Williams & Volberg (2009, 2010) has found that this criterion results in too many false positives on problem gambling instruments as determined by subsequent clinical assessment. These same investigators found that false positives can be significantly reduced by: a) using a higher threshold for the designation of problem gambling (i.e., CPGI 5+ versus CPGI 3+); and/or b) requiring a minimal frequency of gambling in the past year (i.e., at least 10 times on some gambling format) before administering problem gambling screens; and/or c) resolving these cases of inconsistent gambling behaviour by automatically asking people to explain the discrepancy between their problem gambling classification in the absence of significant gambling behaviour, or intensive gambling involvement in the absence of reports of problems (Williams & Volberg, 2009, 2010). Note that requiring a minimal amount of gambling expenditure is not advisable because a significant percentage of problem gamblers report winning or being ahead ‘in a typical month’ (Williams & Volberg, 2009, 2010).
In the present study, no adjustment is made for differing problem gambling thresholds, because the equivalent of a CPGI 5+ criterion is used for the designation of problem gambling (see Instrument Standardization Section). However, studies that use overly stringent criteria (e.g., having to score as a problem gambler on a screen before being administered a full assessment instrument; needing very high gambling expenditures; etc.) are excluded from the analysis (i.e., Brazil in 2006; Switzerland in 2007; United States in 2001-2003).

36
STANDARDIZED PROBLEM GAMBLING PREVALENCE RATES
Using the conversion weights described in the previous section, ‘standardized’ problem gambling prevalence rates were created for each prevalence study. The specific weightings used for each study are contained in the Appendices. Tables 17, 18, 19, and 20 document the standardized problem gambling prevalence rates in different jurisdictions as a function of survey year (which range from 0.4% in Tasmania in 1999 to 8.1% in Puerto Rico in 1997). What these figures represent is the percentage of the adult population that was deemed to be a problem gambler using a past-year time frame when the main methodological differences are taken into account. If a study was conducted over two calendar years, the prevalence rate is reported in the second year. If the methodology was faulty, or there was insufficient information to calculate a standardized prevalence rate, or if a non-standard instrument was used, no standardized rate is reported but an asterisk is placed in the table to indicate that a prevalence study was conducted in that year. When two different studies were conducted in the same year or when two or more different instruments were used concurrently in the same prevalence study, the prevalence rate reported in the cell is the averaged rate between these studies or instruments.

37 Table 17. Standardized Adult Past Year Prevalence Rates of Problem Gambling in National Studies.
1
97
5
19
76
19
77
19
78
19
79
19
80
19
81
19
82
19
83
19
84
19
85
19
86
19
87
19
88
19
89
19
90
19
91
19
92
19
93
19
94
19
95
19
96
19
97
19
98
19
99
20
00
20
01
20
02
20
03
20
04
20
05
20
06
20
07
20
08
20
09
20
10
20
11
Ave
rag
e
Australia 3.9 3.917
Belgium 2.8 2.8
Brazil *
Canada 2.2 1.2 2.0 1.818
Denmark 0.5 0.5
Estonia 1.6 2.1 1.9
Finland 2.1 2.4 1.5 2.0
France 1.1 1.1
Germany 0.6 0.6 0.8 0.6 0.9 0.7
Great Britain 0.8 0.7 1.3 0.9
Hong Kong 7.6 4.8 4.4 5.6
Hungary 1.0 1.0
Iceland 0.7 1.2 1.0 1.0
Italy 2.3 2.3
Lithuania *
Macau 6.0 6.0
Netherlands 0.5 0.5
New Zealand 2.6 1.0 * 1.0 1.5
N. Ireland 3.3 3.3
Norway 0.8 0.7 1.7 0.9 0.9 1.4 1.1
Singapore 4.9 3.5 3.1 3.8
South Africa * * * 6.4 6.4
South Korea * 0.9 0.8 0.9
Sweden 1.4 1.5 1.5
Switzerland 2.4 1.0 * 1.7
United States * 1.7 4.6 * 3.219
Average 2.6 0.8 1.8 1.9 2.5 7.6 1.0 4.1 1.1 2.4 1.8 1.2 3.3 1.2 1.5 2.1 2.3
*Prevalence study has been conducted but the results cannot be standardized because of faulty methodology, insufficient information, or use of a non-standard assessment instrument.
17
An alternative figure can be derived from the 33 Australian state and territorial prevalence rates in Table 18 with the average for each state/territory given a weighting representing their current proportion of the Australian population = 2.1%. 18
An alternative figure can be derived from the 51 Canadian provincial prevalence rates in Table 19 with the average for each province given a weighting representing their current proportion of the Canadian population = 2.4%. 19
An alternative figure can be derived from the 56 U.S. state and territorial rates in Table 20 with the average for each state/territory given a weighting representing their current proportion of the United States population = 2.1%.

38 Table 18. Standardized Adult Past Year Prevalence Rates of Problem Gambling in Australian States/Territories.
19
85
19
86
19
87
19
88
19
89
19
90
19
91
19
92
19
93
19
94
19
95
19
96
19
97
19
98
19
99
19
99
20
00
20
01
20
02
20
03
20
04
20
05
20
06
20
07
20
08
20
09
20
10
20
11
Ave
rag
e
Australian Capital Territory 3.4 2.2 1.3 2.3
New South Wales 1.8 2.4 4.2 1.1 1.4 2.2
Northern Territory 3.1 1.1 2.1
Queensland 1.9 2.9 2.1 1.9 1.6 2.1
South Australia * 2.5 4.1 1.3 2.6
Tasmania 1.3 6.4 0.4 1.5 1.7 0.6 2.0
Victoria 2.1 2.4 2.6 3.5 1.0 2.7 2.6 2.4
Western Australia 0.6 0.7 0.7
Average 1.3 1.2 4.3 2.4 2.4 2.6 2.9 1.5 3.1 1.0 2.1 1.4 1.1 1.7 2.6 1.4 2.0
*Prevalence study has been conducted but the results cannot be standardized because of faulty methodology, insufficient information, or use of a non-standard assessment instrument. Note 1. The second 1999 column represents standardized rates from the Australian Productivity Commission (1999) study (the only national Australian study). Note 2. Weighting state/territory averages by their current % of the Australian population: 2.3(.016) + 2.2(.326) + 2.1(.01) + 2.1(.20) + 2.6(.075) + 2.0(.023) + 2.4(.248) + 0.7(.101) = 2.1% Note 3. Weighting the most recent state/territory figure by current % of the Australian population: 1.3(.016) + 1.4(.326) + 1.1(.01) + 1.6(.20) + 1.3(.075) + 0.6(.023) + 2.6(.248) + 0.7(.101) = 1.6%
Table 19. Standardized Adult Past Year Prevalence Rates of Problem Gambling in Canadian Provinces.
19
85
19
86
19
87
19
88
19
89
19
90
19
91
19
92
19
93
19
94
19
95
19
96
19
97
19
98
19
99
20
00
20
01
20
02
20
02
20
03
20
04
20
05
20
06
20
07
20
07
20
08
20
09
20
10
20
11
Ave
rag
e
Alberta 4.6 4.1 3.5 1.2 2.3 1.6 2.4 2.8
British Columbia 6.0 6.0 2.1 1.1 2.0 2.8 3.3
Manitoba 3.6 3.6 2.1 1.8 2.7 2.8
New Brunswick 3.8 6.5 2.0 2.5 3.7
Newfoundland & Labrador 2.2 1.5 1.9
Nova Scotia 2.6 2.1 1.1 1.4 1.7 1.8
Ontario 4.9 4.2 1.7 1.2 3.0 2.2 2.2 0.8 1.2 2.4
Prince Edward Island 1.7 1.0 1.4
Quebec 1.9 1.7 1.4 0.9 1.1 1.0 1.3 1.3
Saskatchewan 2.1 3.7 1.7 1.2 2.2
Average 1.9 3.8 4.0 3.9 4.1 4.1 1.7 2.6 1.8 1.3 2.2 1.8 2.7 1.9 2.1 1.2 1.9 1.2 2.4
Note 1. The second columns in 2002 and 2007 represent standardized rates for the two national studies of problem gambling: the 2002 CCHS study (Study #5 in Appendix A) and the 2006/2007 Williams & Wood (2008) study (Study #6 in Appendix A). Note 2. Weighting provincial averages by their % of the Canadian population: 2.8(.109) + 3.3(.133) + 2.8(.036) + 3.7(.022) + 1.9(.015) + 1.8(.028) + 2.5(.388) + 1.4(.004) + 1.3(.232) +2.2 (.031) = 2.4%. Note 3. Weighting the most recent provincial figure by its current % of the Canadian population: 2.4(.109) + 2.8(.133) + 2.7(.036) + 2.5(.022) + 1.5(.015) + 1.7(.028) + 1.2(.388) + 1.0(.004) + 1.3(.232) +1.2 (.031) = 1.7%.

39 Table 20. Standardized Adult Past Year Prevalence Rates of Problem Gambling in U.S. States and Territories.
19
75
19
76
19
77
19
78
19
79
19
80
19
81
19
82
19
83
19
84
19
85
19
86
19
87
19
88
19
89
19
90
19
91
19
92
19
93
19
94
19
95
19
96
19
97
19
98
19
99
20
00
20
01
20
02
20
03
20
04
20
05
20
06
20
07
20
08
20
09
20
10
20
11
Ave
rag
e
Arizona 1.6 1.6
California 2.1 1.7 1.9
Colorado 2.4 2.4
Connecticut * * 3.2 2.9 1.1 2.4
Delaware 2.2 0.6 1.4
Florida 1.1 1.1
Georgia 1.9 1.9 1.4 1.7
Indiana * 1.2 * 1.2
Iowa 0.9 2.8 0.9 1.5
Kentucky 1.6 1.1 1.4
Louisiana 3.8 3.6 2.7 1.3 2.9
Maryland 2.0 1.9 2.0
Massachusetts 2.2 2.2
Michigan 1.9 2.7 2.2 1.6 2.1
Minnesota 2.6 4.6 3.6
Mississippi 3.9 3.9
Missouri *
Montana 1.9 3.0 2.5
Nevada * 2.7 2.7
New Jersey * 2.1 3.4 2.8
New Mexico * 1.2 1.2
New York 2.1 1.5 1.2 1.6
North Carolina *
North Dakota 1.7 1.2 1.5
Ohio *
Oregon 3.4 1.2 2.1 2.2
Pennsylvania *
Puerto Rico 8.1 8.1
South Dakota 1.5 1.2 1.4
Texas 2.0 2.4 2.2
Washington 2.4 1.9 2.1 2.1
Wisconsin 1.3 1.3
Average 2.1 2.1 1.6 2.7 2.4 2.0 1.2 3.3 2.6 2.8 4.0 2.4 2.7 1.2 2.0 2.7 1.6 2.1 2.1 1.4 1.4 1.2 1.9 0.9 2.2
*Prevalence study has been conducted but the results cannot be standardized because of faulty methodology, insufficient information, or use of a non-standard assessment instrument. Note 1. Weighting state/territory averages by their current proportion of the total population = 2.1%. Note 2. Weighting the most recent state figure by their current proportion of the total population: = 1.9%. (Note however, that the present states/territories only comprise 67.4% of the U.S. population as there are several other states that have not conducted prevalence studies, with these latter states having less gambling availability compared to states that have conducted prevalence studies).

40
Standardization significantly reduces the magnitude of artifactual differences between studies, and facilitates comparisons between different jurisdictions and between different time periods within the same jurisdiction. However, it is important to recognize that directly comparing one rate to another rate is still somewhat problematic, as:
There are large confidence intervals around most of these rates.
Although studies with nonrepresentative sampling are not included in the tables, many studies with suboptimal sampling strategies are included. Similarly, although many studies employed strategies to correct for sampling deviations from the population, there are varying degrees to which this has been satisfactorily addressed.20
Some studies do not report sufficient information about their methodology. Consequently, it is uncertain whether all the appropriate weightings have been applied.
Some of the weighting factors may be influenced by unknown jurisdictional and/or temporal interactions. The weightings used for administration format and survey description, in particular, have received limited cross-jurisdictional validation.
There are undoubtedly additional methodological factors that have some influence on prevalence rates but which have not been corrected for.21
20
For example, most surveys did not weight the data by household size to correct for the oversampling of individuals from single or two person households relative to people from large households. 21
For example, in Canada, provincial studies done as part of the Canadian Community Health Survey (CCHS) (i.e., all Canadian provinces in 2002; and Ontario, Quebec, and Saskatchewan in 2008) consistently have lower problem gambling prevalence rates after standardization compared to other provincial surveys. This may be due to lack of anonymity, as unlike all other Canadian prevalence studies, participants in the CCHS studies are asked to provide their name and birth date at the outset of the interview (which is typically conducted at the person’s residence).

41
DIFFERENCES IN STANDARDIZED PROBLEM GAMBLING PREVALENCE RATES BETWEEN JURISDICTIONS
In addition to the limitations noted in the previous section, comparison of problem gambling prevalence rates between jurisdictions is constrained by the fact that prevalence studies are done in different years, and problem gambling prevalence rates have changed over time (see next section on Changes in Standardized Problem Gambling Prevalence Rates within Jurisdictions). Thus, direct statistical comparisons between prevalence rates in one jurisdiction relative to another jurisdiction are best only done when both studies are conducted in the same time period. That being said, some unambiguously large and consistent differences in standardized rates appear to exist between jurisdictions. The remainder of the present section will identify where those differences are, based on the magnitude of the differences observed, whether these differences occurred in the same time period, and whether these differences are consistent across different time periods (Note: a z test of proportions was used to assess whether differences were statistically significant, but the results of the hundreds of pairwise statistical comparisons are not reported):
National (Between Country) Differences
The standardized past year rate of problem gambling ranges from 0.5% in Denmark (2005) and the Netherlands (2004) to 7.6% observed in Hong Kong in 2001. The average rate across jurisdictions is 2.3%. In general, the lowest standardized prevalence rates of problem gambling tend to occur in Europe, with intermediate rates in North America and Australia, and the highest rates in Asia. More specifically, the lowest standardized prevalence rates of problem gambling occur in Denmark, the Netherlands, and Germany. Lower than average rates are seen in Great Britain, South Korea, Iceland, Hungary, Norway, France, and New Zealand (excluding 1991). Average rates occur in Sweden, Switzerland, Canada, Australia, United States, Estonia, Finland, and Italy. Above average rates occur in Belgium and Northern Ireland. The highest rates are observed in Singapore, Macau, Hong Kong, and South Africa. It is beyond the scope of this report to explore the many reasons for these differences. However, one factor may be the age difference between jurisdictions (Appendix E shows that younger average population age is strongly associated with problem gambling). The correlation between average standardized problem gambling prevalence rate (over all time periods) and median age in 2010 for national jurisdictions is r = -.49, (p = .025; 2 tail; 24 pairs).

42
Australian State/Territorial Differences
The standardized past year rate of problem gambling ranges from 0.4% in Tasmania in 1999 to 6.4% in Tasmania in 1996. The average rate across states/territories is 2.0%. The lowest rates occur in Western Australia. Other states appear to have average rates. Sampling problems preclude definitive statements about the Northern Territory.22
Canadian Provincial Differences
The standardized past year rate of problem gambling ranges from 0.8% in Ontario in 2008 to 6.5% in New Brunswick in 1996. The average rate across provinces is 2.4%. Quebec and Prince Edward Island have had consistently low rates. Nova Scotia has had below average rates. Somewhat higher than average rates have tended to occur Alberta, New Brunswick, and British Columbia. Intermediate rates have occurred in other provinces. No prevalence studies have been conducted in the 3 territories (Yukon, Nunavut, Northwest Territories).
U.S. State/Territorial Differences
The standardized past year rate of problem gambling ranges from 0.6% in Delaware in 2000 to 8.1% in Puerto Rico in 1997. The average rate across states/territories is 2.2%. The prevalence rate in Puerto Rico is significantly higher than all other rates and it is the highest rate of all 190 prevalence studies. Mississippi, Louisiana, and Nevada have also had higher than average rates, as did Minnesota and New Jersey prior to 1995. Lower than average rates have been obtained in Florida, Indiana, New Mexico, Wisconsin, Kentucky, Delaware, North and South Dakota, and Iowa. Intermediate rates have been obtained in all other states. However, it is also important to recognize that only 31 of the 50 U.S. states have conducted a prevalence study of gambling, with prevalence studies being more common in states with a higher level of gambling availability. Prevalence studies have not been conducted in the 2 states without any legal gambling (Hawaii, Utah), and have only been conducted in 3 of the remaining 10 states that do not have any electronic gambling machines (EGMs) or casinos (i.e., Georgia, Kentucky, and Massachusetts; but not Arkansas, New Hampshire, Ohio, South Carolina, Tennessee, Vermont, and Virginia).
22
i.e., significant undersampling of the 30% of the population that is indigenous.

43
CHANGES IN STANDARDIZED PROBLEM GAMBLING PREVALENCE RATES WITHIN JURISDICTIONS
Framing the Issue
For many years, it was widely assumed that as gambling opportunities increased, there would be corresponding increases in the prevalence of problem gambling and related harms. However, the validity of this belief has become the topic of ongoing debate. This was originally sparked by the publication of a series of commentary articles in the pages of Addiction in which Orford (2005a) asks “Is the relationship between exposure and harm a straightforward one?” and notes:
I refer to the view that … the more the product is supplied in an accessible form, the greater the volume of consumption and the greater the incidence and prevalence of harm. I doubt there would be many who would argue with that basic public health law when it comes to, for example, the supply of alcohol, tobacco and other drugs of various kinds. It would be very surprising indeed if that general rule were not also true for gambling (Orford, 2005a: 1236).
These remarks were prompted by invited responses to Orford’s original “For Debate” article. In response, Shaffer (2005) argues that the exposure hypothesis is disproved by evidence that the relationship between gambling exposure and problem gambling prevalence is not linear. Shaffer goes on to propose an alternative hypothesis:
That is, after the novelty of initial exposure, people gradually adapt to the risks and hazards associated with potential objects of addiction … Consequently, the public policy questions of importance are, how long does it take to adapt and can we afford to wait that long after a group is newly exposed? (Shaffer, 2005: 1228).
The idea of a close link between the availability of gambling and the prevalence of problem gambling is an example of the “total consumption model,” also referred to as the “single distribution theory.” The basic assertions of this theory are that there is a close connection between average consumption of a product in the population and the prevalence of excessive users, that consumption is distributed in the population in a curve characterized primarily by moderate consumption but with a minority of excessive behavior in the tail, and that the curve responds as a single entity to changes in overall distribution (Rose, 1985; Rose & Day, 1990). The total consumption model has been found to apply in several areas of public health, including alcohol consumption, obesity, high blood pressure and birth weight (Lund, 2008). The applicability of the total consumption model in relation to gambling has been scrutinized by several investigators. For example, Grun and McKeigue (2000) examined data from the British Family Expenditure Survey from a year before and a year after the introduction of the National Lottery to determine whether there had been an increase in “excessive” gambling expenditures. They found that there had been increases in the proportion of households that spent money on

44
gambling (from 40% to 75%), an overall increase in spending (from 0.5% of income to 1.5% of income) and an increase in the proportion of households spending more than 10% of their income on gambling (from 0.4% to 1.7%). In Norway, Lund (2008) found that gambling frequency among adults and adolescents as well as among males and females was distributed in ways consistent with the theory while Hansen and Rossow (2008) found significant correlations between indicators of problem gambling and the overall amount of gambling at the aggregate (school) level among Norwegian adolescents. While the total consumption theory does not specifically address the issue of availability or the nature of the link between frequent consumption and problematic consumption, its advocates argue that a focus on the population provides support for policy measures intended to reduce the average gambling involvement of the entire population (Lund, 2008; Orford, 2005b). In response to the exchange in Addiction, Abbott (2006) undertook a critical review of the literature to assess support for the exposure and adaptation hypotheses. He concluded that scientific investigation of the relationship between increased availability and problem gambling prevalence is significantly hampered by variability in the aspects of exposure selected for investigation, by difficulties in measuring different parameters of exposure (e.g., dose, potency), and by lack of information about problem gambling duration. Based on the available evidence, Abbott proposed a modified formulation that includes both exposure and adaptation. He argued that the impacts of exposure are confined to the early stages of the introduction of new gambling forms while adaptation occurs subsequently, at both individual and societal levels. Separately, LaPlante and Shaffer (2007) proposed a similar conceptual framework that “rests on an integrated and interactive exposure and adaptation process.”
Casino Employees
The exposure theory predicts that casino industry employees will have elevated rates of problem gambling. And indeed, there is clear evidence of this. A study of U.S. casino employees found that these individuals had higher rates of pathological gambling, but not problem gambling, relative to the general population (Shaffer, Vander Bilt, & Hall, 1999). However, in support of the notion of adaptation, newer employees had more gambling-related problems in the past year than more experienced employees. High rates of problem gambling have been found among Chinese casino employees in Macau (Wu and Wong, 2008). A study of Alberta casino employees also found significantly higher rates of problem gambling compared with the general population (Dangerfield, 2004). Follow-up research established that the basis for this high rate was primarily due to problem gamblers being attracted to the casino industry rather than newer employees becoming problem gamblers (Dangerfield, 2004). A similar but much larger study of Ontario casino employees found problem gambling rates three times higher than the Ontario general population, with this higher rate being explained by both employees who increased their gambling after beginning their jobs and employees who were attracted to their jobs because of prior gambling involvement (Guttentag, 2010). Finally, Hing and Gainsbury (2011) surveyed staff from casinos, hotels and clubs in Queensland, Australia using a questionnaire that allowed for direct comparisons to the Queensland adult population. They found that the problem gambling rate was 9.6 times higher among the employees compared to

45
the Queensland population. A substantial proportion of problem gamblers (73% of CPGI 8+ and 40% of CPGI 3 - 7 gamblers) reported increasing their gambling since starting work in a gaming venue.
Proximity to Gambling Opportunities
Many studies have found a relationship between proximity to gambling venues and the prevalence of problem gambling. For example, the 2000/2001 survey in Nevada found a standardized problem gambling prevalence rate of 2.7%. While this is higher than the average rate of 2.3% across all states/territories, it is not as high as one would expect. Indeed, Shaffer, LaBrie and LaPlante (2004) argued that if exposure were the “driving force” in creating gambling problems, then the prevalence of problem gambling in Nevada should be at least eight times higher than in any other state. Furthermore, in support of the notion of adaptation, respondents in the Nevada study who had lived in the state for less than ten years were more likely to be problem gamblers than those who had lived in the state for ten years or more and Nevada adolescents were less likely than adolescents in other states to gamble or to have gambling-related problems (LaPlante & Shaffer, 2007; Volberg, 2002a, 2002b). In 1998, analysis of the U.S. Gambling Impact and Behavior Study data found that location of a casino within 50 miles was associated with approximately double the rate of pathological gambling (Gerstein et al., 1999). In a separate U.S. national-level study, Welte et al. (2004) determined that the location of a casino within 10 miles of an individual’s home is independently associated with a 90% increase in the odds of being a problem or pathological gambler. In another neighborhood analysis, Welte and colleagues (2007) found that residential proximity to casinos in the U.S. predicted gambling problems for men aged 30 and over but not for other major demographic groups. Shaffer, LaBrie and LaPlante (2004) examined county-level prevalence estimates from the 2000/2001 survey in Nevada in relation to casino availability and found that the four counties with the greatest access to casinos had the highest problem gambling rates, and the four with the least availability had the lowest rates. A similar relationship between casino proximity and gambling problems was found in a New Zealand survey conducted in the late 1990s where residency in Auckland and Christchurch, with their large urban casinos, emerged as a strong predictor of gambling problems even when controlling for other factors (Abbott & Volberg, 2000). Pearce and colleagues (2008) examined the question of availability at the neighborhood level in New Zealand using GIS data from the 2002-2003 New Zealand Health Survey. They found that residents living in the quartile of neighborhoods with the greatest access to gambling were significantly more likely to gamble and to have gambling-related problems and concluded that neighborhood access to gambling opportunities increases the probability of gambling participation and gambling-related problems. In the late 1990s, a national Australian survey commissioned by the Productivity Commission (1999) concluded that problem gambling prevalence rates were generally higher in states and territories with greater accessibility and expenditure.

46
In Canada, Sévigny and colleagues (2008) analyzed data from a 2002 survey of Quebec residents to assess the relationship between casino proximity and gambling participation and problems. While there was a positive relationship between casino proximity and participation at both the provincial and city level, the prevalence of pathological gambling was actually highest among respondents living farthest from a casino. The researchers concluded that their findings supported the exposure hypothesis but argued that the relationship between exposure to casinos and the development of gambling problems is complex and that people who live in the vicinity of a casino for an extended period of time may adapt their behaviors in reaction to exposure. Most recently, Williams, Belanger & Arthur (2011) analyzed data from the 2008 and 2009 Alberta prevalence studies. These investigators found that while residential proximity to casinos was statistically related to problem gambling prevalence, it was a relatively weak relationship. Finally, Storer, Abbott and Stubbs (2009) conducted a meta-analysis of 34 surveys completed in the Australian states and territories and in New Zealand to examine the relationship between density of EGMs, the passage of time and the prevalence of problem gambling. The researchers used multiple regression to examine relationships between problem gambling prevalence, jurisdiction, year, adult population, number of EGMs and survey sample size. The findings indicated that the prevalence of problem gambling increased with increasing density of EGMs at a rate of about 0.8 problem gamblers for each additional EGM. There was no evidence of a leveling of problem gambling prevalence with increasing density of EGMs. However, there was a clear decrease in problem gambling prevalence over time with an average annual decrease in prevalence of 0.09% in the absence of any change in EGM density. Storer and colleagues concluded that, while there was support for the exposure hypothesis, the question of adaptation appeared to be more complex. In discussing their results, Storer and colleagues (2009) noted that decreases in prevalence can occur due to a reduction in incidence or in problem duration. A variety of factors, at both the individual and community levels, are likely to influence incidence and problem duration, including natural recovery or professional intervention (at the individual level) and adjusting to the novelty of gambling opportunities or increasing awareness of potential harms (at the community level). They further noted that a decrease in problem gambling prevalence over time could be due to population adaptation in the form of “natural selection,” with unsuccessful individuals removed from the problem gambling “pool” due to severe personal or financial crises, criminal charges arising from their behavior, or in extreme cases, suicide. These different aspects of adaptation suggest quite different policy approaches, with prevention and early intervention more likely to be beneficial in cases where adaptation is taking place at the individual and community level but with stronger measures related to limiting or reducing EGM density and concentration more likely to be helpful in cases where population adaptation is occurring.

47
Replication Studies
The above evidence mostly comes from single cross-sectional surveys rather than studies that examine changes in problem gambling prevalence in the same jurisdiction over time. Replication surveys provide a more direct test of the exposure versus adaptation hypotheses, as gambling availability has generally continued to increase in most jurisdictions in the past 30 years. The majority of National jurisdictions that have conducted a prevalence study of problem gambling have conducted at least one additional survey in subsequent years. The prevalence rates over time for these jurisdictions are reported in Table 21. Most U.S. states that have conducted a prevalence study have conducted more than one, with these rates reported in Table 24. All Canadian provinces and all Australian states and territories have conducted at least two prevalence studies, with these studies reported in Tables 22 and 23 respectively. For each nation, state, or province, a z test of proportions was used to determine whether the standardized problem gambling prevalence rate in one time period differed significantly from other time period(s) (p < .01; 2 tail). An asterisk in a cell indicates that the prevalence rate differed significantly from at least one other time period in that jurisdiction. (Note: The likelihood of obtaining a significant difference between two time periods is not only a function of the jurisdiction, but also a function of sample size, the particular years examined, and the time interval between the years. Sample sizes vary considerably, ranging from a low of 600 in the Northern Territory in 1999 to 42,145 in Ontario in 2008.)

48
Table 21. Standardized Adult Past Year Problem Gambling Prevalence Rates in Nations that have Conducted more than One Problem Gambling Prevalence Survey.
19
91
19
92
19
93
19
94
19
95
19
96
19
97
19
98
19
99
20
00
20
01
20
02
20
03
20
04
20
05
20
06
20
07
20
08
20
09
20
10
20
11
* Significant Differences
Canada 2.2 1.2* 2.0 2002 < other years
Estonia 1.6 2.1
Finland 2.1 2.4* 1.5 2007 > 2011
Germany 0.6 0.6 0.8 0.6 0.9
Great Britain 0.8 0.7 1.3* 2010 > other years
Hong Kong 7.6* 4.8 4.4 2001 > 2005 & 2011
Iceland 0.7 1.2* 1.0 2005 > 2000
New Zealand 2.6* 1.0 1.0 1991 > other years
Norway 0.8 0.7 1.7* 0.9 0.9 1.4 2005 > 1997, 2002, 2007, 2008
Singapore 4.9 3.5 3.1 2005 > 2011
South Korea 0.9 0.8
Sweden 1.4 1.5
Switzerland 2.4* 1.0 1998 > 2005
United States 1.7 4.6* 2000 > 1998

49
Table 22. Standardized Adult Past Year Problem Gambling Prevalence Rates in Australian State/Territories that have Conducted more than One Problem Gambling Prevalence Survey.
19
94
19
95
19
96
19
97
19
98
19
99
19
99
20
00
20
01
20
02
20
03
20
04
20
05
20
06
20
07
20
08
20
09
20
10
20
11
* Significant Differences
Australian Capital Territory
3.4 2.2 1.3* 2009 < other years
New South Wales 1.8 2.4* 4.2* 1.1 1.4 1999 > other years; 1997 > 2006 & 2009
Northern Territory 3.1* 1.1 1999 > 2005
Queensland 1.9 2.9* 2.1* 1.9 1.6 2001 > other years; 2004 > 2009
South Australia 2.5 4.1 1.3* 2005 < other years
Tasmania 1.3 6.4* 0.4 1.5 1.7* 0.6 1996 > other years; 2005 > 2007
Victoria 2.1 2.4 2.6 3.5* 1.0* 2.7 2.6 2003 < other years; 1999 > 1996
Western Australia 0.6 0.7
Note 1. The second column in 1999 represents standardized rates from the Australian Productivity Commission (1999) study (the only national Australian study).

50
Table 23. Standardized Adult Past Year Problem Gambling Prevalence Rates in Canadian Provinces that have Conducted more than One Problem Gambling Prevalence Survey.
1
98
9
19
90
19
91
19
92
19
93
19
94
19
95
19
96
19
97
19
98
19
99
20
00
20
01
20
02
20
02
20
03
20
04
20
05
20
06
20
07
20
07
20
08
20
09
20
10
20
11
* Significant Differences
Alberta 4.6* 4.1* 3.5* 1.2* 2.3 1.6 2.4
1993 > 2002,2007,2008,2009; 1997 > 2002,2007,2008; 2001 > 2002,2008; 2002 < 2009
British Columbia 6.0* 6.0* 2.1 1.1 2.0 2.8 1993 & 1996 > 2002,2007
Manitoba 3.6* 3.6* 2.1 1.8 2.7 1993 & 1995 > 2001
New Brunswick 3.8 6.5* 2.0 2.5 1996 > 2001,2009
Newfoundland & Labrador
2.2 1.5
Nova Scotia 2.6 2.1 1.1 1.4 1.7
Ontario 4.9* 4.2* 1.7 1.2 3.0* 2.2* 2.2* 0.8 1.2
1993>2001,2002,2003,2005, 2007,2008, 2011; 1995>2001,2002,2005,2007, 2008,2011; 2003 > 2002,2008,2011; 2005 & 2007 >2002,2008,2011
Prince Edward Island
1.7 1.0
Quebec 1.9* 1.7 1.4* 0.9 1.1 1.0 1.3 1989 > 2002,2008; 2002 > 2008
Saskatchewan 2.1 3.7* 1.7 1.2 2001 > 2002,2008
Note 1. The second columns in 2002 and 2007 represent standardized rates for the two national studies of problem gambling: the 2002 CCHS study (Study #5 in Appendix A) and the 2006/2007 Williams & Wood (2008) study (Study #6 in Appendix A).

51
Table 24. Standardized Adult Past Year Problem Gambling Prevalence Rates in U.S. States that have Conducted more than One Problem Gambling Prevalence Survey.
19
86
19
87
19
88
19
89
19
90
19
91
19
92
19
93
19
94
19
95
19
96
19
97
19
98
19
99
20
00
20
01
20
02
20
03
20
04
20
05
20
06
20
07
20
08
20
09
20
10
20
11
* Significant Differences
California 2.1 1.7
Connecticut 3.2 2.9 1.1* 2008 < other years
Delaware 2.2* 0.6 1998 > 2000
Georgia 1.9 1.9 1.4
Iowa 0.9 2.8* 0.9 1995 > 1989, 2011
Kentucky 1.6 1.1
Louisiana 3.8 3.6 2.7 1.3* 2008 < other years
Maryland 2.0 1.9
Michigan 1.9 2.7 2.2 1.6
Minnesota 2.6 4.6* 1994 > 1990
Montana 1.9 3.0
New Jersey 2.1 3.4
New York 2.1 1.5 1.2
North Dakota 1.7 1.2
Oregon 3.4* 1.2 2.1 1997 > 2000
South Dakota 1.5 1.2
Texas 2.0 2.4
Washington 2.4 1.9 2.1

52
As can be seen in Tables 21 through 24, several significant differences were found.
National Differences
Of the 14 National jurisdictions that assessed prevalence rates at more than one period, 71.4% (10/14) found significant differences between time periods. For these latter studies, 50.0% (5/10) found significant decreases in recent years compared to earlier years (Finland, Hong Kong, New Zealand, Switzerland), 30.0% (3/10) found significant increases in recent years relative to earlier years (Great Britain, Iceland, United States), and 20.0% (2/10) found that rates either peaked in the middle (Norway) or were at their lowest in the middle (Canada). The Canadian result is due to the anomalously low CCHS 2002 rates relative to other years, which may be artifactual (see Footnote 21). In any case, changes in the provincial rates over time is a better data set with which to evaluate this question. The increased U.S. rate is partly due to the relatively early comparison years (1998 versus 2000). Here again, changes in state rates over time is a better data set to evaluate this question.23 Another way of examining this issue is simply comparing the first rate in a jurisdiction to its last obtained rate. In 50.0% (7/14) of National jurisdictions, the last obtained rate was lower than the first obtained rate and in 50.0% (7/14) of National jurisdictions, the last obtained rate was higher than the first obtained rate.
Australian State/Territorial Differences
Of the eight Australian states that assessed prevalence rates at more than one period, 87.5% (7/8) found significant differences between time periods. For these latter studies, 85.7% (6/7) found significant decreases in recent years compared to earlier years (Australian Capital Territory, New South Wales, Northern Territory, Queensland, South Australia, Tasmania). One jurisdiction (Victoria) found both the highest and lowest rates to occur in the middle (14.3%; 1/7). When examining the first obtained rate in a jurisdiction compared to its last obtained rate, in 75% (6/8) of cases the last rate was lower than the first rate and in 25% (2/8) of cases, the last rate was higher than the first rate.
Canadian Provincial Differences
Of the 10 Canadian provinces that assessed prevalence rates at more than one period, 70% (7/10) found significant differences between time periods. The lack of significant differences for Newfoundland and Labrador may be due to the recency of its two prevalence studies (2005 and 2009). The lack of significant differences for Nova Scotia and Prince Edward Island may be due to the small sample sizes employed (n < 810 in Nova Scotia for 1993, 1996, 2002; n < 1001 in Prince Edward Island in both survey years). For the studies where significant differences were found, 85.7% (6/7) found significant decreases in recent years compared to earlier years
23
It is also the case that a 2001 – 2003 U.S. study obtained a rate of 1.5%. However, this study (#68 in Appendix A) is not included in the analysis due to the overly stringent criteria used before administering the problem gambling assessment instrument.

53
(Alberta, British Columbia, Manitoba, New Brunswick, Ontario, Quebec) and 28.6% (2/7) found either that the highest rate (Saskatchewan) or the lowest rate (Alberta) peaked in the middle. When examining the first obtained rate in a jurisdiction compared to its last obtained rate, in 100% (10/10) of cases the last rate was lower than the first rate.
U.S. State/Territorial Differences
Of the 18 U.S. states that assessed prevalence rates at more than one period, 33.3% (6/18) found significant differences between time periods. For these latter studies, 66.6% (4/6) found significant decreases in recent years compared to earlier years (Connecticut, Delaware, Louisiana, Oregon), 16.7% (1/6) (Iowa) found the peak rate to be in the middle, and 16.7% (1/6) (Minnesota) found significant increases in recent years relative to earlier years (although in this case the ‘recent year’ was 1994 relative to 1990). When examining the first obtained rate in a jurisdiction compared to its last obtained rate, in 77.7% (14/18) of cases the last rate was lower than the first rate and in 22.2% (4/18) of cases, the last rate was higher than the first rate.
Summary of Changes Within Jurisdictions over Time
A visual representation of average standardized problem gambling prevalence rates over time is presented in Figure 4. What each of the lines in Figure 4 represent is the average standardized prevalence rate in that time period averaged across all nations (black), all Australian states/territories (green), all Canadian provinces (red), and all U.S. states (blue). In order to level out year to year anomalies due to the small number of observations in each year, prevalence rates have been averaged for every 2 year period. These overall trends are even more apparent in Figure 5 where the prevalence rates have been averaged for every 5 year period and the lines have been smoothed.
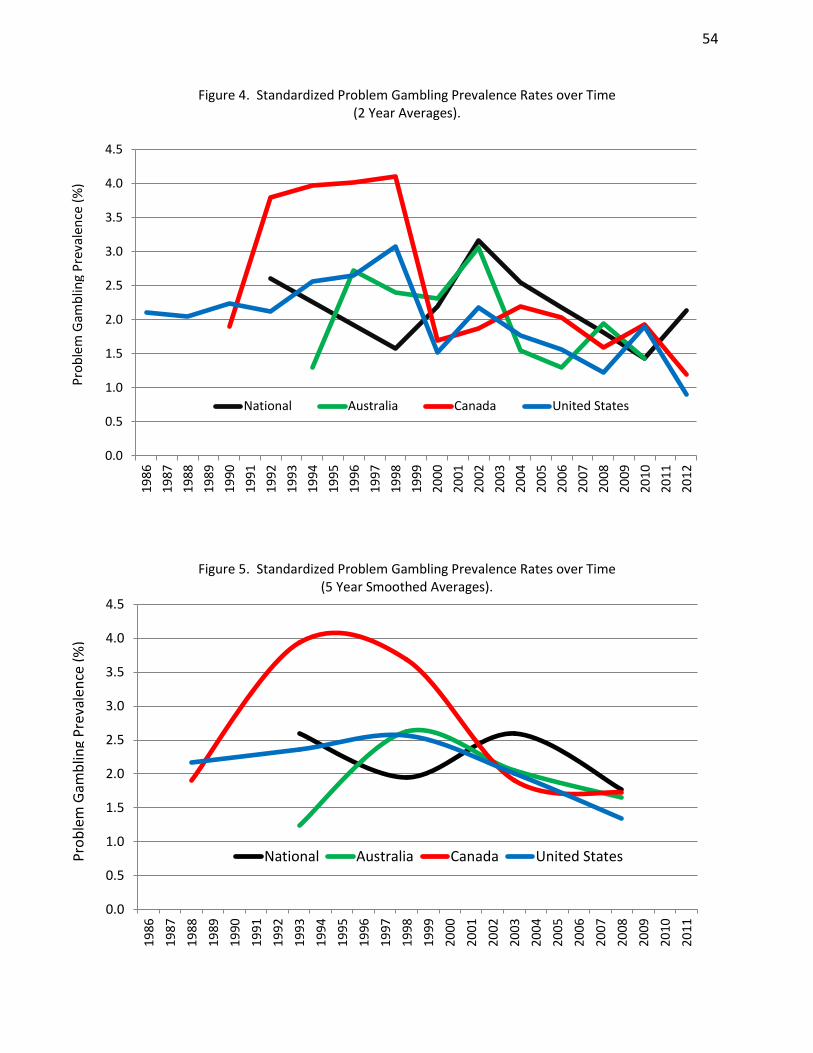
54
Figure 4. Standardized Problem Gambling Prevalence Rates over Time (2 Year Averages).
Figure 5. Standardized Problem Gambling Prevalence Rates over Time (5 Year Smoothed Averages).
0.0
0.5
1.0
1.5
2.0
2.5
3.0
3.5
4.0
4.519
86
1987
1988
1989
1990
1991
1992
1993
1994
1995
1996
1997
1998
1999
2000
2001
2002
2003
2004
2005
2006
2007
2008
2009
2010
2011
2012
National Australia Canada United States
0.0
0.5
1.0
1.5
2.0
2.5
3.0
3.5
4.0
4.5
1986
1987
1988
1989
1990
1991
1992
1993
1994
1995
1996
1997
1998
1999
2000
2001
2002
2003
2004
2005
2006
2007
2008
2009
2010
2011
National Australia Canada United States
Pro
ble
m G
amb
ling
Pre
vale
nce
(%
) P
rob
lem
Gam
blin
g P
reva
len
ce (
%)

55
In general, Figures 4 and 5 show that problem gambling rates started increasing in North America and Australia beginning in the late 1980s to early 1990s prior to achieving a peak in the late 1990s/early 2000s. This time interval is roughly coincident with the most rapid introduction and expansion of legal gambling opportunities in these countries (particularly electronic gambling machines (EGMs) and casinos) as well as the greatest increase in per capita gambling expenditure (Australasian Gaming Council, 2010; National Research Council, 1999; Statistics Canada, 2010). As seen in Figure 6 below, this time period is also coincident with a significant worldwide increase in overall gambling participation. There has been a general worldwide downward trend in both gambling and problem gambling rates beginning in the late 1990s for North America and the early 2000s for Australia and other Nations.
Figure 6. Past Year Gambling Prevalence Rates over Time (All Jurisdictions)
As can be seen in Figures 4 and 5, current rates of problem gambling are now very close or even lower than they were in the late 1980s to early 1990s prior to the main period of gambling expansion. However, it needs to be recognized that almost all of the earliest prevalence studies tended to be conducted coincident with or a few years after the introduction of new form(s) of gambling so as to evaluate the impact of this introduction. Thus, there are very few true ‘baselines’ that would more unambiguously establish whether current rates of problem gambling are the same as what existed prior to any legal gambling availability. Of final note, Figures 4 and 5 illustrate that the rise and fall of rates has been greater for Canada relative to the United States and Australia. This is likely attributable to Canada having comparatively less legal gambling prior to gambling expansion as well as having a more pervasive introduction of these new forms. Lotteries were not introduced in Canada until the

56
mid 1970s, sports betting not until 1984, and EGMs and year-round casinos not until 1989. However, relatively soon after their introduction, virtually all forms of gambling were rapidly and pervasively made available in all 10 provinces (Statistics Canada, 2006, 2010). In contrast, in Australia, lotteries were introduced much earlier (between 1920 – 1966), EGMs have been available in the most populous state of New South Wales since 1955, and the first casino opened in Tasmania in 1972 (Australasian Gaming Council, 2010). Furthermore, there has always been significant regional variation in the availability of certain forms (e.g., very low EGM per capita availability in Western Australia and very high per capita availability in New South Wales) (Australasian Gaming Council, 2010). In the United States, gambling was also introduced more gradually and unevenly than in Canada. Nevada legalized casinos in 1931, the first legal lottery was introduced in New Hampshire in 1964, and New Jersey was the second state to introduce casinos in 1978. Regional differences in the availability of gambling in the United States are also quite pronounced (i.e., in 2011 there was no gambling permitted in the states of Utah and Hawaii, there were 15 states with no casinos, and ~25% of all U.S. EGMs were located just in Nevada; American Gaming Association, 2011; Ferrar, 2011). Considering that gambling availability has steadily increased in most jurisdictions over the past 30 years, these results support both the contention that increased gambling availability is related to increased problem gambling, and the contention that populations tend to adapt over time. Echoing the sentiments of Storer et al. (2009), there are several mechanisms likely responsible for decreasing problem gambling prevalence. They include: a) increased population awareness of the potential harms of gambling (creating less susceptibility); b) decreased overall population participation in gambling (due to greater wariness as well as the novelty having worn off); c) people being removed from the population pool of problem gamblers due to severe adverse consequences deriving from their gambling (e.g., bankruptcy, suicide); d) increased industry and/or government efforts to provide gambling more safely24, to enact programs to prevent problem gambling, and to provide treatment resources; and e) increasing age of the population.
24
The smoking bans in public places (including gambling establishments) that began in the early 2000s was likely one of the more impactful contributions to the decrease in problem gambling (Williams, West, & Simpson, in press).

57
REFERENCES
Abbott, M.W. (2006). Do EGMs and problem gambling go together like a horse and carriage? Gambling Research, 18(1), 7-38. Abbott, M.W. & Volberg, R.A. (1996). The New Zealand national survey of problem and pathological gambling. Journal of Gambling Studies, 12(2), 143-160. Abbott, M.W. & Volberg, R.A. (2000). Taking the pulse on gambling and problem gambling in New Zealand: Phase one of the 1999 National Prevalence Survey. Wellington: Department of Internal Affairs. The American Association for Public Opinion Research (AAPOR) (2011). Standard Definitions: Final Dispositions of Case Codes and Outcome Rates for Surveys. 7th edition. AAPOR. American Gaming Association (2011). State of the States. http://www.americangaming.org/files/aga/uploads/docs/sos/aga-sos-2011.pdf Australasian Gaming Council (2010). A Database on Australia Gambling Industry 2009/2010. http://austgamingcouncil.org.au/images/pdf/2009_10_Database/db%202010%20web%20chp%204.pdf CASRO (1982). Council of American Survey Research Organizations. Special Report: On the Definition of Response Rates. Port Jefferson, NY: Author. Dangerfield, L. (2004). Job Satisfaction, Substance Use, and Gambling Behaviour of Northern Albertan Casino Employees. M.Sc. Thesis. University of Lethbridge. http://hdl.handle.net/10133/553 de Leeuw, E.D. & van der Zouwen, J. (1988). Data quality in telephone and face to face surveys: A comparative meta-analysis. In R. Groves, P. Biemer, L. Lyberg, J. Massey, W. Nicholls, and J. Waksberg (eds). Telephone Survey Methodology (pp 283-299). New York: Wiley. Ferrar, R. (2011). World Count of Gaming Machines 2010. January 2011. http://www.gamingta.com/pdf/World_Count_2010.pdf Ferris, J. & Wynne, H. (2001). The Canadian Problem Gambling Index: Final Report. Submitted to the Canadian Centre on Substance Abuse. February 19, 2001. Fisher, S. (1992). Measuring pathological gambling in children: the case of fruit machines in the U.K. Journal of Gambling Studies, 8, 263-285. Fisher, S.E. (2000). Measuring the prevalence of sector-specific problem gambling: A study of casino patrons. Journal of Gambling Studies 16(1), 25-51.

58
Gerstein, D., Volberg, R., Toce, M., Harwood, H., Johnson, R., Bule, T., et al. (1999). Gambling Impact and Behavior Study: Report to the National Gambling Impact Study Commission. Chicago: National Opinion Research Centre. Göritz, A.S. (2007). Using online panels in psychological research. In A.N. Joinson, K., McKenna, T. Postmes, & U-D. Reips (eds)., The Oxford Handbook of Internet Psychology. Oxford University Press. Göritz, A.S., Reinhold, N. & Batinic, B. (2002). Online panels. In B. Batinic, U.-D. Reips, & M. Bosnjak (Eds.), Online Social Sciences (pp. 27-47). Göttingen: Hogrefe & Huber Publishers. Groves, R.M., Presser, S. & Dipko, S. (2004). The role of topic interest in survey participation decisions. Public Opinion Quarterly, 68 (1), 2-31. Grun, L. & McKeigue, P. (2000). Prevalence of excessive gambling before and after introduction of a national lottery in the United Kingdom: Another example of the single distribution theory. Addiction, 95(6), 959-966. Guttentag, D.A. (2010). Gambling by Ontario Casino Employees: Gambling Behaviours, Problem Gambling, and Impacts of the Employment. Masters thesis in Environmental Studies. University of Waterloo. http://uwspace.uwaterloo.ca/bitstream/10012/5066/1/Thesis%20Document%20FINAL.pdf Hansen, M. & Rossow, I. (2008). Adolescent gambling and problem gambling: Does the total consumption model apply? Journal of Gambling Studies, 24(2), 135-149. Hing, N. & Gainsbury, S. (2011). Risky business: Gambling problems amongst gaming venue employees in Queensland, Australia. Journal of Gambling Issues, 25, 4-23. Holbrook, A.L., Green, M.C. & Krosnick, J.A. (2003). Telephone versus face-to-face interviewing of national probability samples with long questionnaires. Public Opinion Quarterly, 67, 79-125. LaPlante, D.A. & Shaffer, H.J. (2007). Understanding the influence of gambling opportunities: Expanding exposure models to include adaptation. American Journal of Orthopsychiatry, 77(4), 616-623. Lesieur, H.R. & Blume, S.B. (1987). The South Oaks Gambling Screen (SOGS): A new instrument for the identification of pathological gamblers. American Journal of Psychiatry, 144, 1184-1188. Lund, I. (2008). The population mean and the proportion of frequent gamblers: Is the theory of total consumption valid for gambling? Journal of Gambling Studies, 24(2), 247-256. Lund, I. & Nordlund, S. (2003). Pengespill og pengeproblemer i Norge (Rapport nr. 2/2000). Oslo: Statens institutt for rusmiddelforskning.

59
National Research Council (1999). Pathological Gambling: A Critical Review. National Academy Press: Washington, D.C. Neal, P., Delfabbro, P. & O’Neil, M. (2005). Problem Gambling and Harm: Towards a National Definition. Literature Review. Commissioned for the Ministerial Council on Gambling. Prepared by the SA Centre for Economic Studies with the Department of Psychology, University of Adelaide. November 2005. Orford, J. (2005a). Complicity on the river bank: The search for truth about problem gambling: Reply to the commentaries. Addiction, 100, 1235-1239. Orford, J. (2005b). Disabling the public interest: Gambling strategies and policies for Britain. Addiction, 100, 1219-1239. Pearce, J., Mason, K., Hiscock, R. & Day, P. (2008). A national study of neighborhood access to gambling opportunities and individual gambling behaviour. Journal of Epidemiology and Community Health, 62, 862-868. Productivity Commission. (1999). Australia's Gambling Industries. Canberra: AusInfo. Ritter, P., Lorig, K., Laurent, D. & Matthews, K. (2004). Internet Versus Mailed Questionnaires: A randomized Comparison. J Med Internet Res 2004, 6(3), e29. Robins, L.N., Helzer, J.E., Croughan, J. & Ratcliff, K.S. (1981). National Institute of Mental Health Diagnostic Interview Schedule. Its history, characteristics, and validity. Archives of General Psychiatry, 38 (4), 381-9. Rönnberg, S., Volberg, R.A., Abbott, M.W., Moore, W.L., Andren, A., Munck, l.M., Jonsson, J. & Svensson, O. (1999). Gambling and Problem Gambling in Sweden. Report No. 2 of the National Institute of Public Health Series on Gambling. Stockholm: National Institute of Public Health. Rose, G. (1985). Sick individuals and sick populations. International Journal of Epidemiology, 14(1), 32-38. Rose, G. & Day, S. (1990). The population mean predicts the number of deviant individuals. British Medical Journal, 301, 1031-1034. Sévigny, S., Ladouceur, R., Jacques, C. & Cantinotti, M. (2008). Links between casino proximity and gambling participation, expenditure and pathology. Psychology of Addictive Behaviors, 22(2), 295-301. Shaffer, H.J. (2005). From disabling to enabling the public interest: Natural transitions from gambling exposure to adaptation and self-regulation. Addiction, 100, 1227-1229.
60
Shaffer, H.J. & Hall, M.N. (2001). Updating and refining meta-analytic prevalence estimates of disordered gambling behavior in the United States and Canada. Canadian Journal of Public Health, 92 (3), 168-172. Shaffer, H.J., LaBrie, R.A. & LaPlante, D. (2004). Laying the foundation for quantifying regional exposure to social phenomena: Considering the case of legalized gambling as a public health toxin. Psychology of Addictive Behaviors, 18(1), 40-48. Shaffer, H.J., Vander Bilt, J. & Hall, M.N. (1999). Gambling, drinking, smoking and other health risk activities among casino employees. American Journal of Industrial Medicine, 36(3), 365-378. Slutske, W.S., Jackson, K.M. & Sher, K. (2003). The natural history of problem gambling from age 18 to 29. Journal of Abnormal Psychology, 112 (2), 263-274. Sparrow, N. (2006). Developing reliable online polls. International Journal of Market Research, 48(6), 659-80. Statistics Canada (2006). A sure bet industry. Perspectives on Labour and Income, 7 (12). Statistics Canada (2010). Gambling, 2010. Perspectives on Labour and Income, 11 (8). http://www.statcan.gc.ca/pub/75-001-x/2010108/pdf/11297-eng.pdf Statistics Canada (2011). 2010 Canadian Internet Use Survey. http://www.statcan.gc.ca/daily-quotidien/110525/dq110525b-eng.htm Storer, J., Abbott, M. & Stubbs, J. (2009). Access or adaptation? A meta-analysis of surveys of problem gambling prevalence in Australia and New Zealand with respect to concentration of electronic gaming machines. International Gambling Studies, 9(3), 225-244. Toepoel, V., Das, M. & Van Soest, A. (2008). Effects of design in web surveys: Comparing trained and fresh respondents. Public Opinion Quarterly, 72(5), 985-1007. Tourangeau, R. & Smith, T.W. (1996). Asking sensitive questions: The impact of data collection mode, question format, and question context. Public Opinion Quarterly, 60, 275-304. Tourangeau, R. & Yan, T. (2007). Sensitive questions in surveys. Psychological Bulletin, 133 (5), 859-883. van der Heijden, P.G.M., Van Gils, G., Bouts, J. & Hox, J.J. (2000). A comparison of randomized response, computer assisted interview, and face-to-face direct questioning: Eliciting sensitive information in the context of welfare and unemployment benefit. Sociological Methods and Research, 28, 505-537. Volberg, R.A. (2002a). Gambling and Problem Gambling among Adolescents in Nevada. Carson City, NV: Department of Human Resources.

61
Volberg, R.A. (2002b). Gambling and Problem Gambling in Nevada. Carson City, NV: Department of Human Resources. Volberg, R.A. (2007). Population surveys. In G. Smith, D.C. Hodgins, & R.J. Williams (Eds.), Research and Measurement Issues in Gambling Studies (pp. 33-51). San Diego: Elsevier. Welte, J.W., Barnes, G.M., Wieczorek, W.F., Tidwell, M.-C.O. & Hoffman, J.H. (2007). Type of gambling and availability as risk factors for problem gambling: A Tobit regression analysis by age and gender. International Gambling Studies 7(2), 183-198. Welte, J.W., Wieczorek, W.F., Barnes, G.M., Tidwell, M.-C., & Hoffman, J.H. (2004). The relationship of ecological and geographic factors to gambling behavior and pathology. Journal of Gambling Studies, 20(4), 405-423. Wenzel, M., McMillen, J., Marshall, D. & Ahmed, E. (2004). Validation of the Victorian Gambling Screen. Melbourne, Victoria, Australia: Gambling Research Panel. Williams, R.J., Belanger, Y.D. & Arthur, J.N. (2011). Gambling in Alberta: History, Current Status, and Socioeconomic Impacts. Final Report to the Alberta Gaming Research Institute. Edmonton, Alberta. April 2, 2011. http://hdl.handle.net/1880/48495. Williams, R.J., Lee, C-K. & Back, K-J. (submitted for publication). Prevalence of Gambling and Problem Gambling in South Korea in 2011. Williams, R.J. & Volberg, R.A. (2009). Impact of survey description, Administration Method, and exclusionary criteria on population prevalence rates of problem gambling. International Gambling Studies, 9 (2), 101-117. Williams, R.J. & Volberg, R.A. (2010). Best Practices in the Population Assessment of Problem Gambling. Report submitted to the Ontario Problem Gambling Research Centre. Guelph, Ontario. March 31, 2010. http://hdl.handle.net/10133/1259. Williams, R.J. & Volberg, R.A. (2012). Population Assessment of Problem Gambling: Utility and Best Practices. Report submitted to the Ontario Problem Gambling Research Centre and the Ontario Ministry of Health and Long Term Care. Guelph, Ontario. April 30, 2012. Williams, R.J. & Volberg, R.A. (in preparation). Prevalence of Gambling and Problem Gambling in Ontario in 2011. Report prepared for the Problem Gambling Research Centre, Guelph, Ontario. Williams, R. J., West, B. L., & Simpson, R. I. (in press). Prevention of Problem Gambling: A Comprehensive Review of the Evidence, and Identified Best Practices. Report prepared for the Ontario Problem Gambling Research Centre. Guelph, Ontario, Canada.

62
Winters, K.C., Specker, S. & Stinchfield, R. (1997). Brief Manual for Use of the Diagnostic Interview for Gambling Severity. Minneapolis, MN: University of Minnesota Medical School. Wood, R.T. & Williams, R.J. (2009). Internet Gambling: Prevalence, Patterns, Problems, and Policy Options. Final Report prepared for the Ontario Problem Gambling Research Centre, Guelph, Ontario. January 5, 2009. http://hdl.handle.net/10133/693 Wood, R.T. & Williams, R.J. (2012). The Casino City study: A large scale international study of online gamblers. In Routledge International Handbook of Internet Gambling by Williams, R.J., Wood, R.T., & Parke, J (eds). Routledge: London. Wu, A.M.S. & Wong, E.M.W. (2008). Disordered gambling among Chinese casino employees. Journal of Gambling Studies, 24(2), 207-217.

63
Appendix A: National Adult Prevalence Studies of Problem Gambling
1 Location AUSTRALIA
Year Study Conducted 1999
Age 18+
Sources Productivity Commission. (1999). Australia’s Gambling Industries. Report No. 10. Chapter 6. What is Problem Gambling? & Appendix F. National Gambling Survey. Canberra: AusInfo.
Sample Size 3,498 full interviews from initial sample of 10,525
Sampling Strategy modified random digit dialing; random selection within household; stratified by region, age, gender; all regular gamblers sampled, but only 1/4 nonregular gamblers and 1/2 nongamblers
Survey Description ‘attitudes toward gambling’
Administration Method telephone interview
Response Rate 47%
Weighting region, age, gender, household size; adjustment made for the random selection of 1/4 nonregular gamblers and 1/2 nongamblers
Threshold for PG Questions participated in a form of gambling (other than lottery games and Instant win tickets) 1/week or more
Assessment Instrument SOGS-PY
Gambling Availability
105 People per EGM in 1999. 71 people per EGM in NSW/ACT; 158 people per EGM in Victoria; 116 people per EGM in Queensland; 117 people per EGM in South Australia; 1576 people per EGM in Western Australia; 198 people per EGM in Tasmania; 158 people per EGM in Northern Territory.
Past Year Gambling Prevalence 82% (excluding raffles); 80% NSW; 81% Victoria; 86% Queensland; 77% South Australia; 84% Western Australia; 77% Tasmania; 80% ACT; 80% Northern Territory.
Problem Gambling Prevalence
2.8% (3-4); 2.1% (5+); 4.9% combined (SOGS 5+ for individual states/territories: 2.55% New South Wales, 2.45% South Australia, 2.14% Victoria, 2.06% Australian Capital Territory, 1.89% Northern Territory, 1.88% Queensland, 0.70% Western Australia, 0.44% Tasmania)
Standardized Problem Gambling Prevalence
Australia: 4.9 * .72 * 1.44 * .76 = 3.9% (4.16% New South Wales, 4.00% South Australia, 3.49% Victoria, 3.36% Australian Capital Territory, 3.08% Northern Territory, 3.07% Queensland, 1.14% Western Australia, 0.72% Tasmania)
Demographic Correlates of PG age 18-25; males; separated/divorced; unemployed; slightly lower income; less education; non-English spoken at home; student
Game Correlates of PG EGMs, race betting, casino table games
Comments

64
2 Location BELGIUM
Year Study Conducted 2006?
Age 16-99
Sources
Druine, C., Delmarcelle, C., Dubois, M., Joris, L., & Somers, W. (2006). Etude quantitative des habitudes de Jeux de hasard pour l'offre classique et un ligne en Belgique [Quantitative study on online and offline gambling behaviour in Belgium]. Bruxelles: Foundation Rodin. Druine (2009). Belgium. In G. Meyer, T. Hayer, & M. Griffiths (Eds.), Problem Gambling in Europe: Challenges, Prevention, and Interventions. New York: Springer. doi: 10.1007/978-0-387-09486-1 (citing Druine et al., 2006).
Sample Size 3,002
Sampling Strategy
Survey Description
Administration Method telephone interview
Response Rate
Weighting
Threshold for PG Questions
Assessment Instrument DSM-IV-PY (DSM-IV-MR)
Gambling Availability 384 people per EGM in 2006
Past Year Gambling Prevalence 59.7%
Problem Gambling Prevalence 1.6% (3-4); 0.4% (5+); 2.0% combined
Standardized Problem Gambling Prevalence
2.0 * 1.19 * 1.59 * .74 = 2.8%
Demographic Correlates of PG male; age 16-24; single; lower socioeconomic
Game Correlates of PG EGMs; casino; horse race betting; sports betting; Internet; telephone phone-in quizzes
Comments

65
3 Location BRAZIL
Year Study Conducted 2005-2006
Age 14+
Source(s)
Tavares, H., Carneiro, E., Sanches, M., Pinsky, I., Caetano, R., Zaleski, M., & Laranjeira, R. (2010). Gambling in Brazil: Lifetime prevalences and socio-demographic correlates. Psychiatry Research, 180(1), 35-41. doi:10.1016/j.psychres.2010.04.014
Sample Size 3,007 (2346 of which were 18+)
Sampling Strategy Stratified sampling of gender and geographic region; household member with most recent birthday selected; 3 attempts for each household.
Survey Description
Administration Method face-to-face residential interview
Response Rate 66.4%
Weighting household size, gender, education, age, and geographic region
Threshold for PG Questions
Everyone administered the two question Lie/Bet Questionnaire (LBQ). Individuals scoring as probable problem gambler on the LBQ (i.e., answering at least one of the two questions affirmatively) were administered the NODS-L (18+) or DSM-IV-Juvenile-PY if they were aged 14 – 17.
Assessment Instrument DSM-IV-L (NODS-L & DSM-IV-Juvenile; Fisher, 1992)
Gambling Availability No EGMs in 2006
Past Year Gambling Prevalence (12% engage in monthly gambling)
Problem Gambling Prevalence 1.3% (1-4); 1.0% (5+); 2.3% combined
Standardized Problem Gambling Prevalence
(2.3 * 1.19 * .44 * .76 = 0.9%)
Demographic Correlates of PG young, male, unemployed, nonstudent
Game Correlates of PG
Comments
First study to investigate the prevalence of gambling and problem gambling in a national Latin–American sample. The standardized rate must be seen as very tentative because of the overly stringent criteria used before administering the problem gambling assessment instrument. Another problem is that the DSM-IV-Juvenile questions use a mixture of current and past year time frames, whereas the NODS-L has a lifetime time frame. This study is not included in the tables or the analyses.

66
4 Location CANADA
Year Study Conducted 2000
Age 18+
Sources
Ferris, J., & Wynne, H. (2001). The Canadian Problem Gambling Index: Final Report. Submitted to the Canadian Centre on Substance Abuse.
Ferris, J., & Wynne, H. (2001). The Canadian Problem Gambling Index: User Manual. January 28, 2001. Submitted to the Canadian Centre on Substance Abuse.
Sample Size 3,120
Sampling Strategy Random digit dialing stratified by region (Atlantic, Quebec, Ontario, Manitoba/Saskatchewan, Alberta/BC. Household member with most recent birthday selected.
Survey Description ‘gambling survey’
Administration Method telephone interview
Response Rate
Weighting No
Threshold for PG Questions gambled in past 12 months
Assessment Instrument CPGI, SOGS-PY, DSM-IV-PY
Gambling Availability 53,877 EGMs in 1999. Estimated population in 1999 is 30,750,000. Approximately 570 people per EGM in 1999.
Past Year Gambling Prevalence
Problem Gambling Prevalence CPGI: 2.4% (3-7); 0.9% (8+); 3.4% combined SOGS-PY: 1.3% (3-4); 1.3% (5+); 2.6% combined DSM-IV-PY: 0.7% (5+)
Standardized Problem Gambling Prevalence
CPGI: 3.4 *.58 * 1.59 * .74 = 2.3% SOGS-PY: 2.6 * .72 * 1.59 * .74 = 2.2% DSM-IV-PY: 0.7 * 2.60 * 1.59 * .74 = 2.1% Average = 2.2%
Demographic Correlates of PG males; 18-24 age group; 25-34 age group; under $20,0000 annual income
Game Correlates of PG
Comments

67
5 Location CANADA
Year Study Conducted 2002
Age 15+
Sources Marshall, K., & Wynne, H. (2003). Fighting the odds. Perspectives on Labour and Income, 4(12), 5-13.
Sample Size 24,997
Sampling Strategy
Gambling module included in Cycle 1.2 of the Canadian Community Health Survey-Mental Health and Well-being (CCHS 1.2). Target population excludes those living in the 3 territories, individuals living on reserves or crown land, residents of institutions, full-time members of the Armed Forces, and residents of some remote regions.
Survey Description ‘well-being and health practices’ (gambling a component of a larger general survey on health)
Administration Method face-to-face residential interview (86%)
Response Rate 77%
Weighting
Threshold for PG Questions Gambling more than 5 times on some form of gambling in past year. People excluded, however, is they said ‘they were not a gambler’ regardless of their frequency of gambling.
Gambling Availability
436 people per EGM in 2002. 1246 people per EGM in BC; 282 people per EGM in AB; 177 people per EGM in SK; 165 people per EGM in MB; 611 people per EGM in ONT; 372 people per EGM in QU; 293 people per EGM in NB; 216 people per EGM in NS; 337 people per EGM in PEI; 200 people per EGM in NL.
Past Year Gambling Prevalence 76% (75% BC; 72% AB; 76% SK; 74% MB; 75% ON; 79% QU; 76% NB; 78% NS; 75% PEI; 75% NL).
Assessment Instrument CPGI
Problem Gambling Prevalence
1.5% (3-7); 0.5% (8+); 2.0% combined (CPGI 3+ for individual provinces: 3.1% Manitoba, 3.0% Saskatchewan, 2.1% Alberta, 2.0% Ontario, 1.9% British Columbia, Nova Scotia, 1.6% Quebec; sample sizes too small for other provinces)
Standardized Problem Gambling Prevalence
Canada: 2.0 * 0.58 = 1.2% (1.80% Manitoba, 1.74% Saskatchewan, 1.22% Alberta, 1.16% Ontario, 1.10% British Columbia, 1.10% Nova Scotia, .93% Quebec)
Demographic Correlates of PG male; younger age; less education; Aboriginal; province; alcohol dependence; stress
Game Correlates of PG VLTs; casinos; sports lotteries; horse racing (using CPGI 5+ threshold)
Comments
Unlike most surveys that collect sensitive demographic information at the very end, much of this is collected at the very outset of the CCHS. In addition the person is asked to provide his/her name, the names of all the other people living in the residence, and his/her date of birth.

68
6 Location CANADA
Year Study Conducted 2006-2007
Age 18+
Sources
Williams, R.J. & Wood, R.J. (2008). Prevalence of Gambling and Problem Gambling in Canada 2006/2007. Unpublished analysis of prevalence data collected by the authors in 2006/2007. Some details of this study are reported in Wood, R.T. & Williams, R.J. (2009). Internet Gambling: Prevalence, Patterns, Problems, and Policy Options. Final Report prepared for the Ontario Problem Gambling Research Centre, Guelph, Ontario. January 5, 2009
Sample Size 8,496
Sampling Strategy random digit dialing
Survey Description ‘gambling survey’
Administration Method telephone interview
Response Rate 45.6%
Weighting age, gender, household size
Threshold for PG Questions any past year gambling
Gambling Availability
377 people per EGM in 2006. In 2007 482 people per EGM in British Columbia; 197 Alberta; 151 Saskatchewan; 141 Manitoba; 556 Ontario; 417 Quebec; 289 New Brunswick; 285 Nova Scotia; 260 Prince Edward Island; 223 Newfoundland.
Past Year Gambling Prevalence
70.7% (includes risky stock market but excludes raffles). 75.4% Newfoundland; 72.2% PEI; 72.8% Nova Scotia; 68.9% New Brunswick; 71.7% Quebec; 70.4% Ontario; 71.0% Manitoba; 68.1% Saskatchewan; 70.3% Alberta; 69.7% British Columbia.
Assessment Instrument CPGI (entire sample); random 25% of sample also administered SOGS-PY, DSM-IV-PY (NODS-PY), and PPGM.
Problem Gambling Prevalence
CPGI: 2.4% (3-7); 0.8% (8+); 3.2% combined SOGS-PY: 1.4% (3-4); 1.0% (5+); 2.4% combined DSM-IV-PY: 1.1% (3-4); 0.9% (5+); 2.0% combined PPGM: 1.8% (CPGI 3+ for individual provinces: 4.4% BC, 3.6% AB, 3.5% ONT, 1.7% QU other provinces not reported due to small sample size)
Standardized Problem Gambling Prevalence
CPGI: 3.2 * .58 * 1.44 * .76 = 2.0% SOGS-PY: 2.4 * .72 * 1.44 * .76 = 1.9% DSM-IV-PY: 2.0 * 1.19 * 1.44 * .76 = 2.6% PPGM: 1.8 * 1.44 * .76 = 2.0% (CPGI: 2.79% British Columbia, 2.29% Alberta, 2.22% Ontario, 1.08% Quebec)
Demographic Correlates of PG male; age 18 – 29; mental health problems; illicit drug use; tobacco use; Aboriginal, Asian, or ‘Other’ ethnicity; lower income; less education
Game Correlates of PG casino table games; horse race betting; Internet gambling; sports betting
Comments

69
7 Location DENMARK
Year Study Conducted 2005
Age 18-74
Sources Bonke, J., & Borregaard, K. (2006). The Prevalence and Heterogeneity of At-Risk and Pathological Gamblers - The Danish Case [Working Paper 15: 2006]. Danish National Institute of Social Research.
Sample Size 8,153
Sampling Strategy Random sample of Danish civil registry. Letter sent in advance to notify participants of the study.
Survey Description
Administration Method Telephone interview. Face-to-face residential interview for people who could not be contacted by phone.
Response Rate 70.0%
Weighting gender, age, region, marital status
Threshold for PG Questions losing more than 35 Danish kroner (~$7 U.S.) in a single day of gambling
Gambling Availability 286 People per EGM in 2006
Past Year Gambling Prevalence 77%
Assessment Instrument DSM-IV-PY & DSM-IV-L (NODS; entire sample) & SOGS-PY & SOGS-L (pre-test sample)
Problem Gambling Prevalence
DSM-IV-PY: 0.3% (3-4); 0.1% (5+); 0.4% combined DSM-IV-L: 0.4% (3-4); 0.3% (5+); 0.7% combined SOGS-PY: 0.8% (3-4); 0.2% (5+); 1.0% combined SOGS-L: 1.2% (3-4); 0.5% (5+); 1.7% combined
Standardized Problem Gambling Prevalence
DSM-IV-PY: 0.4 * 1.19 * 1.44 * .76 = 0.5%
Demographic Correlates of PG males; no children living at home; lower socioeconomic status; 18-44
Game Correlates of PG slots; poker and dice games; sports betting
Comments

70
8 Location ESTONIA
Year Study Conducted 2004
Age 15-74
Sources
Faktum Uuringukeskus. (2004). Elanike kokkupuuted hasart- ja õnnemängudega (Gambling prevalence in Estonia). Tallinn: Faktum. Laansoo, S. (2005). Patoloogiline hasartmängimine: ulatus Eestis ning seosed käitumuslike ja isiksuslike riskifaktoritega (Pathological gambling in Estonia and the relationships with behavioural and personal risk factors). Unpublished master’s thesis, University of Tallinn, Estonia. Laansoo & Niit (2009). Estonia. In G. Meyer, T. Hayer, & M. Griffiths (Eds.), Problem Gambling in Europe: Challenges, Prevention, and Interventions. New York: Springer. doi: 10.1007/978-0-387-09486-1 (citing Faktum Uuringukeskus, 2004).
Sample Size 986
Sampling Strategy
Survey Description “Omnibus survey” (i.e., presumably many topics other than gambling)
Administration Method
Response Rate
Weighting
Threshold for PG Questions
Gambling Availability 990 People per EGM in 2004
Past Year Gambling Prevalence 61% (“have played games of chance”)
Assessment Instrument SOGS-L (Estonian version)
Problem Gambling Prevalence 2.6% (3-4); 2.4% (5+); 5.0% combined lifetime
Standardized Problem Gambling Prevalence
5.0 * .72 * .44 = 1.6%
Demographic Correlates of PG males; 15-29; lower education
Game Correlates of PG casino games; slot machines
Comments
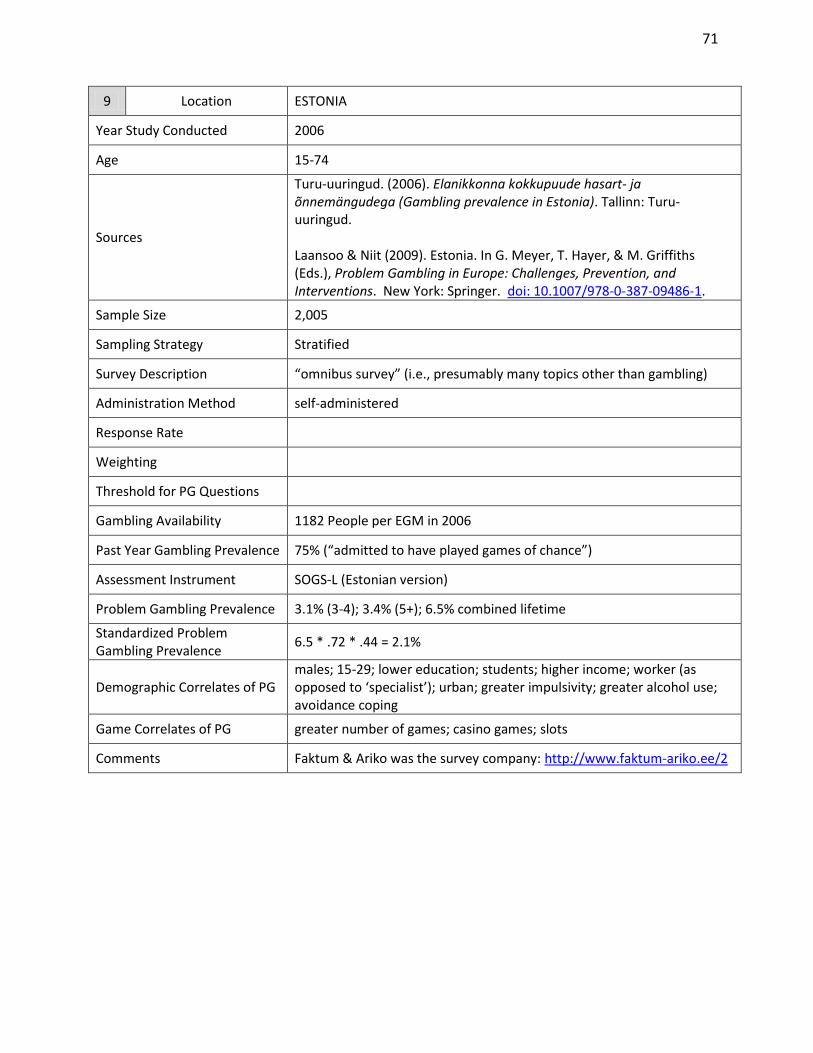
71
9 Location ESTONIA
Year Study Conducted 2006
Age 15-74
Sources
Turu-uuringud. (2006). Elanikkonna kokkupuude hasart- ja õnnemängudega (Gambling prevalence in Estonia). Tallinn: Turu-uuringud. Laansoo & Niit (2009). Estonia. In G. Meyer, T. Hayer, & M. Griffiths (Eds.), Problem Gambling in Europe: Challenges, Prevention, and Interventions. New York: Springer. doi: 10.1007/978-0-387-09486-1.
Sample Size 2,005
Sampling Strategy Stratified
Survey Description “omnibus survey” (i.e., presumably many topics other than gambling)
Administration Method self-administered
Response Rate
Weighting
Threshold for PG Questions
Gambling Availability 1182 People per EGM in 2006
Past Year Gambling Prevalence 75% (“admitted to have played games of chance”)
Assessment Instrument SOGS-L (Estonian version)
Problem Gambling Prevalence 3.1% (3-4); 3.4% (5+); 6.5% combined lifetime
Standardized Problem Gambling Prevalence
6.5 * .72 * .44 = 2.1%
Demographic Correlates of PG males; 15-29; lower education; students; higher income; worker (as opposed to ‘specialist’); urban; greater impulsivity; greater alcohol use; avoidance coping
Game Correlates of PG greater number of games; casino games; slots
Comments Faktum & Ariko was the survey company: http://www.faktum-ariko.ee/2

72
10 Location FINLAND
Year Study Conducted 2003
Age 15-74
Sources
Ilkas, H., & Turja, T. (2003). Penningsspelsundersökning. Helsinki: Ministry of Social Affairs and Health.
Jonsson, J. (2006). An overview of prevalence surveys of problem and pathological gambling in the Nordic countries. Journal of Gambling Issues, 18.
Jaakkola (2009). In G. Meyer, T. Hayer, & M. Griffiths (Eds.), Problem Gambling in Europe: Challenges, Prevention, and Interventions. New York: Springer. doi: 10.1007/978-0-387-09486-1 Finland. (citing Ilkas & Turja, 2003).
Sample Size 5,013
Sampling Strategy Sampling from telephone registers stratified by age, gender and geographic residence.
Survey Description
Administration Method telephone interview
Response Rate
Weighting
Threshold for PG Questions gambling twice a month in past year
Gambling Availability 338 People per EGM in 2002
Past Year Gambling Prevalence 74%
Assessment Instrument SOGS-L
Problem Gambling Prevalence 4.0% (3-4); 1.5% (5+); 5.5% combined
Standardized Problem Gambling Prevalence
5.5 * .72 * .44 * 1.59 * .74 = 2.1%
Demographic Correlates of PG 15-24; low income
Game Correlates of PG higher number of games; slots; sports betting
Comments

73
11 Location FINLAND
Year Study Conducted 2007
Age 15+
Sources Aho, P., & Turja, T. (2007). Gambling in Finland 2007. Helsinki: Ministry of Social Affairs and Health.
Sample Size 5,008
Sampling Strategy random sample from Finnish Population Information System
Survey Description
Administration Method telephone interview
Response Rate 48%
Weighting age, gender, location
Threshold for PG Questions
Gambling Availability 277 People per EGM in 2006
Past Year Gambling Prevalence 73% (87% Lifetime)
Assessment Instrument SOGS-PY & SOGS-L
Problem Gambling Prevalence SOGS-PY: 2.1% (3-4); 1.0% (5+); 3.1% combined SOGS-L: 3.6% (3-4); 1.6% (5+); 5.2% combined
Standardized Problem Gambling Prevalence
3.1 * .72 * 1.44 * .76 = 2.4%
Demographic Correlates of PG males; age 18-24
Game Correlates of PG slot machines
Comments

74
12 Location FINLAND
Year Study Conducted 2011 (Oct 3, 2011 – Jan 14, 2012)
Age 15 – 74
Sources Turja, T., Halme, J., Mervola, M., Järvinen-Tassopoulos, J., Ronkainen, J-E. (2012). Suomalaisten Rahapelaaminen 2011 [Finnish Gambling 2011]. Helsinki: National Institute for Health and Welfare.
Sample Size 4,484
Sampling Strategy
Random sample from Finnish Population Register. 16,000 people were sent a letter describing the study. The 4,871 people without a registered phone number were asked to provide a phone number if they wished to participate.
Survey Description “research on Finnish gambling”
Administration Method telephone interview
Response Rate 39.9%
Weighting Yes
Threshold for PG Questions Gambling in past 12 months.
Gambling Availability 19,745 EGMs in 2010, with population of 5,351,427, this equates to 271 people per EGM in 2010. Note: the number reported in the World Count of Gaming Machines (9,431) is not accurate.
Past Year Gambling Prevalence 78%
Assessment Instrument SOGS-PY
Problem Gambling Prevalence SOGS-PY: 1.7% (3-4); 1.0% (5+); 2.7% combined
Standardized Problem Gambling Prevalence
2.7 * 0.72 * 1.44 * .53 = 1.5%
Demographic Correlates of PG males; age 15-34
Game Correlates of PG Internet gambling; casino gambling; private betting, horse race betting
Comments
The survey description correction weight is 0.53 in the present study because of a response rate <45% (i.e., 39.9%), whereas this weight was 0.76 in the 2007 and 2003 Finnish studies because of response rates >45% (i.e., 48% in 2007). If a 0.76 weighting was applied in the present study the standardized rate would be 2.1% rather than 1.5%.

75
13 Location FRANCE
Year Study Conducted October 2009 – July 2010
Age 18 - 75
Sources
Costes, J-M., Pousett, M., Eroukmanoff, V., le Nezet, O., Richard, J-B., Guignard, R., Beck, F., & Arwidson, P. (2011). Les Niveaux et Pratiques des Jeux de Hasard et D'argent en 2010. French Monitoring Centre for Drugs and Drug Addiction and the National Institute for Prevention and Health Education. September 2011.
Sample Size 25,034, but only 2,762 were administered problem gambling questions
Sampling Strategy 23,605 contacted via random digit dialing with random selection within household; this was supplemented by interviewing 2,944 individuals who only had cellphones.
Survey Description Included in a larger survey of health behaviors (Health Barometer 2010)
Administration Method telephone interview
Response Rate 60%
Weighting Household size, number of landlines, and ‘national reference data’
Threshold for PG Questions played at least 52 times and / or has wagered at least 500 euros over the last 12 months
Gambling Availability 3,657 people per EGM in 2010
Past Year Gambling Prevalence 47.8%
Assessment Instrument CPGI
Problem Gambling Prevalence 0.9% (3-7); 0.4% (8+); 1.3% combined
Standardized Problem Gambling Prevalence
1.3 * .58 * 1.44 = 1.09%
Demographic Correlates of PG Male (75.5%); younger age (average age of 41); lower education; lower income; substance abuse (alcohol, tobacco, in particular)
Game Correlates of PG Larger number of gambling formats; Rapido (lottery with draws every 5 minutes); Internet gambling (horse racing, sports betting, poker).
Comments The threshold to administer problem gambling questions is overly stringent, thus true rates of problem gambling are likely slightly higher.

76
14 Location GERMANY
Year Study Conducted 2006
Age 18-65
Sources
Buth, S. & Stöver, H. (2008). Glücksspielteilnahme und Glücksspielprobleme in Deutschland: Ergebnisse einer bundesweiten Repräsentativbefragung [Gambling and gambling problems in Germany: Results of a national survey]. Suchttherapie, 9, 3-11. Meyer & Hayer (2009). Germany. In G. Meyer, T. Hayer, & M. Griffiths (Eds.), Problem Gambling in Europe: Challenges, Prevention, and Interventions. New York: Springer. doi: 10.1007/978-0-387-09486-1 (citing Buth & Stover, 2008)
Sample Size 7,980
Sampling Strategy Random sampling
Survey Description leisure habits, interview starts with questions concerning general leisure activities
Administration Method 50% telephone; 50% self-administered online (this may be an Online Panel survey)
Response Rate 55.8% phone; 68% online
Weighting age, gender, education, region, and nationality
Threshold for PG Questions gambled at least 1/week or €50/month on some form
Gambling Availability 407 People per EGM in 2006
Past Year Gambling Prevalence 39.2%
Assessment Instrument DSM-IV-PY (DIGS-PY)
Problem Gambling Prevalence 0.64% (3-4); 0.56% (5+); 1.2% combined
Standardized Problem Gambling Prevalence
(1.2 * 1.19 = 1.4%)
Demographic Correlates of PG male; age 18-29; relative with gambling problems
Game Correlates of PG greater number of games; EGMs, horse racing, casinos; sports betting
Comments
BISDRO 2007. Funded by the Verband der Lottovermittler (association of independent Lotto-providers). This study not included in the tables or analyses (as 50% of the sample may have been from an Online Panel).

77
15 Location GERMANY
Year Study Conducted 2006
Age 18-64
Sources
Bühringer, G., Kraus, L., Sonntag, D., Pfeiffer-Gerschel, T. & Steiner, S. (2007). Pathologisches Glücksspiel in Deutschland: Spiel- und Bevölkerungsrisiken [Pathological gambling in Germany: Gambling and population based risks]. Sucht, 53(5), 296-308.
Kraus, L., & Baumeister, S. (2008). Studien design und Methodik des Epidemiologischen Sucht surveys 2006 [Study design and methodology of the 2006 Epidemiological Survey of Substance Abuse]. Sucht, 54, S6–S15. http://www.ift.de/literaturverzeichnis/Kraus_Baumeister_2008_Sucht_54_S6-S15.pdf
Sample Size 7,912
Sampling Strategy Two step selection. Geographically representative sampling and then random sample from the population registers for that community. Oversampling of younger age groups.
Survey Description Part of a general survey on substance use and abuse.
Administration Method Self-administered mail-in survey (n = 6,598). Supplemented with telephone interviews for those who did not respond after 3 reminders (n = 1,314).
Response Rate 48%
Weighting age, gender, geography
Threshold for PG Questions Spent at least €50/month on some form of gambling in past year
Gambling Availability 407 People per EGM in 2006
Past Year Gambling Prevalence 49.4% (Lifetime =71.5%)
Assessment Instrument DSM-IV-PY (DIGS-PY)
Problem Gambling Prevalence 0.20% (3-4); 0.29% (5+); 0.49% combined
Standardized Problem Gambling Prevalence
0.49 * 1.19 = 0.6%
Demographic Correlates of PG
Game Correlates of PG card games on Internet; EGMs
Comments ESA 2006. Funded by Ministry of Health.

78
16 Location GERMANY
Year Study Conducted 2007
Age 16-65
Sources
Bundeszentrale für gesundheitliche Aufklärung (BZgA) (2008). Glücksspielverhalten und Problematisches Glücksspielen in Deutschland 2007 [Gambling behaviour and problem gambling in Germany in 2007. Federal Center for Health Education]. Bundeszentrale für gesundheitliche Aufklärung (BZgA) (2012). Glücksspielverhalten und Glücksspielsucht in Deutschland. Ergebnisse aus drei repräsentativen Bevölkerungsbefragungen 2007, 2009 und 2011 [Results from three representative population surveys 2007, 2009 and 2011. Federal Centre for Health Education]. January 2012.
Sample Size 10,001
Sampling Strategy Random digit dialing. Selection within the household of the person with the next birthday.
Survey Description Unspecified, starting with leisure activities
Administration Method telephone interview
Response Rate 63.3%
Weighting # telephones per household, age, sex, education, region
Threshold for PG Questions Gambled on some form of gambling at least once in past 12 months.
Gambling Availability 407 People per EGM in 2006
Past Year Gambling Prevalence 55.0%
Assessment Instrument SOGS-PY
Problem Gambling Prevalence 0.41% (3-4); 0.19% (5+); 0.6% combined
Standardized Problem Gambling Prevalence
0.6 * .72 * 1.44 = 0.62%
Demographic Correlates of PG Male; age 18-25
Game Correlates of PG EGM (Casino and Non Casino), sports betting, Poker.
Comments BZgA 2007. Funded by German Lotto and Toto-Bloc. The rate of problem gambling is probably underestimated because some SOGS-items weren’t answered by the respondents caused by a filter mistake.

79
17 Location GERMANY
Year Study Conducted 2009 (March – May)
Age 16 – 65
Sources
Bundeszentrale für gesundheitliche Aufklärung (BZgA) (2010). Glücksspiel-verhalten in Deutschland 2007 und 2009. [Gambling Behavior in Germany in 2007 and 2009. Federal Centre for Health Education]. January 2010. Bundeszentrale für gesundheitliche Aufklärung (BZgA) (2012). Glücksspielverhalten und Glücksspielsucht in Deutschland. Ergebnisse aus drei repräsentativen Bevölkerungsbefragungen 2007, 2009 und 2011 [Results from three representative population surveys 2007, 2009 and 2011. Federal Centre for Health Education]. January 2012.
Sample Size 10,000
Sampling Strategy Random digit dialing. Random selection of adult within household.
Survey Description leisure habits, interview starts with questions concerning general leisure activities
Administration Method telephone interviews
Response Rate 61.6%
Weighting Number of telephone numbers in the household, age, gender, education, region.
Threshold for PG Questions Gambled on some form of gambling at least once in past 12 months.
Gambling Availability 412 people per EGM in 2008.
Past Year Gambling Prevalence 53.8%
Assessment Instrument SOGS-PY
Problem Gambling Prevalence 0.64% (3-4); 0.45% (5+); 1.09%
Standardized Problem Gambling Prevalence
1.09 * .72 * 1.44 = 1.13%
Demographic Correlates of PG Male; age 16-25; elementary school education; immigrant; unemployed
Game Correlates of PG Greater number of gambling formats; Internet-casino gambling; EGMs, keno, casino table games
Comments BZgA 2010. Funded by German Lotto and Toto-Bloc.

80
18 Location GERMANY
Year Study Conducted 2009 (May – October)
Age 18 - 64
Sources
Kraus, L., Sassen, M., Pabst, A., & Buhringer, G. (2010). Kurzbericht Epidemiologischer Suchtsurvey 2009. Zusatzauswertungen zum Glücksspielverhalten: Prävalenz des (pathologischen) Glücksspiels. November 2010. Kraus, L., & Pabst, A. (2010). Studiendesign und Methodik des Epidemiologischen Suchtsurveys 2009. Sucht, 56, 315-326.
Sample Size 8,030
Sampling Strategy Two step selection. Geographically representative sampling and then random sample from the population registers for that community. Oversampling of younger age groups.
Survey Description Part of a general survey on substance use and abuse.
Administration Method 3,731 self-administered mail-in survey, 927 self-administered online survey, 3,376 telephone interview
Response Rate 50.1%
Weighting Age, gender, citizenship, education.
Threshold for PG Questions Spent at least €50/month on some form of gambling in past year
Gambling Availability 412 people per EGM in 2008.
Past Year Gambling Prevalence 45.2%
Assessment Instrument DSM-IV-PY (DIGS-PY)
Problem Gambling Prevalence .19% (3-4) + .27 (5+); 0.46% combined
Standardized Problem Gambling Prevalence
0.46 * 1.19 = 0.55% Averaged with the 2009 BzGA study = 0.84%
Demographic Correlates of PG Males; age 18 - 29
Game Correlates of PG
Comments ESA 2009. Funded by Ministry of Health.

81
19 Location GERMANY
Year Study Conducted 2010
Age 14 – 64
Sources
Meyer, C., Rumpf, H.-J., Kreuzer, A.-., de Brito, S., Glorius, S., Jeske, C., Kastirke, N., Porz, S., Schön, D., Westram, A., Klinger, D., Goeze, D., Bischof, G. & John, U. (2011). Pathologisches Glücksspielen und Epidemiologie (PAGE): Entstehung, Komorbidität,Remission und Behandlung. Endbericht an das Hessische Ministerium des Innern und für Sport . Universitäten Greifswald und Lübeck.
Sample Size 15,023
Sampling Strategy
Landlines + 1,001 cell phones (1st known prevalence study to use cell phones) with sampling of German communities proportional to size. Additional recruiting of problem gamblers by media campaigns, popular gambling venues (gambling halls, casinos), treatment institutions, prisons, credit counseling centres, and self-help groups. This supplemental sample was not used in the prevalence estimates.
Survey Description
Administration Method telephone interviews
Response Rate 52.4% (landline), 56.6% cell phones
Weighting Number of telephone numbers in the household, age, gender, education, unemployment, immigrant status (separated for landline and cell phones)
Threshold for PG Questions > 10 days gambling in lifetime
Gambling Availability 388 people per EGM in 2010
Past Year Gambling Prevalence 45%
Assessment Instrument DSM-IV-L & DSM-IV-PY
Problem Gambling Prevalence 0.31% (3-4) + 0.35 (5+); 0.67% combined
Standardized Problem Gambling Prevalence
0.67 * 1.19 * 1.44 * .53 = 0.61%
Demographic Correlates of PG male, younger people, lower education, unemployment, immigrant
Game Correlates of PG EGMs, Poker, ‘other sports betting’
Comments PAGE 2010. Funded by the 16 federal states of Germany under the gambling state treaty.

82
20 Location GERMANY
Year Study Conducted 2011 (April – June)
Age 16-65
Sources
Bundeszentrale für gesundheitliche Aufklärung (BZgA) (2012). Glücksspielverhalten und Glücksspielsucht in Deutschland. Ergebnisse aus drei repräsentativen Bevölkerungsbefragungen 2007, 2009 und 2011 Bundeszentrale für gesundheitliche Aufklärung (BZgA) [Results from three representative population surveys 2007, 2009 and 2011. Federal Centre for Health Education]. January 2012.
Sample Size 10,002
Sampling Strategy Random digit dialing of landlines, with oversampling of 16-25 year olds. Random selection of adult within household.
Survey Description leisure habits, interview starts with questions concerning general leisure activities
Administration Method telephone interviews
Response Rate 59.9%
Weighting Number of telephone numbers in the household, age, gender, education, region.
Threshold for PG Questions Gambled on some form of gambling at least once in past 12 months.
Gambling Availability 388 people per EGM in 2010.
Past Year Gambling Prevalence 50.7%
Assessment Instrument SOGS-PY
Problem Gambling Prevalence 0.51% (3-4); 0.49% (5+); 1.00% combined
Standardized Problem Gambling Prevalence
1.0 * .72 * 1.44 = 1.0% Combined with the AWI 2011 study = .88%
Demographic Correlates of PG Males; age 21-25; low level of education; immigrant; unemployment
Game Correlates of PG Sports betting; slot machines; greater number of gambling formats
Comments BZgA 2011. Funded by German Lotto and Toto-Bloc
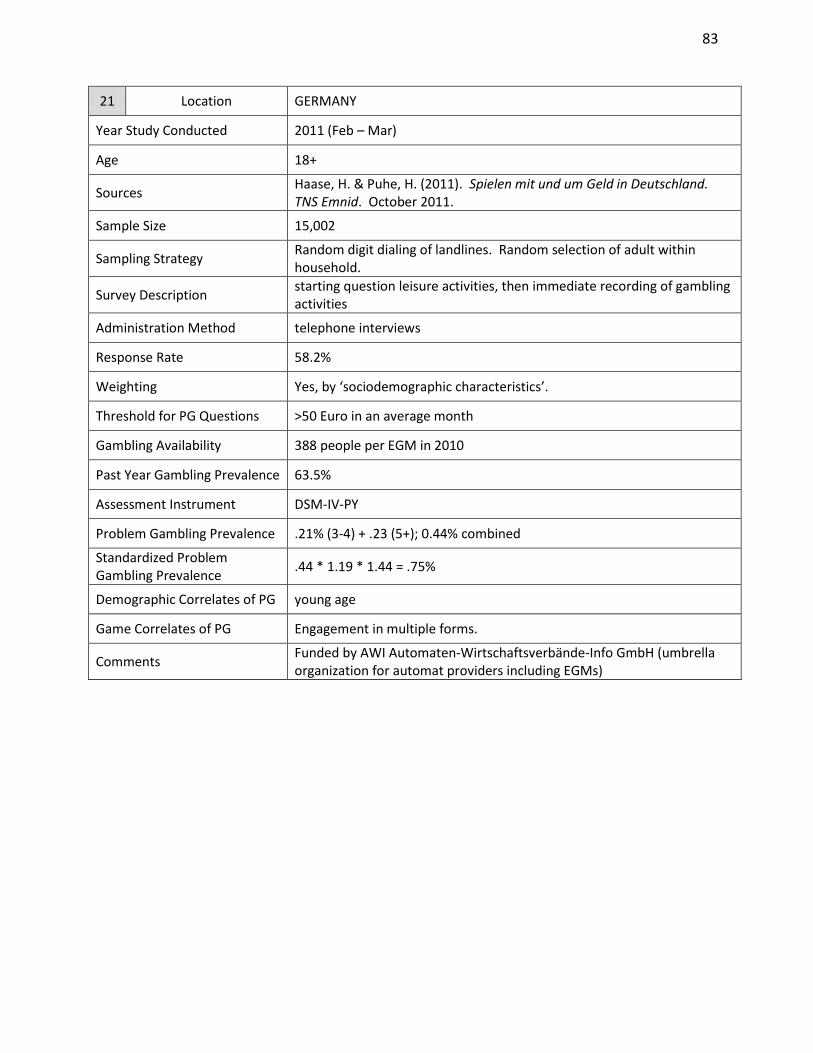
83
21 Location GERMANY
Year Study Conducted 2011 (Feb – Mar)
Age 18+
Sources Haase, H. & Puhe, H. (2011). Spielen mit und um Geld in Deutschland. TNS Emnid. October 2011.
Sample Size 15,002
Sampling Strategy Random digit dialing of landlines. Random selection of adult within household.
Survey Description starting question leisure activities, then immediate recording of gambling activities
Administration Method telephone interviews
Response Rate 58.2%
Weighting Yes, by ‘sociodemographic characteristics’.
Threshold for PG Questions >50 Euro in an average month
Gambling Availability 388 people per EGM in 2010
Past Year Gambling Prevalence 63.5%
Assessment Instrument DSM-IV-PY
Problem Gambling Prevalence .21% (3-4) + .23 (5+); 0.44% combined
Standardized Problem Gambling Prevalence
.44 * 1.19 * 1.44 = .75%
Demographic Correlates of PG young age
Game Correlates of PG Engagement in multiple forms.
Comments Funded by AWI Automaten-Wirtschaftsverbände-Info GmbH (umbrella organization for automat providers including EGMs)

84
22 Location GREAT BRITAIN (England, Wales, Scotland)
Year Study Conducted 1999
Age 16+
Sources Sproston, K., Erens, R., & Orford, J. (2000). British Gambling Prevalence Survey 1999. London: National Centre for Social Research.
Sample Size 7,770
Sampling Strategy
Random sample of 7,000 addresses from publicly available Postcode Address Files. At each address interviewers attempted to obtain face-to-face interview with 1 person. In addition, everyone 16 and older was asked to fill in self-completion questionnaire and return it in the mail.
Survey Description ‘gambling behavior’
Administration Method Face to face residential interview + self-administered mail in
Response Rate 65%
Weighting age, sex
Threshold for PG Questions gambling in past year
Gambling Availability 250,000 EGMs in 1999. United Kingdom population in 1999 was 59,113,439. 236 people per EGM.
Past Year Gambling Prevalence 72%
Assessment Instrument SOGS ‘current’ & DSM-IV ‘current’
Problem Gambling Prevalence SOGS-PY: 1.3% (3-4); 0.8% (5+); 2.1% combined DSM-IV-PY: 0.4% (3-4); 0.2% (5+); 0.6% combined
Standardized Problem Gambling Prevalence
SOGS-PY: 2.1 * .72 * .76 = 1.1% DSM-IV-PY: 0.6 * 1.19 * .76 = 0.5% Average = 0.8%
Demographic Correlates of PG male; age 16-24; parent who was problem gambler; lowest income group; separated or divorced
Game Correlates of PG greater number of gambling formats; table games; sports and/or horse race betting
Comments

85
23 Location GREAT BRITAIN (England, Wales, Scotland)
Year Study Conducted 2006-2007
Age 16+
Sources Wardle, H., Sproston, K., Orford, J., Erens, B., Griffiths, M., Constantine, R., & Pigott, S. (2007). British Gambling Prevalence Survey 2007. London: National Centre for Social Research.
Sample Size 9,003
Sampling Strategy
Random sample of 10,144 households. At each address interviewers attempted to obtain face-to-face interview with 1 person. In addition, each person 16+ asked to fill in self-completion questionnaire and return (either online or paper & pencil). Participants received £5 for participation. An attempt was made to conduct a telephone interview for participants who refused or could not be contacted at home.
Survey Description ‘gambling attitudes and activities’
Administration Method face-to-face residential (except problem gambling section which was self-administered) + self-administered mail-in or online + supplemental telephone interviews
Response Rate 52%
Weighting age, sex, region
Threshold for PG Questions spent money on gambling activity in past 12 months
Gambling Availability 223 people per EGM in U.K. in 2006
Past Year Gambling Prevalence 68%
Assessment Instrument CPGI & DSM-IV-PY
Problem Gambling Prevalence CPGI: 1.5% (3-7); 0.5% (8+); 2.0% combined DSM-IV-PY: 0.3% (3-4); 0.3% (5+); 0.6% combined
Standardized Problem Gambling Prevalence
CPGI: 2.0 *.58 * .76 = 0.9% DSM-IV-PY: 0.6 *1.19 * .76 = 0.5% Average = 0.7%
Demographic Correlates of PG male, age 16-34; parent who is/was problem gambler; single, low income; minority group membership
Game Correlates of PG greater number of gambling formats; spread betting (sports betting); fixed odds betting terminals (EGMs); betting exchanges (Internet); Internet gambling
Comments

86
24 Location GREAT BRITAIN (England, Wales, Scotland)
Year Study Conducted 2010
Age 16+
Source(s)
Wardle, H., Moody, A., Spence, S., Orford, J., Volberg, R., Jotangia, D., Griffiths, M., Hussey, D., & Dobbie, F. (2011). British Gambling Prevalence Survey 2010. Prepared for The Gambling Commission. London: National Centre for Social Research.
Sample Size 7,756
Sampling Strategy
Random sample of 9,775 addresses from England, Scotland and Wales selected from the Postcode Address File. Interviewers visited each address and attempted to gain a face to face interview with an adult at that address. Everyone age 16+ was asked to complete an individual questionnaire using computer-assisted self-interviewing. An advance letter was also sent to all sampled addresses. Participants received £5 for participation. An attempt was made to conduct a telephone interview for participants who refused or could not be contacted at home.
Survey Description
“The first few questions are about your leisure activities.” Unlike previous surveys, the 2010 survey was given a survey title that did not explicitly mention the term gambling (i.e., ‘Leisure time: Lottery and Recreation Study 2010’).
Administration Method computer-assisted self-interview + supplemental telephone interviews
Response Rate 47%
Weighting age, sex and regional distribution
Threshold for PG Questions Gambling in past 12-months.
Assessment Instrument CPGI; DSM-IV-PY
Gambling Availability 251 people per EGM in 2010
Past Year Gambling Prevalence 73%
Problem Gambling Prevalence CPGI: 1.8% (3-7); 0.7% (8+); 2.5% combined DSM-IV-PY: 0.5% (3-4); 0.4% (5+); 0.9% combined
Standardized Problem Gambling Prevalence
CPGI: 2.5 * .58 = 1.4% DSM-IV-PY: 0.9 * 1.19 = 1.1% Average = 1.3%
Demographic Correlates of PG
male, younger, parents who gambled regularly and had experienced gambling problems, tobacco smoker; DSM-IV problem gambling was also associated with being Asian/Asian British whereas CPGI problem gambling was associated with being unemployed and being in bad health.
Game Correlates of PG larger number of gambling formats; poker at a pub/club (12.8%); online slot machine style games (9.1%); fixed odds betting terminals (EGMs)(8.8%)
Comments Data collection in 2010 was computer-assisted for the first time.

87
25 Location HONG KONG
Year Study Conducted 2001
Age 15 – 64
Sources
Wong, I. L. K., & So, E. M. T. (2003). Prevalence estimates of problem and pathological gambling in Hong Kong. American Journal of Psychiatry,160, 1353–4. Centre for Social Policy Studies of The Department of Applied Social Sciences & The General Education Centre of The Hong Kong Polytechnic University. (2002, March). Report on a Study of Hong Kong People’s Participation in Gambling Activities. Commissioned By Home Affairs Bureau.
Sample Size 2,004
Sampling Strategy Random digit dialing with random selection of individual within the household. Six attempts at each number over a 10 day period.
Survey Description
Administration Method telephone interview
Response Rate 57.4%
Weighting No, but the “sample was comparable (through t test analyses) to 2001 census figures for gender and age”.
Threshold for PG Questions
Gambling Availability No EGMs in Hong Kong.
Past Year Gambling Prevalence 78.0% (legal gambling = 77.8%; illegal gambling = 4.2%)
Assessment Instrument DSM-IV (modified Chinese version) (designated as PY because no specific time frame provided)
Problem Gambling Prevalence 4.0% (3-4); 1.8% (5+); 5.8% combined
Standardized Problem Gambling Prevalence
5.8 * 1.19 * 1.44 *.76 = 7.6%
Demographic Correlates of PG male; lower education; lower income
Game Correlates of PG horse racing; sports betting; casino table games
Comments

88
26 Location HONG KONG
Year Study Conducted 2005
Age 15-64
Sources
Social Sciences Research Centre (2005). A Study of Hong Kong People's Participation in Gambling Activities. University of Hong Kong. Commissioned by Home Affairs Bureau, Government of Hong Kong Special Administrative Region. Dec 2005.
Sample Size 2,093
Sampling Strategy Random digit dialing with 6 attempts in a 23 day window. Random selection within household (next birthday).
Survey Description ‘participation in gambling activities’
Administration Method telephone interview
Response Rate 23.7% (CASRO calculation derived from data in the report)
Weighting age, gender
Threshold for PG Questions
Gambling Availability No EGMs in Hong Kong.
Past Year Gambling Prevalence 81.1% (legal gambling = 80.4%; illegal gambling = 2.1%)
Assessment Instrument DSM-IV (modified Chinese version) (designated as PY because no specific time frame provided)
Problem Gambling Prevalence 3.1% (3-4); 2.2% (5+); 5.3% combined
Standardized Problem Gambling Prevalence
5.3 * 1.19 * 1.44 * .53 = 4.8%
Demographic Correlates of PG male; lowest family income group
Game Correlates of PG horse racing, soccer betting, casino table games, social gambling
Comments

89
27 Location HONG KONG
Year Study Conducted 2011 (mid July to early August)
Age 15-64
Sources
Hong Kong Polytechnic University (2012). A Study of Hong Kong People's Participation in Gambling Activities. Department of Applied Social Sciences. The Hong Kong Polytechnic University. Commissioned by the Secretary for Home Affairs, Government of Hong Kong Special Administrative Region. March 2012.
Sample Size 2,024
Sampling Strategy
Random digit dialing of listed residential phone numbers with 3 attempts to contact each sampled respondent. Sample was supplemented with telephone numbers not listed in the directory. Random selection within household (selecting person with next birthday).
Survey Description ‘participation in gambling activities’
Administration Method telephone interview
Response Rate 14.8% (CASRO calculation derived from data in the report)
Weighting
Threshold for PG Questions
Gambling Availability No EGMs in Hong Kong in 2011.
Past Year Gambling Prevalence 62.0%
Assessment Instrument DSM-IV (modified Chinese version) (designated as PY because no specific time frame provided)
Problem Gambling Prevalence 1.9% (3-4); 1.4% (5+); 3.3% combined
Standardized Problem Gambling Prevalence
3.3 * 1.19 * 2.18 * .51 = 4.4%
Demographic Correlates of PG male; less education; lower family income group
Game Correlates of PG horse racing, soccer betting, Macau casinos
Comments

90
28 Location HUNGARY
Year Study Conducted 2007
Age 18-64
Source(s) Kun B., Balázs H., Arnold, P., Paksi, B., & Demetrovics, Z. (2011). Gambling in western and eastern Europe: The example of Hungary. Journal of Gambling Studies. doi:10.1007/s10899-011-9242-4
Sample Size 2,710
Sampling Strategy Sampling addresses from the civil registry stratified by geographical location, degree of urbanization and age.
Survey Description Problem gambling assessed as part of a more thorough assessment of all addiction: “National Survey on Addiction Problems”
Administration Method face-to-face residential interview; self-administered SOGS
Response Rate 85.1%
Weighting Yes
Threshold for PG Questions ever gambled on a weekly basis in their lifetime
Assessment Instrument SOGS-L
Gambling Availability 304 people per EGM in 2006
Past Year Gambling Prevalence (65.3% Lifetime)
Problem Gambling Prevalence 1.9% (3-4); 1.4% (5+); 3.3% combined
Standardized Problem Gambling Prevalence
3.3 * .72 *.44 = 1.0%
Demographic Correlates of PG males; age 18-24; less education; lower income; smoker; heavier drinking; lifetime cannabis use
Game Correlates of PG
Comments

91
29 Location ICELAND
Year Study Conducted 2000
Age 16-75
Sources
IMG-Gallup (2000). Vidhorfsrannsókn [Attitude survey]. Report. Reykjavik: Íslenskar Markadsrannsóknir. Ólason D. T., Barudottir, S. K., & Gretarsson, S. J. (2005). Prevalence of pathological gambling among adults in Iceland. Paper presented at the 6th conference on research in Social Sciences, Reykjavík, Iceland. Jonsson, J. (2006). An overview of prevalence surveys of problem and pathological gambling in the Nordic countries. Journal of Gambling Issues, 18.
Sample Size 1,500
Sampling Strategy randomly drawn from the national register
Survey Description
Administration Method
Response Rate 70.5%
Weighting
Threshold for PG Questions
Gambling Availability
Past Year Gambling Prevalence
Assessment Instrument DSM-IV-L (NODS-L)
Problem Gambling Prevalence 0.7% (3-4); 0.6% (5+); 1.3% combined
Standardized Problem Gambling Prevalence
1.3 * 1.19 * .44 = 0.7%
Demographic Correlates of PG Males
Game Correlates of PG
Comments

92
30 Location ICELAND
Year Study Conducted 2005
Age 18-70
Sources
Olason, D. T., & Gretarsson, S. J. (2009). Iceland. In G. Meyer, T. Hayer, & M. Griffiths (Eds.), Problem Gambling in Europe: Challenges, Prevention, and Interventions (pp. 137-151). New York: Springer. doi: 10.1007/978-0-387-09486-1 Jonsson, J. (2006). An overview of prevalence surveys of problem and pathological gambling in the Nordic countries. Journal of Gambling Issues, 18. Ólason, D. T. (2009). Gambling and Problem Gambling Studies among Nordic Adults: Are they Comparable? Conference presentation @ 7th Nordic Conference, Helsinki, Finland, May, 2009.
Sample Size 3,358
Sampling Strategy randomly drawn from the national register
Survey Description
Administration Method telephone interview + a few self-administered mail-in (n = 100)
Response Rate 69.8%
Weighting gender, age, residency
Threshold for PG Questions
Gambling Availability 280 People per EGM in 2008
Past Year Gambling Prevalence 69%
Assessment Instrument DSM-IV-PY (DIGS-PY) & CPGI
Problem Gambling Prevalence DSM-IV-PY: 0.5% (3-4); 0.6% (5+); 1.1% combined CPGI: 1.1% (3-7); 0.5% (8+); 1.6% combined
Standardized Problem Gambling Prevalence
DSM-IV-PY: 1.1 * 1.19 * 1.44 * .76 = 1.4% CPGI: 1.6 * .58 * 1.44 * .76 = 1.0% Average = 1.2%
Demographic Correlates of PG male; 18-25; less education; single; ADHD; cognitive distortions
Game Correlates of PG larger number of games; private card games; EGMs
Comments

93
31 Location ICELAND
Year Study Conducted 2007
Age 18-70
Source(s) Ólason, D.T. (2009). Gambling and Problem Gambling Studies among Nordic Adults: Are they Comparable? Conference presentation @ 7th Nordic Conference, Helsinki, Finland, May, 2009.
Sample Size 3,009
Sampling Strategy randomly drawn from the national register
Survey Description
Administration Method telephone interview
Response Rate 63.4%
Weighting Not indicated, but presumed.
Threshold for PG Questions
Assessment Instrument CPGI
Gambling Availability 280 People per EGM in 2008
Past Year Gambling Prevalence 69.4% (11.8% weekly)
Problem Gambling Prevalence 1.3% (3-7); 0.3% (8+); 1.6% combined
Standardized Problem Gambling Prevalence
1.6 * .58 * 1.44 *.76 = 1.0%
Demographic Correlates of PG
Game Correlates of PG slot machines; poker; Internet poker
Comments

94
32 Location ITALY
Year Study Conducted 2008
Age 18 – 74
Sources
1. Barbaranelli, C. (2010). Prevalence and Correlates of Problem Gambling in Italy. 8th European Conference on Gambling Studies and Policy Issues, September 14-17, 2010 and www.lottomaticagroup.com/eng/pdf/social/pre_sintesi_7_10_new.pdf
Sample Size 2,000
Sampling Strategy Quota sampling for geographic area, city size, age, gender
Survey Description
Administration Method
Response Rate
Weighting
Threshold for PG Questions
Gambling Availability 291 People per EGM in 2008
Past Year Gambling Prevalence 54%
Assessment Instrument CPGI and SOGS cross classification (presumably using the SOGS-PY)
Problem Gambling Prevalence 1.27% (5+)
Standardized Problem Gambling Prevalence
1.27 * (2.17+1.49)/2 = 2.3%
Demographic Correlates of PG
male, divorced, higher income, a parent with gambling problems, gambling at a younger age, more gambling fallacies, higher depression and anxiety, greater impulsivity, higher risk taking, greater motivation to gamble for symbolic, economic, and hedonistic motives, lower self-efficacy
Game Correlates of PG larger number of games; horse racing, card games, EGMs, casinos
Comments

95
33 Location LITHUANIA
Year Study Conducted 2006
Age 18-64
Sources Skokauskas (2009). Lithuania. In G. Meyer, T. Hayer, & M. Griffiths (Eds.), Problem Gambling in Europe: Challenges, Prevention, and Interventions. New York: Springer. doi: 10.1007/978-0-387-09486-1
Sample Size 1,002
Sampling Strategy
Survey Description
Administration Method
Response Rate
Weighting
Threshold for PG Questions
Gambling Availability 6305 People per EGM in 2008
Past Year Gambling Prevalence “30.1% of respondents admitted they had gambled”
Assessment Instrument No established instrument used.
Problem Gambling Prevalence 2.1% reported they had financial problems because of their gambling; 2.0% reported they had psychological problems; 0.1% reported they had ‘other’ problems. 13.0% did not answer the question about problems.
Standardized Problem Gambling Prevalence
>2.1%. Note: single item questions asking about the presence of gambling-related problems always significantly underestimates true rates of problem gambling (e.g., Rockloff et al., 2011. Validation of a one item screen for problem gambling. Journal of Gambling Studies. DOI: 10.1007/s10899-010-9232-y).
Demographic Correlates of PG
Game Correlates of PG
Comments This dataset not considered reliable by author; results are from an opinion poll on gambling.

96
34 Location MACAU
Year Study Conducted 2003
Age 15-64
Sources Fong , D. K. C., & Orozio, B. (2005). Gambling participation and prevalence estimates for pathological gambling in a far east gambling city: Macau. UNLV Gaming Research & Review Journal, 9(2), 15-28.
Sample Size 1,121
Sampling Strategy Half of all residential telephone numbers provided by the only fixed-line telephone service provider were randomly drawn; random selection within household.
Survey Description
Administration Method telephone interview
Response Rate 68%
Weighting
Threshold for PG Questions lifetime participation in gambling
Gambling Availability 550 People per EGM in 2002
Past Year Gambling Prevalence 67.9%
Assessment Instrument DSM-IV (modified Chinese version) (designated as PY because no specific time frame provided)
Problem Gambling Prevalence 2.5% (3-4); 1.8% (5+); 4.3% combined
Standardized Problem Gambling Prevalence
4.3 * 1.19 * 1.59 * .74 = 6.0%
Demographic Correlates of PG males; monthly personal income of less than MOP 8,000
Game Correlates of PG casino gambling; betting on soccer; mahjong house gambling
Comments

97
35 Location NETHERLANDS
Year Study Conducted 2004
Age 16+
Sources
De Bruin, D.E., Meijerman, C.J.M., Leenders, F.R.J., & Braam, R.V. (2006). Verslingerd aan meer dan één spel: Een onderzoek naar de aard en omvang van kansspelproblematiek in nederland [Wired to more than one game. A study on the nature and extent of problem gambling in the Netherlands]. Den Haag: Research and Documentation Centre of the Ministry of Justice, commissioned by the Ministry of Justice. Goudriaan et al (2009). The Netherlands. In G. Meyer, T. Hayer, & M. Griffiths (Eds.), Problem Gambling in Europe: Challenges, Prevention, and Interventions. New York: Springer. doi: 10.1007/978-0-387-09486-1 (citing De Bruin et al., 2006).
Sample Size 5,575
Sampling Strategy
Households randomly selected based on Dutch postal codes. Those with a landline are phoned. Those without a landline (32%) are given a questionnaire and asked to complete online or via paper and pencil and return via mail. This procedure is also used for people with a landline who could not be contacted. Person with the next birthday within the household asked to complete the survey/questionnaire. Pre-notification letter sent to households. Ten call attempts.
Survey Description
Administration Method Predominantly telephone interview. However, respondents could also complete online or via paper & pencil and mail-in.
Response Rate 28%
Weighting gender, age, education, ethnicity, household size
Threshold for PG Questions
Gambling Availability 2579 People per EGM in 2004
Past Year Gambling Prevalence 71.7% (87% gambled in Lifetime)
Assessment Instrument SOGS-PY & SOGS-L
Problem Gambling Prevalence SOGS-PY: 0.6% (3-4); 0.3% (5+); 0.9% combined SOGS-L: 1.5% (3-4); 1.0% (5+); 2.5% combined
Standardized Problem Gambling Prevalence
0.9 * .72 * 1.44 *.53 = 0.5%
Demographic Correlates of PG male; age 30-50; nonwestern; unemployed; single; lower education
Game Correlates of PG larger number of gambling formats; illegal gambling; slots; cards & dice; casino games
Comments

98
36 Location NEW ZEALAND
Year Study Conducted 1991
Age
Sources
Abbott, M.W., & Volberg, R.A. (1991). Gambling and Problem Gambling in New Zealand. Research Series No. 12. Wellington: Department of Internal Affairs.
Abbott, M.W., & Volberg, R.A. (1992). Frequent Gamblers and Problem Gamblers in New Zealand. Research Series No. 14. Wellington: Department of Internal Affairs.
Abbott, M.W., & Volberg, R.A. (1996). The New Zealand national survey of problem and pathological gambling. Journal of Gambling Studies, 12(2), 143-160. doi: http://dx.doi.org/10.1007/BF01539171
Volberg, R.A., & Abbott, M.W. (1994). Lifetime prevalence estimates of pathological gambling in New Zealand. International Journal of Epidemiology, 23, 976-983. doi: http://dx.doi.org/10.1093/ije/23.5.976
Sample Size 4,053
Sampling Strategy random digit dialing; random selection within household; up to 8 callbacks
Survey Description “The survey we are doing has to do with betting activities or games, in which there is an element of luck or chance.”
Administration Method telephone interview
Response Rate 66%
Weighting age, gender and household size
Threshold for PG Questions
Gambling Availability
Past Year Gambling Prevalence (95% - Lifetime)
Assessment Instrument SOGS-PY & SOGS-L
Problem Gambling Prevalence SOGS-PY: 2.1% (3-4); 1.2% (5+); 3.3% combined SOGS-L: 4.3% (3-4); 2.7% (5+); 7.0% combined
Standardized Problem Gambling Prevalence
3.3 * .72 * 1.44 * .76 = 2.6%
Demographic Correlates of PG 18-29; males; Maori & Pacific Islander; unemployed; single
Game Correlates of PG race track betting; EGMs
Comments

99
37 Location NEW ZEALAND
Year Study Conducted 1999
Age 18+
Sources
Abbott, M.W., & Volberg, R.A. (2000). Taking the Pulse on Gambling and Problem Gambling in New Zealand: A Report on Phase One of the 1999 National Prevalence Survey. Wellington: Department of Internal Affairs.
Abbott, M.W., Volberg, R.A., & Rönnberg, S. (2004). Comparing the New Zealand and Swedish national surveys of gambling and problem gambling. Journal of Gambling Studies, 20(3), 237-258. doi: 10.1023/B:JOGS.0000040278.08853.c0
Sample Size 6,452
Sampling Strategy prenotification letter sent to listed telephone numbers; survey conducted by Statistics New Zealand
Survey Description “The survey has to do with betting activities or games in which there is an element of luck or chance, for example Lotto, TAB or Telebingo.”
Administration Method telephone interview
Response Rate 75%
Weighting Yes
Threshold for PG Questions any lifetime gambling
Gambling Availability 14,877 EGMs in 1999. Estimated population of 3,800,000 in 1999. 255 people per EGM.
Past Year Gambling Prevalence (94% - Lifetime; 86% - Past 6-months)
Assessment Instrument SOGS-Past 6 months & SOGS-L
Problem Gambling Prevalence SOGS-6 months: 0.8% (3-4); 0.5% (5+); 1.3% combined SOGS-L: 1.9% (3-4); 1.0% (5+); 2.9% combined
Standardized Problem Gambling Prevalence
1.3 * .72 * 1.44 * .76 = 1.0%
Demographic Correlates of PG Pacific Island ethnicity; Mäori; born outside New Zealand, Europe, Australia and North America; Catholic; households with incomes between $40,001 and $50,000; male
Game Correlates of PG casino games; EGMs; telebingo
Comments

100
38 Location NEW ZEALAND
Year Study Conducted 2002-2004
Age 15+
Sources Mason, K. (2006). Problem Gambling in New Zealand: Analysis of the 2002/03 New Zealand Health Survey. Wellington: Ministry of Health.
Sample Size 12,929
Sampling Strategy Complex multi-stage design, with stratification and clustering. Pre-survey letters were sent to selected households before the interviewer visited the house, and up to 10 callbacks were made to each selected household.
Survey Description
Administration Method face-to-face residential interview
Response Rate 72%
Weighting Yes - to represent the New Zealand adult civilian population aged 15 and over, who are non-institutionalised, live in permanent private dwellings and are usually resident in New Zealand.
Threshold for PG Questions
Gambling Availability 158 people per EGM in 2002
Past Year Gambling Prevalence 69.4%
Assessment Instrument custom 10 question gambling screen
Problem Gambling Prevalence 1.2% (“current problem gambling”); 1.9% (combined problem gambling and at-risk gambling)
Standardized Problem Gambling Prevalence
Demographic Correlates of PG age 25-34; male; Maori or Pacific ethnicity; employed; living alone; lower educational attainment; hazardous drinking; smokers; poorer health; mental health problems
Game Correlates of PG
Comments
The custom gambling screen and scoring system were developed for the 2002/03 New Zealand Health Survey by the Ministry of Health and a contracted technical specialist, as it was thought no existing gambling screen met the criteria required for the screen.
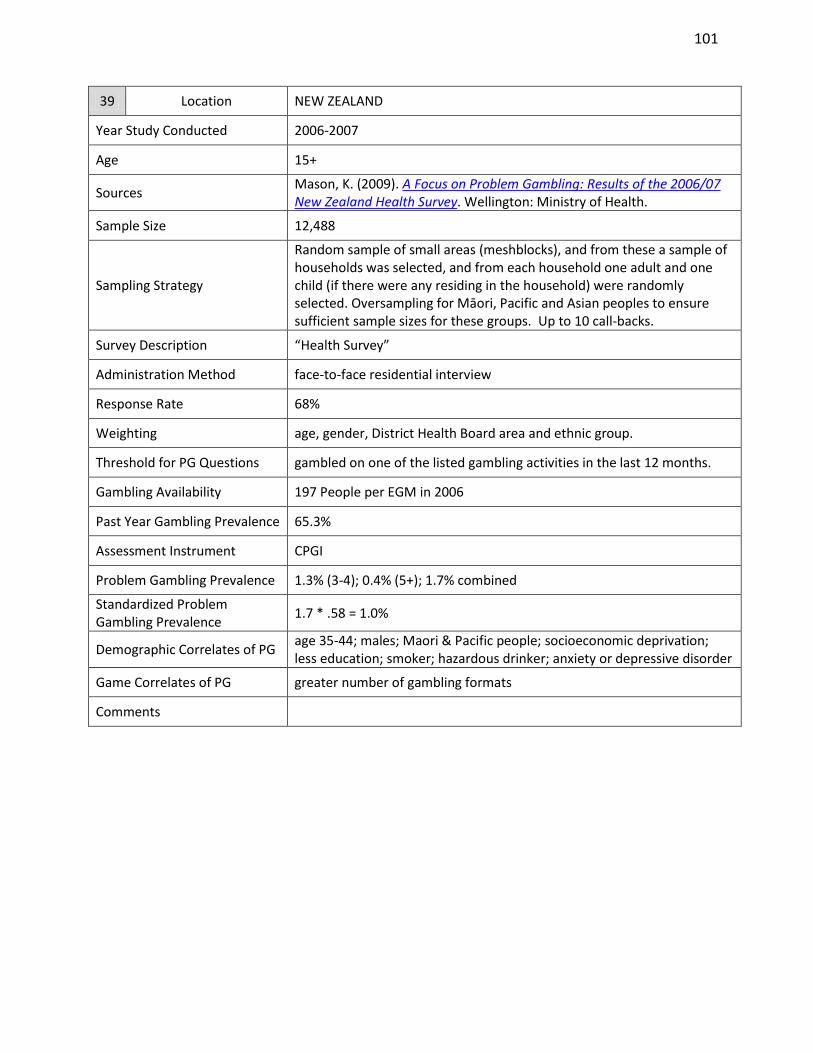
101
39 Location NEW ZEALAND
Year Study Conducted 2006-2007
Age 15+
Sources Mason, K. (2009). A Focus on Problem Gambling: Results of the 2006/07 New Zealand Health Survey. Wellington: Ministry of Health.
Sample Size 12,488
Sampling Strategy
Random sample of small areas (meshblocks), and from these a sample of households was selected, and from each household one adult and one child (if there were any residing in the household) were randomly selected. Oversampling for Māori, Pacific and Asian peoples to ensure sufficient sample sizes for these groups. Up to 10 call-backs.
Survey Description “Health Survey”
Administration Method face-to-face residential interview
Response Rate 68%
Weighting age, gender, District Health Board area and ethnic group.
Threshold for PG Questions gambled on one of the listed gambling activities in the last 12 months.
Gambling Availability 197 People per EGM in 2006
Past Year Gambling Prevalence 65.3%
Assessment Instrument CPGI
Problem Gambling Prevalence 1.3% (3-4); 0.4% (5+); 1.7% combined
Standardized Problem Gambling Prevalence
1.7 * .58 = 1.0%
Demographic Correlates of PG age 35-44; males; Maori & Pacific people; socioeconomic deprivation; less education; smoker; hazardous drinker; anxiety or depressive disorder
Game Correlates of PG greater number of gambling formats
Comments

102
40 Location NORTHERN IRELAND
Year Study Conducted 2010
Age 16+
Sources 1. Department for Social Development [Northern Ireland]. (2010). Northern
Ireland Gambling Prevalence Survey 2010. Belfast: Author
Sample Size 1,032
Sampling Strategy
Random sample of 2,069 addresses selected from the Pointer Database, the most up-to-date listing of private households in Northern Ireland. At each address, interviewers attempted a short, face to face, interview with one household member.
Survey Description ‘gambling attitudes and activities’
Administration Method Face-to-face residential interview; although CPGI section completed privately.
Response Rate 57%
Weighting age, gender, and regional distribution
Threshold for PG Questions
Gambling Availability 457 people per EGM in Ireland in 2010
Past Year Gambling Prevalence 75.3%
Assessment Instrument CPGI
Problem Gambling Prevalence 5.3% (3-7); 2.2% (8+); 7.5% combined
Standardized Problem Gambling Prevalence
7.5 * .58 * .76 = 3.3%
Demographic Correlates of PG males; age 18 to 29; single
Game Correlates of PG EGMs, horse race betting, football betting, online gambling
Comments

103
41 Location NORWAY
Year Study Conducted 1997
Age 18+
Sources
Götestam K.G., & Johansson, A. (2003). Characteristics of gambling and problematic gambling in the Norwegian context: A DSM-IV based telephone interview study. Addictive Behaviors, 28, 189–97.doi: 10.1016/S0306-4603(01)00256-8 Götestam & Johansson (2009). Norway. In G. Meyer, T. Hayer, & M. Griffiths (Eds.), Problem Gambling in Europe: Challenges, Prevention, and Interventions. New York: Springer. doi: 10.1007/978-0-387-09486-1 (citing Götestam & Johansson, 2003).
Sample Size 2,014
Sampling Strategy random-digit telephone dialing of residential dwellings; up to 8 call-backs made to complete an interview
Survey Description
Administration Method telephone interview
Response Rate 47.8%
Weighting age * sex * geography weights calculated, but were not applied to the problem gambling prevalence rates
Threshold for PG Questions
Gambling Availability 28,600 EGMs in 1999. Population of 4,438,547 in 1999. 155 people per EGM.
Past Year Gambling Prevalence Not specifically indicated, although 31.2% reported never gambling.
Assessment Instrument DSM-IV (designated as PY because no specific time frame provided)
Problem Gambling Prevalence 0.45% (3-4); 0.15% (5+); 0.6% combined
Standardized Problem Gambling Prevalence
0.6 * 1.19 * 1.59 * .74 = 0.8%
Demographic Correlates of PG age 18-30; males
Game Correlates of PG slots; lotteries
Comments

104
42 Location NORWAY
Year Study Conducted 2002
Age 15-74
Sources
Lund, I., & Nordlund, S. (2003). Pengespill og pengeproblemer i Norge (Rapport nr. 2/2000). Oslo: Statens institutt for rusmiddelforskning. Gotestam & Johansson (2009). Norway. In G. Meyer, T. Hayer, & M. Griffiths (Eds.), Problem Gambling in Europe: Challenges, Prevention, and Interventions. New York: Springer. doi: 10.1007/978-0-387-09486-1 (citing Lund & Nordlund, 2003).
Jonsson, J. (2006). An overview of prevalence surveys of problem and pathological gambling in the Nordic countries. Journal of Gambling Issues, 18.
Sample Size 5,235
Sampling Strategy random selection of people from the national registry
Survey Description
Administration Method phone + mail in for those not contacted by phone
Response Rate 55% (telephone response rate = 65.3%; postal response rate = 40.8%)
Weighting
Threshold for PG Questions
Gambling Availability 150 People per EGM in 2002
Past Year Gambling Prevalence 81%
Assessment Instrument SOGS-PY & SOGS-L; DSM-IV-PY & DSM-IV-L (NODS)
Problem Gambling Prevalence
SOGS-PY: 0.4% (3-4); 0.2% (5+); 0.6% combined DSM-IV-PY: 0.4% (3-4); 0.3% (5+); 0.7% combined SOGS-L: 0.7% (3-4); 0.3% (5+) 1.0% combined DSM-IV-L: 0.8% (3-4); 0.6% (5+); 1.4% combined
Standardized Problem Gambling Prevalence
SOGS: 0.6 * .72 * 1.59 * .74 = 0.5% DSM-IV-PY: 0.7 *1.19 * 1.59 * .74 = 1.0% Average = .7%
Demographic Correlates of PG males
Game Correlates of PG larger number of games; EGMs; sports betting
Comments

105
43 Location NORWAY
Year Study Conducted 2005
Age 15-70+
Source(s)
Kavli, H., & Berntsen, W. (2005). Undersøkelse om pengespill [Study of gambling for money]. Spillevaner og spilleproblemer I befolkningen. Oslo: MMI. Götestam, K.G., & Johansson, A. (2009). Norway. In G. Meyer, T. Hayer, & M. Griffiths (Eds.), Problem Gambling in Europe: Challenges, Prevention, and Interventions (pp. 209-218). New York: Springer. doi:10.1007/978-0-387-09486-1 Ólason, D. T. (2009). Gambling and Problem Gambling Studies among Nordic Adults: Are they Comparable? Conference presentation @ 7th Nordic Conference, Helsinki, Finland, May, 2009.
Sample Size 3,135
Sampling Strategy
Randomly selected from landline (50%) and cell phone numbers (50%) with quotas for gender, age, and region. Individuals were asked if they were willing to participate. If they agreed they were sent a questionnaire in the mail.
Survey Description “a study of Norwegians’ attitudes to gambling and gambling habits”
Administration Method self-administered mailed-in surveys
Response Rate estimated to be as low or lower than 25%
Weighting age, gender, region
Threshold for PG Questions
Assessment Instrument CPGI
Gambling Availability 151 people per EGM in 2004
Past Year Gambling Prevalence 92.5%
Problem Gambling Prevalence 3.6% (3-7); 1.9% (8+); 5.5% combined
Standardized Problem Gambling Prevalence
5.5 * .58 * .53 = 1.7%
Demographic Correlates of PG
Game Correlates of PG
Comments
Study conducted by Synovate (formerly known as Market and Media Institute (MMI)). This study was critiqued by Volberg, RA, Abbott, MW, & Munck (May 29, 2006). Review of Kavli & Bernsten, Study on Gambling Habits and Gambling Problems in the Population.

106
44 Location NORWAY
Year Study Conducted 2007
Age 15-70+
Source(s)
Kavli, H. (2007). Spillevaner og spilleproblemer i den norske befolkningen. Analyserapport 2007. Synovate MMI. Götestam, K. G., & Johansson, A. (2009). Norway. In G. Meyer, T. Hayer, & M. Griffiths (Eds.), Problem Gambling in Europe: Challenges, Prevention, and Interventions (pp. 209-218). New York: Springer. doi:10.1007/978-0-387-09486-1 Ólason, D. T. (2009). Gambling and Problem Gambling Studies among Nordic Adults: Are they Comparable? Conference presentation @ 7th Nordic Conference, Helsinki, Finland, May, 2009.
Sample Size 3,135
Sampling Strategy
Randomly selected from landline (50%) and cell phone numbers (50%) with quotas for gender, age, and region. Individuals were asked if they were willing to participate. If they agreed they were sent a questionnaire in the mail.
Survey Description “a study of Norwegians’ attitudes to gambling and gambling habits”
Administration Method self-administered mailed-in surveys
Response Rate 22%
Weighting age, gender, region
Threshold for PG Questions
Assessment Instrument CPGI
Gambling Availability Slot machines were removed from Norway in July 2007 and reintroduced in January 2009.
Past Year Gambling Prevalence
Problem Gambling Prevalence 2.6% (3-7); 1.7% (8+); 4.3% combined
Standardized Problem Gambling Prevalence
4.3 * .58 * .53 = 1.3%
Demographic Correlates of PG
Game Correlates of PG
Comments Study conducted by Synovate (formerly known as Market and Media Institute (MMI)).

107
45 Location NORWAY
Year Study Conducted 2007
Age 16-74
Sources
Bakken, I. J., Götestam, K. G., Gråwe, R. W., Wenzel, H. G. & Øren, A. (2009). Gambling behavior and gambling problems in Norway 2007. Scandinavian Journal of Psychology, 50, 333-339. doi: 10.1111/j.1467-9450.2009.00713.x
Ólason, D. T. (2009). Gambling and Problem Gambling Studies among Nordic Adults: Are they Comparable? Conference presentation @ 7th Nordic Conference, Helsinki, Finland, May, 2009.
Sample Size 3,482
Sampling Strategy Random sample of 10,000 people from the national population register mailed a survey.
Survey Description
Administration Method self-administered mailed-in surveys (or completed online)
Response Rate 36.1%
Weighting age, gender, geography
Threshold for PG Questions
Gambling Availability Slot machines were removed from Norway in July 2007 and reintroduced in January 2009.
Past Year Gambling Prevalence 67.9%
Assessment Instrument DSM-IV-PY & DSM-IV-L (NODS)
Problem Gambling Prevalence DSM-IV-PY: 0.4% (3-4); 0.3% (5+); 0.7% combined DSM-IV-L: 1.1% (3-4); 0.7% (5+); 1.7% combined
Standardized Problem Gambling Prevalence
0.7 * 1.19 * .53 = .4% Averaged with Synovate 2007 Study = 0.9%
Demographic Correlates of PG male; 16-24; born outside Norway; lower education; single
Game Correlates of PG slot machines; instant win
Comments conducted by SINTEF organization

108
46 Location NORWAY
Year Study Conducted 2008
Age 16-74
Sources
Bakken, I.J. & Weggeberg, H. (2008). Pengespill og pengespillproblem i Norge 2008 [Gambling Behaviour and Problem Gambling in Norway 2008]. SINTEF Rapport A8499. Ólason, D. T. (2009). Gambling and Problem Gambling Studies among Nordic Adults: Are they Comparable? Conference presentation @ 7th Nordic Conference, Helsinki, Finland, May, 2009.
Sample Size 3,441
Sampling Strategy 10,000 surveys mailed out to random sample from the national population register.
Survey Description
Administration Method self-administered mailed-in surveys (or completed online)
Response Rate 35%
Weighting age, gender, geography
Threshold for PG Questions
Gambling Availability Slot machines were removed from Norway in July 2007 and reintroduced in January 2009. Note: World Count of Gaming Machines incorrectly reports 250 people per EGM in 2008
Past Year Gambling Prevalence 77%
Assessment Instrument DSM-IV-PY (NODS)
Problem Gambling Prevalence 0.6% (3-4); 0.2% (5+); 0.8% combined
Standardized Problem Gambling Prevalence
.8 * 1.19 * .53 = 0.5%
Demographic Correlates of PG male; 16-24; born outside Norway; lower education; single
Game Correlates of PG greater number of games; Internet gambling; slots
Comments conducted by SINTEF organization

109
47 Location NORWAY
Year Study Conducted 2008
Age 15-70+
Sources
Kavli, H. & Torvik, F.A. (2008). Spillevaner og spilleproblemer i befolkningen 2008 [Playing habits and gambling problems in the population 2008]. Synovate. Norsk Tipping Annual Reports
Sample Size 3,165
Sampling Strategy
Randomly selected from landline (50%) and cell phone numbers (50%) with quotas for gender, age, and region. Individuals were asked if they were willing to participate. If they agreed they were sent a questionnaire in the mail.
Survey Description “a study of Norwegians’ attitudes to gambling and gambling habits”
Administration Method self-administered mailed-in surveys
Response Rate 23%
Weighting Age, gender, region
Threshold for PG Questions
Gambling Availability Slot machines were removed from Norway in July 2007 and reintroduced in January 2009.
Past Year Gambling Prevalence
Assessment Instrument CPGI
Problem Gambling Prevalence 2.1% (3-7); 1.9% (8+); 4.0% combined
Standardized Problem Gambling Prevalence
4.0 * .58 * .53 = 1.23% Averaged with Bakken, I.J. & Weggeberg, H. (2008) = 0.87%
Demographic Correlates of PG 70% male; under age 30; low income; lower educational attainment; urban; single; unemployed/students/retirees/pensioners
Game Correlates of PG
Comments Study conducted by Synovate.

110
48 Location NORWAY
Year Study Conducted 2010
Age 15-70+
Sources
Pran, K.R. & Ukkelberg, A. (2010). Spillevaner og spilleproblemer I befolkningen 2010 Synovate Norge. Norsk Tipping Annual Reports
Sample Size 4,636
Sampling Strategy
Randomly selected from landline (50%) and cell phone numbers (50%) with quotas for gender, age, and region. Individuals were asked if they were willing to participate. If they agreed they were sent a questionnaire in the mail.
Survey Description “a study of Norwegians’ attitudes to gambling and gambling habits”
Administration Method
self-administered mailed-in surveys “The methodology used by the survey company, Synovate, was revised between the 2008 and 2010 surveys. This raises questions over the comparability of the two surveys”.
Response Rate 14%
Weighting Age, gender, region
Threshold for PG Questions
Gambling Availability 1,686 people per EGM in 2010.
Past Year Gambling Prevalence
Assessment Instrument CPGI
Problem Gambling Prevalence 2.3% (3-7); 2.1% (8+); 4.4% combined
Standardized Problem Gambling Prevalence
4.4 * .58 * .53 = 1.35%
Demographic Correlates of PG 80% male; under age 30; low income; less education; urban and northern Norway; single; unemployed and pensioners
Game Correlates of PG Internet gambling
Comments Study conducted by Synovate.

111
49 Location SINGAPORE
Year Study Conducted 2004-2005
Age 18+
Sources Ministry of Community Development, Youth and Sports (2005, April). Ministry of Community Development, Youth and Sports Survey. Singapore: Author.
Sample Size 2,004
Sampling Strategy random sample of residences with oversampling of minority ethnic groups
Survey Description
Administration Method face-to-face residential interview
Response Rate 90%
Weighting Yes
Threshold for PG Questions
Gambling Availability 2,433 people per EGM in 2004
Past Year Gambling Prevalence 58% (of those 18 and above)
Assessment Instrument DSM-IV-PY
Problem Gambling Prevalence 2.0% (3-4); 2.1% (5+); 4.1% combined
Standardized Problem Gambling Prevalence
4.1 * 1.19 = 4.9%
Demographic Correlates of PG male; Chinese; 30-49; higher income; divorced/separated; less than university education
Game Correlates of PG
Comments

112
50 Location SINGAPORE
Year Study Conducted 2007-2008
Age 18+
Sources Ministry of Community Development, Youth and Sports (2008). Report of Survey on Participation in Gambling Activities Among Singapore Residents, 2008. Singapore: Author.
Sample Size 2,300
Sampling Strategy random sample of residences; oversampling of minority ethnic
Survey Description
Administration Method face-to-face residential interview
Response Rate 89%
Weighting Yes
Threshold for PG Questions
Gambling Availability 2,277 People per EGM in 2008
Past Year Gambling Prevalence 54%
Assessment Instrument DSM-IV-PY
Problem Gambling Prevalence 1.2% (3-4); 1.7% (5+); 2.9% combined
Standardized Problem Gambling Prevalence
2.9 * 1.19 = 3.5%
Demographic Correlates of PG male; Chinese; 30-59; less than university education; married; middle income
Game Correlates of PG
Comments

113
51 Location SINGAPORE
Year Study Conducted 2011 (May – August)
Age 18+
Sources National Council on Problem Gambling (2012). Report of Survey on Participation in Gambling Activities among Singapore Residents, 2011. Singapore: Author. February 23, 2012.
Sample Size 3,315
Sampling Strategy random sample of residences; oversampling of minority ethnic
Survey Description
Administration Method face-to-face residential interview
Response Rate 81%
Weighting Yes
Threshold for PG Questions
Gambling Availability 2,351 People per EGM in 2010
Past Year Gambling Prevalence 47.0%
Assessment Instrument DSM-IV-PY
Problem Gambling Prevalence 1.2% (3-4); 1.4% (5+); 2.6% combined
Standardized Problem Gambling Prevalence
2.6 * 1.19 = 3.1%
Demographic Correlates of PG male; Chinese; 18-29 & 40-49; less than university education; married; middle income
Game Correlates of PG
Comments

114
52 Location SOUTH AFRICA
Year Study Conducted 2000-2001
Age 18+
Sources Collins, P., & Barr, G. (2001). Gambling and Problem Gambling in South Africa: A National Study. National Centre for the Study of Gambling at the University of Cape Town.
Sample Size 5,800
Sampling Strategy
South African adults 18+ living in towns and cities (i.e.,45% of the total adult population); exclusion of people living in Tribal Trust or remote rural areas; approximately 90% of those surveyed lived in flats or houses made of brick, as opposed to living in shacks or other informal kinds of dwelling). Only interviewed members of households who claimed knowledge of total household budgets. Questionnaire translated into all main South African languages and administered to respondents in language of their choice by interviewers fluent in that language.
Survey Description Leisure/recreational activities? (as was done in the 2006 survey by the same survey firm?)
Administration Method
Face-to-face residential interview. However, the 20 questions from Gamblers Anonymous and from Alcoholics Anonymous were administered by asking respondents to fill out a card and place it (anonymously) in a box.
Response Rate
Weighting
Gambling Availability 2,132 people per EGM in 2002
Past Year Gambling Prevalence 74.4% have gambled
Threshold for PG Questions
Assessment Instrument Gamblers Anonymous 20 Questions (Lifetime, as all the questions ask about ‘ever’); SOGS (designated as PY, as no time frame is specified and the term ‘ever’ has been removed from the questions)
Problem Gambling Prevalence GA20-L: 3.8% (7+) SOGS-PY: 1.4% (5+)
Standardized Problem Gambling Prevalence
(1.4 * 1.49 = 2.1%)
Demographic Correlates of PG
Game Correlates of PG
Comments
The requirement that the person had to have knowledge of household finances “will have biased respondents in favour of senior members of households”. Results must be seen as very tentative due to the nonrepresentative sampling. This study is not reported in the tables or included in the analyses.

115
53 Location SOUTH AFRICA
Year Study Conducted 2002-2003
Age 18+
Sources Collins, P., & Barr, G. (2003). Gambling and Problem Gambling in South Africa: A National Study. National Centre for the Study of Gambling at the University of Cape Town.
Sample Size 5,816
Sampling Strategy Same methodology as the 2000/2001 study.
Survey Description Leisure/recreational activities? (as was done in the 2006 survey by the same survey firm?)
Administration Method
Face-to-face residential interview. However, the 20 questions from Gamblers Anonymous and from Alcoholics Anonymous were administered by asking respondents to fill out a card and place it (anonymously) in a box.
Response Rate
Weighting
Threshold for PG Questions
Gambling Availability 2,132 people per EGM in 2002
Past Year Gambling Prevalence 79.9% have gambled
Assessment Instrument Gamblers Anonymous 20 Questions - Lifetime
Problem Gambling Prevalence
7+ = 4.6% Extrapolating from the 2000/2001 study to get a SOGS score: 1.4% SOGS-PY 5+/ 3.8% GA20 = ? / 4.6% GA20; ? = 1.7% SOGS-PY 5+
Standardized Problem Gambling Prevalence
(1.7 * 1.49 = 2.5%)
Demographic Correlates of PG
Game Correlates of PG
Comments
Repeated the 2001 survey using an identically selected sample but did not use SOGS instrument, as its emphasis on financial consequences (e.g., borrowing, bounced cheques, selling assets) was unsuitable for large portions of the population. Results must be seen as very tentative due to the nonrepresentative sampling and the extrapolation to a SOGS 5+ rate from a GA20 rate. This study is not reported in the tables or included in the analyses.
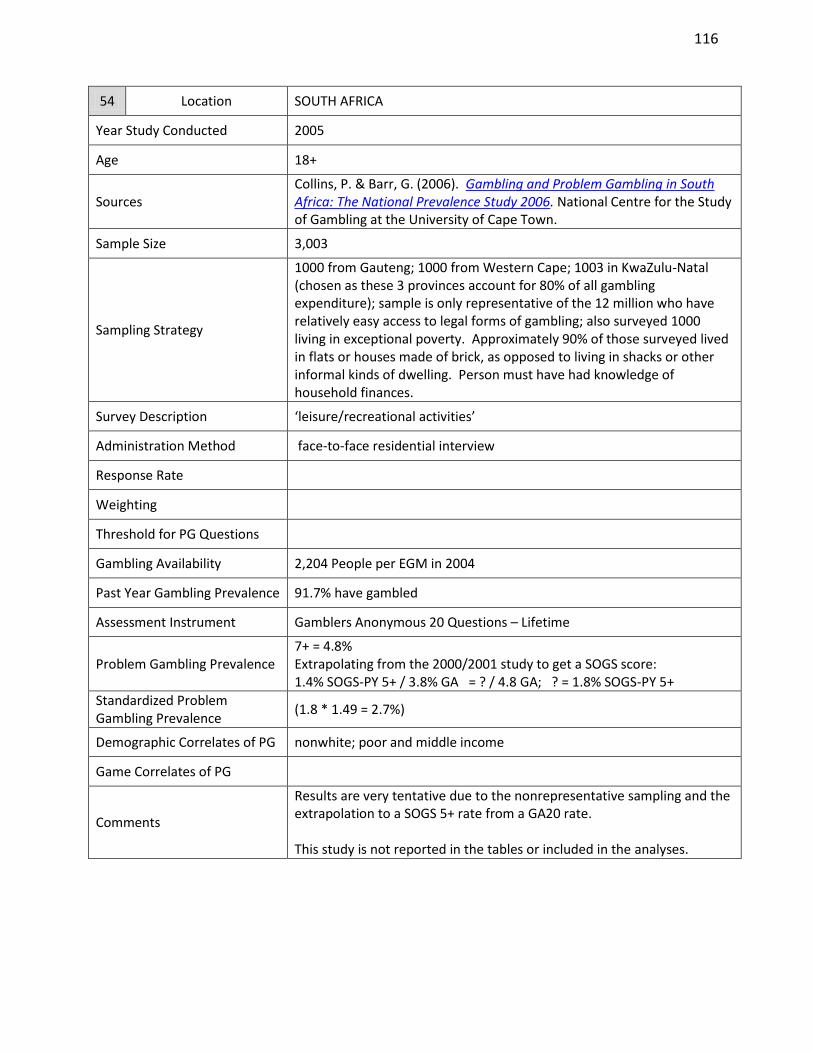
116
54 Location SOUTH AFRICA
Year Study Conducted 2005
Age 18+
Sources Collins, P. & Barr, G. (2006). Gambling and Problem Gambling in South Africa: The National Prevalence Study 2006. National Centre for the Study of Gambling at the University of Cape Town.
Sample Size 3,003
Sampling Strategy
1000 from Gauteng; 1000 from Western Cape; 1003 in KwaZulu-Natal (chosen as these 3 provinces account for 80% of all gambling expenditure); sample is only representative of the 12 million who have relatively easy access to legal forms of gambling; also surveyed 1000 living in exceptional poverty. Approximately 90% of those surveyed lived in flats or houses made of brick, as opposed to living in shacks or other informal kinds of dwelling. Person must have had knowledge of household finances.
Survey Description ‘leisure/recreational activities’
Administration Method face-to-face residential interview
Response Rate
Weighting
Threshold for PG Questions
Gambling Availability 2,204 People per EGM in 2004
Past Year Gambling Prevalence 91.7% have gambled
Assessment Instrument Gamblers Anonymous 20 Questions – Lifetime
Problem Gambling Prevalence 7+ = 4.8% Extrapolating from the 2000/2001 study to get a SOGS score: 1.4% SOGS-PY 5+ / 3.8% GA = ? / 4.8 GA; ? = 1.8% SOGS-PY 5+
Standardized Problem Gambling Prevalence
(1.8 * 1.49 = 2.7%)
Demographic Correlates of PG nonwhite; poor and middle income
Game Correlates of PG
Comments
Results are very tentative due to the nonrepresentative sampling and the extrapolation to a SOGS 5+ rate from a GA20 rate. This study is not reported in the tables or included in the analyses.

117
55 Location SOUTH AFRICA
Year Study Conducted 2008
Age 18+
Source(s)
Ross, D., Barr, G., Collins, P., Dellis, A., Hofmeyr, A., Kincaid, H., Rousseau, J., Schuhr, A., Sharp, C., Visser, M., & Vuchinich, R. (2010). Summary of Basic Data on from the National Urban Prevalence Study of Gambling Behaviour. The Research Division of the National Responsible Gambling Programme. Collins, P. & Barr, G. (2009). Gambling and Problem Gambling in South Africa: A Comparative Report. A report prepared for the South African Responsible Gambling Foundation.
Sample Size 3,000
Sampling Strategy
1,000 randomly drawn from the three main metropolises (Johannesburg-Tshwane, Cape Town and eThekweni (Durban)); sample designed to be demographically representative of the adult population of South Africa as a whole without selection for members of households with knowledge of household finances. Approximately 60% of those surveyed lived in flats or houses made of brick, as opposed to living in shacks or other informal kinds of dwelling. [This survey differs from previous S. African studies as it includes a lower proportion of relatively affluent South Africans]. “The most notable difference in the way the data was collected was that the 2005 sample was deliberately skewed towards the ‘developed or first world’ sector of the South African economy rather than towards it ‘developing or third world’ sector.”
Survey Description
Administration Method face-to-face residential interview
Response Rate
Weighting
Threshold for PG Questions any participation in gambling
Assessment Instrument Gamblers Anonymous 20 Questions; CPGI
Gambling Availability 2,075 People per EGM in 2008
Past Year Gambling Prevalence 52.1%
Problem Gambling Prevalence CPGI: 8% (3-7); 3% (8+); 11% combined
Standardized Problem Gambling Prevalence
11.0 *.58 = 6.4%
Demographic Correlates of PG younger age; depression; substance abuse
Game Correlates of PG
Ranking games based on proportions of participants at high risk for problem gambling, we obtain, from highest to lowest: Dice games for money, Card games for money, Roulette, Fafi / iChina tied with Sports betting, Horse racing and other animal events tied with Electronic gaming machines, Lucky draws, Scratch cards tied with Slot machines tied with Bingo, Lottery / Lotto; casino gambling is negatively associated with problem gambling.
Comments Survey administered by Ipsos-Mori.

118
56 Location SOUTH KOREA
Year Study Conducted 1984
Age 18 – 65
Sources
Lee, C.K., Kwak, Y.S., Yamamoto, J., Rhee, H., Kim, Y.S., Han, J.H., Choi, J.O., & Lee, Y.H. (1990a). Psychiatric epidemiology in Korea. Part I: gender and age differences in Seoul. Journal of Nervous & Mental Disease, 178, 242–246. Lee, C.K., Kwak, Y.S., Yamamoto, J., Rhee, H., Kim, Y.S., Han, J.H., Choi, J.O., & Lee, Y.H. (1990b). Psychiatric epidemiology in Korea. Part II: urban and rural differences. Journal of Nervous & Mental Disease, 178, 247–252.
Sample Size 5,176
Sampling Strategy Urban samples from Seoul and rural samples from scattered rural locations; all family members 18 – 65 interviewed if they had lived >3 months in the house
Survey Description Gambling component contained within a general survey of psychiatric disorders.
Administration Method face-to-face residential interview
Response Rate 83.5%
Weighting
Threshold for PG Questions
Gambling Availability No EGMs in South Korea in 1984.
Past Year Gambling Prevalence
Assessment Instrument DSM-III-L (DIS-III)
Problem Gambling Prevalence 1.02% (pathological gambling)
Standardized Problem Gambling Prevalence
(1.02 * 2.6 * .53 = 1.4%)
Demographic Correlates of PG age 45-65
Game Correlates of PG
Comments
Results very tentative because of the unknown weighting factor that should be applied to the DIS-III and the fact that DIS only has 4 questions, whereas the DSM-III has 8 criteria. Results are not included in the tables or the analysis.

119
57 Location SOUTH KOREA
Year Study Conducted 2006-2007
Age 18 – 64
Sources
Park, S., Cho, M.J., Jeon, H.J., Lee, H.W., Bae, J.N., Park, J.I., Sohn, J.H., Lee, Y.R., Lee, J.Y. & Hong, J.P. (2010). Prevalence, clinical correlations, comorbidities, and suicidal tendencies in pathological Korean gamblers: results from the Korean Epidemiologic Catchment Area Study. Social Psychiatry and Psychiatric Epidemiology, 45 (6), 621-629.
Sample Size 6,510, although only 5,333 fully completed the Korean DIS for pathological gambling
Sampling Strategy stratified cluster sample based on population census in 2005; random selection within household
Survey Description Gambling component contained within a general survey of psychiatric disorders.
Administration Method face-to-face residential interview
Response Rate 81.7%
Weighting age, gender, region
Threshold for PG Questions
Gambling Availability 36,878 People per EGM in 2006
Past Year Gambling Prevalence
Assessment Instrument DSM-IV-L (DIS-IV)
Problem Gambling Prevalence 3.0% (1 - 4); 0.8% (5+)
Standardized Problem Gambling Prevalence
0.8 * 2.6 * .44 = 0.9%
Demographic Correlates of PG male, age 30 – 49, divorced/separated/widowed, urban living, substance abuse, mood disorders, anxiety disorders
Game Correlates of PG poker; EGMs; horse racing
Comments

120
58 Location SOUTH KOREA
Year Study Conducted 2011
Age 19+
Sources Williams, R.J., Lee, C-K., & Back, K-J. (submitted to Social Psychiatry & Psychiatric Epidemiology). Prevalence and Nature of Gambling and Problem Gambling in South Korea.
Sample Size 4,000 telephone; 4,000 Online Panel
Sampling Strategy
Cell Phones: Random digit dialing; age x gender cell quotas that were at least 50% of census figures; 16 attempts for each number with these attempts spread over a 1 month period. Online Panel: age x gender cell quotas that are at least 50% of census figures; 3 email solicitations
Survey Description “health & recreational behaviour”
Administration Method telephone interview; self-administered online (Online Panel)
Response Rate Cell phones: 17.0% Online Panel: 20.2%
Weighting age, gender
Threshold for PG Questions Gambling at least once a month on some form
Gambling Availability 32,796 People per EGM in 2010
Past Year Gambling Prevalence 41.8%
Assessment Instrument CPGI (cell phones); CPGI, PPGM, NODS (online)
Problem Gambling Prevalence
Cell Phone: CPGI: 0.70% (3-7); 0.33% (8+); 1.0% combined Online Panel: CPGI: 7.6% (3-7); 3.8% (8+); 11.4% combined Online Panel: PPGM: 6.3% Online Panel: NODS: 3.1% (3-4); 2.6% (5+); 5.7% combined
Standardized Problem Gambling Prevalence
1.0 * .58 * 1.44 = 0.84%
Demographic Correlates of PG Gambling fallacies; mental health problems; lower income; male; under age 65; gambling motivation (to escape)
Game Correlates of PG Greater number of games; betting on horses, bicycling, or motorboat races; Internet gambling; casino gambling; social gambling; sports betting
Comments First prevalence study to exclusively use cell phones for random digit dialling.

121
Location
59a 59b 59c 59d 59e 59f
SPAIN: Catalonia
SPAIN: 7 Galicia
cities
SPAIN: Galicia
SPAIN: Andalusia
SPAIN: Andalusia
SPAIN: Galicia
Year Study Conducted 2002
Age
Sources
Cayuela (1990)
Becona (1993d)
Becona & Fuentes (1995)
Irurita (1996)
Ramirez et al. (1999)
Becoña, E. (2004). Prevalencia del juego patológi co en Galicia me diante el NODS.
¿Descenso de la prevalencia o mej or evaluación del trastorno? Adicci ones, 16(3), 173-184.
Becoña, E. (1996). Prevalence surveys of problem and pathological gambling in Europe: The cases of Germany, Holland, and Spain. Journal of Gambling Studies, 12, 179-192. doi:http://dx.doi.org/10.1007/BF01539173 Becona, E. (2009). Spain. In G. Meyer, T. Hayer, & M. Griffiths (Eds.), Problem Gambling in Europe: Challenges, Prevention, and Interventions (pp. 137-151). New York: Springer. doi: 10.1007/978-0-387-09486-1
Sample Size 1,230 1,615 1,028 4,977 3,000 1,624
Sampling Strategy
Survey Description
Administration Method face-to-face residential
face-to-face residential
face-to-face residential
face-to-face residential
face-to-face residential
face-to-face residential
Response Rate
Weighting
Gambling Availability 228,877 EGMs in 1999.
Past Year Gambling Prevalence
Threshold for PG Questions
Assessment Instrument SOGS-L DSM-III-R-
PY SOGS-L DSM-IV-L SOGS-L
DSM-IV-PY & L (NODS)
Problem Gambling Prevalence 1.7% (2-3) 1.4% (3-4) 1.7% (2-3) 1.6% (3-4) 0.9% L (3-4) 0.3% PY (5+)
Pathological Gambling Prevalence
1.6% (4+) 2.0% (5+) 3.3% (4+) 1.4% (5+) 0.2% L (3-4) 0.3% PY (5+)
Combined Problem Gambling Prevalence
2.5% (3+) 3.3% (2+) 3.4% (3+) 5.0% (2+) 3.0% (3+) 1.1% L (3-4) 0.5% PY (5+)
Standardized Problem Gambling Prevalence
2.5 *1.19 *.53 *.74 =
1.2%
3.4 * 1.19 * .53 * .74
= 1.6%
3.0 * 1.19 * .53 * .74
= 1.4%
.5 * 2.6 *.74 = 1.0%
Demographic Correlates of PG
males; low income; 18-30; lower education; alcohol abuse
males; 16-24; lower education
males
males; 31-44; married; alcohol abuse
Game Correlates of PG EGMs
Comments In 2005 spending per capita in Spain was 642 Euros, one of the highest in the European Union. This study not included in the tables or analyses.

122
60 Location SWEDEN
Year Study Conducted 1997-1998
Age 15 to 74
Sources
Rönnberg, S., Volberg, R.A., Abbott, M.W., Moore, W.L., Andre´n, A., Munck, I., Jonsson, J., Nilsson, T., & Svensson, O. (1999). Gambling and Problem Gambling in Sweden. Report Number Two of the National Institute of Public Health Series on Gambling. Stockholm: National Institute of Public Health.
Volberg, R.A., Abbott, M.W., Ronnberg, S., & Munck, I.M. (2001). Prevalence and risks of pathological gambling in Sweden. Acta Psychiatrica Scandinavica 104(4), 250-256.
Abbott, M. W., Volberg, R. A., & Rönnberg, S. (2004). Comparing the New Zealand and Swedish national surveys of gambling and problem gambling. Journal of Gambling Studies, 20(3), 237-258. doi: 10.1023/B:JOGS.0000040278.08853.c0
Sample Size 7,139
Sampling Strategy stratified by age, gender, and education; oversampling of age 15-17 (n = 1000) and immigrants (n = 500)
Survey Description “I am calling from Statistics Sweden for a large study of people's gambling habits and the addiction to gambling in Sweden.”
Administration Method 89% phone; 11% mail (ones who could not be contacted by phone)
Response Rate 71.9%
Weighting yes
Threshold for PG Questions
Gambling Availability 8,000 EGMs in 1999. Estimated population in 1999 was 8,911,296. 1114 people per EGM.
Past Year Gambling Prevalence 89% (95% Lifetime); Note: Reported as 88% in 2008-09 study results.
Assessment Instrument SOGS & DSM-IV-PY (DSM-IV-MR)
Problem Gambling Prevalence SOGS-PY: 1.4% (3-4); 0.6% (5+); 2.0% combined SOGS-L: 2.7% (3-4); 1.2% (5+); 3.9% combined DSM-IV-PY: 0.6% (3+); 0.3% (5+); 0.9% combined
Standardized Problem Gambling Prevalence
SOGS-PY: 2.0 * .72 * 1.44 * .76 = 1.6% DSM-IV-PY: 0.9 * 1.19 * 1.44 * .76 = 1.2% Average = 1.4%
Demographic Correlates of PG
males; 15-24; gambling at an early age; immigrants; more likely receive social welfare; socially unstable childhood; adopted; gambling fallacies; dissociative states; negative life experiences; depression; alcohol abuse; personality disorders; substance use
Game Correlates of PG casinos; EGMs
Comments

123
61 Location SWEDEN
Year Study Conducted 2008-2009
Age 16-84
Sources
Swedish National Institute of Public Health (2009, November 24). SWELOGS – a Population Study on Gambling and Health 2008/09: A Presentation of Key Findings from the First Data Collection. Breakfast seminar World Trade Center, Stockholm. Swedish National Institute of Public Health. (2011). Spel om pengar och spelproblem i Sverige 2008/2009, SWELOGS, Swedish Longitudinal Gambling Study. Report No. 3.
Sample Size 15,000
Sampling Strategy
Survey Description “a study about gambling and health”
Administration Method telephone interview + mail (for individuals uncontactable by phone)
Response Rate 63%
Weighting Yes
Gambling Availability 1,017 People per EGM in 2002
Past Year Gambling Prevalence 70%
Threshold for PG Questions
Assessment Instrument SOGS-PY & SOGS-L; CPGI
Problem Gambling Prevalence SOGS-L: 2.4% (3-4); 1.8% (5+); 4.2% combined SOGS-PY: 1.2% (3-4); 0.8% (5+); 2.0% combined CPGI: 1.9% (3-7); 0.3% (8+); 2.2% combined
Standardized Problem Gambling Prevalence
SOGS-PY: 2.0 * .72 * 1.44 * .76 = 1.6% CPGI: 2.2 * .58 * 1.44 * .76 = 1.4% Average: 1.5%
Demographic Correlates of PG males; 16-24; poorer mental health
Game Correlates of PG Internet gambling; bingo, EGMs, poker, casino games; gambling on multiple forms
Comments

124
62 Location SWITZERLAND
Year Study Conducted 1998
Age 18+
Sources
Bondolfi, G., Osiek, C., & Ferrero, F. (2000). Prevalence estimates of pathological gambling in Switzerland. Acta Psychiatrica Scandinavica, 101(6), 473–475. doi: http://dx.doi.org/10.1034/j.1600-0447.2000.101006473.x Bondolfi & Ferrero (1999). Cited in Hafeli, J. (2009). Switzerland. In G. Meyer, T. Hayer, & M. Griffiths (Eds.), Problem Gambling in Europe: Challenges, Prevention, and Interventions (pp. 317-326). New York: Springer. doi: 10.1007/978-0-387-09486-1
Sample Size 2,526
Sampling Strategy stratified for age, gender, region, occupation
Survey Description
Administration Method telephone interview
Response Rate 59%
Weighting Yes
Threshold for PG Questions
Gambling Availability 8,595 EGMs in 1999. Population in 1999 was 7,164,434. 834 people per EGM.
Past Year Gambling Prevalence
Assessment Instrument SOGS-PY
Problem Gambling Prevalence 2.2% (3-4); 0.8% (5+); 3.0% combined
Standardized Problem Gambling Prevalence
3.0 * .72 * 1.44 * .76 = 2.4%
Demographic Correlates of PG alcohol abuse; males, singles, people under age 29; people who began gambling in adolescence
Game Correlates of PG proximity to gambling, especially EGMs outside casinos
Comments

125
63 Location SWITZERLAND
Year Study Conducted 2005
Age 18+
Source(s)
Bondolfi, G., Jermann, F., Ferrero, F., Zullino, D., & Osiek, C.H. (2008). Prevalence of pathological gambling in Switzerland after the opening of casinos and the introduction of new preventive legislation. Acta Psychiatrica Scandinavica, 117(3), 236-239. doi: http://dx.doi.org/10.1111/j.1600-0447.2007.01149.x
Sample Size 2,803
Sampling Strategy Random digit dialing. Up to 30 attempts made to contact each number. Quotas for sex, age and occupational status.
Survey Description
Administration Method telephone interview
Response Rate 47%
Weighting Yes
Threshold for PG Questions
Assessment Instrument SOGS-PY & SOGS-L
Gambling Availability 659 people per EGM in 2004
Past Year Gambling Prevalence
Problem Gambling Prevalence SOGS-PY: 0.8% (3-4); 0.5% (5+); combined = 1.3% SOGS-L: 2.2% (3-4); 1.1% (5+); combined = 3.3%
Standardized Problem Gambling Prevalence
1.3 * .72 * 1.44 * .76 = 1.0%
Demographic Correlates of PG No significant differences found between non-gamblers/non-problem gamblers and problem/pathological gamblers.
Game Correlates of PG
Comments Replication of 1998 survey; method used was identical to the previous survey.

126
64 Location SWITZERLAND
Year Study Conducted 2006-2007
Age 14+
Sources
Brodbeck, J., Durrenberger, S., & Znoj, H. (2007). Grundlagenstudie Spielsucht: Prävalenzen, Nutzung der Glücksspielangebote und deten Einfluss auf die Diagnose des Pathologischen Spielsen [Baseline study: Prevalences and consumption of games of change and their influence on the diagnosis of pathological gambling]. Bern: University of Bern. Hafeli, J. (2009). Switzerland. In G. Meyer, T. Hayer, & M. Griffiths (Eds.), Problem Gambling in Europe: Challenges, Prevention, and Interventions (pp. 317-326). New York: Springer. doi: 10.1007/978-0-387-09486-1 (citing Brodbeck et al., 2007).
Sample Size 4,497
Sampling Strategy
Random sampling of listed landline phone numbers (excluding the 3% with unlisted; and the 12-15% of households only with a cell phone) with subsample sizes stratified to regional size; random selection within household.
Survey Description
Administration Method telephone interview
Response Rate 40.4% participation rate
Weighting Yes
Threshold for PG Questions Spending at least CHF 500 per month ($634 USD) on gambling at some point in their lives + an attempt to control their gambling behaviour at some point in their lives.
Gambling Availability 2,191 People per EGM in 2006
Past Year Gambling Prevalence (34.4% participated in at least one game of chance during the month prior to the survey)
Assessment Instrument DSM-IV-L (NODS)
Problem Gambling Prevalence 0.6% (3-4); 0.3% (5+); 0.9% combined
Standardized Problem Gambling Prevalence
(0.9 * 1.19 * .44 * 1.44 * .53 = 0.4%)
Demographic Correlates of PG Males
Game Correlates of PG EGMs
Comments
These figures are unreliable due to the overly stringent criteria required to be administered the problem gambling instrument: a) using a monetary loss as a threshold (especially a very high one) excludes many problem gamblers who deny losses (but will acknowledge the frequency of their gambling); b) requiring an admission of an attempt to control gambling excludes problem gamblers who have not yet attempted this. This study is not included in the tables or the analyses.

127
65 Location UNITED STATES
Year Study Conducted 1975
Age 18+
Source(s)
U.S. Commission on the Review of the National Policy Toward Gambling. (1976). Gambling in America: Final Report. Washington, DC: Author. Kallick, M., Suits, D., Dielman, T., & Hybels, J. (1979). A Survey of American Gambling Attitudes and Behavior. Ann Arbor, MI: Institute for Social Research, The University of Michigan. National Opinion Research Center. (1999). Gambling Impact and Behavior Study. Chicago: Author.
Sample Size 1,736 (reported as 1,749 in NORC report)
Sampling Strategy
Three-stage sample design; First, a set of primary sampling units (counties, large cities, and boroughs) were selected at random to represent all of the household dwellings in the country. Approximately 3,250 households were then selected randomly within these primary sampling units (including an oversample of households in 12 of the largest U.S. cities). Random selection of individual within households, with a two-to-one oversample of males. This initial household contact was the “screening” stage, completed in approximately 2,680 households, or 82.5% of those sampled. Survey carried out by the Institute for Social Research, University of Michigan.
Survey Description
Administration Method face-to-face residential interviews
Response Rate 75.5%
Weighting gender (adjusting for oversampling), geography, household type, income, race, education, and occupation
Threshold for PG Questions
Assessment Instrument
“Clinical analysis” based on a) the similarity of the respondent answered 18 questions relative to how 274 known compulsive gamblers answered the same questions; b) observations recorded by the interviewer at the end of each interview; c) betting patterns reported by the respondent.
Gambling Availability Most casino style gambling expansion occurred after 1989 (after 1988 IGRA).
Past Year Gambling Prevalence 61% (Lifetime = 68%)
Problem Gambling Prevalence As a result of this clinical examination, it was estimated that 0.77% of the national sample could be classified as "probable" compulsive gamblers, with another 2.33% as "potential" compulsive gamblers.
Standardized Problem Gambling Prevalence
Demographic Correlates of PG Males
Game Correlates of PG
Comments
The 1975 survey included a supplementary adult survey of 296 persons in three counties in the State of Nevada. This study not included in the tables or analyses.
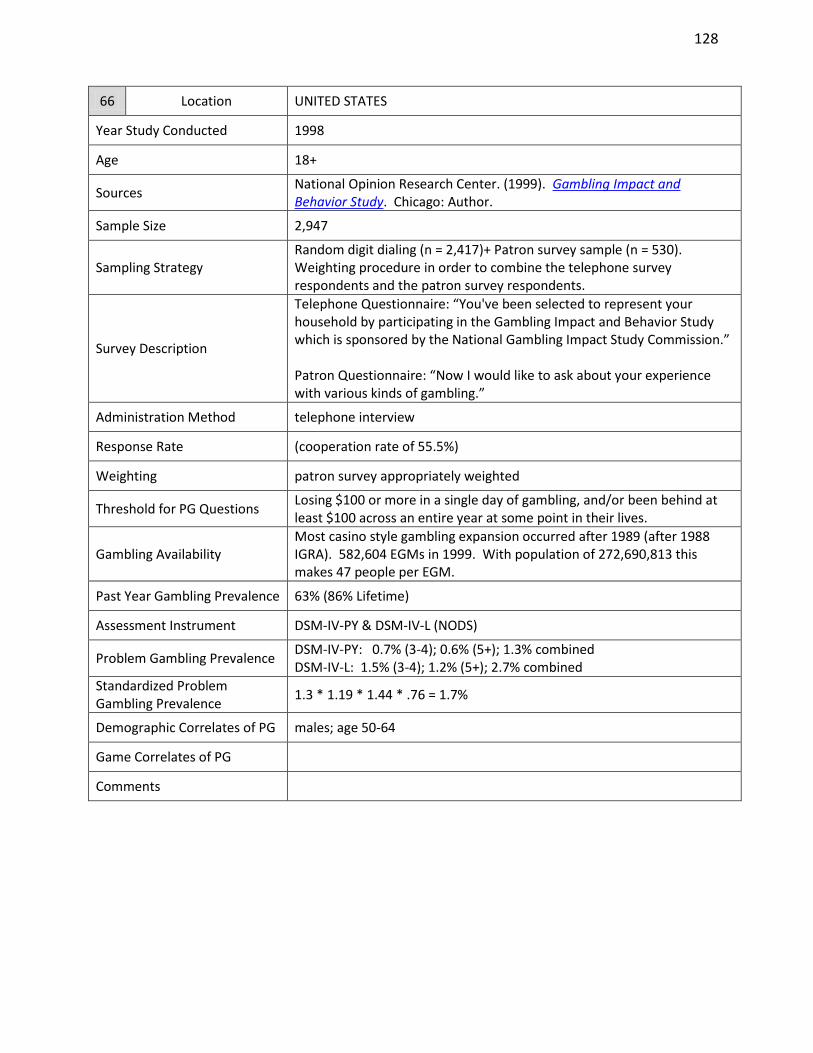
128
66 Location UNITED STATES
Year Study Conducted 1998
Age 18+
Sources National Opinion Research Center. (1999). Gambling Impact and Behavior Study. Chicago: Author.
Sample Size 2,947
Sampling Strategy Random digit dialing (n = 2,417)+ Patron survey sample (n = 530). Weighting procedure in order to combine the telephone survey respondents and the patron survey respondents.
Survey Description
Telephone Questionnaire: “You've been selected to represent your household by participating in the Gambling Impact and Behavior Study which is sponsored by the National Gambling Impact Study Commission.” Patron Questionnaire: “Now I would like to ask about your experience with various kinds of gambling.”
Administration Method telephone interview
Response Rate (cooperation rate of 55.5%)
Weighting patron survey appropriately weighted
Threshold for PG Questions Losing $100 or more in a single day of gambling, and/or been behind at least $100 across an entire year at some point in their lives.
Gambling Availability Most casino style gambling expansion occurred after 1989 (after 1988 IGRA). 582,604 EGMs in 1999. With population of 272,690,813 this makes 47 people per EGM.
Past Year Gambling Prevalence 63% (86% Lifetime)
Assessment Instrument DSM-IV-PY & DSM-IV-L (NODS)
Problem Gambling Prevalence DSM-IV-PY: 0.7% (3-4); 0.6% (5+); 1.3% combined DSM-IV-L: 1.5% (3-4); 1.2% (5+); 2.7% combined
Standardized Problem Gambling Prevalence
1.3 * 1.19 * 1.44 * .76 = 1.7%
Demographic Correlates of PG males; age 50-64
Game Correlates of PG
Comments

129
67 Location UNITED STATES
Year Study Conducted 1999-2000
Age 18+
Sources
Welte, J. W., Barnes, G. M., Wieczorek, W.F., Tidwell, M. C., & Parker, J. (2002). Gambling participation in the U.S. - results from a national survey. Journal of Gambling Studies, 18(4), 313-337. doi: 10.1023/A:1021019915591
Sample Size 2,630
Sampling Strategy Random digit dialing with random selection of individual within the household; geographically stratified
Survey Description
Administration Method telephone interview
Response Rate 65.4%
Weighting household size, gender, age, race
Threshold for PG Questions
Gambling Availability Most casino style gambling expansion occurred after 1989 (after 1988 IGRA). 582,604 EGMs in 1999. With population of 272,690,813 this makes 468 people per EGM.
Past Year Gambling Prevalence 82%
Assessment Instrument DSM-IV-PY (DIS-IV-PY)
Problem Gambling Prevalence 2.1% (3-4); 1.4% (5+); 3.5% combined
Standardized Problem Gambling Prevalence
3.5 * 1.19 * 1.44 * .76 = 4.6%
Demographic Correlates of PG males; Blacks, Hispanics and Asians; lower socioeconomic status
Game Correlates of PG
Comments

130
68 Location UNITED STATES
Year Study Conducted 2001-2003
Age 18+
Sources
Kessler, R.C., Hwang, I., LaBrie, R., Petukhova, M., Sampson, N.A., Winters, K.C., et al. (2008). DSM-IV pathological gambling in the National Comorbidity Survey Replication. Psychological Medicine, 38(9), 1351-1360. doi: 10.1017/S0033291708002900
Sample Size 3,435 (PG was assessed in a probability subsample of 3435 of the 9282 respondents)
Sampling Strategy $50 for participation
Survey Description Problem gambling part of a much larger survey on mental health conditions.
Administration Method face-to-face residential interview
Response Rate 70.9%
Weighting Yes
Gambling Availability 426 People per EGM in 2002
Past Year Gambling Prevalence (Lifetime =78.4%)
Threshold for PG Questions
Person reports gambling 100 or more on some type of gambling PLUS person endorses at least one of four questions about problem gambling (i.e., interference with responsibilities at work, school or home; repeated arguments or serious problems with family, friends, neighbors, or coworkers; hiding gambling from friends or family; claim to be winning when actually losing).
Assessment Instrument DSM-IV-L (CIDI-Lifetime)
Problem Gambling Prevalence 2.3% (1-4); 0.6% (5+); 2.9% combined
Standardized Problem Gambling Prevalence
(2.9 * 1.19 * .44 = 1.5%)
Demographic Correlates of PG young; male; black; gambling earlier
Game Correlates of PG larger number of gambling formats; card games; sports betting with bookie; EGMs; betting on horse racing or cock/dog fights
Comments
Past year rates of problem gambling (5+) were “estimated” to be 0.3%, but the mechanism for estimating these past year rates was not specified. The standardized rate is very tentative because of the overly stringent criteria used before administering the problem gambling assessment instrument. This study is not included in the tables or the analyses.

131
Appendix B: Australian State/Territorial Adult Prevalence Studies of Problem Gambling
1 Location AUSTRALIAN CAPITAL TERRITORY
Year Study Conducted 2001
Age 18+
Source(s) McMillen, J., Tremayne, K., & Masterman-Smith, H. (2001). Survey of the Nature and Extent of Gambling and Problem Gambling in the ACT, 2001. Sydney: Australian Institute for Gambling Research.
Sample Size 5,445
Sampling Strategy Random selection of listed telephone numbers; random selection within household; oversampling of regular gamblers; stratified by area, age and gender.
Survey Description "conducting important social research for the ACT Government about people’s attitudes to gambling"
Administration Method telephone interview
Response Rate 41.7%
Weighting Yes
Threshold for PG Questions participated at least once a week in one or all forms of gambling activity other than lottery games or instant scratch tickets
Assessment Instrument SOGS-PY; HARM (Elements of Harmful Gambling; Australian Productivity Commission, 1999)
Gambling Availability 106,176 EGMs in NSW&ACT in 2002. Combined population of 6,846,630 in 2001. 64 people per EGM.
Past Year Gambling Prevalence 72.9%
Problem Gambling Prevalence SOGS-PY: 1.91% (5+) HARM: 1.2%
Standardized Problem Gambling Prevalence
1.91 * 1.49 * 1.44 * .53 = 2.2%
Demographic Correlates of PG males; under 25 years of age; lower levels of education and income; English speaking backgrounds; single
Game Correlates of PG EGMs; racing; casino table games
Comments Survey was to replicate the National Gambling Survey commissioned by the Productivity Commission for its inquiry into Australia's Gambling Industries.

132
2 Location AUSTRALIAN CAPITAL TERRITORY
Year Study Conducted 2009
Age 18+
Source(s) Davidson, T. & Rodgers, B. (2010). 2009 Survey of the Nature and Extent of Gambling, and Problem Gambling, in the Australian Capital Territory. Report for the ACT Gambling and Racing Commission, Canberra.
Sample Size 5,500 (2,089 subsample)
Sampling Strategy
Random digit dialing; selection of youngest person in household; after briefly assessing gambling participation 2,089 people who represented the full spectrum of gambling participation were given more detailed interview
Survey Description "The ACT Gambling and Racing Commission has asked us to conduct research on gambling, health and wellbeing."
Administration Method telephone interview
Response Rate
Weighting age, gender, marital status
Threshold for PG Questions Gambled at least 12 or more times in the last 12 months (on activities other than lottery or scratch tickets), or who reported spending $2,000 or more (on any activity).
Assessment Instrument CPGI
Gambling Availability 97,259 EGMs in NSW & ACT in 2008. Estimated 347,843 people in ACT in 2008 and 6,980,000 in NSW. 75 People per EGM.
Past Year Gambling Prevalence 70%
Problem Gambling Prevalence 1.5% (3-7); 0.5% (8+); 2.0% combined
Standardized Problem Gambling Prevalence
2.0 * .58 * 1.44 * .76 = 1.3%
Demographic Correlates of PG male, young, Australian born, less-well educated, never married, either unemployed or employed full time.
Game Correlates of PG casino type games on the Internet; casino table games; private card games for money; betting on sports or other events; keno; EGMs; horse race or dog race betting
Comments

133
3 Location NEW SOUTH WALES
Year Study Conducted 1995
Age 18+
Source(s)
Dickerson, M., Allcock, C., Blaszczynski, A., Nicholls, B., Williams, J., & Maddern, R. (1996). Study 2 - An Examination of the Socio-economic Effects of Gambling on Individuals, Families and the Community, including Research into the Costs of Problem Gambling in NSW. Report for the Australian Institute for Gambling Research, University of Western Sydney, Macarthur.
Sample Size 1,390
Sampling Strategy stratified by sex and age
Survey Description
Administration Method face-to-face residential interview
Response Rate (Refusal rate for city sample = 47.5%; Refusal rate for the country sample = 25.9%)
Weighting
Threshold for PG Questions weekly participation in gambling
Assessment Instrument SOGS-L
Gambling Availability
Past Year Gambling Prevalence
Problem Gambling Prevalence 2.58% (5+)
Standardized Problem Gambling Prevalence
2.58 * 1.49 * .60 *.76 = 1.8%
Demographic Correlates of PG males; metropolitan areas; younger age groups; non-English speaking
Game Correlates of PG horse racing; EGMs
Comments Page 89 of 1997 prevalence study report contains table with SOGS values for both 1997 and 1995 studies (differs from figures in 2010 Productivity Commission table).
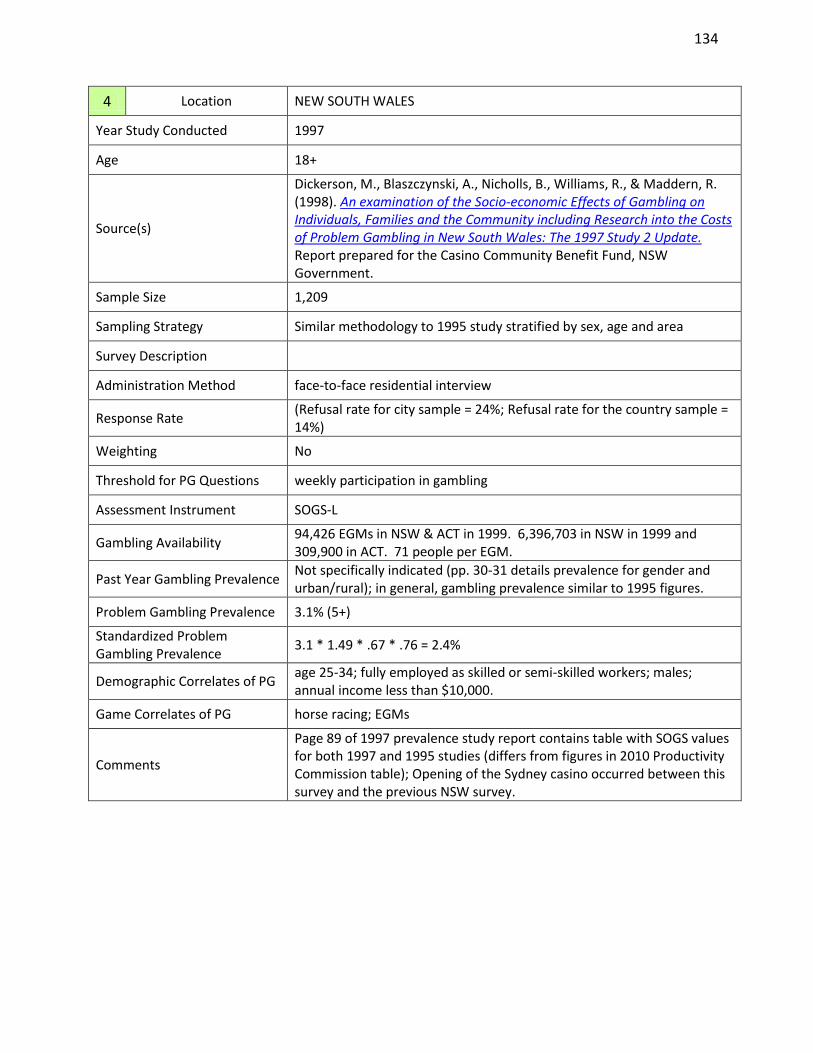
134
4 Location NEW SOUTH WALES
Year Study Conducted 1997
Age 18+
Source(s)
Dickerson, M., Blaszczynski, A., Nicholls, B., Williams, R., & Maddern, R. (1998). An examination of the Socio-economic Effects of Gambling on Individuals, Families and the Community including Research into the Costs of Problem Gambling in New South Wales: The 1997 Study 2 Update. Report prepared for the Casino Community Benefit Fund, NSW Government.
Sample Size 1,209
Sampling Strategy Similar methodology to 1995 study stratified by sex, age and area
Survey Description
Administration Method face-to-face residential interview
Response Rate (Refusal rate for city sample = 24%; Refusal rate for the country sample = 14%)
Weighting No
Threshold for PG Questions weekly participation in gambling
Assessment Instrument SOGS-L
Gambling Availability 94,426 EGMs in NSW & ACT in 1999. 6,396,703 in NSW in 1999 and 309,900 in ACT. 71 people per EGM.
Past Year Gambling Prevalence Not specifically indicated (pp. 30-31 details prevalence for gender and urban/rural); in general, gambling prevalence similar to 1995 figures.
Problem Gambling Prevalence 3.1% (5+)
Standardized Problem Gambling Prevalence
3.1 * 1.49 * .67 * .76 = 2.4%
Demographic Correlates of PG age 25-34; fully employed as skilled or semi-skilled workers; males; annual income less than $10,000.
Game Correlates of PG horse racing; EGMs
Comments
Page 89 of 1997 prevalence study report contains table with SOGS values for both 1997 and 1995 studies (differs from figures in 2010 Productivity Commission table); Opening of the Sydney casino occurred between this survey and the previous NSW survey.

135
5 Location NEW SOUTH WALES
Year Study Conducted 2006
Age 18+
Source(s) Brockelsby, A., Kenrick, M., & A.C. Nielsen. (2007). Prevalence of Gambling and Problem Gambling in NSW – A Community Survey 2006. Sydney: NSW Office of Liquor, Gaming and Racing.
Sample Size 5,026 (sub-sample = 2,010)
Sampling Strategy
Random digit dialing; random selection of household member; a selected sample approach was utilised where all respondents were screened and classified as regular gambler, non-regular gambler or a non-gambler and selectively interviewed depending on their gambling status: 1 in 2 non-gamblers were interviewed; 1 in 4 non-regular gamblers were interviewed; all regular gamblers were interviewed.
Survey Description “people’s gambling activities"
Administration Method telephone interview
Response Rate 15%
Weighting age, sex, area and household size
Threshold for PG Questions Participation of at least once a week in gambling (other than lottery games or instant scratch tickets)
Assessment Instrument CPGI
Gambling Availability 100,308 EGMs in 2006. Population of 6,820,000. 68 people per EGM.
Past Year Gambling Prevalence 69%
Problem Gambling Prevalence 1.6% (3-7); 0.8% (8+); 2.4% combined
Standardized Problem Gambling Prevalence
2.4 * .58 * 1.44 * .53 = 1.1%
Demographic Correlates of PG young adult males (aged 18-24 years); never been married; full time work; lower levels of education.
Game Correlates of PG EGMs; horse/dog races; linked jackpot gaming machines; higher denomination machines
Comments

136
6 Location NEW SOUTH WALES
Year Study Conducted 2008-2009
Age 18+
Source(s) NSW Health. (2010). Gambling Module: NSW Population Health Survey 2008-2009, February 2010.
Sample Size 9,408 (sub-sample = 3,014)
Sampling Strategy Prenotification letter sent describing aims and methods of survey; random digit dialing; up to 7 calls attempts to contact household, and up to 5 calls to contact a selected respondent.
Survey Description Part of a general questionnaire on health
Administration Method telephone interview
Response Rate 63.4%
Weighting gender, age
Threshold for PG Questions gambled in the past 12 months
Assessment Instrument CPGI
Gambling Availability 97,259 EGMs in 2008. 2008 population of 6,890,000. 71 people per EGM.
Past Year Gambling Prevalence 69%
Problem Gambling Prevalence 1.3% (3-7); 0.4% (8+); 1.7% combined
Standardized Problem Gambling Prevalence
1.7 * .58 * 1.44 = 1.4%
Demographic Correlates of PG
Game Correlates of PG
Comments
Two reports are provided. One contains data for respondents aged 16 years and over (16+). The other report contains data for respondents aged 18 years and over (18+). The 18+ report is the same as the 16+ report except with the data for 16 and 17 year olds removed.

137
7 Location NORTHERN TERRITORY
Year Study Conducted 2005
Age 18+
Source(s) Young, M., Abu-Duhou, I., Barnes, T., Creed, E., Morris, M., Stevens, M., & Tyler, B. (2006). Northern Territory Gambling Prevalence Survey 2005. School for Social and Policy Research, Charles Darwin University.
Sample Size 5,264 (sub-sample = 1,873)
Sampling Strategy
"Two-stage population survey that involved selecting certain individuals for a full interview based on their gambling participation. Participants were categorised based on their responses to an initial screening questionnaire that assessed the type and frequency of their gambling behaviour; sample stratified by gender, age, and geographic area; sample selected randomly from the electronic White Pages; random selection within household; loose quotas for age and sex and strict quotas for area."
Survey Description “the study is on gambling”
Administration Method telephone interview
Response Rate 37%
Weighting yes
Threshold for PG Questions gambled at least once a week on activities other than lottery games or instant scratch tickets
Assessment Instrument CPGI; SOGS-PY
Gambling Availability 1,678 EGMs in 2004. 2004 population of 199,900. 119 people per EGM.
Past Year Gambling Prevalence 73% (if raffles are included this figure rises to 85%)
Problem Gambling Prevalence CPGI: 0.64% (8+) SOGS-PY: 1.06% (5+)
Standardized Problem Gambling Prevalence
CPGI: .64 * 2.17 * 1.44 * .53 = 1.1% SOGS-PY: 1.06 * 1.49 * 1.44 * .53 = 1.2% Average = 1.1%
Demographic Correlates of PG non-English speaking background; households with an income of less than $20,000 pa.; Indigenous population; less education; males; urban
Game Correlates of PG EGMs
Comments Significant underrepresentation of indigenous people (who comprise 30% of the population) due to the fact than only a minority of indigenous people in the NT have a home phone.

138
8 Location QUEENSLAND
Year Study Conducted 2001
Age 18+
Source(s) Gambling Policy Directorate and Office of the Government Statistician. (2002). Queensland Household Gambling Survey 2001. Brisbane: Queensland Treasury.
Sample Size 13,082
Sampling Strategy Random digit dialing; prenotification letters sent; random selection within household; oversampling to obtain more high risk and problem gamblers.
Survey Description "Your household may have recently received a letter from this Office explaining about an important social survey we are conducting."
Administration Method telephone interview
Response Rate 72.3%
Weighting
Household size, age, sex. Weights also applied to the subset of respondents who answered all, or nearly all, those questions relevant to them (i.e. who did the long version of the interview), weights for this subset were factored up by the inverse of the fraction doing the long version then adjusted so as to sum to the benchmark data again.
Threshold for PG Questions Gambling other than sweepstakes in previous 12 months.
Assessment Instrument CPGI
Gambling Availability 36,192 EGMs in 2002. 2001 population of 3,670,500. 101 people per EGM.
Past Year Gambling Prevalence 85%
Problem Gambling Prevalence 2.7% (3-7); 0.83% (8+); 3.53% combined
Standardized Problem Gambling Prevalence
3.53 *.58 *1.44 = 2.9%
Demographic Correlates of PG males; 18-34; single
Game Correlates of PG
Comments

139
9 Location QUEENSLAND
Year Study Conducted 2003-2004
Age 18+
Source(s) Gambling Policy Directorate and Office of the Government Statistician. (2006). Queensland Gambling Household Survey, 2003-04. Brisbane: Queensland Treasury.
Sample Size 30,000
Sampling Strategy Random digit dialing with random selection within household; geographically stratified to ensure that approximately 1000 respondents were recruited in each of 30 identified regions of the State
Survey Description "We are currently conducting an important social survey throughout Queensland."
Administration Method telephone interview
Response Rate 59.2%
Weighting age, sex, education, geography
Threshold for PG Questions Gambling other than sweepstakes in previous 12 months.
Assessment Instrument CPGI
Gambling Availability 41,548 EGMs in 2004. 2004 population of 3,882,037. 93 people per EGM.
Past Year Gambling Prevalence 80%
Problem Gambling Prevalence 2.0% (3-7); 0.55% (8+); 2.55% combined
Standardized Problem Gambling Prevalence
2.55 *.58 * 1.44 = 2.1%
Demographic Correlates of PG less education; age 18-24
Game Correlates of PG EGMs
Comments

140
10 Location QUEENSLAND
Year Study Conducted 2006-2007
Age 18+
Source(s) Gambling Policy Directorate and Office of the Government Statistician. (2008). Queensland Gambling Household Survey, 2006–07. Brisbane: Queensland Treasury.
Sample Size 30,000
Sampling Strategy Random digit dialing with random selection within household; geographically stratified to ensure that approximately 1000 respondents were recruited in each of 30 identified regions of the State.
Survey Description "We are currently conducting an important social survey throughout Queensland."
Administration Method telephone interview
Response Rate 49.6%
Weighting yes
Threshold for PG Questions Gambling in past 12 months other than sweepstakes
Assessment Instrument CPGI
Gambling Availability 40,312 EGMs in 2006. 2006 population of 4,090,000. 101 people per EGM.
Past Year Gambling Prevalence 75%
Problem Gambling Prevalence 1.8% (3-7); 0.47% (8+); 2.27% combined
Standardized Problem Gambling Prevalence
2.27 *.58 * 1.44 = 1.9%
Demographic Correlates of PG age 35 to 54 years; less likely to be married or in a relationship; smokers
Game Correlates of PG EGMs; horse/dog racing; keno; casino table games; bingo
Comments

141
11 Location QUEENSLAND
Year Study Conducted 2008-2009
Age 18+
Source(s) State of Queensland, Department of Employment, Economic Development and Innovation. (2010). Queensland Household Gambling Survey 2008-09. Brisbane, Australia: Author.
Sample Size 15,000
Sampling Strategy Random digit dialing with random selection within household; geographically stratified to ensure appropriate representation from each of the 11 identified regions of the State.
Survey Description "We are conducting important research for the Queensland Government about social activities and attitudes."
Administration Method telephone interview
Response Rate 39.2%
Weighting Age, sex, income, education
Threshold for PG Questions
All low risk, moderate risk and problem gamblers completed the full questionnaire. Random samples of non-gamblers and recreational gamblers completed a shortened form of the questionnaire (pp. 87-89 provides details).
Assessment Instrument CPGI
Gambling Availability 41,671 EGMs in 2008. 2008 population of 4,313,500. 104 people per EGM.
Past Year Gambling Prevalence 75%
Problem Gambling Prevalence 1.6% (3-7); 0.37% ( 8+); 1.97% combined
Standardized Problem Gambling Prevalence
1.97 * .58 * 1.44 = 1.6%
Demographic Correlates of PG Smokers
Game Correlates of PG
Comments

142
12 Location SOUTH AUSTRALIA
Year Study Conducted 1996
Age 18+
Source(s)
Delfabbro, P, & Winefield, D. (1996). Community Gambling Patterns and the Prevalence of Gambling-Related Problems in South Australia. Report commissioned by the Department for Family and Community Services. University of Adelaide, South Australia.
Sample Size 1,206
Sampling Strategy
Survey Description
Administration Method telephone interview
Response Rate
Weighting
Threshold for PG Questions
Assessment Instrument SOGS
Gambling Availability 12,794 EGMs in 1999
Past Year Gambling Prevalence
Problem Gambling Prevalence 1.2% (5+)
Standardized Problem Gambling Prevalence
Demographic Correlates of PG
Game Correlates of PG EGMs
Comments This report is not available and is not included in the tables or analyses.

143
13 Location SOUTH AUSTRALIA
Year Study Conducted 2001
Age 18+
Source(s)
Taylor, A., Dal Grande, E., Gill, T., Delfabbro, P., Glenn, V., Goulding, S., Weston, H., Barton, S., Rogers, N., Stanley, A., Blandy, R., Tolchard, B., Kingston, R. (2001). Gambling Patterns of South Australians and Associated Health Indicators – May 2001. Adelaide: Department of Human Services. Delfabbro, P.H. (2005). Population Gambling Trends in South Australia 2001-2004. September 2005. Report prepared for the Department for Families and Communities.
Sample Size 6,045
Sampling Strategy Random selection of telephone listings; random selection within household; prenotification letter; at least 6 call-backs
Survey Description "We are conducting an important survey about the health and well being of South Australians."
Administration Method telephone interview
Response Rate 73.1%
Weighting age, sex, household size
Threshold for PG Questions gambled regularly at least once a fortnight on all types of gambling excluding Lotto and bingo
Assessment Instrument SOGS-PY
Gambling Availability 15,499 EGMs in 2002. 2001 population of 1,519,000. 98 people per EGM.
Past Year Gambling Prevalence 76%
Problem Gambling Prevalence
2.0% (5+) Problem gamblers were identified if they were “frequent” gamblers (derived in the previous chapter) and if they scored 5 or more on the SOGS scale (Section 5.1.1), or if they rated their gambling problem 5 to 10 on a scale of 1 to 10 (Section 5.1.2). Overall, most of the problem gamblers were classified using the SOGS scoring method with only a small number (n=10) self-diagnosing themselves as problem gamblers.
Standardized Problem Gambling Prevalence
2.0 * 1.49 *1.44 = 4.3%
Demographic Correlates of PG age 25 - 34; never been married; employed part time or be unemployed; live in a rented dwelling
Game Correlates of PG Poker; EGMs
Comments

144
14 Location SOUTH AUSTRALIA
Year Study Conducted 2005
Age 16+
Source(s) South Australian Department for Families and Communities. (2006). Gambling Prevalence in South Australia: October to December 2005. Adelaide: Author.
Sample Size 17,140 (ages 18+)
Sampling Strategy
Telephone numbers were randomly selected from the Adelaide metropolitan and country regions EWP telephone listings. Within each household, the person who had their birthday most recently; A letter introducing the survey was sent to the household of each selected telephone number; At least 10 call back attempts were made.
Survey Description
"We are conducting an important health, lifestyle and social survey about South Australians." [Telephone]; "I am writing to ask you to take part in an important health, lifestyle and social survey being conducted by the South Australian Department of Health." [Letter].
Administration Method telephone interview
Response Rate 64.5%
Weighting age, sex, geography, household size
Threshold for PG Questions Frequent gamblers’ - defined as those over 18 who had gambled at least fortnightly in the previous twelve months, on any type of gambling excluding lottery and bingo.
Assessment Instrument CPGI (For adults 18+); DSM-IV-Juvenile-PY (For ages 16-17)
Gambling Availability 15,688 EGMs in 2004. 2005 population of 1,542,000. 98 people per EGM.
Past Year Gambling Prevalence 70%
Problem Gambling Prevalence CPGI: 1.2% (3-7); 0.4% (8+); 1.6% combined = 1.6%
Standardized Problem Gambling Prevalence
1.6 * .58 * 1.44 = 1.3%
Demographic Correlates of PG male; no children in the household; secondary school education only
Game Correlates of PG EGMs
Comments The DSM-IV-Juvenile-PY found that 1% of 16 and 17 year olds were classified as problem gamblers.

145
15 Location TASMANIA
Year Study Conducted 1994
Age 18+
Source(s) Dickerson, M., Walker, M. & Baron, E. (1994). A Baseline Study on the Extent and Impact of Gambling in Tasmania. Australian Institute of Gambling Research, Sydney.
Sample Size 1,220
Sampling Strategy Quotas set on area, age and sex to ensure representativeness of the sample.
Survey Description
Administration Method face-to-face residential interview
Response Rate (Refusal rate = 23%)
Weighting
Threshold for PG Questions Gambling weekly or more
Assessment Instrument SOGS-PY (a past year time frame is presumed based on information from subsequent studies)
Gambling Availability
Past Year Gambling Prevalence 72%
Problem Gambling Prevalence 1.14% (5+) (as reported in Dickerson & Maddern, 1997) 0.90% (5+) (as reported in Roy Morgan Research, 2001, 2006)
Standardized Problem Gambling Prevalence
.90 *1.49 =1.3%
Demographic Correlates of PG
Game Correlates of PG
Comments Unable to locate original report.
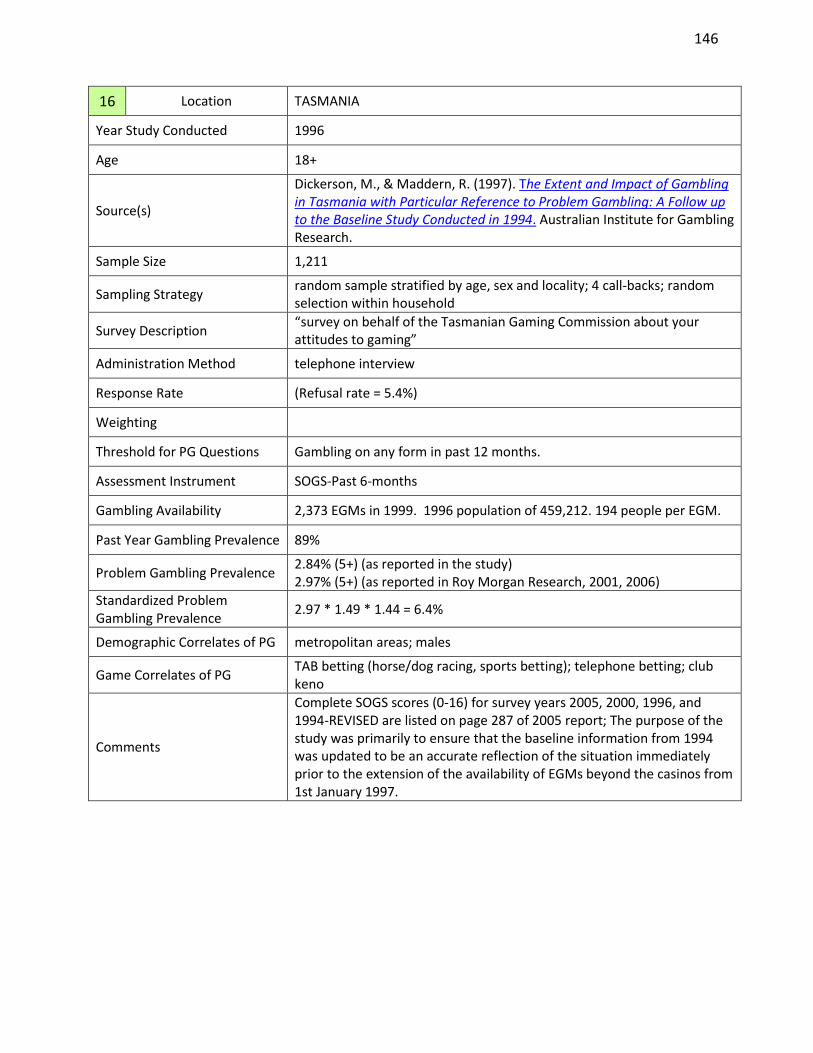
146
16 Location TASMANIA
Year Study Conducted 1996
Age 18+
Source(s)
Dickerson, M., & Maddern, R. (1997). The Extent and Impact of Gambling in Tasmania with Particular Reference to Problem Gambling: A Follow up to the Baseline Study Conducted in 1994. Australian Institute for Gambling Research.
Sample Size 1,211
Sampling Strategy random sample stratified by age, sex and locality; 4 call-backs; random selection within household
Survey Description “survey on behalf of the Tasmanian Gaming Commission about your attitudes to gaming”
Administration Method telephone interview
Response Rate (Refusal rate = 5.4%)
Weighting
Threshold for PG Questions Gambling on any form in past 12 months.
Assessment Instrument SOGS-Past 6-months
Gambling Availability 2,373 EGMs in 1999. 1996 population of 459,212. 194 people per EGM.
Past Year Gambling Prevalence 89%
Problem Gambling Prevalence 2.84% (5+) (as reported in the study) 2.97% (5+) (as reported in Roy Morgan Research, 2001, 2006)
Standardized Problem Gambling Prevalence
2.97 * 1.49 * 1.44 = 6.4%
Demographic Correlates of PG metropolitan areas; males
Game Correlates of PG TAB betting (horse/dog racing, sports betting); telephone betting; club keno
Comments
Complete SOGS scores (0-16) for survey years 2005, 2000, 1996, and 1994-REVISED are listed on page 287 of 2005 report; The purpose of the study was primarily to ensure that the baseline information from 1994 was updated to be an accurate reflection of the situation immediately prior to the extension of the availability of EGMs beyond the casinos from 1st January 1997.

147
17 Location TASMANIA
Year Study Conducted 2000
Age 18+
Source(s) Roy Morgan Research. (2001). The Third Study into the Extent and Impact of Gambling in Tasmania with Particular Reference to Problem Gambling. Prepared for Department of Health and Human Services.
Sample Size 1,223
Sampling Strategy Random sample of listed numbers; quotas were set on age, gender and locality to ensure a representative sample.
Survey Description "Today, we are conducting a survey on behalf of the Department of Health and Human Services of Tasmania about your attitudes to gambling"
Administration Method telephone interview
Response Rate
Weighting yes
Threshold for PG Questions Gambling on any form in past 12 months.
Assessment Instrument SOGS-PY
Gambling Availability 2,373 EGMs in 1999. 2000 population of 470,376. 198 people per EGM.
Past Year Gambling Prevalence 82%
Problem Gambling Prevalence 0.90% (5+)
Standardized Problem Gambling Prevalence
0.9 *1.49 * 1.44 * .76 = 1.5%
Demographic Correlates of PG males; age 35-49; skilled workers; income earners <$50,000.
Game Correlates of PG EGMs; betting on horses or greyhounds at the track
Comments

148
18 Location TASMANIA
Year Study Conducted 2005
Age 18+
Source(s)
Roy Morgan Research. (2006). The Fourth Study into the Extent and Impact of Gambling in Tasmania with Particular Reference to Problem Gambling. Roy Morgan Research Pty Ltd for Department of Health and Human Services.
Sample Size 6,048 (sub-sample = 2,003 completed full interview)
Sampling Strategy
Random sampling from listed numbers; random selection within household; all respondents went through initial screening and were classified as regular, non-regular or non-gambler; all regular gamblers subsequently interviewed, one in four non-regular gamblers, one in two non-gamblers.
Survey Description "Today we are conducting a survey for the Department of Health and Human Services on gambling in Tasmania"
Administration Method telephone interview
Response Rate
Weighting age, sex, geography, household size
Threshold for PG Questions
For CPGI, questions were only administered to 'Regular Gamblers' (participated weekly or equivalent of weekly over the course of 52 weeks in a single gambling activity other than lottery games or instant scratch tickets); For SOGS, questions were asked of both 'Regular Gamblers' and 'Non-Regular Gamblers' (less than weekly gambling participation excluding lottery games or instant scratch tickets).
Assessment Instrument CPGI; SOGS-PY
Gambling Availability 3,233 EGMs in 2004. 2005 population of 485,300. 150 people per EGM.
Past Year Gambling Prevalence 85%
Problem Gambling Prevalence CPGI: 1.02% (3-7); 0.73% (8+); 1.75% combined SOGS-PY: 1.41% (5+)
Standardized Problem Gambling Prevalence
CPGI: 1.75 * .58 * 1.44 *.76 = 1.1% SOGS-PY: 1.41 * 1.49 * 1.44 *.76 = 2.3% Average = 1.7%
Demographic Correlates of PG males; ages 18-24; part-time workers
Game Correlates of PG EGMs; sports betting; betting on races by phone.
Comments

149
19 Location TASMANIA
Year Study Conducted 2007
Age 18+
Source(s) South Australian Centre for Economic Studies. (2008). Social and Economic Impact Study into Gambling in Australia. Adelaide: Author.
Sample Size 4,051
Sampling Strategy Random selection of listed numbers; quotas were set for the 4 major Statistical Districts of Tasmania and for the 18-24 year old age-group; up to 6 call backs for each household
Survey Description “ gambling in Tasmania"
Administration Method telephone interview
Response Rate 40% (Completion rate)
Weighting Household size, age, gender
Threshold for PG Questions Gambling at least once per week (or 52 times or more per year) on activities other than lotteries, scratch tickets or bingo.
Assessment Instrument CPGI
Gambling Availability 3,680 EGMs in 2006. 2007 population of 495,772. 135 people per EGM.
Past Year Gambling Prevalence 71.7%
Problem Gambling Prevalence 0.86% (3-7); 0.54% (8+); 1.40% combined
Standardized Problem Gambling Prevalence
1.4 *.58 * 1.44 * .53 = 0.6%
Demographic Correlates of PG males, aged 18-29 years, living in the Greater Hobart area
Game Correlates of PG Keno, scratch tickets, EGMs. Less likely to gamble on casino table games.
Comments

150
20 Location VICTORIA
Year Study Conducted 1996
Age 18+
Source(s)
Maddern, C., Horman, S. & Dickerson, M. (1997). Fifth Community Gambling Patterns Survey combined with Second Positive And Negative Perceptions Of Gambling Survey. Melbourne, Australia: Victorian Casino and Gaming Authority.
Sample Size 2,000
Sampling Strategy Random selection of listed numbers; 40 sampling quotas representing unique geo-demographic segments of the Victorian population; multilingual interviewers; random selection within household.
Survey Description "We’re conducting an important research study on behalf of a Victorian Government Authority about what people do in their spare time."
Administration Method telephone interview
Response Rate
Weighting age, sex, region
Threshold for PG Questions gambling in past 6 months
Assessment Instrument SOGS-PY
Gambling Availability 29,789 EGMs in 1999. 1996 population of 4,373,520. 147 people per EGM.
Past Year Gambling Prevalence 87%
Problem Gambling Prevalence “just under 1%” (5+)
Standardized Problem Gambling Prevalence
1.0 * 1.49 * 1.44 = 2.1%
Demographic Correlates of PG males; younger age (average age of 31); student; unemployed
Game Correlates of PG EGMs
Comments
The abstract version, available online, provides details from an earlier 4th survey (i.e., not actually the 5th survey). (http://www.vcgr.vic.gov.au/CA256F800017E8D4/research/3B95D40F907A3710CA25777E000DC497?Open) .

151
21 Location VICTORIA
Year Study Conducted 1998
Age 18+
Source(s) Roy Morgan Research. (1999). Sixth Survey of Community Gambling Patterns & Perceptions: Project Report. Prepared for Victorian Casino and Gaming Authority.
Sample Size 1,737
Sampling Strategy Random selection of listed numbers; 32 sampling quotas to represent unique geo-demographic segments of the Victorian population; random selection within household; multilingual interviewers.
Survey Description "Today we’re conducting an important research study on behalf of a Victorian Government Authority about what people do in their spare time."
Administration Method telephone interview
Response Rate
Weighting age, sex, region
Threshold for PG Questions gambling in past 6 months
Assessment Instrument SOGS-PY
Gambling Availability 29,789 EGMs in 1999. 1998 population of 4,683,800. 157 people per EGM.
Past Year Gambling Prevalence 76%
Problem Gambling Prevalence 1.5% (5+)
Standardized Problem Gambling Prevalence
1.5 *1.49 * 1.44 * .76 = 2.4%
Demographic Correlates of PG males; younger than average age profile (average age of 38 years); higher proportion of skilled workers
Game Correlates of PG casino gambling; EGMs
Comments

152
22 Location VICTORIA
Year Study Conducted 1999
Age 18+?
Source(s) KPMG Consulting. (2000). Report of the 1999 Longitudinal Community Impact Study: Survey of Community Attitudes, September 2000. Report to Victorian Casino and Gaming Authority.
Sample Size 1,000 (Dandenong, Geelong, Maribyrnong, Mildura, Moreland and Wellington)
Sampling Strategy Sample for the survey was drawn so as to coincide with local government areas for each of the 6 study regions; From each of the 6 local government areas (LGAs) 167 responses were collected.
Survey Description
Administration Method telephone interview
Response Rate
Weighting
Threshold for PG Questions Gambling in past 6 months.
Assessment Instrument SOGS-PY
Gambling Availability 29,789 EGMs in 1999. 1999 population of 4,707,600. 158 people per EGM.
Past Year Gambling Prevalence 51% (gambled in 6-months prior to survey)
Problem Gambling Prevalence 2.0% (5+)
Standardized Problem Gambling Prevalence
2.0 *1.49 * 1.59 * .74 = 3.5%
Demographic Correlates of PG
Game Correlates of PG
Comments

153
23 Location VICTORIA
Year Study Conducted 1999
Age 18+
Source(s) Roy Morgan Research. (2000). Seventh Community Survey of Community Gambling Patterns and Perceptions. Prepared for Victorian Casino and Gaming Authority.
Sample Size 1,760
Sampling Strategy Sample randomly generated from electronic white pages; multilingual interviewers; sampling quotas to represent geo-demographic segments; last birthday method.
Survey Description "Today we're conducting an important research study on behalf of a Victorian Government Authority about what people do in their spare time."
Administration Method telephone interview
Response Rate
Weighting age, sex, county/metropolitan area
Threshold for PG Questions gambling in past 6 months
Assessment Instrument SOGS-PY
Gambling Availability 29,789 EGMs in 1999. 1999 population of 4,707,600. 158 people per EGM.
Past Year Gambling Prevalence 81%
Problem Gambling Prevalence 0.8% (5+)
Standardized Problem Gambling Prevalence
0.8 * 1.49 * 1.44 = 1.7% Averaged with KPGM 1999 study = 2.6%
Demographic Correlates of PG males; younger age profile; full-time workers; plant/machine operators/drivers
Game Correlates of PG Not indicated but "Acknowledged Heavy Gamblers" tend to gamble on EGMs and casinos.
Comments

154
24 Location VICTORIA
Year Study Conducted 2003
Age 18+
Source(s) McMillen, J., Marshall, D., Ahmed, E., & Wenzel, M. (2004). 2003 Victorian Longitudinal Community Attitudes Survey. Australia: The Centre for Gambling Research, Australian National University
Sample Size 8,479
Sampling Strategy Random selection of listed numbers; random selection within household; stratified sampling of gambler groups
Survey Description “attitudes to gambling”
Administration Method telephone interview
Response Rate 34.2%
Weighting age, gender and metro/non-metropolitan variables
Threshold for PG Questions Weekly participation in some form of gambling other than raffles and sweeps in the past 12 months.
Assessment Instrument CPGI; SOGS-PY; Victorian Gambling Screen (VGS)
Gambling Availability 27,400 EGMs in 2002. 2003 population of 4,911,400. 179 people per EGM.
Past Year Gambling Prevalence 77%
Problem Gambling Prevalence CPGI: 0.91% (3-7); 0.97% (8+); 1.88% combined SOGS-PY: 1.12% (5+) VGS: 0.74% (21+)
Standardized Problem Gambling Prevalence
CPGI: 1.88 * .58 * 1.44 * .53 = 0.83% SOGS-PY: 1.12 * 1.49 * 1.44 *.53 = 1.3% Average = 1.0%
Demographic Correlates of PG
males; aged 50–64 and 35–49; low levels of education (below tertiary level); derive main income from social security payments (other than pension); live with others; live in metropolitan areas; family history of gambling; consume alcohol and drugs; depression
Game Correlates of PG EGMs
Comments Each screen was administered to a separate cohort of regular gamblers and the responses and prevalence rates compared.

155
25 Location VICTORIA
Year Study Conducted 2007
Age 18+
Source(s)
Thomas, S. A., & Jackson, A. C. (2008). Risk and Protective Factors, Depression and Comorbidities in Problem Gambling: A Report to beyondblue. Melbourne: Problem Gambling Research and Treatment Centre.
Sample Size 2,012
Sampling Strategy
Random digit dialing; quota method to achieve a high level of representativeness for age, sex and urban rural location dimensions in the Victorian community; requirement that 300 of the participants had to be problem gamblers
Survey Description "gambling risk and protective factors"
Administration Method telephone interview
Response Rate
Weighting
Threshold for PG Questions
Assessment Instrument CPGI
Gambling Availability 27,124 EGMs in 2006. 2007 population of 5,200,000. 192 people per EGM.
Past Year Gambling Prevalence
Problem Gambling Prevalence 2.8% (3-7); 1.4% (8+); 4.2% combined
Standardized Problem Gambling Prevalence
4.2 * .58 * 1.44 * .76 = 2.7%
Demographic Correlates of PG males; smoking
Game Correlates of PG
Comments Prevalence estimates from Table 5.2 in 2010 Australian Productivity Commission report. Study more related to problem gambling co-morbidity than prevalence.

156
26 Location VICTORIA
Year Study Conducted 2008
Age 18+
Source(s) Hare, S. (2009). A Study of Gambling in Victoria: Problem Gambling from a Public Health Perspective. Melbourne, Australia: State of Victoria, Department of Justice.
Sample Size 15,000
Sampling Strategy
Random digit dialing; random selection within household; multilingual interviews; sample stratified across the 8 Victorian Government regions; concentration of study sampling within high Electronic Gaming Machine (EGM) expenditure Local Government Areas (LGA) across Victorian Government regions; stratified sampling of gambler types
Survey Description "The Victorian Government is conducting a study on an important health and well-being issue to Victorian communities."
Administration Method telephone interview
Response Rate 43.5%
Weighting age, gender, region, household size, # land phone lines
Threshold for PG Questions past year gambling
Assessment Instrument CPGI; NODS-CLiP 2 (brief screen for DSM-IV-L)
Gambling Availability 27,279 EGMs in 2008. 2008 population of 5,310,000 people. 195 people per EGM.
Past Year Gambling Prevalence 73%
Problem Gambling Prevalence CPGI: 2.36% (3-7); 0.70% (8+); 3.06% combined DSM-NODS-CLiP2: Lifetime pathological = 1.13%; NODS-CLiP2 Lifetime problem = 1.18%
Standardized Problem Gambling Prevalence
3.06 * .58 * 1.44 = 2.6%
Demographic Correlates of PG males; Indigenous; sales workers, machinery operators/drivers and labourers
Game Correlates of PG EGMs; table games; lotto products; betting on horse or harness racing or greyhounds
Comments

157
27 Location WESTERN AUSTRALIA
Year Study Conducted 1994
Age 18+
Source(s) Dickerson, M.G., Baron, E., & O’Conner, J. (1994). An Assessment of the Extent and Degree of Gambling Related Problems in Western Australia. Report to the Department of Racing and Gaming, Western Australia.
Sample Size 1,253
Sampling Strategy Random household selection stratified for sex and age; 2-part interview; Part 1 = Leisure and gambling activities; Part 2 = In depth survey of regular gamblers.
Survey Description
Administration Method face-to-face residential interview
Response Rate (Refusal rate = 39%)
Weighting No
Threshold for PG Questions gambling at least 4 or more times in past month
Assessment Instrument SOGS-Past 6 months
Gambling Availability 1500 EGMs introduced in 1994. 1994 population of 1,465,500. 977 people per EGM.
Past Year Gambling Prevalence 65%
Problem Gambling Prevalence 0.48% (3-4); .56% (5+); 1.04% combined
Standardized Problem Gambling Prevalence
1.04% *.72 *.76 = 0.6%
Demographic Correlates of PG single; males; under 30 years of age
Game Correlates of PG continuous forms of gambling
Comments

158
Appendix C: Canadian Provincial Adult Prevalence Studies of Problem Gambling
1 Location ALBERTA
Year Study Conducted 1993
Age 18+
Source(s) Wynne, H., Smith, G., & Volberg, R. A. (1994). Gambling and Problem Gambling in Alberta: Final Report. Edmonton, AB: Report prepared for Alberta Lotteries and Gaming.
Sample Size 1,803 (additional 30 face-to-face interviews)
Sampling Strategy
Random digit dialing; random selection within household; stratified sampling by region: 24% (n=437) of the interviews in Edmonton area; 30% (n=534) in Calgary area; 33% (n=589) in Northern Alberta communities; and 14% (n=243) in Southern Alberta communities.
Survey Description "a study of the gambling practices of the citizens of Alberta"
Administration Method Telephone interview; face-to-face residential interviews with a selected subsample of telephone respondents.
Response Rate 50%
Weighting No, but the sample is said to mirror the AB population by region.
Threshold for PG Questions Lifetime participation in a gambling activity.
Assessment Instrument SOGS-PY & SOGS-L
Gambling Availability
Lotteries introduced in 1973; casinos with table games in 1980 expanding to 19 casinos by 2007; expanded availability of bingo up to mid 1990s; 1986 introduction of instant win scratch tickets; 1990 introduction of sports betting; 1992 introduction of video lottery terminals in bars; 1996 introduction of slot machines to casinos. 1,767 EGMs in 1993. 1993 population of 2,574,890. 1457 people per EGM.
Past Year Gambling Prevalence
90.3% -- "Current gambling participation" (p. 28) indicates the following: 7% "non-gamblers"; 3% "infrequent gamblers" (i.e., hadn't gambled in past year); 50% "past-year gamblers"; 40% "weekly gamblers". Past year participation also available by gambling format.
Problem Gambling Prevalence SOGS-PY: 4.0% (3-4); 1.4% (5+); 5.4% combined SOGS-L: 5.9% (3-4); 2.7% (5+); 8.6% combined
Standardized Problem Gambling Prevalence
5.4 * .72 * 1.59 * .74 = 4.6%
Demographic Correlates of PG under the age of 30; non-Caucasian; significantly less likely to be married; less education; income below $25,000
Game Correlates of PG bingo, games of skill, horse races, VLTs, cards/dice at out-of-province casinos, and local casinos - nearly all of which are continuous forms of play.
Comments

159
2 Location ALBERTA
Year Study Conducted 1997
Age 18+
Source(s) Wynne Resources Ltd. (1998). Adult Gambling and Problem Gambling in Alberta, 1998. Edmonton: Report to the Alberta Alcohol and Drug Abuse Commission.
Sample Size 1,821
Sampling Strategy Random digit dialing; random selection within household; 24% of respondents were from Edmonton, 28% were from Calgary, 33% were from northern Alberta, and 15% were from southern Alberta.
Survey Description "gambling activities and attitudes of Albertans"
Administration Method telephone interview
Response Rate 67%
Weighting
Threshold for PG Questions Lifetime participation in a gambling activity.
Assessment Instrument SOGS-PY & SOGS-L
Gambling Availability
Lotteries introduced in 1973; casinos with table games in 1980 expanding to 19 casinos by 2007; expanded availability of bingo up to mid 1990s; 1986 introduction of instant win scratch tickets; 1990 introduction of sports betting; 1992 introduction of video lottery terminals in bars; 1996 introduction of slot machines to casinos. 6,631 EGMs in 1997. 1997 population of 2,791,000. 491 people per EGM.
Past Year Gambling Prevalence 87.4%
Problem Gambling Prevalence SOGS-PY: 2.8% (3-4); 2.0% (5+); 4.8% combined SOGS-L: 5.2% (3-4); 2.7% (5+); 7.9% combined
Standardized Problem Gambling Prevalence
4.8 * .72 * 1.59 * .74 = 4.1%
Demographic Correlates of PG male; single, divorced or separated; under 30 years of age; Aboriginal; annual household income under $20,000; live with at least one other person under age 18; Catholic; unemployed; lower education.
Game Correlates of PG EGMs, casino games, bingo, pull-tab tickets, instant-win/scratch tickets
Comments

160
3 Location ALBERTA
Year Study Conducted 2001
Age 18+
Source(s) Smith, G. J., & Wynne, H. J. (2002). Measuring Gambling and Problem gambling in Alberta using the Canadian Problem Gambling Index. Edmonton: Prepared for the Alberta Gaming Research Institute.
Sample Size 1,804
Sampling Strategy Random digit dialing procedure; random selection within household; stratified sampling by region and gender
Survey Description "gambling activities and attitudes of Albertans"
Administration Method telephone interview
Response Rate 63.6%
Weighting
Threshold for PG Questions Gambled in the past 12 months.
Assessment Instrument CPGI
Gambling Availability
Lotteries introduced in 1973; casinos with table games in 1980 expanding to 19 casinos by 2007; expanded availability of bingo up to mid 1990s; 1986 introduction of instant win scratch tickets; 1990 introduction of sports betting; 1992 introduction of video lottery terminals in bars; 1996 introduction of slot machines to casinos. 10,317 EGMs in 2001. 2001 population of 2,941,150. 285 people per EGM.
Past Year Gambling Prevalence 82%
Problem Gambling Prevalence 3.9% (3-7); 1.3% (8+); 5.2% combined
Standardized Problem Gambling Prevalence
5.2 * .58 * 1.59 * .74 = 3.5%
Demographic Correlates of PG northern Alberta residents; males; age group (19-24); living common-law; being single; lowest income category (less than $20,000); Aboriginal ancestry; unemployed
Game Correlates of PG EGMs; bingo; casino games
Comments

161
4 Location ALBERTA
Year Study Conducted 2008
Age 18+
Source(s)
Williams, R.J., Belanger, Y.D., & Arthur, J.N. (2011). Gambling in Alberta: History, Current Status, and Socioeconomic Impacts. Final Report to the Alberta Gaming Research Institute. Edmonton, Alberta. April 2, 2011. Appendix A: 2008 and 2009 Alberta Population Surveys.
Sample Size 3,001 (telephone) 2,019 (Online Panel sample)
Sampling Strategy
[Telephone] = Random digit dialing; minimum quota of 40% males; random selection within household; 16 attempts to contact the person. [Online] = individuals were recruited via email solicitation by the online research division of Consumer Contact (ResearchByNet) to the Alberta online panelists who were members of their Canadian online panel (NetPanel). Because of insufficient numbers, the NetPanel was supplemented with Alberta online panellists from other survey companies (21% supplementation).
Survey Description "gambling in Alberta"
Administration Method telephone interview; self-administered online (Online Panel)
Response Rate 25.5% (telephone sample)
Weighting age, gender, household size
Threshold for PG Questions spending more than $10 per month on gambling in a typical month
Assessment Instrument CPGI; PPGM
Gambling Availability 649.5 EGMs per 100,000 People 18+ in 2008/2009; 0.8 Casinos per 100,000 People 18+ in 2008/2009. 17,845 EGMs in 2008. 2008 population of 3,512,368. 197 people per EGM.
Past Year Gambling Prevalence 72.2% (does not include raffles)
Problem Gambling Prevalence
Telephone CPGI: 3.8% (3+) Telephone PPGM: 2.1% Online Panel CPGI: 9.8% (3+) Online Panel PPGM: 4.6%
Standardized Problem Gambling Prevalence
2.1 * 1.44 * .53 = 1.6%
Demographic Correlates of PG Gambling to escape or to win money; males; mental health problem; less education; lower income; Aboriginal or Asian; tobacco user; casino proximity; presence of other addictions
Game Correlates of PG EGMs, table games, Internet gambling, high risk stocks, instant win tickets
Comments

162
5 Location ALBERTA
Year Study Conducted 2009
Age 18+
Source(s)
Williams, R.J., Belanger, Y.D., & Arthur, J.N. (2011). Gambling in Alberta: History, Current Status, and Socioeconomic Impacts. Final Report to the Alberta Gaming Research Institute. Edmonton, Alberta. April 2, 2011. Appendix A: 2008 and 2009 Alberta Population Surveys.
Sample Size 1,004 (general population telephone sample); 1,006 (Online Panel)
Sampling Strategy Sampling strategy similar to Year 2008. Sample sizes different; change in email solicitation wording used for online panel recruitment.
Survey Description "We have a short study about gambling in Alberta"; For online sample, "We have a short survey about recreational activities in Alberta"
Administration Method telephone interview; self-administered online (Online Panel)
Response Rate 33.1% (General Population telephone sample)
Weighting age, gender, household size
Threshold for PG Questions Gambling at least once a month on any form of gambling in past 12 months.
Assessment Instrument CPGI; PPGM
Gambling Availability 650.3 EGMs per 100,000 People 18+ in 2009/2010; 0.8 Casinos per 100,000 People 18+ in 2009/2010. 18,644 EGMs in 2009. 2009 population of 3,653,840. 196 people per EGM.
Past Year Gambling Prevalence 73.5% (does not include raffles)
Problem Gambling Prevalence
Telephone CPGI: 4.9% (3+) Telephone PPGM: 3.1% Online Panel CPGI: 10.4% (3+) Online Panel PPGM: 5.6%
Standardized Problem Gambling Prevalence
3.1 * 1.44 * .53 = 2.4%
Demographic Correlates of PG
Game Correlates of PG
Comments

163
6 Location BRITISH COLUMBIA
Year Study Conducted 1993
Age 18+
Source(s) Gemini Research & Angus Reid Group. (1994). Social Gaming and Problem Gambling in British Columbia. Report to the British Columbia Lottery Corporation. Roaring Spring, PA: Gemini Research.
Sample Size 1,200
Sampling Strategy Random digit dialing; random selection within household; sample mirrors the geographic, gender and age distribution of the population.
Survey Description "how people in British Columbia spend their leisure time"
Administration Method telephone interview
Response Rate
25% (200 individuals who refused to complete the interview were recontacted and were administered a shortened version of the questionnaire; these additional interviews determined there was no substantial demographic or gambling differences between those who refused to participate and those who did participate).
Weighting
Threshold for PG Questions None
Assessment Instrument SOGS-PY & SOGS-L
Gambling Availability First permanent casino (table games only) in 1986, increasing to 3 in 1987, 5 in 1988, 6 in 1994. EGMs (slot machines) not introduced until 1997.
Past Year Gambling Prevalence 94%
Problem Gambling Prevalence SOGS-PY: 2.6% (3-4); 1.2% (5+); 3.8% combined SOGS-L: 6.0% (3-4); 1.8% (5+); 7.8% combined
Standardized Problem Gambling Prevalence
3.8 * .72 * 2.18 = 6.0%
Demographic Correlates of PG Males of non-European ancestry with lower levels of education and household income.
Game Correlates of PG casinos; bingo; horse track betting
Comments

164
7 Location BRITISH COLUMBIA
Year Study Conducted 1996
Age 18+
Source(s) Angus Reid Group. (1996). Problem Gambling Survey 1996: Final Report. Submitted to the British Columbia Lottery Corporation. Vancouver, BC: Author.
Sample Size 810
Sampling Strategy Random digit dialing; random selection within household; sample mirrors the geographic, gender and age distribution of the population.
Survey Description "some of the ways people might spend their leisure time"
Administration Method telephone interview
Response Rate (assuming it is similar to 1993)
Weighting
Threshold for PG Questions None
Assessment Instrument SOGS-PY & SOGS-L
Gambling Availability 8 casinos with table games only, in 1997. 185 slot machines introduced to casinos in 1997.
Past Year Gambling Prevalence Past year participation only available by gambling format. "Comparisons of 1993 and 1996 measurements of past year participation suggest that gambling participation is stable or declining in most categories."
Problem Gambling Prevalence SOGS-PY: 2.7% (3-4); 1.1% (5+); 3.8% combined SOGS-L: 8.4% (3-4); 2.1% (5+); 10.5% combined
Standardized Problem Gambling Prevalence
3.8 * .72 * 2.18 = 6.0%
Demographic Correlates of PG Males of non-European ancestry with lower levels of education and household income.
Game Correlates of PG local casino
Comments

165
8 Location BRITISH COLUMBIA
Year Study Conducted 2002
Age 18+
Source(s) Ipsos-Reid & Gemini Research. (2003). British Columbia Problem Gambling Prevalence Study. Victoria, BC: Ministry of Public Safety and Solicitor General.
Sample Size 2,500
Sampling Strategy
Random digit dialing; random selection within household; Quotas were established to ensure that the final sample accurately reflected the breakdown of males (49%) and females (51%) in British Columbia; The sample frame consisted of five geographic regions.
Survey Description "gambling activities and attitudes toward gambling"
Administration Method telephone interview
Response Rate 27%
Weighting age, gender, region
Threshold for PG Questions past year gamblers
Assessment Instrument CPGI; SOGS-PY
Gambling Availability 9 casinos in 2002. 3,304 EGMs in 2002. 2001 population of 3,907,738. 1183 people per EGM.
Past Year Gambling Prevalence 85%
Problem Gambling Prevalence CPGI: 4.2% (3-7); 0.4% (8+); 4.6% combined SOGS-PY: 2.8% (3-4); 1.1% (5+); 3.8% combined
Standardized Problem Gambling Prevalence
CPGI: 4.6 * .58 * 1.44 * .53 = 2.0% SOGS-PY: 3.8 * .72 * 1.44 * .53 = 2.1% Average = 2.1%
Demographic Correlates of PG Northern residents; young residents (18-24 years); lower household income residents (<$30K).
Game Correlates of PG sports lotteries; bingo; horse racing; casinos; Internet gamblers (small sample size); electronic gaming machines outside casinos (small sample size)
Comments

166
9 Location BRITISH COLUMBIA
Year Study Conducted 2007
Age 18+
Source(s) Ipsos-Reid & Gemini Research. (2008). British Columbia Problem Gambling Prevalence Study. Victoria, BC: Ministry of Public Safety and Solicitor General.
Sample Size 3,000
Sampling Strategy
Random digit dialing; random selection within household; stratified by region (the 5 regional health authorities), and gender within each region; in addition, minimum quotas were set for younger respondents (18 to 34 years) (knowing they are harder to contact and less likely to participate).
Survey Description "gambling activities and attitudes toward gambling"
Administration Method telephone interview
Response Rate 28%
Weighting age, gender, region
Threshold for PG Questions gambling in past year
Assessment Instrument CPGI
Gambling Availability 253.8 EGMs per 100,000 People 18+ in 2008/2009; 0.5 Casinos per 100,000 People 18+ in 2008/2009. 8,942 EGMs in 2007. 2007 population of 4,402,900. 518 people per EGM.
Past Year Gambling Prevalence 73%
Problem Gambling Prevalence 3.7% (3-7); 0.9% (8+); 4.6% combined
Standardized Problem Gambling Prevalence
4.6 * .58 * 1.44 * .53 = 2.0%
Demographic Correlates of PG males; 18 to 34 years; high school education or less; unemployed; divorced/separated and never married
Game Correlates of PG Lottery games; casino gambling
Comments

167
10 Location MANITOBA
Year Study Conducted 1993
Age 18+
Source(s) Criterion Research Corp. (1993). Problem Gambling Study: Final Report. Report to the Manitoba Lotteries foundation. Winnipeg, MB: Author.
Sample Size 1,212
Sampling Strategy
Random selection of listed numbers; random selection within household; sample stratified proportional to the population of each Census Division; The demographic data from the sample was compared with the 1990 Census (p. 5).
Survey Description "a study of the gambling practices of Manitobans"
Administration Method telephone interview
Response Rate 62%
Weighting
Threshold for PG Questions Had ever participated in any gambling activity.
Assessment Instrument SOGS-PY
Gambling Availability
First casino opens in 1989 (contains slot machines); VLTs introduced to rural Manitoba in Nov 1993; in 1993 2 new casinos with slots opened & VLTs were introduced into Winnipeg. 1993 population of 1,117,600. 2,000 VLTs in 1993.
Past Year Gambling Prevalence 87%
Problem Gambling Prevalence 2.9% (3-4); 1.3% (5+); 4.2% combined
Standardized Problem Gambling Prevalence
4.2 * .72 * 1.59 * .74 = 3.6%
Demographic Correlates of PG male; under 30 years of age
Game Correlates of PG
Comments

168
11 Location MANITOBA
Year Study Conducted 1995
Age 18+
Source(s) Criterion Research Corp. (1995). Problem Gambling Study: Final Report. Report prepared for the Manitoba Lotteries Corporation. Winnipeg, MB: Author.
Sample Size 1,207
Sampling Strategy
Random selection of listed numbers; random selection within household; sample stratified proportional to the population of each Census Division; The demographic data from the sample was compared with the 1991 Census (p. 3).
Survey Description
Administration Method telephone interview
Response Rate 60%
Weighting
Threshold for PG Questions Had ever participated in any gambling activity.
Assessment Instrument SOGS-PY
Gambling Availability First casino opens in 1989; 1991 rural VLTs; 1993 2 new casinos & Winnipeg VLTs. 1995 population of 1,129,200. 5,400 VLTs in 1995.
Past Year Gambling Prevalence (Lifetime participation = 92%)
Problem Gambling Prevalence 2.4% (3-4); 1.9% (5+); 4.3% combined
Standardized Problem Gambling Prevalence
4.3 * .72 * 1.59 * .74 = 3.6%
Demographic Correlates of PG under 30 years of age; household incomes in excess of $25,000
Game Correlates of PG
Comments

169
12 Location MANITOBA
Year Study Conducted 2001
Age 18+
Source(s) Brown, D., Patton, D., Dhaliwal, J., Pankratz, C., & Broszeit, B. (2002). Gambling Involvement and Problem Gambling in Manitoba. Winnipeg, MB: Addictions Foundation of Manitoba.
Sample Size 3,119
Sampling Strategy
Winnipeg and some of the rural areas near proposed casino sites were over sampled; The largest proportion of the sample is from Winnipeg, 56.3%; Twenty three percent of the respondents were from rural southern Manitoba, 14.6% were from Western Manitoba and 5.8% were from the northern part of the province; The sample frequencies are comparable with the population of Manitoba on most important characteristics. Specifically, the age and income level of the sample closely approximates the population (for details see pp. 8-10).
Survey Description
Administration Method telephone interview
Response Rate 40.7%
Weighting Yes
Threshold for PG Questions gambled in the past 12 months
Assessment Instrument CPGI; SOGS-PY
Gambling Availability First casino opens in 1989; 1991 rural VLTs; 1993 2 new casinos & Winnipeg VLTs. 7,013 EGMs in 2002. 2001 population of 1,151,400. People per EGM = 164.
Past Year Gambling Prevalence 85%
Problem Gambling Prevalence SOGS-PY: 2.3% (5+) CPGI: 2.3% (3-7); 1.1% (8+); 3.4% combined
Standardized Problem Gambling Prevalence
SOGS-PY: 2.3 * 1.49 * 1.44 * .53 = 2.6% CPGI: 3.4 * .58 * 1.44 * .53 = 1.5% Average = 2.1%
Demographic Correlates of PG males; under 25 years of age; household incomes under $30,000
Game Correlates of PG
Comments
First Nation gamblers tended to spend more time and money on gambling than other respondents. This would suggest that they might also constitute a higher risk group for gambling problems. However, our sample did not include a sufficient number of people from this population to make that connection with confidence. Note that the gambling prevalence rate in 2001 is not based on the full sample, the CPGI was administered to about 450 individuals and the South Oaks Gambling Screen was also administered to about 500 individuals.

170
13 Location MANITOBA
Year Study Conducted 2006
Age 18+
Source(s) Lemaire, J., MacKay, T., & Patton, D. (2008). Manitoba Gambling and Problem Gambling 2006. Winnipeg, MB: Addictions Foundation of Manitoba.
Sample Size 6,007
Sampling Strategy Random digit dialing; quota sampling near the end to increase the proportion of 18 to 24 year-old and male respondents.
Survey Description
Administration Method telephone interview
Response Rate 42.4%
Weighting age, gender, income
Threshold for PG Questions
Assessment Instrument CPGI
Gambling Availability 884.8 EGMs per 100,000 People 18+ in 2006/2007; 0.5 Casinos per 100,000 People 18+ in 2006/2007. 7,711 EGMs in 2006. 2006 population of 1,184,000. 154 people per EGM.
Past Year Gambling Prevalence 85.6%
Problem Gambling Prevalence 4.7% (3-7); 1.4% (8+); 6.1% combined
Standardized Problem Gambling Prevalence
6.1 * .58 * 1.44 * .53 = 2.7%
Demographic Correlates of PG 18-24 year olds; personal income levels less than $20,000; single; separated/divorced; working part-time and/or being unemployed.
Game Correlates of PG EGMs
Comments

171
14 Location NEW BRUNSWICK
Year Study Conducted 1992
Age 18+
Source(s) Baseline Market Research. (1992). Final Report: Prevalence Study: Problem Gambling. Prepared for Department of Finance, Province of New Brunswick. New Brunswick: Author.
Sample Size 800
Sampling Strategy
Generated a listing of telephone numbers using a combination of listed exchanges and random number generation; one telephone contact was made with a household; a second stage selection procedure was carried out to determine the person to be interviewed; sample selected did represent the overall population of New Brunswick (see table on p. 3).
Survey Description
Administration Method telephone interview
Response Rate 59%
Weighting
Threshold for PG Questions Any gambling activity in lifetime.
Assessment Instrument SOGS-PY & SOGS-L
Gambling Availability VLTs introduced 1990. 2,800 VLTs in 1992. 1991 population of 723,900. 259 people per EGM.
Past Year Gambling Prevalence 80% (Occasional gamblers + Regular gamblers)
Problem Gambling Prevalence SOGS-PY: 3.13% (3-4); 1.37% (5+); 4.5% combined SOGS-L: 4.0% (3-4); 2.0% (5+); 6.0% combined
Standardized Problem Gambling Prevalence
4.5 * .72 * 1.59 * .74 = 3.8%
Demographic Correlates of PG males; no more than a high school education; income less than $40,000; single
Game Correlates of PG card games; EGMs
Comments Questionnaire in both English and French; samples for problem and probable pathological gamblers were noted as being very small.

172
15 Location NEW BRUNSWICK
Year Study Conducted 1996
Age 18+
Source(s) Baseline Market Research. (1996). Final Report: Prevalence Study: Problem Gambling: Wave 2. Prepared for Department of Finance. Fredericton: New Brunswick Department of Finance.
Sample Size 800
Sampling Strategy
Random sampling from combination of listed numbers and random number generation; random selection within household; the obtained sample did represent the overall population of New Brunswick, as demonstrated in Table 1.
Survey Description "entertainment and leisure activities" (Note: information from 1996 Nova Scotia report).
Administration Method telephone interview
Response Rate 46%
Weighting
Threshold for PG Questions participated in any type of gambling activity in their lifetime
Assessment Instrument SOGS-PY & SOGS-L
Gambling Availability VLTs introduced 1990. 3,700 EGMs in 1996. 1996 population of 752,268. 203 people per EGM.
Past Year Gambling Prevalence 84% (Occasional gamblers + Regular gamblers)
Problem Gambling Prevalence SOGS-PY: 1.9% (3-4); 2.2% (5+); 4.1% combined SOGS-L: 2.6% (3-4); 2.4% (5+); 5.0% combined
Standardized Problem Gambling Prevalence
4.1 * 1.59 = 6.5%
Demographic Correlates of PG male; no more than a high school education; single; Francophones
Game Correlates of PG EGMs; betting on horses
Comments Interviews were conducted in the language of choice of the respondent. While approximately 38% of the sample indicated French as their mother tongue, approximately 27% chose to complete the interview in French.

173
16 Location NEW BRUNSWICK
Year Study Conducted 2001
Age 19+
Source(s)
Focal Research Consultants Ltd. (2001). 2001 Survey of Gambling and Problem Gambling in New Brunswick. Prepared for the New Brunswick Department of Health & Wellness. Fredericton: New Brunswick Department of Health & Wellness.
Sample Size 800
Sampling Strategy
Random sampling of listed and unlisted numbers; stratified by gender; obtained sample under-represented younger adults (i.e., aged 19 to 24 years)"; results are considered representative and generalizable to the New Brunswick adult population; survey administered in either English or French.
Survey Description "participation, opinions, and general awareness of gambling and gambling related issues in New Brunswick"
Administration Method telephone interview
Response Rate 63%
Weighting age, home language
Threshold for PG Questions ever gambled
Assessment Instrument CPGI; Problem Gambling Triangulation Measure (PGTM)
Gambling Availability 2,900 EGMs in 2001. 2001 population of 749,801. 259 people per EGM.
Past Year Gambling Prevalence 81% (Casual gamblers + Regular gamblers)
Problem Gambling Prevalence CPGI: 1.8% (3-7); 1.4% (8+) 3.2% combined
Standardized Problem Gambling Prevalence
3.2 * .58 * 1.44 * .76 = 2.0%
Demographic Correlates of PG male; single
Game Correlates of PG EGMs
Comments

174
17 Location NEW BRUNSWICK
Year Study Conducted 2009
Age 19+
Source(s)
MarketQuest Research. (2010). 2009 New Brunswick Gambling Prevalence Study. Prepared for Department of Health and New Brunswick Lotteries and Gaming Corporation, Government of New Brunswick. Fredericton, NB.
Sample Size 2,821
Sampling Strategy Random digit dialing; random selection within household; stratified by the seven health zones in the province as well as age and gender within each zone; survey administered in either English or French
Survey Description "survey across the province about games of chance, gambling and other related issues affecting residents of New Brunswick"
Administration Method telephone interview
Response Rate
Weighting Yes
Threshold for PG Questions ever gambled
Assessment Instrument CPGI
Gambling Availability 323.3 EGMs per 100,000 People 18+ in 2009/2010; 0 Casinos per 100,000 People 18+. 1,975 EGMs in 2009. 2009 population of 749,983. 380 people per EGM.
Past Year Gambling Prevalence 78%
Problem Gambling Prevalence 2.7% (3-7); 1.3% (8+); 4.0% combined
Standardized Problem Gambling Prevalence
4.0 * .58 * 1.44 * .76 = 2.5%
Demographic Correlates of PG male; between ages 19 and 44; high school or less than high school education
Game Correlates of PG EGMs; Internet gambling; poker
Comments More comprehensive list of gambling activities was developed in comparison to past provincial surveys.

175
18 Location NEWFOUNDLAND AND LABRADOR
Year Study Conducted 2005
Age 19+
Source(s)
MarketQuest Research (2005). 2005 Newfoundland and Labrador Gambling Prevalence Study. Prepared for the Department of Health and Community Services, Government of Newfoundland and Labrador. St. John's, NL: Department of Health and Community Services.
Sample Size 2,596
Sampling Strategy Stratified sampling by health region, age, and gender; random selection within household.
Survey Description "research survey on the gambling activities and attitudes of residents of Newfoundland and Labrador"
Administration Method telephone interview
Response Rate
Weighting yes
Threshold for PG Questions gambled in the past 12 months
Assessment Instrument CPGI
Gambling Availability 637.9 EGMs per 100,000 People 18+ in 2005/2006; 0 Casinos per 100,000 People 18+; VLTs introduced 1991. 2,644 EGMs in 2005. 2005 population of 514,363. 195 people per EGM.
Past Year Gambling Prevalence 84%
Problem Gambling Prevalence 2.2% (3-7); 1.2% (8+); 3.4% combined
Standardized Problem Gambling Prevalence
3.4 * .58 * 1.44 * .76 = 2.2%
Demographic Correlates of PG males; ages 25-34; some post-secondary education; incomes of $20,001 to $40,000
Game Correlates of PG EGMs; Poker
Comments

176
19 Location NEWFOUNDLAND AND LABRADOR
Year Study Conducted 2009
Age 19+
Source(s)
MarketQuest Research (2009). 2009 Newfoundland and Labrador Gambling Prevalence Study. Prepared for Department of Health and Community Services, Government of Newfoundland and Labrador. St. John's, NL: Department of Health and Community Services.
Sample Size 4,002
Sampling Strategy Random digit dialing; stratified by the four Regional Health Authorities as well as age and gender; random selection within household.
Survey Description "survey on games of chance, gambling and other related issues affecting residents of Newfoundland and Labrador"
Administration Method telephone interview
Response Rate
Weighting yes
Threshold for PG Questions gambled in the past 12 months
Assessment Instrument CPGI
Gambling Availability 494.2 EGMs per 100,000 People 18+ in 2009/2010; 0 Casinos. 2,059 EGMs in 2009. 2009 population of 508,862. 247 people per EGM.
Past Year Gambling Prevalence 77%
Problem Gambling Prevalence 1.7% (3-7); 0.7% (8+); 2.4% combined
Standardized Problem Gambling Prevalence
2.4 * .58 * 1.44 * .76 = 1.5%
Demographic Correlates of PG equally likely to be male or female; ages 35 – 64; lower income
Game Correlates of PG EGMs; Poker; Internet Poker
Comments

177
20 Location NOVA SCOTIA
Year Study Conducted 1993
Age 18+
Source(s) Omnifacts Research. (1993). An Examination of the Prevalence of Gambling in Nova Scotia. Report #93090. Halifax: Nova Scotia Department of Health, Drug Dependency Services.
Sample Size 810
Sampling Strategy Stratified the population of Nova Scotia into clusters then selected a proportionate random sample of listed telephone numbers for each cluster; random selection within household
Survey Description "gambling activities and attitudes towards gambling in Nova Scotia"
Administration Method telephone interview
Response Rate 39.5% (calculated from information contained in the report)
Weighting no
Threshold for PG Questions gambling for money in lifetime
Assessment Instrument SOGS-L
Gambling Availability VLTs introduced 1991; first casino in 1995. 1993 population of 923,925. ~1,300 EGMs in 1993. 711 people per EGM.
Past Year Gambling Prevalence (80% Lifetime)
Problem Gambling Prevalence SOGS-L: 3.1% (3-4); 1.7% (5+); 4.8% combined
Standardized Problem Gambling Prevalence
4.8 * .67 * .72 * 2.18 * .51 = 2.6%
Demographic Correlates of PG young to middle aged males; slight majority of whom earn less than $40,000 per year and have high school or less education; twice as likely to have been divorced or separated
Game Correlates of PG
Comments Report also included a separate sample of 300 adolescents 13 to 17 years of age.

178
21 Location NOVA SCOTIA
Year Study Conducted 1996
Age 19+
Source(s) Baseline Market Research. (1996). Final Report: 1996 Prevalence Study on Problem Gambling in Nova Scotia. Prepared for Nova Scotia Department of Health. Halifax, NS: Author.
Sample Size 801
Sampling Strategy
Stratified random sampling which ensured a known probability of selection for residents within each of Nova Scotia's four health regions; randomly generated telephone numbers obtained from a bank of telephone numbers; sample is representative of overall population of Nova Scotia (see table on p. 6).
Survey Description "gaming and leisure activities"
Administration Method telephone interview
Response Rate 41.9%
Weighting Yes
Threshold for PG Questions participated in at least one gambling activity in lifetime
Assessment Instrument SOGS-PY & SOGS-L
Gambling Availability VLTs introduced 1991; first casino in 1995. ~2,900 VLTs in 1996. 1996 population of 931,327.
Past Year Gambling Prevalence 92% (96% Lifetime)
Problem Gambling Prevalence SOGS-PY: 2.8% (3-4); 1.1% (5+); 3.9% combined SOGS-L: 3.6% (3-4); 1.9% (5+); 5.5% combined
Standardized Problem Gambling Prevalence
3.9 * .72 * 1.44 * .53 = 2.1%
Demographic Correlates of PG male; high school diploma or less
Game Correlates of PG
Comments

179
22 Location NOVA SCOTIA
Year Study Conducted 2003
Age 19+
Source(s) Focal Research Consultants. (2004). 2003 Nova Scotia Gambling Prevalence Study. Commissioned by the Nova Scotia Office of Health Promotion.
Sample Size 2,800
Sampling Strategy Random selection of household; surveying all adults in household.
Survey Description
Administration Method telephone interview
Response Rate 68%
Weighting No - "Due to sampling techniques used and the response rate achieved, it was unnecessary to weight the data to reflect population statistics."
Threshold for PG Questions participated in at least one gambling activity in lifetime
Assessment Instrument CPGI; Problem Gambling Triangulation Measure
Gambling Availability 673.1 EGMs per 100,000 People 18+ in 2002; 0.27 Casinos per 100,000 People 18+ in 2003. 4,975 EGMs in 2003. 2003 population of 937,491. 188 people per EGM.
Past Year Gambling Prevalence 89.3%
Problem Gambling Prevalence CPGI: 1.3% (3-7); 0.8% (8+); 2.1% combined
Standardized Problem Gambling Prevalence
CPGI: 2.1 * .58 * 1.59 * .74 = 1.4%
Demographic Correlates of PG males; 25-34 year old age group
Game Correlates of PG EGMs
Comments

180
23 Location NOVA SCOTIA
Year Study Conducted 2007
Age 19+
Source(s) Focal Research Consultants (2008). 2007 Adult Gambling Prevalence Study. Halifax, NS: Nova Scotia Health Promotion and Protection.
Sample Size 2,500
Sampling Strategy Geographically stratified random sampling; surveyed all adults in household.
Survey Description
Administration Method telephone interview
Response Rate 60.6%
Weighting No - "Due to sampling techniques used and the response rate achieved, it was unnecessary to weight the data to reflect population statistics."
Threshold for PG Questions participated in at least one gambling activity in lifetime
Assessment Instrument CPGI
Gambling Availability 436.6 EGMs per 100,000 People 18+ in 2007/2008; 0.3 Casinos per 100,000 People 18+ in 2007/2008. 3,285 EGMs in 2007. 2007 population of 935,794. 285 people per EGM.
Past Year Gambling Prevalence 87.0%
Problem Gambling Prevalence 1.6% (3-7); 0.9% (8+); 2.5% combined
Standardized Problem Gambling Prevalence
2.5 * .58 * 1.59 * .74 = 1.7%
Demographic Correlates of PG males; under 35 years of age; disabled adults; unemployed; 19-24 year old age group (at risk); single, living common-law or separated
Game Correlates of PG EGMs; daily lottery games
Comments

181
24 Location ONTARIO
Year Study Conducted 1993
Age 18-74
Source(s) Insight Canada Research. (1993). Prevalence of Problem & Pathological Gambling in Ontario using the South Oaks Gambling Screen. Toronto, ON: Author.
Sample Size 1,200
Sampling Strategy Geographically stratified random-digit dialing.
Survey Description
Administration Method telephone interview
Response Rate 65%
Weighting
Threshold for PG Questions
Assessment Instrument SOGS-L (modified)
Gambling Availability First casino introduced 1994. No EGMs in 1993.
Past Year Gambling Prevalence 52% (Ontarians who have spent money on gambling activities in the past twelve months)
Problem Gambling Prevalence SOGS-L: 7.7% (3-4); 0.9% (5+); 8.6% combined
Standardized Problem Gambling Prevalence
8.6 * .72 * .67 *1.59 * .74 = 4.9%
Demographic Correlates of PG
Males; ages 18-44 and 65-74; separated or never married; high school education or less; Canadian, French or Irish heritage; Aboriginal; annual household earnings between $20,000 and $29,999, and between $50,000 and $79,999; the unemployed or students; residents of Central and Northern Ontario.
Game Correlates of PG
Comments

182
25 Location ONTARIO
Year Study Conducted 1995
Age 18+
Source(s) Ferris J., Stirpe T., & Ialomiteanu, A. (1996). Gambling in Ontario: A Report from a General Population Survey on Gambling-Related Problems and Opinions. Toronto, ON: Addiction Research Foundation.
Sample Size 1,030
Sampling Strategy Random digit dialing; random selection within household. The resulting sample is broadly representative of the adult population of Ontario living in private households with telephones.
Survey Description "issues that some people think are social problems"
Administration Method telephone interview
Response Rate 65%
Weighting household size; number of telephone lines
Threshold for PG Questions spent more than $100 in their lifetime on gambling
Assessment Instrument SOGS-PY (not reported) & SOGS-L; DSM-IV-PY & DSM-IV-L); Life Areas Problem Measure-PY
Gambling Availability First casino introduced 1994. 1995 population of 10,950,119.
Past Year Gambling Prevalence 84%
Problem Gambling Prevalence
SOGS-L: 1.94% (3-4); 1.65% (5+); 3.59% combined DSM-IV-PY: 2.0% (3-4); 0.2% (5+); 2.20% combined DSM-IV-L: 2.03% (3-4); 0.49% (5+); 2.52% combined Life Areas Problem Measure-PY: 5.7% (1 or more problems)
Standardized Problem Gambling Prevalence
2.2 * 1.19 * 1.59 = 4.2%
Demographic Correlates of PG Younger adults; males; divorced or separated; never married
Game Correlates of PG lottery gambling; sports betting
Comments

183
26 Location ONTARIO
Year Study Conducted 2001
Age 18+
Source(s) Wiebe, J., Single, E., & Falkowski-Ham, A. (2001). Measuring Gambling and Problem Gambling in Ontario. Toronto, ON: Canadian Centre on Substance Abuse and Responsible Gambling Council (Ontario).
Sample Size 5,000
Sampling Strategy Random selection of live residential numbers; random selection within household; sample stratified by region, age and gender
Survey Description "the gambling activities and attitudes of adult Ontarians"
Administration Method telephone interview
Response Rate 37%
Weighting age, region
Threshold for PG Questions gambled in past year
Assessment Instrument CPGI
Gambling Availability 19,798 EGMs in 2002. 2001 population of 11,896,663. 601 people per EGM.
Past Year Gambling Prevalence 83%
Problem Gambling Prevalence 3.1% (3-7); 0.7% (8+); 3.8% combined
Standardized Problem Gambling Prevalence
3.8 * .58 * 1.44 * .53 = 1.7%
Demographic Correlates of PG male; ages 18 - 24, single; students; unemployed; better educated
Game Correlates of PG lottery tickets; EGMs; scratch tickets; casino table games; gambling with bookie
Comments

184
27 Location ONTARIO
Year Study Conducted 2003
Age 18+
Source(s)
Williams, R.J. & Wood, R.T. (2004b). Demographic Sources of Ontario Gaming Revenue. Final Report submitted to the Ontario Problem Gambling Research Centre, June 23, 2004. Williams, R.J., & Wood, R.T. (2007b). The proportion of Ontario gambling revenue derived from problem gamblers. Canadian Public Policy, 33(3), 367-388.
Sample Size 6,654
Sampling Strategy Random digit dialing; random selection within household
Survey Description ‘survey about gambling’
Administration Method telephone interview
Response Rate 51%
Weighting gender, age, ethnicity
Threshold for PG Questions Spending at least $9 in a typical month on some form of gambling in the past year.
Assessment Instrument CPGI
Gambling Availability 215.6 EGMs per 100,000 People 18+ in 2003; 0.11 Casinos per 100,000 People 18+ in 2003. 20,402 EGMs in 2003. 2003 population of 12,242,273. 600 people per EGM.
Past Year Gambling Prevalence
Problem Gambling Prevalence 3.8% (3-7); 1.0% (8+); 4.8% combined
Standardized Problem Gambling Prevalence
4.8 * .58 * 1.44 * .76 = 3.0%
Demographic Correlates of PG male; Aboriginal and ‘Other’ Ethnicity; lower income; less education; single or divorced
Game Correlates of PG
Comments Not designed to be a prevalence study, but prevalence data was obtained.

185
28 Location ONTARIO
Year Study Conducted 2005
Age 18+
Source(s) Wiebe, J., Mun, P., & Kauffman, N. (2006). Gambling and Problem Gambling in Ontario 2005. Toronto, ON: Responsible Gambling Council (Ontario).
Sample Size 3,604
Sampling Strategy
Random digit dialing; random selection within household; Table 2.1.0 (p. 14) shows sample gender and age demographics compared to Statistics Canada’s population estimates of Ontario for gender and age compositions in 2005 and 2004, respectively (Statistics Canada, 2006).
Survey Description "attitudes and behaviours towards gambling"
Administration Method telephone interview
Response Rate 46.4%
Weighting Gender
Threshold for PG Questions participate in any form of gambling
Assessment Instrument CPGI (In addition to the annual time frame, time frames of the past 6 months and past month were also used.)
Gambling Availability 240.0 EGMs per 100,000 People 18+ in 2005/2006; 0.1 Casinos per 100,000 People 18+ in 2005/2006. 23,434 EGMs in 2005. 2005 population of 12,528,480. 435 people per EGM.
Past Year Gambling Prevalence 63.3%
Problem Gambling Prevalence 2.6% (3-7); 0.8% (8+); 3.4% combined
Standardized Problem Gambling Prevalence
3.4 * .58 * 1.44 * .76 = 2.2%
Demographic Correlates of PG males; 18 to 24 year-olds; single and never married
Game Correlates of PG gambling on slot machines in Ontario casinos; slots at racetracks
Comments
As shown in Table 4.1.0, problem gambling behaviour decreased as the time frame narrowed. From the 12-month time frame to the one-month time frame, the results showed that 50% fewer individuals were classified as at risk, as having moderate problems, and as having severe problems.

186
29 Location ONTARIO
Year Study Conducted 2007-2008
Age 12+
Source(s)
Statistics Canada. (2009). Canadian Community Health Survey, Cycle 4.1, 2007 [computer file]. Ottawa, Ontario: Author. Health Statistics Division [producer]; Statistics Canada. Data Liberation Initiative [distributor]. (STC cat. no. 82M0013XCB). UT/DLS: Microdata Analysis and Subsetting (SDA) [data extraction tool], accessed August 18, 2011.
Sample Size 42,145 (age 15+)
Sampling Strategy
Random selection. The 07/08 CCHS was asked to respondents from a geographic area frame (50%) and a telephone frame (50%). The geographic area frame cases were collected in person where possible but some were collected by phone. The telephone frame cases were collected by phone.
Survey Description
“I’m calling regarding the Canadian Community Health Survey.”…..”This survey deals with various aspects of your health. I’ll be asking about such things as physical activity, social relationships and health status. By health, we mean not only the absence of disease or injury but also physical, mental and social well-being.”
Administration Method Telephone (>50%); residential face-to-face interview (<50%)
Response Rate 73.6%
Weighting Yes
Threshold for PG Questions Participation in some type of gambling more than 5 times in past year. Also, if people indicated they “were not a gambler” they were not administered the CPGI, regardless of gambling frequency.
Assessment Instrument CPGI
Gambling Availability 23,029 EGMs in 2007. 2007 population of 12,792,937. 556 people per EGM.
Past Year Gambling Prevalence 68.1%
Problem Gambling Prevalence 0.9% (3-7); 0.3% (8+); 1.2% combined (data has been restricted to ages 15+)
Standardized Problem Gambling Prevalence
1.2 * .58 * 1.22 = 0.8%
Demographic Correlates of PG Male, age 20-29 & 50-59
Game Correlates of PG
Comments
Note that a 50% administration modality weight was applied, as 50% of the interviews were conducted by phone. Unlike most surveys that collect sensitive demographic information at the very end, much of this is collected at the very outset of the CCHS. In addition, at the very outset the person is asked to provide his/her name, the names of all the other people living in the residence, and his/her date of birth.

187
30 Location ONTARIO
Year Study Conducted 2011
Age 18+
Source(s) Williams, R.J., & Volberg, R.A. (in preparation). Prevalence of Gambling and Problem Gambling in Ontario in 2011. Report prepared for the Problem Gambling Research Centre, Guelph, Ontario.
Sample Size 4,026 telephone; 4,103 Online Panel
Sampling Strategy
Random digit dialing that included cell phones (2nd prevalence survey to include cell phones, first being Germany in 2010); stratified sampling to ensure 2/3rds true age x gender quotas in Ontario in 2009; random selection within the household (landlines only); 8 attempts to contact the designated person with these attempts spread over a 6 month period; recontacting ‘soft refusals’ at a later point to see if they would be willing to participate; language assist for French and Chinese respondents. Small subset (n = 500) where an attempt was made to interview everyone within the household.
Survey Description ‘health & recreational behaviour’
Administration Method telephone interview and self-administered online (Online Panel)
Response Rate 18.4% landlines; 10.7% cellphones; 21.6% entire household; 33.6% online panel
Weighting age, gender, household size
Threshold for PG Questions gambling once a month or more on some form of gambling in past year
Assessment Instrument PPGM, CPGI
Gambling Availability 22,314 EGMs in 2010 (WCGM). 2011 population of 13,372,996. 599 people per EGM.
Past Year Gambling Prevalence 82.9%
Problem Gambling Prevalence
Telephone CPGI 5+ = 1.04% Online Panel CPGI 5+ = 8.3% Telephone PPGM = 2.18% Online Panel PPGM = 10.5%
Standardized Problem Gambling Prevalence
Telephone CPGI 5+ = 1.04% * 1.44 * .53 = 0.79% Telephone PPGM = 2.18% * 1.44 * .53 = 1.66% Average = 1.23%
Demographic Correlates of PG
Game Correlates of PG
Comments

188
31 Location PRINCE EDWARD ISLAND
Year Study Conducted 1999
Age 18+
Source(s)
Doiron, J., & Nicki, R.M. (1999). The Prevalence of Problem Gambling in Prince Edward Island. Fredericton: University of New Brunswick. Doiron, J., & Nicki, R.M. (2001). Epidemiology of problem gambling in Prince Edward Island: A Canadian microcosm? Canadian Journal of Psychiatry, 46, 413-417.
Sample Size 809
Sampling Strategy Random selection of numbers from the health database; stratified regional (Health Region) sampling; 3 call back attempts; random selection within household
Survey Description "confidential survey about gambling on Prince Edward Island"
Administration Method telephone interview
Response Rate 42.8%
Weighting age, gender
Threshold for PG Questions participated in at least one gambling activity in the 12 months
Assessment Instrument SOGS-PY
Gambling Availability VLTs introduced in 1991. ~400 EGMs in 1999. 1999 population of 136,281. 341 people per EGM.
Past Year Gambling Prevalence 83%
Problem Gambling Prevalence SOGS-PY: 1.1% (3-4); 2.0% (5+); 3.1% combined
Standardized Problem Gambling Prevalence
3.1 * .72 * 1.44 * .53 = 1.7%
Demographic Correlates of PG male; under the age of 30; not married; unemployed
Game Correlates of PG EGMs; cards games; bingo; horse races; pull tabs/scratch tickets
Comments
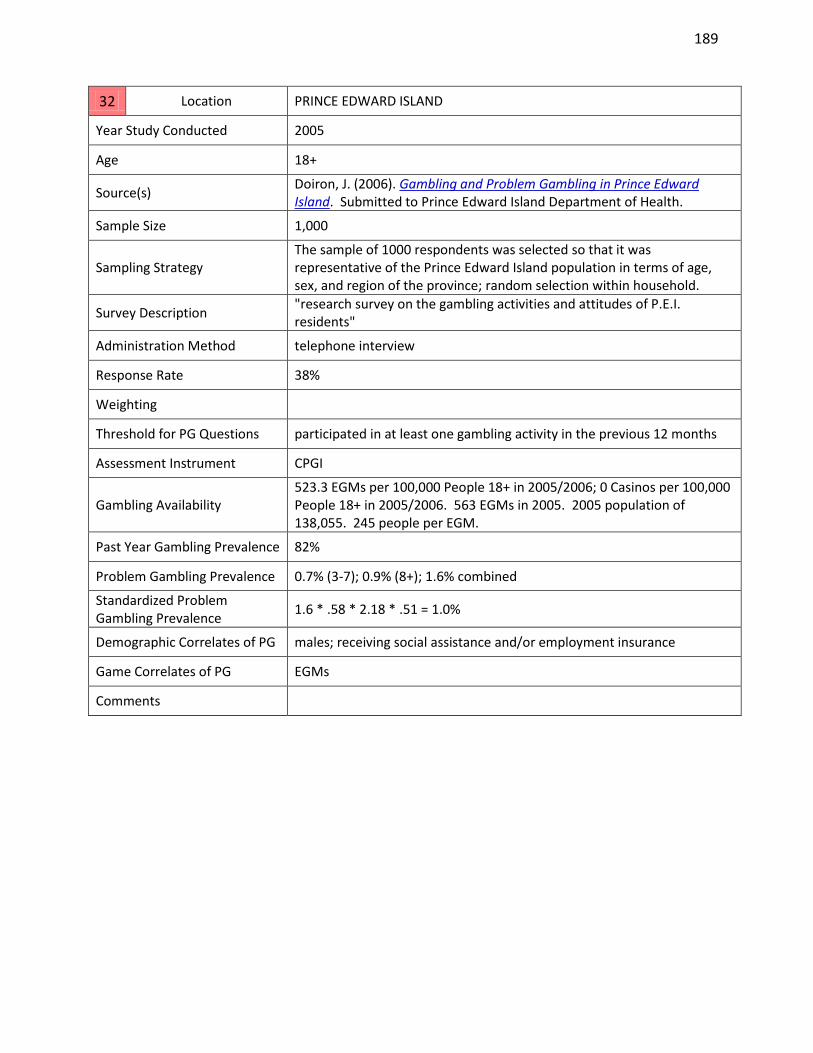
189
32 Location PRINCE EDWARD ISLAND
Year Study Conducted 2005
Age 18+
Source(s) Doiron, J. (2006). Gambling and Problem Gambling in Prince Edward Island. Submitted to Prince Edward Island Department of Health.
Sample Size 1,000
Sampling Strategy The sample of 1000 respondents was selected so that it was representative of the Prince Edward Island population in terms of age, sex, and region of the province; random selection within household.
Survey Description "research survey on the gambling activities and attitudes of P.E.I. residents"
Administration Method telephone interview
Response Rate 38%
Weighting
Threshold for PG Questions participated in at least one gambling activity in the previous 12 months
Assessment Instrument CPGI
Gambling Availability 523.3 EGMs per 100,000 People 18+ in 2005/2006; 0 Casinos per 100,000 People 18+ in 2005/2006. 563 EGMs in 2005. 2005 population of 138,055. 245 people per EGM.
Past Year Gambling Prevalence 82%
Problem Gambling Prevalence 0.7% (3-7); 0.9% (8+); 1.6% combined
Standardized Problem Gambling Prevalence
1.6 * .58 * 2.18 * .51 = 1.0%
Demographic Correlates of PG males; receiving social assistance and/or employment insurance
Game Correlates of PG EGMs
Comments

190
33 Location QUEBEC
Year Study Conducted 1989
Age 18+
Source(s)
Ladouceur, R. (1991). Prevalence estimates of pathological gamblers in Quebec, Canada. Canadian Journal of Psychiatry, 36, 732-734.
Ladouceur, R. (1996). The prevalence of pathological gambling in Canada. Journal of Gambling Studies, 12(2), 129-142. doi: http://dx.doi.org/10.1007/BF01539170
Sample Size 1,002
Sampling Strategy Random selection of listed numbers; stratified sampling to proportionally represent the adult population of each area in the province; random selection within household; 5 attempts to contact each number.
Survey Description
Administration Method telephone interview
Response Rate 68%
Weighting
Threshold for PG Questions
Assessment Instrument SOGS-L
Gambling Availability VLTs and casinos not introduced until 1993.
Past Year Gambling Prevalence 52.2%
Problem Gambling Prevalence SOGS-L: 2.6% (3-4); 1.2% (5+); 3.8% combined
Standardized Problem Gambling Prevalence
3.8 * .72 * .60 * 1.59 * .74 = 1.9%
Demographic Correlates of PG males; under age of 30 or between 40 and 49 years of age; incomes between $15,000 and $25,000 or between $35,000 and $50,000.
Game Correlates of PG
Comments

191
34 Location QUEBEC
Year Study Conducted 1996
Age 18+
Source(s)
Ladouceur, R. (1996). The prevalence of pathological gambling in Canada. Journal of Gambling Studies, 12(2), 129-142. doi: http://dx.doi.org/10.1007/BF01539170 Ladouceur, R., Jacques, C., Ferland, F., Giroux, I. (1999). Prevalence of problem gambling: A replication study 7 years later. Canadian Journal of Psychiatry, 44(8), 802–804.
Sample Size 1,257
Sampling Strategy The sampling procedure used in 1996 is the same as the procedure used in the 1989 study.
Survey Description
Administration Method telephone interview
Response Rate 68%
Weighting age, sex
Threshold for PG Questions
Assessment Instrument SOGS-L
Gambling Availability VLTs and casinos introduced 1993. 19,149 EGMs in 1999 (WCGM). ~14,800 VLTs in 1996. 1996 population of 7,246,897.
Past Year Gambling Prevalence 63% (Later reported in results of 2002 Quebec survey as 90% due to lottery not being considered a form of gambling by some participants).
Problem Gambling Prevalence 1.4% (3-4); 1.0% (5+); 2.4% combined
Standardized Problem Gambling Prevalence
2.4 * .72 * .67 * 1.44 * .76 = 1.7%
Demographic Correlates of PG
Game Correlates of PG
Comments Prevalence figures came from the Ladouceur et al. (2005) study.

192
35 Location QUEBEC
Year Study Conducted 2002
Age 18+
Source(s)
Ladouceur, R., Jacques, C., Chevalier, S., Sévigny, S., Hamel, D., & Allard, D. (2004). Prévalence des habitudes de jeu et du jeu pathologique au Québec en 2002. Université Laval and Institut national de santé publique du Québec. Ladouceur, R., Jacques, C., Chevalier, S., Sévigny, S., & Hamel, D. (2005). Prevalence of pathological gambling in Quebec in 2002. Canadian Journal of Psychiatry, 50, 451-456.
Sample Size 8,842
Sampling Strategy Randomly generated phone numbers covering all regions of Quebec; random selection within household.
Survey Description "We would like to ask you some questions about activities you may have participated in the past 12 months.”
Administration Method telephone interview
Response Rate 60.8%
Weighting Yes - number of telephone call attempts to reach the resident, the number of adults living in each residence, gender, the overall response rate, and region.
Threshold for PG Questions
Respondents had to answer “yes” to one of the following criteria to be assessed for problem gambling: 1) have spent more than $520 annually on gambling or 2) have played too much, spent too much money, or spent too much time gambling.
Assessment Instrument SOGS-L (for ½ of the sample); CPGI (for ½ of the sample)
Gambling Availability 20,031 EGMs in 2002. 2002 population of 7,441,076. 371 people per EGM.
Past Year Gambling Prevalence 81%
Problem Gambling Prevalence SOGS-L: 0.9% (3-4); 0.9% (5+); 1.8% combined CPGI: 1.0% (3-7); 0.7% (8+); 1.7% combined
Standardized Problem Gambling Prevalence
1.7 * .58 * 1.44 = 1.4%
Demographic Correlates of PG males; ages 18 - 24 years; not completing grade school or high school education; below the poverty line
Game Correlates of PG
Comments

193
36 Location QUEBEC
Year Study Conducted 2007-2008
Age 12+
Source(s)
Statistics Canada. (2009). Canadian Community Health Survey, Cycle 4.1, 2007 [computer file]. Ottawa, Ontario: Author. Health Statistics Division [producer]; Statistics Canada. Data Liberation Initiative [distributor]. (STC cat. no. 82M0013XCB). UT/DLS: Microdata Analysis and Subsetting (SDA) [data extraction tool], accessed August 18, 2011.
Sample Size 22,614 (age 15+)
Sampling Strategy
Random selection. The 07/08 CCHS was asked to respondents from a geographic area frame (50%) and a telephone frame (50%). The area frame cases were collected in person where possible but some were collected by phone. The telephone frame cases were collected by phone.
Survey Description
“I’m calling regarding the Canadian Community Health Survey. This survey deals with various aspects of your health…… I’ll be asking about such things as physical activity, social relationships and health status. By health, we mean not only the absence of disease or injury but also physical, mental and social well-being.”
Administration Method Telephone (>50%); residential face-to-face interview (<50%)
Response Rate 76.6%
Weighting Yes
Threshold for PG Questions Participation in some type of gambling more than 5 times in past year. Also, if people indicated they “were not a gambler” they were not administered the CPGI, regardless of gambling frequency.
Assessment Instrument CPGI
Gambling Availability 18,453 EGMs in 2007. 2007 population of 7,687,423. 417 people per EGM.
Past Year Gambling Prevalence 71.8%
Problem Gambling Prevalence 1.0% (3-7); 0.4% (8+); 1.4% combined (data has been restricted to ages 15+)
Standardized Problem Gambling Prevalence
1.4 * .58 * 1.22 = 1.0%
Demographic Correlates of PG
Game Correlates of PG
Comments
Note that a 50% administration modality weight was applied, as 50% of the interviews were conducted by phone. Unlike most surveys that collect sensitive demographic information at the very end, much of this is collected at the very outset of the CCHS. In addition the person is asked to provide his/her name, the names of all the other people living in the residence, and his/her date of birth.

194
37 Location QUEBEC
Year Study Conducted 2009
Age 18+
Source(s)
Kairouz, S., Nadeau, L., & Paradis, C. (2011). Portrait of Gambling in Quebec: Prevalence, Incidence and Trajectories over Four Years. Montreal, QC: Université Concordia. Kairouz, S., & Nadeau,L. (2010). Portrait du jeu au Québec: Prévalence, incidence et trajectoires sur quatre ans. Montreal, QC: Université Concordia.
Sample Size 11,888
Sampling Strategy
Two-stage proportional random stratified design. In the first stage, a non-proportional stratified sample of households from the 16 administrative regions of Québec was used. Initially, the number of interviews to be completed per stratum was proportional to the square root of the estimated population of the stratum. An additional 1,888 respondents were added in the Laurentian region to permit special analyses to be carried out before the Tremblant casino opened. Random selection within household.
Survey Description ‘gambling and gambling-related problems among Quebeckers’
Administration Method telephone interview
Response Rate 52.5%
Weighting Yes
Threshold for PG Questions
gamblers who reported gambling more than 52 times a year on some form of gambling (other than lotteries) OR gamblers who gambled less than once a week on all individual forms of gambling but spent at least a combined total of $500/yr on all forms of gambling OR if a gambler provided a positive answer to the question ‘Do you feel you have spent too much money or time on games of chance in the past 12 months’
Assessment Instrument CPGI -- Indice canadien du jeu excessif (ICJE)
Gambling Availability 280.1 EGMs per 100,000 People 18+; 0.1 Casinos per 100,000 People 18+. 18,776 EGMs in 2009. 2009 population of 7,826,891. 417 people per EGM.
Past Year Gambling Prevalence 70.5%
Problem Gambling Prevalence 1.3% (3-7); 0.7% (8+); 2.0% combined
Standardized Problem Gambling Prevalence
2.0 * .58 * 1.44 * .76 = 1.3%
Demographic Correlates of PG males; 25 to 34 years; low educational attainment; low-income households
Game Correlates of PG EGMs; Internet gambling
Comments
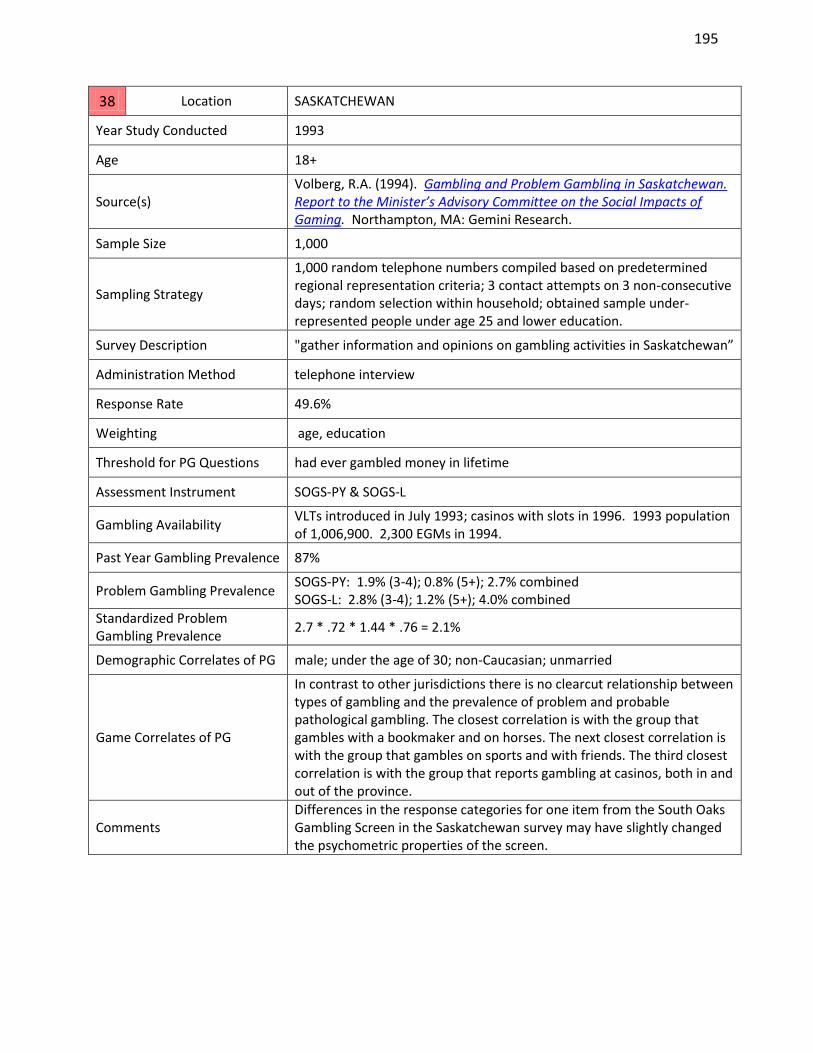
195
38 Location SASKATCHEWAN
Year Study Conducted 1993
Age 18+
Source(s) Volberg, R.A. (1994). Gambling and Problem Gambling in Saskatchewan. Report to the Minister’s Advisory Committee on the Social Impacts of Gaming. Northampton, MA: Gemini Research.
Sample Size 1,000
Sampling Strategy
1,000 random telephone numbers compiled based on predetermined regional representation criteria; 3 contact attempts on 3 non-consecutive days; random selection within household; obtained sample under-represented people under age 25 and lower education.
Survey Description "gather information and opinions on gambling activities in Saskatchewan”
Administration Method telephone interview
Response Rate 49.6%
Weighting age, education
Threshold for PG Questions had ever gambled money in lifetime
Assessment Instrument SOGS-PY & SOGS-L
Gambling Availability VLTs introduced in July 1993; casinos with slots in 1996. 1993 population of 1,006,900. 2,300 EGMs in 1994.
Past Year Gambling Prevalence 87%
Problem Gambling Prevalence SOGS-PY: 1.9% (3-4); 0.8% (5+); 2.7% combined SOGS-L: 2.8% (3-4); 1.2% (5+); 4.0% combined
Standardized Problem Gambling Prevalence
2.7 * .72 * 1.44 * .76 = 2.1%
Demographic Correlates of PG male; under the age of 30; non-Caucasian; unmarried
Game Correlates of PG
In contrast to other jurisdictions there is no clearcut relationship between types of gambling and the prevalence of problem and probable pathological gambling. The closest correlation is with the group that gambles with a bookmaker and on horses. The next closest correlation is with the group that gambles on sports and with friends. The third closest correlation is with the group that reports gambling at casinos, both in and out of the province.
Comments Differences in the response categories for one item from the South Oaks Gambling Screen in the Saskatchewan survey may have slightly changed the psychometric properties of the screen.

196
39 Location SASKATCHEWAN
Year Study Conducted 2001
Age 19+
Source(s) Wynne, H. (2002). Gambling and Problem Gambling in Saskatchewan: Final Report. Ottawa, ON: Canadian Centre on Substance Abuse.
Sample Size 1,848
Sampling Strategy
Sample stratified geographically and by gender according to the 1996 census; random sample of residential telephone numbers conforming to four regions of the province: Regina, Saskatoon, rural communities, and rural Saskatchewan; random sample of unlisted telephone numbers for Regina and Saskatchewan; individual adult respondent selected using a "modified" most recent birthday method (modified the next birthday method in those regions where wide gaps between the sample distribution of men and women was significantly at variance with the population).
Survey Description "gambling attitudes and activities of Saskatchewan residents"
Administration Method telephone interview
Response Rate 59.7%
Weighting gender, age, income
Threshold for PG Questions gambling activity in the last 12 months
Assessment Instrument CPGI
Gambling Availability 5,625 EGMs in 2002. 2001 population of 1,000,221. 178 people per EGM.
Past Year Gambling Prevalence 87%
Problem Gambling Prevalence 4.7% (3-7); 1.2% (8+); 5.9% combined
Standardized Problem Gambling Prevalence
5.9 * .58 * 1.44 * .76 = 3.7%
Demographic Correlates of PG residents of Regina and Saskatoon; males; youngest age group (19-24 years); single; high school education or less; annual household income of <$20,000; Aboriginals; unemployed
Game Correlates of PG EGMs; instant win tickets; bingo
Comments

197
40 Location SASKATCHEWAN
Year Study Conducted 2007-2008
Age 12+
Source(s)
Statistics Canada. (2009). Canadian Community Health Survey, Cycle 4.1, 2007 [computer file]. Ottawa, Ontario: Author. Health Statistics Division [producer]; Statistics Canada. Data Liberation Initiative [distributor]. (STC cat. no. 82M0013XCB). UT/DLS: Microdata Analysis and Subsetting (SDA) [data extraction tool], accessed August 18, 2011.
Sample Size 7,478 (age 15+)
Sampling Strategy
Random selection. The 07/08 CCHS was asked to respondents from a geographic area frame (50%) and a telephone frame (50%). The area frame cases were collected in person where possible but some were collected by phone. The telephone frame cases were collected by phone.
Survey Description
“I’m calling regarding the Canadian Community Health Survey. This survey deals with various aspects of your health. I’ll be asking about such things as physical activity, social relationships and health status. By health, we mean not only the absence of disease or injury but also physical, mental and social well-being.”
Administration Method Telephone (>50%); residential face-to-face interview (<50%)
Response Rate 81.4%
Weighting Yes
Threshold for PG Questions Participation in some type of gambling more than 5 times in past year. Also, if people indicated they “were not a gambler” they were not administered the CPGI, regardless of gambling frequency.
Assessment Instrument CPGI
Gambling Availability 6,640 EGMs in 2007. 2007 population of 1,000,257. 151 people per EGM.
Past Year Gambling Prevalence 68.1%
Problem Gambling Prevalence 1.5% (3-7); 0.2% (8+); 1.7% combined (data has been restricted to ages 15+)
Standardized Problem Gambling Prevalence
1.7 * .58 * 1.22 = 1.2%
Demographic Correlates of PG
Game Correlates of PG
Comments
Note that a 50% administration modality weight was applied, as 50% of the interviews were conducted by phone. Unlike most surveys that collect sensitive demographic information at the very end, much of this is collected at the very outset of the CCHS. In addition the person is asked to provide his/her name, the names of all the other people living in the residence, and his/her date of birth.

198
Appendix D: United States State/Territorial Adult Prevalence Studies of Problem Gambling
1 Location ARIZONA
Year Study Conducted 2002-2003
Age 18+
Source(s) Volberg, R.A. (2003). Gambling and Problem Gambling in Arizona. Report to the Arizona Lottery. Northampton, MA: Gemini Research.
Sample Size 2,750
Sampling Strategy Quotas for gender and region of the state; minimum of 6 contact attempts; random selection within household.
Survey Description "survey for the State of Arizona about people's attitudes toward gambling"
Administration Method telephone interview
Response Rate 56%
Weighting By age and ethnicity to account for under-representation of younger adults and Hispanics. Details in Table 3: Demographics of Sample (p. 9). Note: Unweighted data used for NODS analysis.
Threshold for PG Questions ever gambled in lifetime
Assessment Instrument SOGS-PY & SOGS-L; DSM-IV-PY & DSM-IV-L (NODS)
Gambling Availability 9,044 EGMs in 2002. Population in 2002 was 5,456,453. People per EGM
= 603.
Past Year Gambling Prevalence 69.4% (Lifetime = 89%)
Problem Gambling Prevalence
SOGS-PY: 1.6% (3-4); 0.7% (5+); 2.3% combined SOGS-L: 3.6% (3-4); 1.9% (5+); 5.5% combined DSM-IV-PY: 0.7% (3-4); 0.3% (5+); 1.0% combined DSM-IV-L: 1.6% (3-4); 0.5% (5+); 2.1% combined
Standardized Problem Gambling Prevalence
SOGS-PY: 2.3 * .72 * 1.44 * .76 = 1.8% DSM-IV-PY: 1.0 * 1.19 * 1.44 * .76 = 1.3% Average: 1.6%
Demographic Correlates of PG Hispanics; disabled; unemployed
Game Correlates of PG EGMs; casinos; wagering privately
Comments 6% of the interviews (n=157) were conducted in Spanish; Lifetime problem gamblers significantly more likely to be male and have military experience.

199
2 Location CALIFORNIA
Year Study Conducted 1990
Age 18+
Source(s) Volberg, R.A. (1994). The prevalence and demographics of pathological gamblers: Implications for public health. American Journal of Public Health, 84, 237-241
Sample Size 1,250
Sampling Strategy Stratified to proportionally represent county populations on the basis of 1980 census figures. Random-digit dialing and random selection of respondents within households.
Survey Description
Administration Method telephone interview
Response Rate Refusal rate = 27%
Weighting No
Threshold for PG Questions gambled in lifetime
Assessment Instrument SOGS-L
Gambling Availability EGM availability unavailable
Past Year Gambling Prevalence (Lifetime = 89%)
Problem Gambling Prevalence 2.9% (3-4); 1.2% (5+); 4.1% combined
Standardized Problem Gambling Prevalence
4.1 * .72 * .60 * 1.59 * .74 = 2.1%
Demographic Correlates of PG male; non-White; less education
Game Correlates of PG larger number of games; cards; horse and dog races; games of skill; dice games; sports betting
Comments

200
3 Location CALIFORNIA
Year Study Conducted 2005-2006
Age 18+
Source(s)
Volberg, R.A., Nysse-Carris, K.L., & Gerstein, D.R. (2006). 2006 California Problem Gambling Prevalence Survey. Submitted to California Department of Alcohol and Drug Programs Office of Problem and Pathological Gambling.
Sample Size 7,121
Sampling Strategy
Random-digit-dialing; English or Spanish; interpreters used to interview eligible respondents who were unable to complete the interview in these two languages; strenuous efforts made to recruit a fully representative sample of California residents into the survey, including several mailings of advance and refusal conversion letters.
Survey Description "Your household has been selected at random to be part of the California Gambling and Health Study" (verbal consent script). Complete script available in report Appendices (pp. 62-63)
Administration Method telephone interview
Response Rate 47.2%
Weighting Yes - weighted to adjust for differences in household size and to reflect the known demographic characteristics of the population. Details in Table 2: Demographics of Achieved and Weighted Samples (p. 27).
Threshold for PG Questions ever gambled in lifetime
Assessment Instrument DSM-IV-PY & DSM-IV-L (NODS)
Gambling Availability 50,599 EGMs in 2004. Population in 2005 was 36,132,147. People per EGM = 714.
Past Year Gambling Prevalence 57.6%
Problem Gambling Prevalence DSM-IV-PY: 0.9% (3-4); 0.4% (5+); 1.3% combined DSM-IV-L: 2.2% (3-4); 1.5% (5+); 3.7% combined
Standardized Problem Gambling Prevalence
1.3 * 1.19 * 1.44 * .76 = 1.7%
Demographic Correlates of PG males; young adults; African Americans and individuals belonging to racial and ethnic groups classified as ’other’; disabled; unemployed
Game Correlates of PG Internet gambling; card room gambling
Comments
Although participation by Asian and Hispanic respondents was low, the overall size of the study means that the survey includes the largest samples of Hispanics (N=1,569) and Asians (N=504) ever interviewed for a problem gambling prevalence survey in the United States.

201
4 Location COLORADO
Year Study Conducted 1997
Age 18+
Source(s) Volberg, R.A. (1997). Gambling and Problem Gambling in Colorado. Report to the Colorado Department of Revenue.
Sample Size 1,810
Sampling Strategy
"Random selection of households and random selection of respondents within households; After completing approximately 900 interviews, began screening for male respondents in eligible households in order to obtain adequate representation of men in the sample. Once the required 900 men was reached, screening efforts were stopped; Colorado sample is representative of the population in terms of gender, age and residence."
Survey Description "survey of people in your community for the State of Colorado concerning the gambling practices of Colorado Citizens"
Administration Method telephone interview
Response Rate 44%
Weighting
"No (‘After checking the impact of weighting the sample by ethnicity on key variables, including the prevalence of problem and pathological gambling, and given the relatively small difference of three percentage points between sample and census data, we elected not to apply weights to the Colorado sample.’)"
Threshold for PG Questions had ever gambled
Assessment Instrument SOGS-PY & SOGS-L; DSM-IV-PY (DSM-IV-MR-PY)
Gambling Availability 16,266 EGMs in 1999. Unknown number in 1997.
Past Year Gambling Prevalence 81%
Problem Gambling Prevalence SOGS-PY: 1.8% (3-4); 0.7% (5+); 2.5% combined SOGS-L: 4.4% (3-4); 1.8% (5+); 6.2% combined DSM-IV-PY: 1.7% (3-4); 0.5% (5+); 2.2% combined
Standardized Problem Gambling Prevalence
SOGS-PY: 2.5 * .72 * 1.44 * .76 = 2.0% DSM-IV-PY: 2.2 * 1.19 * 1.44 * .76 = 2.9% Average = 2.4%
Demographic Correlates of PG Lifetime: male, under the age of 30; never married. Current: under the age of 30; less likely to have graduated from high school
Game Correlates of PG Bingo; pulltabs; casinos; lottery games
Comments

202
5 Location CONNECTICUT
Year Study Conducted 1977
Age 18+
Source(s) Abrahamson, M. & Wright, J.N. (1977). Gambling in Connecticut. Storrs, CT: Connecticut State Commission on Special Revenue.
Sample Size 568
Sampling Strategy
Multi-stage probability sample; 169 towns in Connecticut were stratified into two categories according to whether or not they were part of a standard metropolitan area (as defined by the Census Bureau); total of 15 towns randomly selected corresponding with their share of the State's population; sections of towns randomly selected using a topographical grid and enumeration map; within each town 50 homes (or dwelling units) were selected and numbered 1 to 50 in each town; interviewer sought to interview males in all even numbered houses and females in all odd numbered houses; The demographic characteristics of the sample and those of the entire State are, in general, highly congruent.
Survey Description "how people in Connecticut bet money."
Administration Method residential face-to-face interview
Response Rate
Weighting no
Threshold for PG Questions No threshold
Assessment Instrument
3-Questions Related to Gambling Debts & Excessive Gambling: (1) At times I have bet so much that I had to put off buying clothes; (2) I have never had to borrow money because of bets I have made; (3) People close to me sometimes criticize the amount of money that I bet. Agreement with statement (1) and (3), and disagreement with statement (2) can all be viewed as possibly indicative of excessive gambling.
Gambling Availability No EGMs in 1977.
Past Year Gambling Prevalence Figures only listed for 23 gambling formats. Most frequently engaged in was lottery -- "About one in five adults purchase a lottery ticket at least once a week, and nearly half participate monthly or more."
Problem Gambling Prevalence 10 persons out of 545 answered all three questions in a problem-suggestive manner. This implies that about 1.8% of the State's adults may potentially be compulsive gamblers.
Standardized Problem Gambling Prevalence
Demographic Correlates of PG young; separated or divorced; unskilled occupations
Game Correlates of PG jai-alai, off-track betting, dog racing
Comments

203
6 Location CONNECTICUT
Year Study Conducted 1986
Age 18+
Source(s)
Laventhol & Horwath, David Cwi & Associates, & Survey Research Associates, Inc. (1986). The Effects of Legalized Gambling on the Citizens of the State of Connecticut. Newington: State of Connecticut Division of Special Revenue.
Sample Size 1,224
Sampling Strategy Randomly selected listed telephone numbers
Survey Description
Administration Method telephone interview
Response Rate
Weighting age, gender
Threshold for PG Questions any past-year gambling
Assessment Instrument DSM-III-L (DIS-III)
Gambling Availability State lottery, jai alai, greyhound racing, off-track betting on horse races. No EGMs in 1986.
Past Year Gambling Prevalence 74%
Problem Gambling Prevalence 0.34% (endorsed first and two of remaining 3 questions)
Standardized Problem Gambling Prevalence
(0.34 * 2.6 * .60 * 1.44 * .76 = 0.6%)
Demographic Correlates of PG None reported (only 4 respondents classified as pathological gamblers)
Game Correlates of PG pari-mutuel bettors (jai alai, greyhound, horses at track, off-track betting or teletrack)
Comments
Results very tentative because of the unknown weighting factor that should be applied to the DIS-III and the fact that DIS only has 4 questions, whereas the DSM-III has 8 criteria. This study is not included in the tables or the analysis.

204
7 Location CONNECTICUT
Year Study Conducted 1991
Age 18+
Source(s)
Christiansen / Cummings Associates. (1992). Legal Gambling in Connecticut: Assessment of Current Status and Options for the Future. Report to the Connecticut Division of Special Revenue. Details available in Appendix C. and Section 2.6.3 of Problem Gambling in Connecticut which is part of the main report.
Sample Size 1,000
Sampling Strategy Random digit dialing proportionate to the number of residents in each of the eight counties in the State; random selection within household.
Survey Description legalized gambling in the state
Administration Method telephone interview
Response Rate
Weighting no
Threshold for PG Questions
Assessment Instrument SOGS-L
Gambling Availability Foxwoods Casino opens 1992
Past Year Gambling Prevalence 86%
Problem Gambling Prevalence 3.6% (3-4); 2.7% (5+); 6.3% combined
Standardized Problem Gambling Prevalence
6.3 * .72 *.60 * 1.59 * .74 = 3.2%
Demographic Correlates of PG male; under age 35 years; unmarried; household income less than $25,000.
Game Correlates of PG Off-track betting; casinos; pulltabs; football pools; bet with a bookie on a sports event.
Comments
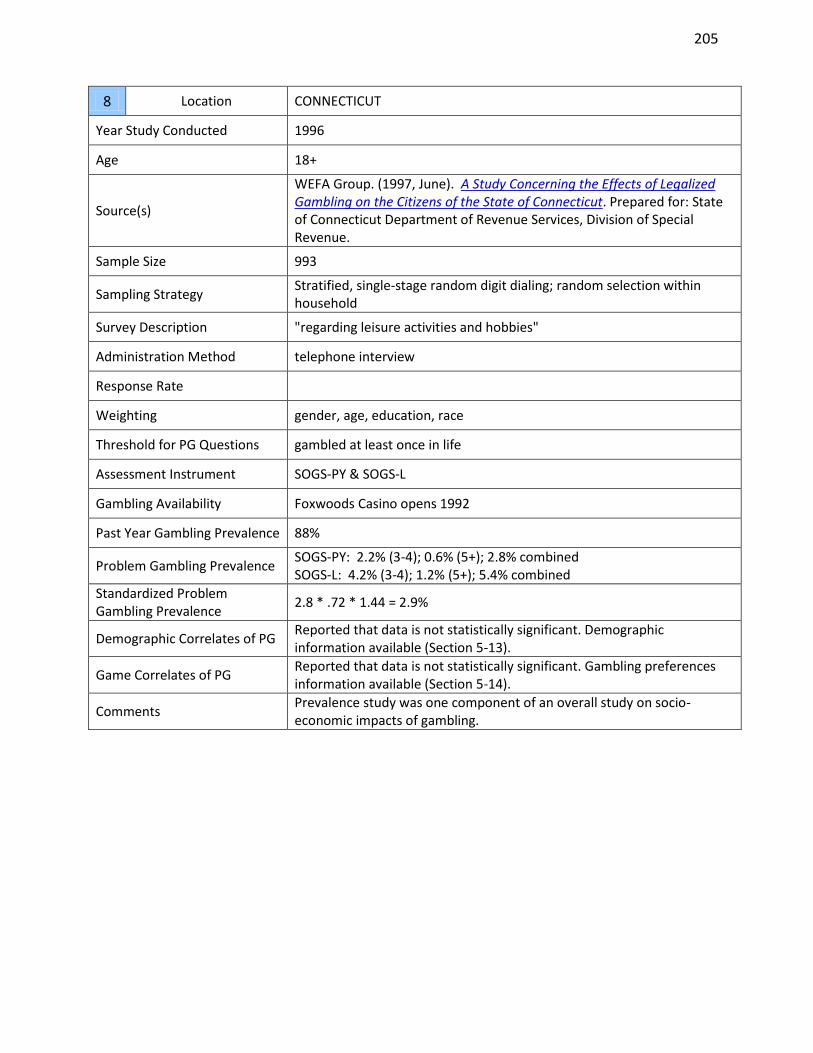
205
8 Location CONNECTICUT
Year Study Conducted 1996
Age 18+
Source(s)
WEFA Group. (1997, June). A Study Concerning the Effects of Legalized Gambling on the Citizens of the State of Connecticut. Prepared for: State of Connecticut Department of Revenue Services, Division of Special Revenue.
Sample Size 993
Sampling Strategy Stratified, single-stage random digit dialing; random selection within household
Survey Description "regarding leisure activities and hobbies"
Administration Method telephone interview
Response Rate
Weighting gender, age, education, race
Threshold for PG Questions gambled at least once in life
Assessment Instrument SOGS-PY & SOGS-L
Gambling Availability Foxwoods Casino opens 1992
Past Year Gambling Prevalence 88%
Problem Gambling Prevalence SOGS-PY: 2.2% (3-4); 0.6% (5+); 2.8% combined SOGS-L: 4.2% (3-4); 1.2% (5+); 5.4% combined
Standardized Problem Gambling Prevalence
2.8 * .72 * 1.44 = 2.9%
Demographic Correlates of PG Reported that data is not statistically significant. Demographic information available (Section 5-13).
Game Correlates of PG Reported that data is not statistically significant. Gambling preferences information available (Section 5-14).
Comments Prevalence study was one component of an overall study on socio-economic impacts of gambling.

206
9 Location CONNECTICUT
Year Study Conducted 2008
Age 18+
Source(s) Spectrum Gaming Group. (2009). Gambling in Connecticut: Analyzing the Economic and Social Impacts. Linwood, NJ: Author.
Sample Size 3,099 (2,298 Telephone + 801 Online Panel)
Sampling Strategy Random digit dialing; random selection within household; an additional 801 people participated through a separate online-panel survey; English and Spanish versions available.
Survey Description "survey for the State of Connecticut about people's attitudes toward gambling"
Administration Method telephone interview; self-administered online (Online Panel)
Response Rate Telephone: 35.6% (calculated using data from report using response rates calculations recommended by Williams & Volberg, 2011). Online Panel = 6%
Weighting Gender, education, age, ethnicity
Threshold for PG Questions
Assessment Instrument SOGS-PY & SOGS-L; DSM-IV-PY & DSM-IV-L (NODS)
Gambling Availability 13,697 s in 2008 clustered in two tribal casinos. Population in 2008 was 3,502,309. People per EGM = 256.
Past Year Gambling Prevalence 70% (Past year participation in illegal gambling = 33.2%)
Problem Gambling Prevalence
Telephone SOGS-PY: 0.9% (3-4); 0.7% (5+); 1.6% combined SOGS-L: 2.2% (3-4); 1.5% (5+); 3.7% combined DSM-IV-PY: 0.8% (3-4); 0.6% (5+); 1.4% combined DSM-IV-L: 2.1% (3-4); 1.2% (5+); 3.3% combined Online Panel SOGS-PY: 3.5% (3-4); 3.8% (5+); 7.3% combined SOGS-L: 4.5% (3-4); 4.5% (5+); 9.0% combined DSM-IV-PY: 3.4% (3-4); 2.1% (5+); 5.5% combined DSM-IV-L: 5.0% (3-4); 2.9% (5+); 7.9% combined
Standardized Problem Gambling Prevalence
Telephone SOGS-PY: 1.6 * .72 * 1.44 * .53 = 0.9% Telephone DSM-IV-PY: 1.4 * 1.19 * 1.44 * .53 = 1.3% Average = 1.1%
Demographic Correlates of PG male; 18-34 years old; some college education; urbanized counties of Hartford and New Haven
Game Correlates of PG
Comments Study is a socioeconomic impact investigation that included a prevalence study of gambling and problem gambling.

207
10 Location DELAWARE
Year Study Conducted 1998
Age 18+
Source(s) Mateja, W., Wilson, R., & Ableman, B. (1998). A Survey of Gambling in Delaware. Newark, DE: Health Services Policy Research Group, University of Delaware.
Sample Size 3,395
Sampling Strategy Random
Survey Description
Administration Method telephone interview
Response Rate 61%
Weighting age, race, gender
Threshold for PG Questions gambling at a frequency of once per month or more in the past 18 months
Assessment Instrument SOGS-Past 18 Months
Gambling Availability 2,498 EGMs in 1999. Population in 1998 was 744066. People per EGM = 298.
Past Year Gambling Prevalence 62% (past 18-months)
Problem Gambling Prevalence 2.17% (3-4); 0.68% (5+); 2.85% combined
Standardized Problem Gambling Prevalence
2.85 * .72 * 1.44 *.76 = 2.2%
Demographic Correlates of PG African-American; male; divorced; single; employed less than full time; household with an income of under $40,000.
Game Correlates of PG
Comments

208
11 Location DELAWARE
Year Study Conducted 1999-2000
Age 18+
Source(s)
Health Services Policy Research Group, School of Urban Affairs and Public Policy, University of Delaware (2002). The Costs and Consequences of Gambling in the State of Delaware. Prepared for the State of Delaware, Health and Social Services, Division of Substance Abuse and Mental Health.
Sample Size 2,638
Sampling Strategy
Survey Description
Administration Method telephone interview?
Response Rate
Weighting age, gender
Threshold for PG Questions
Assessment Instrument DSM-IV -L (NODS)
Gambling Availability 2,498 EGMs in 1999. Population in 1999 was 753,538. People per EGM = 302.
Past Year Gambling Prevalence 72.3%
Problem Gambling Prevalence 0.4% (3-4); 0.3% (5+); 0.7% combined
Standardized Problem Gambling Prevalence
0.7 * 1.19 * .6 * 1.59 * .76 = 0.60%
Demographic Correlates of PG males; ages 18 – 24; female between the ages of 45 and 64
Game Correlates of PG
Comments
Purpose of this report was to study the social costs of gambling; The prevalence of problem gambling in Delaware is estimated from two recent surveys, both conducted by the University of Delaware (High Risk Geographic Area Survey, University of Delaware, 1999; Young Adult Survey, University of Delaware, 2000). The combined surveys are referred to as the Delaware Gambling Survey. Note: The High Risk Area Study included individuals aged 18 years and over who resided in ZIP-Code areas that were at high risk for alcohol and drug problems.

209
12 Location FLORIDA
Year Study Conducted 2001
Age 18+
Source(s) Shapira, N.A., Ferguson, M.A., Frost-Pineda, K., & Gold, M.S. (2002). Gambling and Problem Gambling Prevalence Among Adults in Florida. A Report to the Florida Council on Compulsive Gambling, Inc.
Sample Size 1,504
Sampling Strategy Random digit dialing; 6 contact attempts; random selection within household
Survey Description "gambling practices among Florida residents"
Administration Method telephone interview
Response Rate 32.5% (calculated from response rate criteria recommended by Williams & Volberg, 2011).
Weighting age, gender
Threshold for PG Questions Participated in at least one form of gambling in lifetime and spending more than $12 on gambling in some year.
Assessment Instrument SOGS-PY & SOGS-L; DSM-IV-PY & DSM-IV-L (NODS)
Gambling Availability 11,549 EGMs in 2002. Population was 16,396,515 in 2001. People per EGM = 1420.
Past Year Gambling Prevalence 71%
Problem Gambling Prevalence
SOGS-PY: 1.4% (3-4); 0.6% (5+); 2.0% combined SOGS-L: 2.6% (3-4); 1.0% (5+); 3.6% combined DSM-IV-PY: 0.4% (3-4); 0.7% (5+); 1.1% combined DSM-IV-L: 0.6% (3-4); 1.0% (5+); 1.6% combined
Standardized Problem Gambling Prevalence
SOGS-PY: 2.0 * .72 * 1.44 * .53 = 1.1% DSM-IV-PY: 1.1 * 1.19 * 1.44 * .53 =1.0% Average = 1.05%
Demographic Correlates of PG males; ages 18-29 and ages 50-65; Hispanics; African-Americans; never married; high school degree or less; females ages 50-54; tobacco use; alcohol use and abuse; depression.
Game Correlates of PG Policy/numbers/Bolita; cock or dog fighting; games of skill for money; EGMs
Comments

210
13 Location GEORGIA
Year Study Conducted 1994
Age 18+
Source(s)
Volberg, R.A. (1995). Gambling and Problem Gambling in Georgia. Report to the Georgia Department of Human Resources. With contribution by J. Boles. Volberg, R.A., Reitzes, D.C., & Boles, J. (1997). Exploring the links between gambling, problem gambling and self-esteem. Deviant Behavior, 18, 321-342.
Sample Size 1,550
Sampling Strategy
Stratified to proportionally represent county populations, based on the 1990 census. Random sampling of households and random selection of respondents within households; Up to 12 attempts were made to contact each number, and a minimum of eight callbacks were made to complete an interview with each respondent; When compared with information from the 1990 census, the sample was found to be representative of the adult population of Georgia in terms of gender, race, age, marital status, and income. However, individuals with less than a high school education were significantly underrepresented in the sample.
Survey Description “gambling practices of the citizens of Georgia”
Administration Method telephone interview
Response Rate 73%
Weighting No - analysis of the prevalence rates after weighting the sample by education did not produce significant changes. The data presented are based on the unweighted sample.
Threshold for PG Questions Any gambling
Assessment Instrument SOGS-PY & SOGS-L
Gambling Availability No EGMs in Georgia in 1999.
Past Year Gambling Prevalence 74%
Problem Gambling Prevalence SOGS-PY: 1.5% (3-4); 0.8% (5+); 2.3% combined SOGS-L: 2.8%; (3-4); 1.6% (5+); 4.4% combined
Standardized Problem Gambling Prevalence
2.3 * .72 * 1.59 * .74 = 1.9%
Demographic Correlates of PG non-White, male, young, and single; no differences in education or income; lower self-esteem
Game Correlates of PG
Comments

211
14 Location GEORGIA
Year Study Conducted 2000
Age 18+
Source(s)
Emshoff, J.G., Broomfield, K., & Arganza, G. (2000). The Prevalence and Nature of Gambling in Georgia: A Population Survey. Report to the Georgia Department of Human Resources. Atlanta, Georgia State University. Emshoff, J., Anthony, E., Lippy, C., Valentine, L. (2007). Gambling Survey for the Georgia Department of Human Resources. Atlanta, GA: Georgia State University. September 2007.
Sample Size
Sampling Strategy Perhaps the same as done in 2007 by the same group.
Survey Description
Administration Method telephone interview
Response Rate 42%
Weighting
Threshold for PG Questions
Assessment Instrument SOGS-PY & SOGS-L
Gambling Availability No EGMs in 1999. 130 EGMs in 2002.
Past Year Gambling Prevalence 69% lifetime
Problem Gambling Prevalence SOGS-PY: 2.4% (3+) SOGS-L: 5.0% (3+)
Standardized Problem Gambling Prevalence
2.4 * .72 * 2.18 * .51 = 1.9%
Demographic Correlates of PG Male; under 35; nonwhite; income < $35K
Game Correlates of PG
Comments

212
15 Location GEORGIA
Year Study Conducted 2007
Age 18+
Source(s) Emshoff, J., Anthony, E., Lippy, C., Valentine, L. (2007). Gambling Survey for the Georgia Department of Human Resources. Atlanta, GA: Georgia State University. September 2007.
Sample Size 1,602
Sampling Strategy
random list of telephone numbers; stratified by gender, ethnicity, education, and income; random selection within household; up to five attempts were made to contact each number before the number was dropped from the list of available numbers; eligibility criteria included English-speaking, and a working household phone
Survey Description
Administration Method telephone interview
Response Rate 22%
Weighting
Threshold for PG Questions Not indicated; report indicates "If participants stated that they had ever wagered money or anything of value on these activities, they were asked the frequency with which they engaged in the activity."
Assessment Instrument DSM-IV-PY & DSM-IV-L (NODS)
Gambling Availability 130 EGMs in 2006. Population in 2007 was 9,544,750. People per EGM = 73,421.
Past Year Gambling Prevalence 85%
Problem Gambling Prevalence DSM-IV-PY: 1.1% (3-4); 0.4% (5+); 1.5% combined DSM-IV-L: 2.6% (3-4); 1.4% (5+); 4.0% combined
Standardized Problem Gambling Prevalence
1.5 * 1.19 * 1.44 * .53 = 1.4%
Demographic Correlates of PG
males, non-white, under age 30; less than a high school education; earn less than $25,000 a year; multiple regression revealed that while the above characteristics were significantly associated with rates of pathological gambling, their relationship with the single characteristic of education level appears to be driving the effects.
Game Correlates of PG
Comments

213
16 Location INDIANA
Year Study Conducted 1990
Age 18+
Source(s)
Laventhol & Horwath, Guida, F.V., David Cwi & Associates, & Public Opinion Laboratory. (1990, November). A Study of Problem and Pathological Gambling among Citizens of Indiana associated with Participation in the Indiana State Lottery. Indianapolis, IN: Laventhol & Horwath.
Sample Size 1,015
Sampling Strategy Random digit dialing, with age and sex quotas by county
Survey Description "We are conducting a research project for the State of Indiana to find out how people feel about the lottery."
Administration Method telephone interview
Response Rate 44.4% (calculated from data contained in report)
Weighting No -- "It was not necessary to weight the responses since the sampling method assures a representative sample of [residents] over 18."
Threshold for PG Questions Participation in Indian Lottery gambling in past 12 months (i.e., purchased at least one ticket for the Instant, Lotto Cash or Daily Pick Games).
Assessment Instrument DSM-IV-L (using 9 of the criteria from the forthcoming DSM-IV). However, all of the questions were specific to lottery gambling (not gambling generally).
Gambling Availability Indiana lottery introduced Oct 1989. No EGMs in 1990.
Past Year Gambling Prevalence 60.2% (participated in Indiana Lottery in past 12 months); 34% played lottery in another state in past 12 months.
Problem Gambling Prevalence 0.8% (2+)
Standardized Problem Gambling Prevalence
see comments
Demographic Correlates of PG males; age 18 to 34
Game Correlates of PG N/A -- Only lottery-related questions asked.
Comments
This study was described by Lesieur (p. 275; 1999) as being conducted "to find out how many adult Indiana residents were pathological lottery players."; "The survey did not count individuals who had gambling problems as a result of sports, casinos, horses, or other forms of gambling unless they also had an independent problem with lottery play." This study is not reported in the tables or included in the analyses.

214
17 Location INDIANA
Year Study Conducted 1998
Age
Source(s)
Westphal, J.R., Rush, J.A., & Stevens, L. (1998). Problem and Pathological Gambling Behaviors within Specific Populations in the State of Indiana. Shreveport, LA: Gambling Studies Unit, Department of Psychiatry, Louisiana State University Medical Center.
Sample Size 2,546 (Adult sample)
Sampling Strategy
Survey Description
Administration Method
Response Rate
Weighting
Threshold for PG Questions
Assessment Instrument SOGS-PY
Gambling Availability 14,749 EGMs in 1999. Population in 1998 was 5,907,617. People per EGM = 401.
Past Year Gambling Prevalence
Problem Gambling Prevalence 5.3% (1-4); 0.8% (5+); 6.1% combined
Standardized Problem Gambling Prevalence
0.8 * 1.49 = 1.2%
Demographic Correlates of PG N/A - rates of pathological gambling too low to determine rates among adult members of minority groups or among different types of gamblers
Game Correlates of PG N/A - rates of pathological gambling too low to determine rates among adult members of minority groups or among different types of gamblers
Comments

215
18 Location INDIANA
Year Study Conducted 2005
Age 21-59
Source(s) Rodak, A. & Wolf, J. (2005). Gaming and Betting by Adults, Age 21-59, in Indiana – 2005. Indianapolis, IN: Indiana University - Purdue University Survey Research Center.
Sample Size 751
Sampling Strategy
Random selection within household; 10 contact attempts; the respondents that resulted from this approach were found to be representative of the population of Indiana, age 21-59 years old, based on recent Census findings for Indiana.
Survey Description "...to discuss some important issues regarding older adults in Indiana. State officials have asked us to help determine the attitudes and behavior of people regarding gaming and betting of all types."
Administration Method telephone interview
Response Rate 33.1%
Weighting
Threshold for PG Questions gambled in the past year
Assessment Instrument DSM-IV
Gambling Availability 17,772 EGMs in 2004. Population in 2005 was 6,271,973. People per EGM = 353.
Past Year Gambling Prevalence 65% (90% Lifetime)
Problem Gambling Prevalence N/A - So few respondents responded positively to any of the symptoms it was determined that this approach was not an effective measure of problem gambling.
Standardized Problem Gambling Prevalence
Demographic Correlates of PG N/A
Game Correlates of PG N/A
Comments There were separate but related reports for "60 Year Olds and Older" and "12-20 Year Olds".

216
19 Location IOWA
Year Study Conducted 1989
Age 18+
Source(s) Volberg, R A. (1994). The prevalence and demographics of pathological gamblers: Implications for public health. American Journal of Public Health, 84, 237-241.
Sample Size 750
Sampling Strategy Stratified to proportionally represent county populations on the basis of 1980 census figures. Random-digit dialing and random selection of respondents within households were used.
Survey Description “a study of the gambling practices of the citizens of Iowa”
Administration Method telephone interview
Response Rate (Refusal rate = 24%)
Weighting No
Threshold for PG Questions any lifetime gambling
Assessment Instrument SOGS-L
Gambling Availability Lottery introduced in 1985; riverboat gambling in 1989
Past Year Gambling Prevalence (Lifetime = 84%)
Problem Gambling Prevalence 1.6% (3-4); 0.1% (5+); 1.7% combined
Standardized Problem Gambling Prevalence
1.7 * .72 * .60 * 1.59 * .74 = 0.9%
Demographic Correlates of PG male; lower education; unmarried
Game Correlates of PG wagering on cards, horse and dog races, games of skill, dice games, and sports
Comments

217
20 Location IOWA
Year Study Conducted 1995
Age 18+
Source(s) Volberg, R.A. (1995). Gambling and Problem Gambling in Iowa: A Replication Survey. Des Moines, IA: Iowa Department of Human Services.
Sample Size 1,500
Sampling Strategy
Sample stratified to proportionally represent county populations, males and young adults in Iowa on the basis of 1990 census figures; random selection of households and random selection of respondents within households used for first two-thirds of interviews; after approximately 1,000 interviews, interviewers began screening potential respondents to identify males between the ages of 18 and 29; up to five attempts made to contact each number; respondents with lower levels of education and income are somewhat under-represented.
Survey Description "study of the gambling practices of the citizens of Iowa"
Administration Method telephone interview
Response Rate 57%
Weighting
No - Note: To determine if education or income discrepancies contributed significantly to estimates of the prevalence of problem gambling in Iowa, prevalence rates were analyzed after weighting the sample by education and then by income. These analyses increased prevalence BUT were not used in order to maintain comparability with results from the 1989 survey.
Threshold for PG Questions
Assessment Instrument SOGS-PY & SOGS-L
Gambling Availability Lottery introduced in 1985; riverboat gambling in 1989
Past Year Gambling Prevalence 72% (Lifetime = 88%)
Problem Gambling Prevalence SOGS-PY: 2.3% (3-4); 1.0% (5+); 3.3% combined SOGS-L: 3.5% (3-4); 1.9% (5+); 5.4% combined
Standardized Problem Gambling Prevalence
3.3 * .72 * 1.59 * .74 = 2.8%
Demographic Correlates of PG male; under the age of 30; non-Caucasian; unmarried
Game Correlates of PG continuous types of gambling
Comments Replication of 1989 study.

218
21 Location IOWA
Year Study Conducted 2011 (Feb – May)
Age 18+
Source(s)
Gonnerman, M.E. & Lutz, G.M. (2011). Gambling Attitudes and Behaviors: A 2011 Survey of Adult Iowans. Cedar Falls, IA: Center for Social and Behavioral Research, University of Northern Iowa. September 2011.
Sample Size 1,700
Sampling Strategy
Invitation letters mailed out to 10,000 residential addresses. Adult with most recent birthday asked to complete the questionnaire online. Telephone follow-up calls made (when a telephone number was available) to household that did not respond.
Survey Description “attitudes and experiences of Iowans regarding gambling”
Administration Method 470 online completions; 1,230 (72.4%) telephone completions
Response Rate 17%
Weighting Household size, age, gender
Threshold for PG Questions none
Assessment Instrument CPGI; DSM-IV-PY & DSM-IV-L (NODS); self-report of problems
Gambling Availability 15,547 EGMs in 2010. Population in 2011 was 3,062,309. People per EGM = 197.
Past Year Gambling Prevalence 69%
Problem Gambling Prevalence
CPGI: 2.6% (3-7); 0.6% (8+); 3.2% combined DSM-IV-PY: 0.2% (3-4); 0.3% (5+); 0.5% combined DSM-IV-L: 0.6% (3-4); 0.6% (5+); 1.2% combined Self-Report-PY: 0.5% Self-Report-L: 2%
Standardized Problem Gambling Prevalence
CPGI: 3.2 * .58 * 1.44 * .53 = 1.42% DSM-IV-PY: 0.5 * 1.19 * 1.44 *.53 = .45% Average = 0.94%
Demographic Correlates of PG Males; age 18-34; high interest is several other leisure/recreational activities; tobacco and alcohol use and dependence
Game Correlates of PG EGMs; casino table games; keno; Internet gambling; horse racing; bingo; games of personal skill
Comments

219
22 Location KENTUCKY
Year Study Conducted 2003
Age 18+
Source(s) Kentucky Legislative Research Commission. (2003). Compulsive Gambling in Kentucky. Frankfort, KY: Author.
Sample Size 1,253
Sampling Strategy
Random digit dialing; random selection within household; to determine if the sample was representative of the general adult population in Kentucky, the demographics of the survey respondents were compared with data from the 2000 Census
Survey Description "purpose of this study is to help evaluate gambling behaviors"
Administration Method telephone interview
Response Rate 51.6%
Weighting gender, age
Threshold for PG Questions gambled in the past year
Assessment Instrument DSM-IV-PY
Gambling Availability No EGMs in Kentucky in 2002.
Past Year Gambling Prevalence 55.1%
Problem Gambling Prevalence 0.7% (3-4); 0.5% (5+); 1.2% combined
Standardized Problem Gambling Prevalence
1.2 * 1.19 * 1.44 * .76 = 1.6%
Demographic Correlates of PG
Game Correlates of PG
(From the separate GA study included in the report) -- Table 4.2 (p. 44) lists the types of gambling GA respondents deemed to cause them the most serious problems. Casino/EGMs and horse racing/off-track betting were listed as the types of gambling most respondents stated caused serious problems.
Comments A survey of Gamblers Anonymous (GA) respondents was conducted as part of this study.

220
23 Location KENTUCKY
Year Study Conducted 2008
Age 18+
Source(s) Kentucky Council on Problem Gambling. (2009). Gambling in Kentucky: A Research Report on the Prevalence of Gambling among Kentucky Residents. Frankford, KY: Author.
Sample Size 850 (Note: Also reported as 846 within report)
Sampling Strategy Random digit dialing; to assess the representativeness of the general adult population in Kentucky, the demographics of the survey respondents were compared with data from the 2000 Census
Survey Description
Administration Method telephone interview
Response Rate 43.5%
Weighting gender, age, race
Threshold for PG Questions
Assessment Instrument DSM-IV-L
Gambling Availability No EGMs in Kentucky in 2008.
Past Year Gambling Prevalence (Lifetime = 55.3%)
Problem Gambling Prevalence DSM-IV-L: 1.7% (3-4); 0.3% (5+); 2.0% combined
Standardized Problem Gambling Prevalence
2.0 * 1.19 * 0.60 * 1.44 * .53 = 1.1%
Demographic Correlates of PG males; 18-24 years of age; Blacks and other racial minorities; never married, divorced or separated; employed adults; individuals in residing in households with incomes of $25,000 or less
Game Correlates of PG
Comments

221
24 Location LOUISIANA
Year Study Conducted 1995
Age 18+
Source(s)
Louisiana Compulsive Gambling Study Committee (1996). Report to the Legislature of the State of Louisiana. Baton Rouge, LA: Author. Westphal, J. R. & Rush, J. (1996). Pathological gambling in Louisiana: An epidemiological perspective. Journal of the Louisiana State Medical Society, 148, 353-358.
Sample Size 1,818
Sampling Strategy random sample
Survey Description “the wagering practices of the citizens here in Louisiana ”
Administration Method telephone interview
Response Rate 40%
Weighting No – in order to maintain comparability with surveys in other states where the data have not been weighted.
Threshold for PG Questions any lifetime gambling
Assessment Instrument SOGS-PY & SOGS-L
Gambling Availability 17,038 EGMs in 1999. Unknown number in 1995.
Past Year Gambling Prevalence 72.3%
Problem Gambling Prevalence SOGS-PY: 3.4% (3-4); 1.4% (5+); 4.8% combined SOGS-L: 4.5% (3-4); 2.5% (5+); 7.0% combined
Standardized Problem Gambling Prevalence
4.8 * .72 * 2.18 * .51 = 3.8%
Demographic Correlates of PG male, under the age of 30, non-Caucasian, unmarried, less likely to have graduated from high-school.
Game Correlates of PG The Louisiana survey found two clusters of pathological gamblers: First, an older male population who primarily wagered on horse racing and a younger male population who primarily wagered on video poker.
Comments Some details (e.g., prevalence measures) of the 1995 study reported in 1998 replication study.

222
25 Location LOUISIANA
Year Study Conducted 1998
Age 18+
Source(s) Volberg, R.A., & Moore, W.L. (1999). Gambling and Problem Gambling in Louisiana: A Replication Study, 1995 to 1998. Report to the College of Business Administration, University of New Orleans.
Sample Size 1,800
Sampling Strategy
Stratified to proportionally represent the eight parish-regions in the state as well as males and females on the basis of the most recent information from the U.S. Bureau of the Census; random selection of households; random selection of respondent within households; up to 5 callbacks.
Survey Description "gambling practices of Louisiana citizens"
Administration Method telephone interview
Response Rate 58.6% (CASRO approach)
Weighting No -- but effects of weighting were examined and effects were small.
Threshold for PG Questions gambled in lifetime
Assessment Instrument SOGS-PY & SOGS-L; DSM-IV-PY (DSM-IV-MR-PY)
Gambling Availability 17,038 EGMs in 1999. Population in 1998 was 4,362,758. People per EGM = 256.
Past Year Gambling Prevalence 61.5%
Problem Gambling Prevalence SOGS-PY: 2.3% (3-4); 1.6% (5+); 3.9% combined SOGS-L: 3.3% (3-4); 2.5% (5+); 5.8% combined DSM-IV-PY: 1.9% (3-4); 0.9% (5+); 2.8% combined
Standardized Problem Gambling Prevalence
SOGS-PY: 3.9 * .72 * 1.59 * .74 = 3.3% DSM-IV-PY: 2.8 * 1.19 * 1.59 * .74 = 3.9% Average = 3.6%
Demographic Correlates of PG Age 18-24 and those aged 35-44; Black and Hispanics; never married; separated or divorced; not graduated from high school or from college.
Game Correlates of PG horse bettors; EGMs
Comments

223
26 Location LOUISIANA
Year Study Conducted 2002
Age 18+
Source(s) Vogel, R.J., & Ardoin, P. (2002). Gambling in Louisiana: 2002 Louisiana Study of Problem Gambling. Baton Rouge, LA: Nelson Mandela School of Public Policy, Southern University.
Sample Size 1,353
Sampling Strategy Modified stratified sample was designed that ensured that at least 100 adults in each region would be randomly interviewed.
Survey Description "gambling practices of Louisiana citizens"
Administration Method telephone interview
Response Rate
Weighting
Threshold for PG Questions gambled in lifetime
Assessment Instrument SOGS-L
Gambling Availability 27,584 EGMs in 2002. Population in 2002 was 4,482,646. People per EGM = 163.
Past Year Gambling Prevalence Lifetime participation = 67.7%
Problem Gambling Prevalence 3.0% (3-4); 1.6% (5+); 4.6% combined
Standardized Problem Gambling Prevalence
4.6 * .72 * .51 * 1.59 * .74 = 2.7%
Demographic Correlates of PG
Game Correlates of PG Density of gambling venues per capita.
Comments

224
27 Location LOUISIANA
Year Study Conducted 2008
Age 18+
Source(s) Esters, I., Biggar, R., Lacour, J., & Reyes, M. (2008). 2008 Louisiana Study on Problem Gambling. Prepared for the Louisiana Office for Addictive Disorders.
Sample Size 2,400
Sampling Strategy 240 participants from each of 10 geographical regions; participants contacted randomly via telephone from a list of telephone numbers purchased for the study
Survey Description "a random study of practices of Louisiana residents with regard to gambling"
Administration Method telephone interview
Response Rate
Weighting
Threshold for PG Questions gambled in lifetime
Assessment Instrument SOGS-L
Gambling Availability 29,149 EGMs in 2008. Population in 2008 was 4,410,796. People per EGM = 151.
Past Year Gambling Prevalence Table 7.13. Frequency of Participation in Various Types of Gambling – State (p. 42) provides general participation by gambling format details.
Problem Gambling Prevalence SOGS-L: 1.7% (3-4); 1.4% (5+); 3.1% combined
Standardized Problem Gambling Prevalence
3.1 * .72 * .51 * 1.59 * .74 = 1.3%
Demographic Correlates of PG
Game Correlates of PG
Comments
Information garnered from calls to the Gambling Helpline (n = 59,250 calls) and the Louisiana Problem Gambler Helpline Fiscal Year Report (2007) was also used to supplement the report; Responses from the Louisiana Caring Communities Youth Survey, a survey of 106,356 Louisiana students in grades 6, 8, 10 and 12, were incorporated as data into the present study.

225
28 Location MARYLAND
Year Study Conducted 1988
Age 18+
Source(s) Volberg, R.A. (1994). The prevalence and demographics of pathological gamblers: Implications for public health. American Journal of Public Health, 84, 237-241.
Sample Size 750
Sampling Strategy Stratified to proportionally represent county populations on the basis of 1980 census figures. Random-digit dialing and random selection of respondents within households were used.
Survey Description ”gambling practices of the citizens of Maryland”
Administration Method telephone interview
Response Rate Refusal rate = 34%
Weighting No
Threshold for PG Questions any lifetime gambling
Assessment Instrument SOGS-L
Gambling Availability No EGMs in Maryland in 1999.
Past Year Gambling Prevalence (Lifetime = 89%)
Problem Gambling Prevalence SOGS-L: 2.4% (3-4); 1.5% (5+); 3.9% combined
Standardized Problem Gambling Prevalence
3.9 * .72 * .60 * 1.59 * .74 = 2.0%
Demographic Correlates of PG male; non-White; lower education; unmarried
Game Correlates of PG wagering on cards, horse and dog races, games of skill, dice games, and sports
Comments

226
29 Location MARYLAND
Year Study Conducted 2010
Age 18+
Source(s) Shinogle, J., Volberg, R.A., Park, D., Norris, D.F., Haynes, D., & Stokan, E. (2011). Gambling Prevalence in Maryland: A Baseline Analysis. Baltimore, MD: Maryland Institute for Policy Analysis & Research.
Sample Size 5,975
Sampling Strategy Stratified to represent the population of the four regions of the state. Random-digit dialing and random selection of respondents within households were used.
Survey Description “we are conducting a survey in the State of Maryland about people’s views on gambling”
Administration Method telephone interview
Response Rate 18.6% (CASRO)
Weighting gender, age, ethnicity
Threshold for PG Questions gambled 5 or more times in lifetime
Assessment Instrument DSM-IV-L (NODS)
Gambling Availability 1,500 EGMs in 2010. Population in 2010 was 5,773,552. People per EGM = 3849.
Past Year Gambling Prevalence 70.6%
Problem Gambling Prevalence 1.9% (3-4); 1.5% (5+); 3.4% combined
Standardized Problem Gambling Prevalence
3.4 * 1.19 * .60 * 1.44 * .53 = 1.9%
Demographic Correlates of PG under 30 years of age; male; African Americans; lower income; lower education
Game Correlates of PG EGMs, wagering on private games and sports, Internet gambling
Comments

227
30 Location MASSACHUSETTS
Year Study Conducted 1989
Age 18+
Source(s) Volberg, R.A. (1994). The prevalence and demographics of pathological gamblers: Implications for public health. American Journal of Public Health, 84, 237-241.
Sample Size 750
Sampling Strategy Stratified to proportionally represent county populations on the basis of 1980 census figures. Random-digit dialing and random selection of respondents within households were used.
Survey Description ”gambling practices of the citizens of Massachusetts”
Administration Method telephone interview
Response Rate Refusal rate = 31%
Weighting No
Threshold for PG Questions any lifetime gambling
Assessment Instrument SOGS-L
Gambling Availability No EGMs in Massachusetts in 1999.
Past Year Gambling Prevalence (Lifetime = 90%)
Problem Gambling Prevalence 2.1% (3-4); 2.3% (5+); 4.4% combined
Standardized Problem Gambling Prevalence
4.4 * .72 * .60 * 1.59 * .74 = 2.2%
Demographic Correlates of PG male; non-White; lower education; unmarried
Game Correlates of PG wagering on cards, horse and dog races, games of skill, dice games, and sports
Comments

228
31 Location MICHIGAN
Year Study Conducted 1997
Age 18+
Source(s) Gullickson, A. R., & Hartmann, D. (1997). Compulsive Gambling in Michigan: Final Report. Report to The Michigan Department of Community Health.
Sample Size 3,942
Sampling Strategy
Random-digit dialing; imposition of a screen to increase male respondents (corrected the gender representation issue to within 1.9 percentage points); however, underrepresentation of African-American respondents, of the lowest educational category (less than high school education), lowest income category (household income below $25,000)
Survey Description "a state-funded study of the gambling practices of Michigan residents"
Administration Method telephone interview
Response Rate 43%
Weighting Both weighted (race; income; education -- See Table 8. - p. 62) and unweighted estimates were produced.
Threshold for PG Questions gambled in lifetime
Assessment Instrument SOGS-PY & SOGS-L
Gambling Availability 9,167 EGMs in 1999. Unknown number of EGMs in 1997.
Past Year Gambling Prevalence 76.9%
Problem Gambling Prevalence SOGS-PY: 2.1% (3-4); 1.3% (5+); 3.4% combined SOGS-L: 3.2% (3-4); 2.0% (5+); 5.2% combined
Standardized Problem Gambling Prevalence
3.4 * .72 * 1.44 * .53 = 1.9%
Demographic Correlates of PG males; non-whites; younger respondents
Game Correlates of PG horse or dog race players; betting on cards, dice, or video poker outside of legal casinos
Comments

229
32 Location MICHIGAN
Year Study Conducted 1999
Age 18+
Source(s) Gullickson, A. R., Hartmann, D., & Wiersma, W. (1999). A Survey of Gambling Behaviors in Michigan, 1999. Report to The Michigan Department of Community Health.
Sample Size 1,717
Sampling Strategy
Random-digit dialing; imposition of a screen to increase male respondents; underrepresentation of African-American respondents, of the lowest education category (those with less than a high school education), and of the lowest income category (those reporting household incomes below $25,000).
Survey Description "The Michigan Legislature has asked us to survey Michigan citizens on gambling in the state"
Administration Method telephone interview
Response Rate 45%
Weighting No
Threshold for PG Questions gambled in lifetime
Assessment Instrument SOGS-PY & SOGS-L
Gambling Availability 9,167 EGMs in 1999. Population in 1999 was 9,897,116. People per EGM = 1080.
Past Year Gambling Prevalence 77.6%
Problem Gambling Prevalence SOGS-PY: 2.0% (3-4); 1.2% (5+); 3.2% combined SOGS-L: 3.1% (3-4); 1.8% (5+); 4.9% combined
Standardized Problem Gambling Prevalence
3.2 * .72 * 1.59 * .74 = 2.7%
Demographic Correlates of PG age (18-29) and race (Black)
Game Correlates of PG horse or dog race players; people who bet on cards, dice, or video poker outside of legal casinos
Comments

230
33 Location MICHIGAN
Year Study Conducted 2001
Age 18+
Source(s) Gullickson, A. R., & Hartmann, D. (2001). A Survey of Gambling Behaviors in Michigan, 2001. Report to The Michigan Department of Community Health.
Sample Size 1,211
Sampling Strategy Random-digit dialing; random selection within household; imposing a screen to increase male respondents; African Americans are underrepresented.
Survey Description "the Michigan Legislature has asked us to survey Michigan citizens on gambling in the state"
Administration Method telephone interview
Response Rate 35% (The response rate for the special sample of persons with an interest in gambling was 42 percent.)
Weighting No - "As we reported in the 1997 study, weighting does effect estimates of gambling problems in Michigan, though the magnitudes tend to be of a half a percentage point or less."
Threshold for PG Questions gambled in lifetime
Assessment Instrument SOGS-PY & SOGS-L
Gambling Availability 23,123 EGMs in 2002. Population in 2001 was 10,006,266. People per EGM = 433.
Past Year Gambling Prevalence 71.9%
Problem Gambling Prevalence SOGS-PY: 1.8% (3-4); 1.0% (5+); 2.8% combined SOGS-L: 2.8% (3-4); 1.7% (5+); 4.5% combined
Standardized Problem Gambling Prevalence
2.8 * .72 * 2.18 * .51 = 2.2%
Demographic Correlates of PG age (18-29) and race (Black)
Game Correlates of PG cards, dice, or video poker outside of legal casinos
Comments

231
34 Location MICHIGAN
Year Study Conducted 2006
Age 18+
Source(s) Hartmann, D. J. (2007). A Survey of Gambling Behaviors in Michigan, 2006. Kalamazoo, MI: Kercher Center for Social Research at the Western Michigan University for the Michigan Department of Community Health.
Sample Size 957
Sampling Strategy Random-digit dialing; the statewide sample under-represents males, minorities, and the youngest, least educated, and poorest residents of the state.
Survey Description
"People spend or bet money on a variety of things including lottery, charitable games such as raffles or church sponsored bingo, horse races, casinos, sports, cards and dice. We will ask you about whether you have ever participated in these activities and whether you have participated in the past 12 months. We will ask about the extent of your participation and how gambling affects other aspects of your life."
Administration Method telephone interview
Response Rate 29% (Refusal rate = 71%).
Weighting
No - A weighting procedure was used to produce a statewide sample of size 957 that is weighted to represent the adult population of Michigan at the county level; Weighted estimates are not reported because of their small effect and the lack of such practice in other studies.
Threshold for PG Questions gambled in lifetime
Assessment Instrument SOGS-PY & SOGS-L
Gambling Availability 23,039 EGMs in 2006. Population in 2006 was 10,095,643. People per EGM = 438.
Past Year Gambling Prevalence 70.9%
Problem Gambling Prevalence SOGS-PY: 1.1% (3-4); 0.9% (5+); 2.0% combined SOGS-L: 2.7% (3-4); 1.4% (5+); 4.1% combined
Standardized Problem Gambling Prevalence
2.0 * .72 * 2.18 * .51 = 1.6%
Demographic Correlates of PG Age (18-29) and race (Black) appear to have some correlation to incidence of higher scores on the SOGS (Table 5. - Percent in SOGS Grouping by Demographic Categories - p. 17).
Game Correlates of PG
Table 6. Percent Distribution of Current SOGS Score by Gambling Type in the Past Year (p. 18) provides details. Note: "small numbers of respondents for particular gambling activities make several of the estimates unreliable."
Comments

232
35 Location MINNESOTA
Year Study Conducted 1990
Age 18-74
Source(s)
Laundergan, J. C., Schaefer, J. M., Eckhoff, K. F., & Pirie, P. L. (1990). Adult Survey of Minnesota Gambling Behavior: A Benchmark, 1990. St. Paul: State of Minnesota Department of Human Services, Mental Health Division.
Sample Size 1,251
Sampling Strategy
Sample of 1,375 randomly selected households in the targeted areas was obtained from Survey Sampling, Inc.; Disproportionate random sample from the seven Twin Cities metro counties; Sample was intentionally weighted to include 45% households from St. Louis County, 10% Clay County, 45% Twin Cities Metropolitan Counties; nine counties total; one subject per household contacted; random selection within household.
Survey Description "short research survey concerning betting or games of chance in Minnesota"
Administration Method telephone interview
Response Rate 91%
Weighting Not indicated (other than to obtain stated percentages for geographic areas).
Threshold for PG Questions gambled in past year
Assessment Instrument
SOGS-PY (using the SOGS-M, which is a past-year measure with some wording changes to specific items: guilty -> bad; betting slips -> I.O.Us; questions about borrowing altered to single question with open-end response)
Gambling Availability No EGMs in Minnesota in 1990.
Past Year Gambling Prevalence 64%
Problem Gambling Prevalence 1.6% (3-4); 0.9% (5+); 2.5% combined
Standardized Problem Gambling Prevalence
2.5 * .72 * 1.44 * 1.00 = 2.6%
Demographic Correlates of PG males; non-whites; respondents under the age of 34
Game Correlates of PG pull tabs; bought lottery tickets outside of Minnesota; bingo, bet on a sporting event, and left Minnesota for casino games
Comments A separate adolescent prevalence survey took place at the same time.

233
36 Location MINNESOTA
Year Study Conducted 1994
Age 18-74
Source(s)
Emerson, M.O., Laundergan, J.C., & Schaefer, J.M. (1994). Adult Survey of Minnesota Problem Gambling Behavior; A Needs Assessment: Changes 1990 to 1994. St. Paul: State of Minnesota Department of Human Services, Mental Health Division. Emerson, M.O. & Laundergan, J.C. (1996). Gambling and problem gambling among adult Minnesotans: Changes 1990 to 1994. Journal of Gambling Studies, 12(3), 291-304. doi: http://dx.doi.org/10.1007/BF01539324
Sample Size 1,028
Sampling Strategy
Disproportionate random sample from the seven Twin Cities metro counties; ten counties total; Sample intentionally weighted to include 45% households from Twin Cities, 25% St. Louis County, 15% Clay County, 15% Olmsted County; Only one subject was interviewed per household contacted; random selection within household.
Survey Description "short survey concerning betting or games of chance in Minnesota"
Administration Method telephone interview
Response Rate 82%
Weighting Yes - to compensate for oversampling of nonmetro residents and females.
Threshold for PG Questions gambled in past year
Assessment Instrument SOGS-PY (SOGS-M)
Gambling Availability Unknown number of EGMs in Minnesota in 1994.
Past Year Gambling Prevalence 65%
Problem Gambling Prevalence 3.2% (3-4); 1.2% (5+); 4.4% combined
Standardized Problem Gambling Prevalence
4.4 * .72 * 1.44 * 1.00 = 4.6%
Demographic Correlates of PG less well-educated; divorced; never married (partly due to younger age of respondent with high SOGS-M scores); male; Native Americans
Game Correlates of PG
Comments
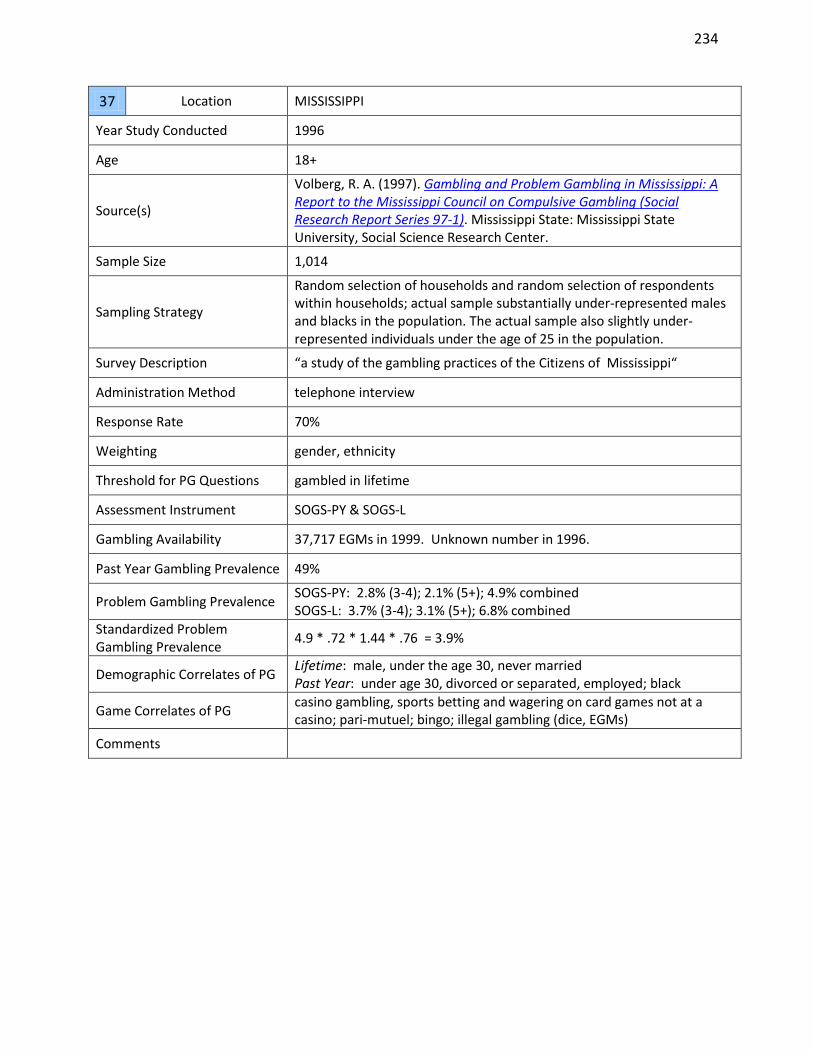
234
37 Location MISSISSIPPI
Year Study Conducted 1996
Age 18+
Source(s)
Volberg, R. A. (1997). Gambling and Problem Gambling in Mississippi: A Report to the Mississippi Council on Compulsive Gambling (Social Research Report Series 97-1). Mississippi State: Mississippi State University, Social Science Research Center.
Sample Size 1,014
Sampling Strategy
Random selection of households and random selection of respondents within households; actual sample substantially under-represented males and blacks in the population. The actual sample also slightly under-represented individuals under the age of 25 in the population.
Survey Description “a study of the gambling practices of the Citizens of Mississippi“
Administration Method telephone interview
Response Rate 70%
Weighting gender, ethnicity
Threshold for PG Questions gambled in lifetime
Assessment Instrument SOGS-PY & SOGS-L
Gambling Availability 37,717 EGMs in 1999. Unknown number in 1996.
Past Year Gambling Prevalence 49%
Problem Gambling Prevalence SOGS-PY: 2.8% (3-4); 2.1% (5+); 4.9% combined SOGS-L: 3.7% (3-4); 3.1% (5+); 6.8% combined
Standardized Problem Gambling Prevalence
4.9 * .72 * 1.44 * .76 = 3.9%
Demographic Correlates of PG Lifetime: male, under the age 30, never married Past Year: under age 30, divorced or separated, employed; black
Game Correlates of PG casino gambling, sports betting and wagering on card games not at a casino; pari-mutuel; bingo; illegal gambling (dice, EGMs)
Comments

235
38 Location MISSOURI
Year Study Conducted 1981
Age 18-96
Source(s)
Cunningham-Williams, R.M., Cottler, L.B., & Compton, W.M. (1998). Taking Chances: Problem Gambling and Mental Health - Results from the St. Louis Epidemiologic Catchment Area (ECA) Study. American Journal of Public Health. 88(7),1093-1096.
Sample Size 2,954 (50 cases omitted because of missing gambling screen data)
Sampling Strategy Multistage sampling; Representative household sample of St. Louis adults.
Survey Description
Administration Method
Response Rate
Weighting Yes - to account for oversampling of African Americans, clustering and nonresponse.
Threshold for PG Questions
Assessment Instrument DSM-III-L (DIS-III)
Gambling Availability No EGMs in Missouri in 1981.
Past Year Gambling Prevalence 50.7% reported placing a bet or gambling at least twice in their lives.
Problem Gambling Prevalence 5.45% (1+)
Standardized Problem Gambling Prevalence
Demographic Correlates of PG male; younger; separated or divorced; African American
Game Correlates of PG
Comments
Results very tentative because of the unknown weighting factor that should be applied to the DIS-III and the fact that DIS only has 4 questions, whereas the DSM-III has 8 criteria. This study is not included in the tables or the analysis.

236
39 Location MONTANA
Year Study Conducted 1992
Age 18+
Source(s) Volberg, R.A. (1992). Gambling Involvement and Problem Gambling in Montana. Albany, NY: Gemini Research.
Sample Size 1,020
Sampling Strategy Random selection of respondents within households; up to 5 attempts to contact each number; only difference between sample compared to the 1990 United States census is underrepresentation of Native Americans.
Survey Description “ gambling practices of Montana citizens”
Administration Method telephone interview
Response Rate 63%
Weighting No
Threshold for PG Questions gambled in lifetime
Assessment Instrument SOGS-PY & SOGS-L
Gambling Availability Unknown number of EGMs in 1992.
Past Year Gambling Prevalence 73% (noted as 74% in 1998 report)
Problem Gambling Prevalence SOGS-PY: 1.5% (3-4); 0.7% (5+); 2.2% combined SOGS-L: 2.3% (3-4); 1.3% (5+); 3.6% combined
Standardized Problem Gambling Prevalence
2.2 * .72 * 1.59 * .74 = 1.9%
Demographic Correlates of PG under the age of 30; noted as being more likely to be female than in any other state
Game Correlates of PG more likely to have played EGMs and less likely to have wagered on sports or card games than problem and pathological gamblers in other states
Comments

237
40 Location MONTANA
Year Study Conducted 1998
Age 18+
Source(s) Bureau of Business and Economic Research, University of Montana-Missoula. (1998). The 1998 Montana Gambling Study. Missoula, MT: Author. (Note: Print version contains technical appendices).
Sample Size 1,227
Sampling Strategy
Random-Digit Dialing; once household contacted selection procedure using a Kish grid used; Random cross-section of Montana adults; designed to ensure that the respondents represented a statistically accurate cross-section of Montana adults (17 hearing-impaired respondents received questionnaire in mail, 2 translators obtained for those who did not speak English).
Survey Description "to gather information on gambling in Montana and its economic and social impacts"
Administration Method telephone interview
Response Rate 83%
Weighting age, sex
Threshold for PG Questions ever spent or bet money on gambling activity in lifetime
Assessment Instrument SOGS-PY & SOGS-L; DSM-IV-PY
Gambling Availability 19,487 EGMs in 1999. Population in 1998 was 879,533. People per EGM = 45.
Past Year Gambling Prevalence 78%
Problem Gambling Prevalence SOGS-PY: 2.0% (3-4); 1.6% (5+); 3.6% combined SOGS-L: 2.9% (3-4); 2.8% (5+); 5.7% combined DSM-IV-PY: 1.5% (3-4); 1.0% (5+); 2.5% combined
Standardized Problem Gambling Prevalence
SOGS-PY: 3.6 * .72 * 1.44 * .76 = 2.84% DSM-IV-PY: 2.5 * 1.19 * 1.44 * .76 = 3.26% Average = 3.0%
Demographic Correlates of PG American Indians; divorced or separated; equally likely to be male or female; lower educational attainment
Game Correlates of PG EGMs, lottery, scratch tickets
Comments Prevalence study part of a statewide gambling study; an additional sample of 108 American Indians living on the Flathead Reservation also surveyed.

238
41 Location NEVADA
Year Study Conducted 1975
Age 18+
Source(s) U.S. Commission on the Review of the National Policy Toward Gambling. (1976). Gambling in America: Final Report. Washington, DC: Author.
Sample Size 296 (Nevada residents)
Sampling Strategy
"Before obtaining the interview in Nevada, the interviewer ascertained whether the respondent had lived in Nevada for less than 18 months or had moved to Nevada primarily because of the availability of legal gambling. If either of these conditions applied, the individual was not interviewed."
Survey Description
”One thing that facilitated the data collection was the organization of the interview itself. It began by questioning respondents about what they do for recreation, additionally eliciting how much they spent on recreation and vacations, thus acclimating them to provide financial information on an innocuous topic. They were then led to discuss their exposure to other people’s gambling behavior … Next they were asked about gambling laws in their state and their desire for or opposition to legalization of different games of chance, and only then were they questioned about what games they bet on, how often they bet, and how much money they wagered” (p. ix)
Administration Method face-to-face residential interviews
Response Rate 70%
Weighting gender, region
Threshold for PG Questions
Assessment Instrument
“Clinical analysis” based on a) the similarity of the respondent answered 18 questions relative to how 274 known compulsive gamblers answered the same questions; b) observations recorded by the interviewer at the end of each interview; c) betting patterns reported by the respondent.
Gambling Availability Unknown number of EGMs in Nevada in 1975
Past Year Gambling Prevalence 78%
Problem Gambling Prevalence Nevada supplementary sample (n=296) = 2.6% "probable compulsive" (men=3.3%; women=2.0%); National sample (n=1,736) = 0.8% "probable compulsive" (men=1.1%; women=0.5%).
Standardized Problem Gambling Prevalence
Nevada: 2.6% National: 0.8%
Demographic Correlates of PG
Game Correlates of PG
Comments This study is not included in the tables or analyses.

239
42 Location NEVADA
Year Study Conducted 2000-2001
Age 18+
Source(s) Volberg, R.A. (2002). Gambling and Problem Gambling in Nevada. Report to the Nevada Department of Human Resources. Carson City, NV: Department of Human Resources.
Sample Size 2,217
Sampling Strategy
“two-phase probability sample”; The first phase involved identifying approximately 2,200 residential households with telephones in Nevada and selecting one eligible adult in each household (Kish grid) to respond to a brief screening interview. The second phase involved selecting a stratified random group of 733 respondents from the first phase for a lengthier interview. The sample is representative of the adult population of Nevada; instrument also translated into Spanish; up to 15 callbacks; achieved sample was representative of adult population of Nevada, as determined by Bureau of Census (2000).
Survey Description “we are conducting a survey of people in your community for the State of Nevada about people’s attitudes toward gambling”
Administration Method telephone interview
Response Rate 24% (CASRO method)
Weighting Region, gender, age
Threshold for PG Questions gambled in lifetime
Assessment Instrument SOGS-PY; DSM-IV-PY & DSM-IV-L (NODS)
Gambling Availability 198,232 EGMs in 1999. Population in 2000 was 1,998,257. People per EGM = 10.
Past Year Gambling Prevalence 67.9%
Problem Gambling Prevalence SOGS-PY: 2.9% (3-4); 3.5% (5+); 6.4% combined DSM-IV-PY: 1.8% (3-4); 0.3% (5+); 2.1% combined DSM-IV-L: 3.0% (3-4); 2.1% (5+); 5.1% combined
Standardized Problem Gambling Prevalence
SOGS-PY: 6.4 * .72 * 1.44 * .53 = 3.5% DSM-IV-PY: 2.1 * 1.19 * 1.44 * .53 = 1.9% Average = 2.7%
Demographic Correlates of PG males; adults 18 to 34; minorities; employed in gaming industry; high school education or less; annual household incomes under $35,000; never married
Game Correlates of PG EGMs, bingo, horse/dog races, cardrooms
Comments

240
43 Location NEW JERSEY + PENNSYLVANIA (2-State Study)
Year Study Conducted 1984
Age 17+
Source(s) Sommers, I. (1988). Pathological gambling: Estimating prevalence and group characteristics. Substance Use & Misuse, 23(5), 477-490. doi:10.3109/10826088809039213
Sample Size 534 (1,000 households – refusals = 534)
Sampling Strategy Random digit dialing; random selection within household; age distribution of respondents was skewed toward younger persons.
Survey Description
Administration Method telephone interview
Response Rate 53.4%
Weighting Gender
Threshold for PG Questions gambling in lifetime
Assessment Instrument Inventory of Gambling Behavior & other questions to get a "hard signs" of gambling pathology (CCSM)
Gambling Availability
Past Year Gambling Prevalence 30.6% ("31% represented the number of respondents who both perceived themselves as gamblers and were willing to disclose this in a telephone interview") [unclear as to time period for statement]
Problem Gambling Prevalence "potentially" pathological gamblers = 4.12%; "probable" pathological gamblers = 3.37%
Standardized Problem Gambling Prevalence
Demographic Correlates of PG 17-34 age group; males; Catholics; single individuals; separated or divorced; annual household income less than $20,000
Game Correlates of PG
Comments
The IGB method probably requires additional corrections for the sampling strategy (selected for self-defined “gamblers”) and for the PG measure which is based on 28 items clustered into 5 “tests” with a positive score on any item in a “test” leading to a positive score on that test and the sum of the test scores yielding a respondent’s total score. An odds ratio method, which expresses the odds in favor of being a PG for each total score, is used to estimate prevalence. Survey included adults residing in a nine-county area of southeastern Pennsylvania and southern New Jersey. This study is not included in the tables or analyses.

241
44 Location NEW JERSEY
Year Study Conducted 1988
Age 18+
Source(s)
Volberg, R.A. & Steadman, H.J. (1989). Prevalence estimates of pathological gambling in New Jersey and Maryland. American Journal of Psychology, 146(12), 1618-1619.
Volberg, R.A. (1994). The prevalence and demographics of pathological gamblers: Implications for public health. American Journal of Public Health, 84, 237-241.
Sample Size 1,000
Sampling Strategy Stratified to proportionally represent county populations on the basis of 1980 census figures. Random-digit dialing and random selection of respondents within household.
Survey Description ”gambling practices of the citizens of New Jersey”
Administration Method telephone interview
Response Rate Refusal rate = 36%
Weighting no
Threshold for PG Questions any lifetime gambling
Assessment Instrument SOGS-L
Gambling Availability Unknown number of EGMs in New Jersey in 1988.
Past Year Gambling Prevalence (Lifetime = 92%)
Problem Gambling Prevalence 2.8% (3-4); 1.4% (5+); 4.2% combined
Standardized Problem Gambling Prevalence
4.2 * .72 * .60 * 1.59 * .74 = 2.1%
Demographic Correlates of PG male; non-White; lower education; unmarried
Game Correlates of PG wagering on cards, horse and dog races, games of skill, dice games, and sports
Comments

242
45 Location NEW JERSEY
Year Study Conducted 1990
Age 15+
Source(s) Reilly, P. & Guida, F. (1990). Pathological Gambling Prevalence in New Jersey 1990 Final Report. Report to the New Jersey Dept of Higher Education. Piscataway, NJ: University of Medicine and Dentistry.
Sample Size 858
Sampling Strategy Randomly selected computer generated telephone numbers provided by Survey Sampling, Inc.; stratified by county and sex based on 1987 census.
Survey Description "study of recreational behavior among citizens of New Jersey"
Administration Method telephone interview
Response Rate 29.6%
Weighting No
Threshold for PG Questions
Assessment Instrument DSM-IV-L (uses 9 of the 10 questions proposed for the forthcoming DSM-IV; 6 of the 9 questions use the term ‘ever’)
Gambling Availability Unknown number of EGMs in New Jersey in 1990.
Past Year Gambling Prevalence
Problem Gambling Prevalence 5.8% (1+); 3.0% (2+)
Standardized Problem Gambling Prevalence
5.8 * .45 * .60 * 2.18 = 3.4%
Demographic Correlates of PG male; earned less than $15,000 per year; younger persons; older persons
Game Correlates of PG lottery play; casino betting; slots; horse betting; playing cards.
Comments Used a slightly younger age (15+) than many other prevalence surveys.

243
46 Location NEW MEXICO
Year Study Conducted 1996-1998
Age 18+
Source(s)
New Mexico Department of Health & University of New Mexico Center on Alcoholism Substance Abuse and Addictions. (1996). New Mexico Survey of Gambling Behavior. Santa Fe, NM: Author. Starling, R., Blankenship, J., May, P., & Woodall, G. (2009). Problem Gambling in New Mexico: 1996 and 1998. International Journal of Mental Health & Addiction, 7(1), 138-148. doi:10.1007/s11469-008-9163-3
Sample Size 2674 (1,279 in 1996 and 1,395 in 1998)
Sampling Strategy Stratified based on county population; random digit dialing; American Indians, possibly because of the low number of household phones, were under sampled by about 50%.
Survey Description
Administration Method telephone interview
Response Rate
Weighting no
Threshold for PG Questions Respondents were surveyed regarding their gambling behavior in the 30 days preceding the gambling survey
Assessment Instrument Mix of DSM-IV questions (13) and SOGS questions (4)
Gambling Availability 6,300 EGMs in 1999. Population in 1998 was 1,733,535. People per EGM = 275.
Past Year Gambling Prevalence
Problem Gambling Prevalence
Gamblers were categorized as experiencing “low/moderate problems” if they reported any of the following, but also reported no serious problems: (1) one or more low problems, (2) one moderate problem, or (3) two low problems with one moderate problem. Gamblers were categorized as experiencing “serious problems” if they reported any of the following: (1) one or more serious problems, (2) two or more moderate problems, or (3) three or more low problems in combination with one more moderate problems. 8.2% were identified as having low/moderate problems, while 3.9% were identified as having serious problem gambling.
Standardized Problem Gambling Prevalence
Demographic Correlates of PG younger, more college education, less likely to be married, disability/unemployment, Hispanic
Game Correlates of PG playing cards for money, dice gambling, and paper games
Comments

244
47 Location NEW MEXICO
Year Study Conducted 2005-2006
Age 18+
Source(s) Volberg, R.A., & Bernhard, B. (2006). The 2006 Study of Gambling and Problem Gambling in New Mexico. Report to the Responsible Gaming Association of New Mexico. Northampton, MA: Gemini Research.
Sample Size 2,850
Sampling Strategy Random-digit dialing; minimum of 8 attempts to establish contact; questionnaire translated into Spanish; oversample of 589 Native American New Mexico residents aged 18 and over.
Survey Description "a survey in the State of New Mexico about people’s attitudes toward gambling"
Administration Method telephone interview
Response Rate 47% ("completion rate"); 37% (more conservative approach)
Weighting age, ethnicity
Threshold for PG Questions DSM-IV-PY & DSM-IV-L (NODS): gambled more than 5 times in lifetime; CPGI: Past year gambler
Assessment Instrument DSM-IV-PY & DSM-IV-L (NODS); CPGI
Gambling Availability 14,881 EGMs in 2006. Population in 2006 was 1,954,599. People per EGM = 131.
Past Year Gambling Prevalence 68%
Problem Gambling Prevalence CPGI: 2.2% (3-7); 0.6% (8+); 2.8% combined DSM-PY: 0.7% (3-4); 0.6% (5+); 1.3% combined DSM-L: 1.1% (3-4); 1.1% (5+); 2.2% combined
Standardized Problem Gambling Prevalence
CPGI: 2.8 * .58 * 1.44 * .53 = 1.2% DSM-PY: 1.3 * 1.19 * 1.44 * .53 = 1.2% Average = 1.2%
Demographic Correlates of PG never married; disabled; unemployed; male, Hispanic; lower education; Native Americans
Game Correlates of PG Bingo; wager privately; sports bettors; casino gamblers
Comments Interviewed a separate oversample of 589 Native American residents of New Mexico.
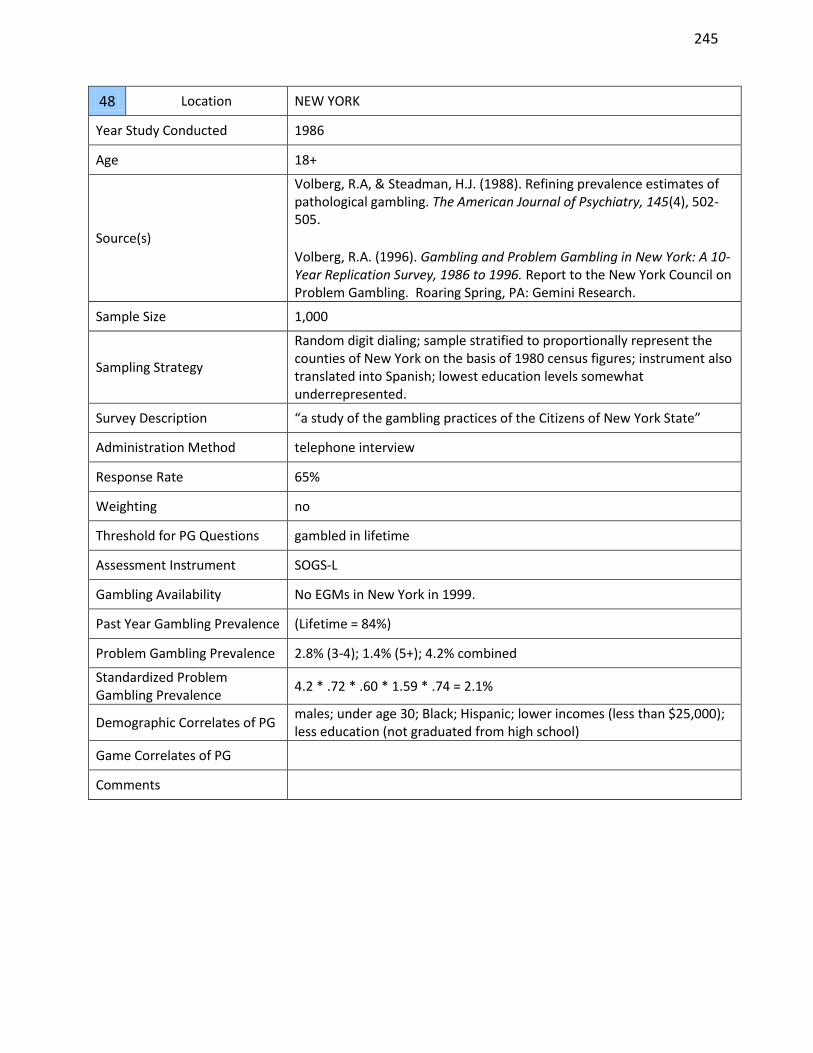
245
48 Location NEW YORK
Year Study Conducted 1986
Age 18+
Source(s)
Volberg, R.A, & Steadman, H.J. (1988). Refining prevalence estimates of pathological gambling. The American Journal of Psychiatry, 145(4), 502-505. Volberg, R.A. (1996). Gambling and Problem Gambling in New York: A 10-Year Replication Survey, 1986 to 1996. Report to the New York Council on Problem Gambling. Roaring Spring, PA: Gemini Research.
Sample Size 1,000
Sampling Strategy
Random digit dialing; sample stratified to proportionally represent the counties of New York on the basis of 1980 census figures; instrument also translated into Spanish; lowest education levels somewhat underrepresented.
Survey Description “a study of the gambling practices of the Citizens of New York State”
Administration Method telephone interview
Response Rate 65%
Weighting no
Threshold for PG Questions gambled in lifetime
Assessment Instrument SOGS-L
Gambling Availability No EGMs in New York in 1999.
Past Year Gambling Prevalence (Lifetime = 84%)
Problem Gambling Prevalence 2.8% (3-4); 1.4% (5+); 4.2% combined
Standardized Problem Gambling Prevalence
4.2 * .72 * .60 * 1.59 * .74 = 2.1%
Demographic Correlates of PG males; under age 30; Black; Hispanic; lower incomes (less than $25,000); less education (not graduated from high school)
Game Correlates of PG
Comments
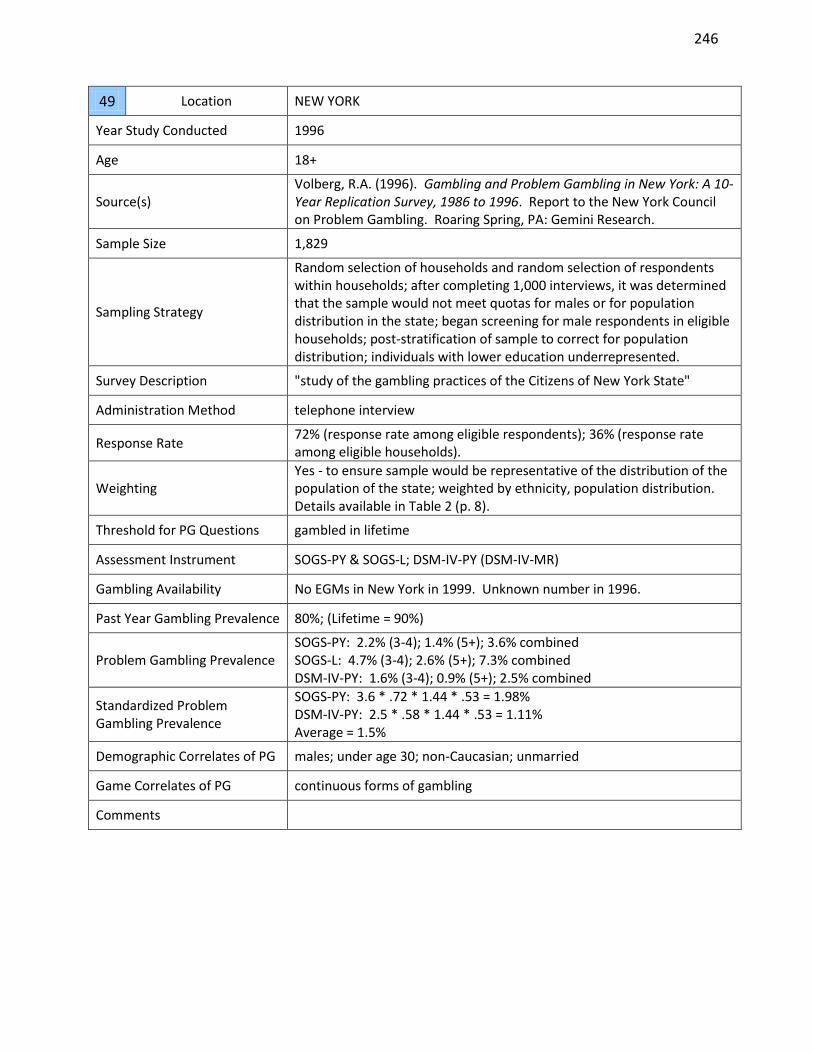
246
49 Location NEW YORK
Year Study Conducted 1996
Age 18+
Source(s) Volberg, R.A. (1996). Gambling and Problem Gambling in New York: A 10-Year Replication Survey, 1986 to 1996. Report to the New York Council on Problem Gambling. Roaring Spring, PA: Gemini Research.
Sample Size 1,829
Sampling Strategy
Random selection of households and random selection of respondents within households; after completing 1,000 interviews, it was determined that the sample would not meet quotas for males or for population distribution in the state; began screening for male respondents in eligible households; post-stratification of sample to correct for population distribution; individuals with lower education underrepresented.
Survey Description "study of the gambling practices of the Citizens of New York State"
Administration Method telephone interview
Response Rate 72% (response rate among eligible respondents); 36% (response rate among eligible households).
Weighting Yes - to ensure sample would be representative of the distribution of the population of the state; weighted by ethnicity, population distribution. Details available in Table 2 (p. 8).
Threshold for PG Questions gambled in lifetime
Assessment Instrument SOGS-PY & SOGS-L; DSM-IV-PY (DSM-IV-MR)
Gambling Availability No EGMs in New York in 1999. Unknown number in 1996.
Past Year Gambling Prevalence 80%; (Lifetime = 90%)
Problem Gambling Prevalence SOGS-PY: 2.2% (3-4); 1.4% (5+); 3.6% combined SOGS-L: 4.7% (3-4); 2.6% (5+); 7.3% combined DSM-IV-PY: 1.6% (3-4); 0.9% (5+); 2.5% combined
Standardized Problem Gambling Prevalence
SOGS-PY: 3.6 * .72 * 1.44 * .53 = 1.98% DSM-IV-PY: 2.5 * .58 * 1.44 * .53 = 1.11% Average = 1.5%
Demographic Correlates of PG males; under age 30; non-Caucasian; unmarried
Game Correlates of PG continuous forms of gambling
Comments

247
50 Location NEW YORK
Year Study Conducted 2005-2006
Age 18+
Source(s)
Rainone, G., Marel, R., Gallati, R. J., & Gargon, N. (2007). Gambling Behaviors and Problem Gambling among Adults in New York State: Initial Findings from the 2006 OASAS Household Survey. NYS Office of Alcoholism and Substance Abuse Services.
Sample Size 5,100
Sampling Strategy Random digit dialing
Survey Description
Administration Method telephone interview
Response Rate Between 45% - 50%
Weighting gender, age, region, ethnicity, nativity and employment status
Threshold for PG Questions
Assessment Instrument DSM-IV-PY (NODS)
Gambling Availability 16,555 EGMs in 2006. Population in 2006 was 19,306,183. People per EGM = 1166.
Past Year Gambling Prevalence 67%
Problem Gambling Prevalence 0.5% (3-4); 0.4% (5+); 0.9% combined
Standardized Problem Gambling Prevalence
0.9 * 1.19 * 1.44 * .76 = 1.2%
Demographic Correlates of PG males; younger adults; Blacks; Hispanics; never married; employed full or part time
Game Correlates of PG
Comments The survey methodology is described in a separate report, “2006 OASAS Household Survey Technical Documentation.” (This report not available online).

248
51 Location NORTH CAROLINA
Year Study Conducted 2005
Age 18+
Source(s) Division of Mental Health, Developmental Disabilities and Substance Abuse Services. (2007). Effects of the North Carolina State Lottery on the Incidence of Gambling Addiction.
Sample Size 1,367
Sampling Strategy
Gambling questions included in random statewide telephone survey (North Carolina Behavioral Risk Factor Surveillance System (BRFSS)) of adults that collects information on health, health behaviors, and utilization of health services in all months of the year.
Survey Description "We are gathering information about the health of North Carolina residents."
Administration Method telephone interview
Response Rate
Weighting Yes
Threshold for PG Questions none
Assessment Instrument
N/A -- The prevalence for problem gambling, or the percentage of the adult general population with a gambling problem, was based on a single question that asked respondents whether they were gambling more than they thought they should.
Gambling Availability 3,600 EGMs in 2004. Population in 2005 was 8,683,242. People per EGM = 2412.
Past Year Gambling Prevalence Past 6-months = 28.6%; Lifetime = 50.3%
Problem Gambling Prevalence 2.1% -- Based on a single question that asked respondents whether they were gambling more than they thought they should.
Standardized Problem Gambling Prevalence
Demographic Correlates of PG age 18-24; non-whites; high-school education; $15,000-$24,999 household income
Game Correlates of PG
Comments This report presents findings on gambling behaviors among adult North Carolinians prior to the sale of the first lottery ticket on March 30, 2006

249
52 Location NORTH DAKOTA
Year Study Conducted 1992
Age 18+
Source(s) Volberg, R.A. & Silver, E. (1993). Gambling and Problem Gambling in North Dakota. Report to the North Dakota Department of Human Services, Division of Mental Health. Albany, NY: Gemini Research.
Sample Size 1,517
Sampling Strategy
Random sample of telephone numbers proportional to working blocks of telephone numbers in state; random selection of respondents within households; demographic data from random sample compared to data from 1990 U..S. census; no significant differences in terms of ethnicity; respondents in sample were less likely to be male and under the age of 25 than the general population.
Survey Description "study of the gambling practices of the Citizens of North Dakota"
Administration Method telephone interview
Response Rate 65%
Weighting No
Threshold for PG Questions gambled in lifetime
Assessment Instrument SOGS-PY & SOGS-L
Gambling Availability Unknown number of EGMs in North Dakota in 1992.
Past Year Gambling Prevalence 73%
Problem Gambling Prevalence SOGS-PY: 1.3% (3-4); 0.7% (5+); 2.0% combined SOGS-L: 2.5% (3-4); 1.0% (5+); 3.5% combined
Standardized Problem Gambling Prevalence
2.0 * .72 * 1.59 * .74 = 1.7%
Demographic Correlates of PG Lifetime: under 30 years of age; lower than average household income. Current: under 30 years of age; non-White; somewhat less likely to earn $25,000 or more annually.
Game Correlates of PG pull-tabs; bingo
Comments Survey prior to the establishment of casinos in the state.

250
53 Location NORTH DAKOTA
Year Study Conducted 2000
Age 18+
Source(s) Volberg, R.A. (2001). Gambling and Problem Gambling in North Dakota: A Replication Study, 1992 to 2000. Report to the North Dakota Office of the Governor. Bismarck, ND: Office of the Governor.
Sample Size 5,002
Sampling Strategy
Random selection of households and random selection of respondents within households; achieved sample was quite representative of the total adult population in North Dakota, as estimated by the Bureau of the Census.
Survey Description
Administration Method telephone interview
Response Rate 71% (CASRO method)
Weighting
Yes - the data were weighted to ensure that the results of the survey could be generalized to the adult population of North Dakota; The first set of weights (WT_SHORT) treated the selection process for Phase One as an equal-probability selection of eligible adults in North Dakota, except that male and female adults of different ages in each of the four regions of North Dakota had different probabilities of completing the screener. The second set of weights (WT_LONG) adjusted for both the differential probabilities of selection for the full interview based on gambling frequency, for differential non-response by region, age, and gender at Phases One and Two, and for differential non-response by gambling frequency at Phase Two.
Threshold for PG Questions gambled in lifetime
Assessment Instrument SOGS-PY & SOGS-L; DSM-IV-PY & DSM-IV-L (NODS)
Gambling Availability 2,500 EGMs in 1999. Population in 2000 was 642,200. People per EGM = 257.
Past Year Gambling Prevalence 69.8%
Problem Gambling Prevalence
SOGS-PY: 0.7% (3-4); 1.4% (5+); 2.1% combined SOGS-L: 2.0% (3-4); 1.8% (5+); 3.8% combined DSM-IV-PY: 0.4% (3-4); 0.3% (5+); 0.7% combined DSM-IV-L: 0.5% (3-4); 0.4% (5+); 0.9% combined
Standardized Problem Gambling Prevalence
SOGS-PY: 2.1 * .72 * 1.44 * .74 = 1.61% DSM-IV-PY: 0.7 * 1.19 * 1.44 * .74 = .88% Average = 1.2%
Demographic Correlates of PG age 18 to 24; male; Native Americans; widowed, divorced or separated; less than a high school education; disabled or unemployed; annual household incomes between $20,000 and $25,000.
Game Correlates of PG horse race betting; casino table games; pulltabs, EGMs
Comments

251
54 Location OHIO
Year Study Conducted 1985
Age
Source(s)
Culleton, R.P. (1989). The prevalence rates of pathological gambling: A look at methods. Journal of Gambling Behavior, 5, 22-41. Volberg, R.A. & Banks, S.M. (1990). A review of two measures of pathological gambling in the United States. Journal of Gambling Studies, 6(2), 153-163. doi:10.1007/BF01013495
Sample Size 801
Sampling Strategy
Survey Description
Administration Method telephone interview
Response Rate
Weighting
Threshold for PG Questions
Assessment Instrument Inventory of Gambling Behavior / Cumulative Clinical Signs Method (CCSM)
Gambling Availability No EGMs in Ohio in 1999.
Past Year Gambling Prevalence
Problem Gambling Prevalence In Ohio, 2.5 % of all adults were described as "probable" and another 3.4% as "potential" pathological gamblers.
Standardized Problem Gambling Prevalence
Demographic Correlates of PG
Game Correlates of PG
Comments
The IGB/CCSM probably requires additional corrections for the sampling strategy (selected for self-defined “gamblers”) and for the PG measure which is based on 28 items clustered into 5 “tests” with a positive score on any item in a “test” leading to a positive score on that test and the sum of the test scores yielding a respondent’s total score. An odds ratio method, which expresses the odds in favor of being a PG for each total score, is used to estimate prevalence. CCSM instrument also used in the following regional prevalence study: Culleton, R.P. & Lang, M.H. (1985). The prevalence rate of pathological gambling in the Delaware Valley in 1984. Report prepared for People Acting To Help, Philadelphia, PA. This study is not included in the tables or analyses.

252
55 Location OREGON
Year Study Conducted 1997
Age 18+
Source(s) Volberg, R.A. (1997). Gambling and Problem Gambling in Oregon. Northampton, MA: Gemini Research Inc.
Sample Size 1,502
Sampling Strategy
random selection of households and random selection of respondents within households; stratified sampling frame after completing approximately two-thirds of the interviews in order to obtain data from a representative sample of men and young adults.
Survey Description “a survey of people in your community for the State of Oregon concerning the gambling practices of Oregon citizens”
Administration Method telephone interview
Response Rate 51% (CASRO method)
Weighting age
Threshold for PG Questions gambling in lifetime
Assessment Instrument SOGS-PY & SOGS-L; DSM-IV-PY (DSM-IV-MR)
Gambling Availability 8,848 EGMs in 1999. Unknown number of EGMs in 1997.
Past Year Gambling Prevalence 51.6%
Problem Gambling Prevalence SOGS-PY: 1.9% (3-4); 1.4% (5+); 3.3% combined SOGS-L: 3.1% (3-4); 1.8% (5+); 5.1% combined DSM-IV-PY: 2.0% (3-4); 1.3% (5+); 3.3% combined
Standardized Problem Gambling Prevalence
SOGS-PY: 3.3 * .72 * 1.44 * .76 = 2.60% DSM-IV-PY: 3.3 * 1.19 * 1.44 * .76 = 4.30% Average = 3.4%
Demographic Correlates of PG male; under the age of 30; non-White; divorced, separated or never married
Game Correlates of PG illegal types of gambling, particularly sports, dice and games of skill; EGMs; card games; bingo
Comments

253
56 Location OREGON
Year Study Conducted 2000
Age 18+
Source(s)
Volberg, R.A. (2001). Changes in Gambling and Problem Gambling in Oregon: Results from a Replication Study, 1997 to 2000. Northampton, MA: Gemini Research Inc. Moore, T.L. (2001). The Prevalence of Disordered Gambling among Adults in Oregon: A Secondary Analysis of Data. Salem, OR: Oregon Gambling Addiction Treatment Foundation.
Sample Size 1,500
Sampling Strategy
randomized telephone survey; stratified sampling; screening procedure was used to preferentially complete interviews with male respondents and with respondents under the age of 35; achieved sample was quite representative of the population in terms of gender, age and ethnicity
Survey Description "survey of people in your community for the State of Oregon concerning the gambling practices of Oregon citizens"
Administration Method telephone interview
Response Rate 48% (CASRO method)
Weighting No
Threshold for PG Questions gambling in lifetime
Assessment Instrument SOGS-PY & SOGS-L; DSM-IV-PY & DSM-IV-L (NODS)
Gambling Availability 8,848 EGMs in 1999. Population in 2000 was 3,431,085. People per EGM = 388.
Past Year Gambling Prevalence 47.1%
Problem Gambling Prevalence
SOGS-PY: 1.4% (3-4); 0.9% (5+); 2.3% combined SOGS-L: 2.7% (3-4); 1.9% (5+); 4.6% combined DSM-IV-PY: 0.4% (3-4); 0.1% (5+); 0.5% combined DSM-IV-L: 0.9% (3-4); 0.6% (5+); 1.5% combined
Standardized Problem Gambling Prevalence
SOGS-PY: 2.3 * .72 * 1.44 * .76 = 1.81% DSM-IV-PY: 0.5 * 1.19 * 1.44 * .76 = 0.65 Average = 1.2%
Demographic Correlates of PG minority populations (small sample); never married
Game Correlates of PG
Comments

254
57 Location OREGON
Year Study Conducted 2005
Age 18+
Source(s) Moore, T. (2006). The Prevalence of Disordered Gambling among Adults in Oregon: A Replication Study. Portland, OR: Oregon Gambling Addiction Treatment Foundation.
Sample Size 1,554
Sampling Strategy
The design and methodology for the replication study was consistent with the initial baseline study conducted in 1997 and the replication study conducted in 2001; minorities and ages 18 – 44 were under-represented in the sample.
Survey Description
Administration Method telephone interview
Response Rate
Weighting Age
Threshold for PG Questions gambling in lifetime?
Assessment Instrument SOGS-PY & SOGS-L; DSM-IV-L (NODS)
Gambling Availability 14,218 EGMs in 2004. Population in 2005 was 3,626,938. People per EGM = 255.
Past Year Gambling Prevalence 64.5% (weighted)
Problem Gambling Prevalence SOGS-PY: 1.7% (3-4); 1.0% (5+); 2.7% combined SOGS-L: 2.4% (3-4); 1.9% (5+); 4.3% combined DSM: not reported
Standardized Problem Gambling Prevalence
SOGS-PY: 2.7 * .72 * 1.44 * .76 = 2.1%
Demographic Correlates of PG under the age of 45; non-Whites; divorced or separated; employed
Game Correlates of PG
Comments Replication study; NODS prevalence rates not reported.

255
58 Location PENNSYLVANIA + NEW JERSEY (2-State Study)
Year Study Conducted 1984
Age 17+
Source(s) Sommers, I. (1988). Pathological gambling: Estimating prevalence and group characteristics. Substance Use & Misuse, 23(5), 477-490. doi:10.3109/10826088809039213
Sample Size 534 (1,000 households – refusals = 534)
Sampling Strategy Random digit dialing; random selection within household; age distribution of respondents was skewed toward younger persons.
Survey Description
Administration Method telephone interview
Response Rate 53.4%
Weighting Gender
Threshold for PG Questions gambling in lifetime
Assessment Instrument Inventory of Gambling Behavior & other questions to get a "hard signs" of gambling pathology (CCSM)
Gambling Availability
Past Year Gambling Prevalence 30.6% ("31% represented the number of respondents who both perceived themselves as gamblers and were willing to disclose this in a telephone interview") [unclear as to time period for statement]
Problem Gambling Prevalence "potentially" pathological gamblers = 4.12%; "probable" pathological gamblers = 3.37%
Standardized Problem Gambling Prevalence
Demographic Correlates of PG 17-34 age group; males; Catholics; single individuals; separated or divorced; annual household income less than $20,000
Game Correlates of PG
Comments
The IGB method probably requires additional corrections for the sampling strategy (selected for self-defined “gamblers”) and for the PG measure which is based on 28 items clustered into 5 “tests” with a positive score on any item in a “test” leading to a positive score on that test and the sum of the test scores yielding a respondent’s total score. An odds ratio methods, which expresses the odds in favor of being a PG for each total score, is used to estimate prevalence. Survey included adults residing in a nine-county area of southeastern Pennsylvania and southern New Jersey. This study is not included in the tables or analyses.

256
59 Location PUERTO RICO [U.S. Territory]
Year Study Conducted 1997
Age 18+
Source(s)
Volberg, R.A., & Vales, P.A. (1998). Gambling and Problem Gambling in Puerto Rico [Juegos de azar y el problema de juego en Puerto Rico]. Report to the Puerto Rico Treasury Department. Volberg, R.A., Vales, P.A. (2002). Prevalence estimates of pathological gambling in Puerto Rico [Estimados de prevalencia sobre el juego patológico en Puerto Rico]. Revista Puertorriqueña de Psicología 13, 71-98.
Sample Size 1,506
Sampling Strategy
Stratified household sampling; 3 metropolitan municipalities, 3 large towns and 8 small towns were randomly selected from the 78 municipalities in Puerto Rico; different socio-economic areas selected within the urban and rural locations of each municipality; survey conducted in Spanish; random selection within household. Obtained sample was nonsignificantly different from the Puerto Rico population in terms of gender, age and urban/rural distribution.
Survey Description ”gambling practices among residents of Puerto Rico” Administration Method Residential face-to-face interview Response Rate 97%
Weighting “Since the sample was so similar to the Puerto Rico population in terms of size of municipality, urban-rural distribution, gender and age, it was not necessary to use post-stratification weights” (p. 9).
Threshold for PG Questions gambling in lifetime Assessment Instrument SOGS-PY & SOGS-L Gambling Availability 4,440 EGMs in 1999. Unknown number in 1997. Past Year Gambling Prevalence 88%
Problem Gambling Prevalence SOGS-PY: 4.4% (3-4); 6.8% (5+); 11.2% combined SOGS-L: 6.4% (3-4); 7.4% (5+); 13.8% combined
Standardized Problem Gambling Prevalence
11.2 * .72 * 1.00 = 8.1%
Demographic Correlates of PG male; between the ages of 21 and 54; divorced or separated; employed; annual household incomes over $50,000
Game Correlates of PG
“continuous” types of gambling, characterized by rapid cycles of play. These include wagering on horse races and cockfights, “bolita,” illegal EGMs, at casinos, on sports, on card games not at a casino and on games of skill.
Comments
"There was no effort made in the survey to separate questions about wagering on horse races and cockfights. This was done in order to maintain comparability with questions about parimutuel wagering in other jurisdictions. In retrospect, and given the large role that these types of gambling appear to play in the prevalence of problem and pathological gambling in Puerto Rico, it would have been preferable to separate these two activities."

257
60 Location SOUTH DAKOTA
Year Study Conducted 1991
Age 18+
Source(s)
Volberg, R.A., Stuefen, R.M., & Madden, M.K. (1991). Gaming in South Dakota: A Study of Gambling Participation and Problem Gambling and a Statistical Description and Analysis of its Socioeconomic Impacts. Vermillion: University of South Dakota, Business Research Bureau.
Sample Size 1,560
Sampling Strategy
Sample stratified to proportionally represent county populations on the basis of 1990 census figures. Random sampling of households with listed telephone numbers and random selection of respondents within households. Up to 7 attempts were made to contact each number and up to 5 callbacks were made to complete an interview with each selected respondent.
Survey Description “a study of the gambling practices of the Citizens of South Dakota”
Administration Method telephone interview
Response Rate 78%
Weighting No
Threshold for PG Questions gambling in lifetime
Assessment Instrument SOGS-PY (6-months) & SOGS-L
Gambling Availability Unknown number of EGMs in 1991.
Past Year Gambling Prevalence (Lifetime = 86%)
Problem Gambling Prevalence SOGS-PY: 0.8% (3-4); 0.6% (5+); 1.4% combined SOGS-L: 1.8% (3-4); 1.0% (5+); 2.8% combined
Standardized Problem Gambling Prevalence
1.4 * .72 * 1.44 * 1.00 = 1.5%
Demographic Correlates of PG unmarried; household income less than $25,000; non-White, under age of 30
Game Correlates of PG Bingo; sports betting. Problem and pathological gamblers in South Dakota are just as likely as those in other states to have wagered on gambling machines, horse and dog races, card games and dice games.
Comments
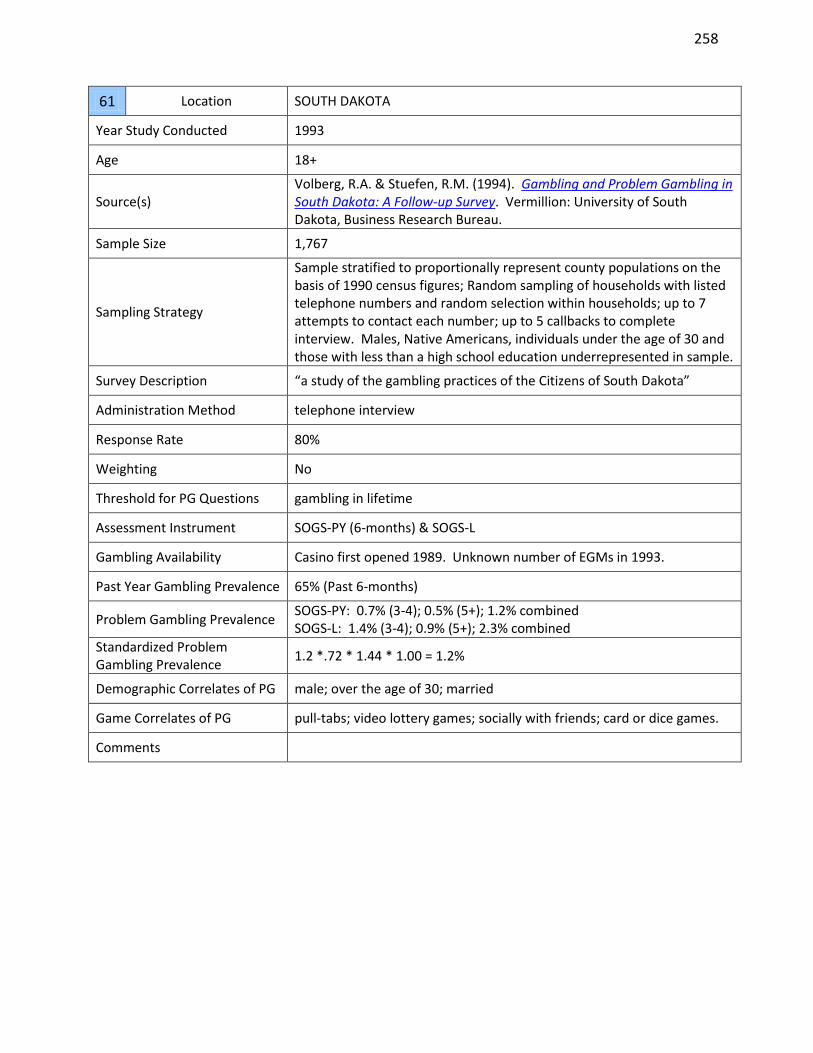
258
61 Location SOUTH DAKOTA
Year Study Conducted 1993
Age 18+
Source(s) Volberg, R.A. & Stuefen, R.M. (1994). Gambling and Problem Gambling in South Dakota: A Follow-up Survey. Vermillion: University of South Dakota, Business Research Bureau.
Sample Size 1,767
Sampling Strategy
Sample stratified to proportionally represent county populations on the basis of 1990 census figures; Random sampling of households with listed telephone numbers and random selection within households; up to 7 attempts to contact each number; up to 5 callbacks to complete interview. Males, Native Americans, individuals under the age of 30 and those with less than a high school education underrepresented in sample.
Survey Description “a study of the gambling practices of the Citizens of South Dakota”
Administration Method telephone interview
Response Rate 80%
Weighting No
Threshold for PG Questions gambling in lifetime
Assessment Instrument SOGS-PY (6-months) & SOGS-L
Gambling Availability Casino first opened 1989. Unknown number of EGMs in 1993.
Past Year Gambling Prevalence 65% (Past 6-months)
Problem Gambling Prevalence SOGS-PY: 0.7% (3-4); 0.5% (5+); 1.2% combined SOGS-L: 1.4% (3-4); 0.9% (5+); 2.3% combined
Standardized Problem Gambling Prevalence
1.2 *.72 * 1.44 * 1.00 = 1.2%
Demographic Correlates of PG male; over the age of 30; married
Game Correlates of PG pull-tabs; video lottery games; socially with friends; card or dice games.
Comments

259
62 Location TEXAS
Year Study Conducted 1992
Age 18+
Source(s) Wallisch, L.S. (1993). Gambling in Texas: 1992 Texas Survey of Adult Gambling Behavior. Austin: Texas Commission on Alcohol and Drug Abuse.
Sample Size 6,308
Sampling Strategy
Random digit dialing; Certain geographical areas oversampled to provide minimum sample of 650 respondents in each of 8 regions of the state; Spanish-language version of the survey instrument was produced. Approximately 6 percent of the adults asked to be interviewed in Spanish.
Survey Description
Administration Method telephone interview
Response Rate 67%
Weighting age, race/ethnicity, region
Threshold for PG Questions gambling in lifetime
Assessment Instrument SOGS-PY & SOGS-L
Gambling Availability No EGMs in 1992.
Past Year Gambling Prevalence 49%
Problem Gambling Prevalence SOGS-PY: 1.7% (3-4); 0.8% (5+); 2.5% combined SOGS-L: 3.5% (3-4); 1.3% (5+); 4.8% combined
Standardized Problem Gambling Prevalence
2.5 * .72 * 1.44 * .76 = 2.0%
Demographic Correlates of PG males, non-whites, young adults (18–24), divorced or never married, lower educational levels, blue-collar workers, Catholics and people who are not Protestant or Jewish
Game Correlates of PG betting on cards or dice in casinos or at card parlors and other betting establishments, bingo, games of skill, and sports at a sports book or with a bookie
Comments The information given by all respondents generally reflects gambling that occurred before the Texas Lottery, except where indicated; Study also included a separate sample of 924 adolescents aged 14 through 17.

260
63 Location TEXAS
Year Study Conducted 1995
Age 18+
Source(s) Wallisch, L.S. (1996). Gambling in Texas: 1995 Surveys of Adult and Adolescent Gambling Behavior. Austin: Texas Commission on Alcohol and Drug Abuse.
Sample Size 7,015
Sampling Strategy
Minimum of 400 adults from each of the 11 Texas Department of Health and Human Services planning regions; certain age groups and racial/ethnic groups were oversampled; obtained sample representative in terms of gender, age, racial/ethnic and regional distribution as the Texas population.
Survey Description
Administration Method telephone interview
Response Rate 70% (noted as "cooperation rate")
Weighting gender, race/ethnicity, age, region
Threshold for PG Questions gambling in lifetime
Assessment Instrument SOGS-PY & SOGS-L
Gambling Availability No EGMs in 1995.
Past Year Gambling Prevalence 68%
Problem Gambling Prevalence SOGS-PY: 2.2% (3-4); 0.8% (5+); 3.0% combined SOGS-L: 3.6% (3-4); 1.8% (5+); 5.4% combined
Standardized Problem Gambling Prevalence
3.0 * .72 * 1.44 * .76 = 2.4%
Demographic Correlates of PG younger age; African American or Hispanic; never married; high school dropouts; less likely to be in the labor force because they were instead in school or disabled; lowest household incomes
Game Correlates of PG illegal activities, followed by bingo, games of skill, and casino games
Comments Follow-up / replication study; Study also included a separate sample of 3,079 adolescents aged 14 through 17.

261
64 Location WASHINGTON
Year Study Conducted 1992
Age 18+
Source(s) Volberg, R.A. (1993). Gambling and Problem Gambling in Washington State. Report to the Washington State Lottery.
Sample Size 1,502
Sampling Strategy Random digit dialing; random selection of respondents within households; sample slightly underrepresents Asians, young adults and the elderly, individuals who have never married, low income households
Survey Description "study of the gambling practices of the citizens of Washington State"
Administration Method telephone interview
Response Rate 60% (Upper Bound method)
Weighting no
Threshold for PG Questions gambling in lifetime
Assessment Instrument SOGS-PY & SOGS-L
Gambling Availability No EGMs in 1992.
Past Year Gambling Prevalence 80.1%
Problem Gambling Prevalence SOGS-PY: 1.9% (3-4); 0.9% (5+); 2.8% combined SOGS-L: 3.5% (3-4); 1.5% (5+); 5.1% combined
Standardized Problem Gambling Prevalence
2.8 * .72 * 1.59 * .74 = 2.4%
Demographic Correlates of PG male; under the age of 30, non-White; unmarried
Game Correlates of PG wagering on sports events with friends or co-workers; lottery's Daily Game
Comments

262
65 Location WASHINGTON
Year Study Conducted 1998
Age 18+
Source(s) Volberg, R.A. & W.L. Moore. (1999). Gambling and Problem Gambling in Washington State: A Six-Year Replication Study, 1992 to 1998. Olympia, WA: Washington State Lottery.
Sample Size 1,501
Sampling Strategy
Random selection of households and random selection of respondents within households; “soft screening” respondents in eligible households in order to obtain adequate representation of young men. Soft screening entails first asking for the man in the household under age 35, then any male, and then the adult with the next birthday. As a result of this screening procedure, the sample is fully representative of the population aged 18 and over in Washington State in terms of gender (male/female) and age (18-34 and 35+).
Survey Description "survey of people in your community for the State of Washington concerning the gambling practices of Washington citizens"
Administration Method telephone interview
Response Rate 50% (CASRO method)
Weighting no
Threshold for PG Questions gambling in lifetime
Assessment Instrument SOGS-PY & SOGS-L; DSM-IV-PY (DSM-IV-MR)
Gambling Availability No EGMs in 1998.
Past Year Gambling Prevalence 74.4%
Problem Gambling Prevalence SOGS-PY: 1.8% (3-4); 0.5% (5+); 2.3% combined SOGS-L: 3.7% (3-4); 1.3% (5+); 5.0% combined DSM-IV-PY: 0.9% (3-4); 0.6% (5+); 1.5% combined
Standardized Problem Gambling Prevalence
SOGS-PY: 2.3% * .72 * 1.44 * .76 = 1.81% DSM-IV-PY: 1.5% * 1.19 * 1.44 * .76 = 1.95% Average = 1.9%
Demographic Correlates of PG male, under the age of 25, non-White or Hispanic; never married
Game Correlates of PG bingo, the instant and daily lottery games, EGMs, horse or dog races
Comments

263
66 Location WASHINGTON
Year Study Conducted 2003-2004
Age 18+
Source(s) Mancuso, D., Gilson, M., & Felver, B. (2005). The 2003 Washington State Needs Assessment Household Survey. Department of Social and Health Services (DSHS), Division of Alcohol and Substance Abuse (DASA).
Sample Size 6,713
Sampling Strategy
Random digit dialing + phone numbers from Food Stamps client lists, school lists, birth certificate records, and ethnic surname sampling of listed telephone numbers. The interview offered in 6 languages: English, Spanish, Russian, Chinese, Korean, and Vietnamese. Stratified sampling; over sampling young adults, poorer persons and members of ethnic and racial minority groups; An advance letter with a brief description of the survey and a one dollar bill was sent to sampled households with available address information; minimum number of 20 callbacks.
Survey Description Part of an omnibus survey on several topics
Administration Method telephone interview
Response Rate 50% (69% "cooperation rate")
Weighting Yes - to U.S. Census population counts.
Threshold for PG Questions Not indicated. Seemingly Gambling in past year.
Assessment Instrument DSM-IV-PY (NODS)
Gambling Availability 16,923 EGMs in 2004. Population in 2004 was 6,203,788. People per EGM = 367.
Past Year Gambling Prevalence 54%
Problem Gambling Prevalence 0.7% (3-4); 0.4% (5+); 1.2% combined
Standardized Problem Gambling Prevalence
1.2 * 1.19 * 1.44 = 2.1%
Demographic Correlates of PG aged 25 to 44 years; 45 to 64 years; rural counties; American Indian or Alaska Native adults; adults who endorsed more than one race; Blacks.
Game Correlates of PG
Comments

264
67 Location WISCONSIN
Year Study Conducted 1995
Age 18+
Source(s) Thompson, W.N., Gazel, R., & Rickman, D. (1996). The Social Costs of Gambling in Wisconsin. Wisconsin Policy Research Institute Report, 9(6), 1-44.
Sample Size 1,000
Sampling Strategy Random digit dialing; 3 call back attempts; the 1,000 respondents were a close match of the general Wisconsin adult population
Survey Description
Administration Method telephone interview
Response Rate
Weighting No
Threshold for PG Questions None
Assessment Instrument DSM-IV(slight modification)
Gambling Availability Unknown number of EGMs in 1995.
Past Year Gambling Prevalence 65.1%
Problem Gambling Prevalence 0.9% (3+)
Standardized Problem Gambling Prevalence
0.9 * 1.19 * 1.59 * .74 = 1.3%
Demographic Correlates of PG
Game Correlates of PG casino gambling
Comments

265
Appendix E: Demographic Correlates of Problem Gambling
National Australia Canada United States
Male
1,2,3,4,5,6,7,8,9,11,12,13,14,16,17,18,19,20,22,23,24,25, 26,27,28,29,30,32,34,35,36, 37,38,39,40,41,42,45,47,48, 49,50,51,57,58,59,60,61,62, 64,65,66,67,68
1,2,3,4,5,7,8,14,16,17,18,19, 20,21,23,24,25,26,27
2,3,4,6,7,9,10,12,14,15,16,17,18,20,21,22,23,24,25,26,27, 28,29,31,32,33,35,37,38,39
2,3,4,7,9,10,11,12,13,14,15, 16,19,20,21,23,24,28,29,30, 31,35,36,37,38,42,43,44,45, 47,48,49,50,53,55,59,61,62, 64, 65
Under Age 35
1,2,3,4,5,6,7,8,9,10,11,12,14,16,17,18,19,20,21,22,23,24, 28,30,38,40,41,45,46,47,48, 51,55,59, 60,61,62,68
1,2,3,4,5,8,9,13,18,19,20,23, 27
1,2,3,8,9,10,11,12,13,17,18, 20,22,23,24,25,26,28,29,31, 33,35,37,38,39
3,4,5,7,9,11,12,13,14,15,16, 20,21,23,24,25,29,31,32,34, 35,37,38,39,42,43,45,46,48, 49,50,51,52,53,55,57,59,60, 62, 63,64,65,66
Age 30-50 7,35,39,49,50,51,57 10,17,20,21,24 17,19,20,24,33 25,57,52,61,66
Age50+ 50,56,66 24 19,24,29 12,45,66
Less Education than Average 1,5,6,8,9,13,17,19,20,25,27, 28,30,35,38,39,45,46,47,48, 49,50
1,2,5,7,9,14,24 1,2,4,6,7,9,14,15,17,20,21,24,27,35,37,39
2,4,12,15,19,24,25,28,29,30, 36,40,42,44,47,48,51,53,62, 63
More Education than Average 18,26 9,46
Low Income 1,2,4,6,7,10,13,22,23,25,26, 27,28,34,39,47,48,54,58,67
1,4,7,17 1,2,3,4,6,7,8,12,13,14,19,20, 27,33,35,37,39
7,10,14,15,23,29,42,43,45,48,51,52,53,60,63
Middle Income 37,50,51,54 17 11,14,18,33
High Income 9,32,49 11 59
Unemployed 1,3,17,18,19,20,35,36,47,48, 60
2,13,20,24 2,3,9,13,23,24,26,31,32,39 1,3,46,47,53
Part or Full Time Employed 38 2,4,5,13,18,23 13 10,23,37,50,57,59
Student 1,9,47 20 24,26 63 Blue Collar &/or Unskilled
Workers 24,26 5,62
White Collar &/or Skilled Workers
4,17,21
Single 2,22,30,35,36,38,40,45,46,47,48,62
1,2,5,8,10,13,27 1,2,3,9,13,14,15,16,24,25,26,27,28,31,38,39
4,7,10,12,13,19,20,23,24,25, 28,30,36,37,42,43,44,46,47, 49,50,55,56,60,62,63,64,65
Married or Common-Law 50,51 3 61
Separated or Divorced 1,22,32,49,57 2,9,13,20,24,25,27 5,10,23,25,36,37,38,40,43,53,55,57,59,62

266
Minority Group or Immigrant 1,6,17,19,20,23,35,36,37,38, 39,45,46,51,60
3,7 6,15,27,38 3,23,42,56
Non-Caucasian 54,68 1 2,13,14,15,20,24,28,30,31,35,44,49,51,52,55,57,60,62,64, 65
Indigenous 5,6,37 7,26 2,3,4,24,27,39 36,40,47,53,66
African-American 3,10,12,23,25,29,32,34,37,38,48,50,63,66
Hispanic-American 67 1,12,25,46,47,48,50,64,65
Asian 6,24,49,50,67 4
Non-Immigrant 1,2
Catholic 37 2 43,62
OTHER
No children at home: 7 Pensioners: 47,48 Adopted: 60 Under 65: 58
Renting: 13 No children at home: 14
Children at home: 2
Females 45-64: 11 Females 50-54: 12 Employed in gambling industry: 42 High interest in several other leisure activities: 21
Note: Each cell lists the study number of investigation(s) that found that variable to be associated with problem gambling.

267
Appendix F: Characterological and Environmental Correlates of Problem Gambling
National Australia Canada United States
Substance Abuse 5,9,13,28,38,39,55,57,59,60, 62
12,21
Tobacco Use 6,13,24,28,38,39 10,11,25 4 12,21
Illicit Drug Use 6,28 24
Mental Health Problems 6,32,38,39,55,57,58,60,61 24 4 12
Poor Physical Health &/or Disabled
24,38 23 1,3,46,47,53,63
Impulsivity 9,30,32
Risk Taking 32
Avoidance Coping 9
Gambling Motivation 32,58 4
Gambling Fallacies 30,32,58,60
Family History of Problem Gambling
14,22,23,24,32 24
Gambling at Young Age 32,60,62,68
Urban 9,47,48,57 3,7,16,24 9
Rural 66
Gambling Proximity 62 4
Gambling Venue Density 26
Specific Geographic Area 5,48 19 3,8,24,39
OTHER Low self-efficacy: 32 Unstable childhood: 60
Behavioral addictions: 4 Low self-esteem: 13
Note: Each cell lists the study number of investigation(s) that found that variable to be associated with problem gambling.
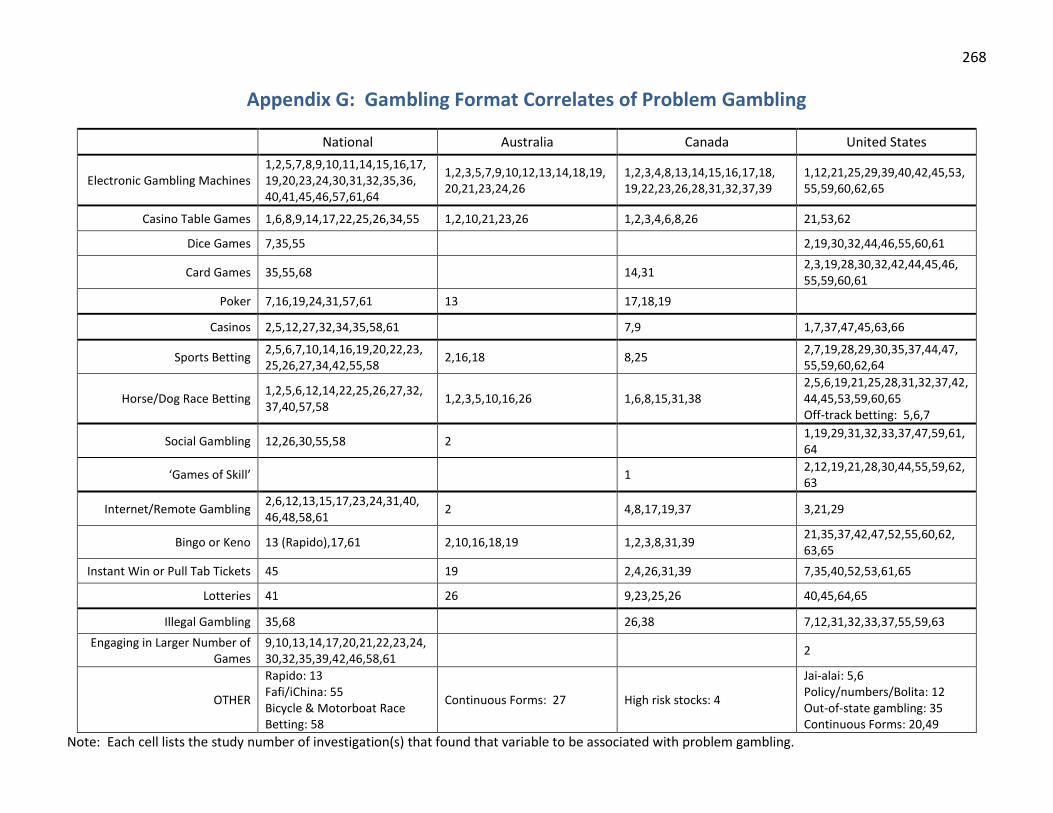
268
Appendix G: Gambling Format Correlates of Problem Gambling
National Australia Canada United States
Electronic Gambling Machines 1,2,5,7,8,9,10,11,14,15,16,17,19,20,23,24,30,31,32,35,36, 40,41,45,46,57,61,64
1,2,3,5,7,9,10,12,13,14,18,19,20,21,23,24,26
1,2,3,4,8,13,14,15,16,17,18, 19,22,23,26,28,31,32,37,39
1,12,21,25,29,39,40,42,45,53,55,59,60,62,65
Casino Table Games 1,6,8,9,14,17,22,25,26,34,55 1,2,10,21,23,26 1,2,3,4,6,8,26 21,53,62
Dice Games 7,35,55 2,19,30,32,44,46,55,60,61
Card Games 35,55,68 14,31 2,3,19,28,30,32,42,44,45,46, 55,59,60,61
Poker 7,16,19,24,31,57,61 13 17,18,19
Casinos 2,5,12,27,32,34,35,58,61 7,9 1,7,37,47,45,63,66
Sports Betting 2,5,6,7,10,14,16,19,20,22,23, 25,26,27,34,42,55,58
2,16,18 8,25 2,7,19,28,29,30,35,37,44,47, 55,59,60,62,64
Horse/Dog Race Betting 1,2,5,6,12,14,22,25,26,27,32, 37,40,57,58
1,2,3,5,10,16,26 1,6,8,15,31,38 2,5,6,19,21,25,28,31,32,37,42,44,45,53,59,60,65 Off-track betting: 5,6,7
Social Gambling 12,26,30,55,58 2 1,19,29,31,32,33,37,47,59,61,64
‘Games of Skill’ 1 2,12,19,21,28,30,44,55,59,62,63
Internet/Remote Gambling 2,6,12,13,15,17,23,24,31,40, 46,48,58,61
2 4,8,17,19,37 3,21,29
Bingo or Keno 13 (Rapido),17,61 2,10,16,18,19 1,2,3,8,31,39 21,35,37,42,47,52,55,60,62, 63,65
Instant Win or Pull Tab Tickets 45 19 2,4,26,31,39 7,35,40,52,53,61,65
Lotteries 41 26 9,23,25,26 40,45,64,65
Illegal Gambling 35,68 26,38 7,12,31,32,33,37,55,59,63
Engaging in Larger Number of Games
9,10,13,14,17,20,21,22,23,24,30,32,35,39,42,46,58,61
2
OTHER
Rapido: 13 Fafi/iChina: 55 Bicycle & Motorboat Race Betting: 58
Continuous Forms: 27 High risk stocks: 4
Jai-alai: 5,6 Policy/numbers/Bolita: 12 Out-of-state gambling: 35 Continuous Forms: 20,49
Note: Each cell lists the study number of investigation(s) that found that variable to be associated with problem gambling.

269
Appendix H: Problem and Pathological Gambling Measure
The PPGM is a 14 item assessment instrument with questions organized into three sections: Problems (7 questions), Impaired Control (4 questions), and Other Issues (3 questions). Similar to the CPGI, it uses a 12 month time frame, recognizes there to be a continuum of gambling with 4 categories (Recreational Gambler, At-Risk Gambler, Problem Gambler, Pathological Gambler), and has been field tested and refined over several years with both clinical and general population samples (unpublished work). However, it diverges from other instruments in several important respects:
1. All potential harms of problem gambling are addressed (financial, mental health, health, relationship, work/school, legal) with these questions ordered from least commonly to most commonly endorsed. This is in contrast to traditional instruments (i.e., DSM, CPGI, SOGS) where not all the possible harms of problem gambling are covered. For example, mental health problems are not asked about in the DSM and only indirectly in the SOGS (i.e., presence of guilt). Physical health problems are not addressed in either the DSM or SOGS. School and work problems are not covered in the CPGI. Engagement in illegal activities to support gambling is not addressed in the CPGI and only partially addressed in the SOGS (i.e., passing bad cheques). Financial problems are not well addressed in the DSM (i.e., relies on others to provide money). The failure to provide comprehensive coverage of the potential harms of problem gambling means that a small number of people reporting certain valid signs/symptoms of problem gambling may not be correctly identified.
2. To better capture problem gamblers in denial or who lack insight, PPGM harm questions allow for either direct admission of a problem/harm, or endorsement of something that indicates harm is occurring regardless of whether the person is willing to call it a problem.
3. All harm questions are phrased to inquire whether the person’s gambling has created difficulties either for the individual himself/herself “or someone close to you”. This is in contrast to traditional instruments where almost all the harm questions refer to problems experienced by the gambler, rather than harms that he/she may be causing in his/her immediate social network.
4. To provide better face and construct validity, to be classified as a ‘Problem Gambler’ the person is normally required to endorse 1 or more items from the Problems section and 1 or more items from the Impaired Control section. Endorsement of several problems and indices of impaired control will typically lead to the person being classified as a ‘Pathological Gambler’. Endorsement of a problem or impaired control, but not both, typically leads to classification as an ‘At Risk’ Gambler. Gamblers who do not meet the criteria for Problem, Pathological, and At Risk, are deemed to be ‘Recreational’ Gamblers.

270
This approach contrasts with traditional instruments where all items have an equal weighting so that any pattern of item endorsement that meets the necessary quantitative threshold is sufficient for designation of problem/pathological gambling (i.e., despite the fact that some items are more serious and/or diagnostic than others). Consequently, it is possible to be classified as a problem/pathological gambler without actually endorsing any significant problems or harm deriving from one’s gambling. Similarly, it is possible to indicate the presence of significant problems deriving from one’s gambling without being classified as a problem gambler. Most people would agree that for someone to be a problem gambler there needs to be evidence of a) significant negative consequences, and b) impaired control (Neal, Delfabbro, & O’Neil, 2005).
5. To minimize false positives, to be labeled as either a Problem or Pathological gambler the person also has to report gambling at least once a month on some form of gambling in the past year. None of the traditional instruments require the person to report corroborating gambling behaviour to support their report of problem gambling symptomatology. All population surveys contain a small but significant portion of people who score in the problem gambling range but report very little past year history of gambling behaviour. Research by Williams & Volberg (2009, 2010) shows that a significant portion of these individuals are not really problem gamblers. Requiring a minimal amount of gambling frequency (e.g., gambling once a month or more) before being designated as a problem gambler effectively excludes these false positives without excluding any genuine problem gamblers (Williams & Volberg, 2009, 2010).
6. To minimize false negatives (i.e., to better capture problem gamblers in denial), a person
can be classified as a Problem Gambler if: o He/she indicates a) there are other people who would say he/she has significant
problem(s) deriving from his/her gambling and b) there are other people who would say he/she has significant difficulty controlling his/her gambling. OR
o He/she endorses 3 or more items from any of the 3 categories as long as their frequency of gambling and gambling losses are equal to or greater than the median for unambiguously identified Problem and Pathological Gamblers.
o Similarly, an individual can be designated as an At Risk gambler without endorsement of any problem gambling questions if his/her frequency of gambling and gambling losses are equal to or greater than the median for unambiguously identified Problem and Pathological Gamblers.

271
Problem and Pathological Gambling Measure (PPGM)
1a. Has your involvement in gambling caused you either to borrow a significant 25 amount of money or sell some of your possessions in the past 12 months? (Yes/No). 1b. Has your involvement in gambling caused significant financial concerns for you or someone close to you in the past 12 months? (Yes/No). (Note: do not score 1 for 1b if 1 has already been scored for 1a). 2. Has your involvement in gambling caused significant mental stress in the form of guilt, anxiety, or depression for you or someone close to you in the past 12 months? (Yes/No). 3a. Has your involvement in gambling caused serious problems 26 in your relationship with your spouse/partner, or important friends or family in the past 12 months? (Note: Family is whomever the person themselves defines as “family”)(Yes/No). 3b. Has your involvement in gambling caused you to repeatedly neglect your children or family in the past 12 months? (Yes/No). (Note: do not score 1 for 3b if 1 has already been scored for 3a). 4. Has your involvement in gambling resulted in significant health problems or injury for you or someone close to you in the past 12 months? (Yes/No). 5a. Has your involvement in gambling caused significant work or school problems for you or someone close to you in the past 12 months? (Yes/No). 5b. Has your involvement in gambling caused you to miss a significant amount of time off work or school in the past 12 months? (Yes/No). (Note: do not score 1 for 5b if 1 has already been scored for 5a). 6. Has your involvement in gambling caused you or someone close to you to write bad cheques, take money that didn’t belong to you or commit other illegal acts to support your gambling in the past 12 months? (Yes/No). 7. Is there anyone else who would say that your involvement in gambling in the past 12 months has caused any significant problems regardless of whether you agree with them or not? (Yes/No).
PROBLEMS SCORE /7
25
If people ask what ‘significant’ means, say ‘significant means something that either you or someone else would say is considerable, important, or major’, either because of its frequency or seriousness. 26
If people ask what ‘problem’ means say ‘a difficulty that needs to be fixed’.

272 8. In the past 12 months, have you often gambled longer, with more money or more frequently than you intended to? (Yes/No). 9. In the past 12 months, have you often gone back to try and win back the money you lost? (Yes/No). 10a. In the past 12 months, have you made any attempts to either cut down, control or stop your gambling? (Yes/No). (go to 11 if ‘no’) (this item not scored) 10b. Were you successful in these attempts? (Yes/No). (score ‘1’ for no and ‘0’ for yes) 11. In the past 12 months, is there anyone else who would say that you have had difficulty controlling your gambling, regardless of whether you agreed with them or not? (Yes/No).
IMPAIRED CONTROL SCORE /4
12. In the past 12 months, would you say you have been preoccupied with gambling? (Yes/No). 13. In the past 12 months, when you were not gambling did you often experience irritability, restlessness or strong cravings for it? (Yes/No). 14. In the past 12 months, did you find you needed to gamble with larger and larger amounts of money to achieve the same level of excitement? (Yes/No).
OTHER ISSUES SCORE /3
TOTAL SCORE /14

273
PPGM Scoring and Classification PATHOLOGICAL GAMBLER (4) 1. Problems Score of 1 or higher, plus 2. Impaired Control Score of 1 or higher, plus 3. Total Score of 5 or higher, plus 4. Reported gambling frequency of at least once a month on some form of gambling.
PROBLEM GAMBLER (3) 1. Problems Score of 1 or higher, plus 2. Impaired Control Score of 1 or higher, plus 3. Total Score of 2 to 4, plus 4. Reported gambling frequency of at least once a month on some form of gambling. OR 1. Total Score of 3 or higher, plus 2. Frequency of gambling27 AND average reported gambling loss (not net loss)28 > median for
unambiguously identified Problem and Pathological Gamblers in the population (i.e., as established by the most recent population prevalence survey).
AT RISK GAMBLER (2) (this category also includes people who may be problem gamblers in denial) 1. Does not meet criteria for Problem or Pathological gambling, plus 2. Total Score of 1 or higher OR
1. Frequency of gambling1 AND average reported gambling loss (not net loss)2 > median for unambiguously identified Problem and Pathological Gamblers in the population (i.e., as established by the most recent population prevalence survey).
RECREATIONAL GAMBLER (1)
Gambler who does not meet criteria for Pathological, Problem or At-Risk gambler. NON-GAMBLER (0)
No reported gambling on any form in past year.
27
Simplest way of establishing this is using the highest frequency of gambling reported for any individual form in the past year. 28
Reported gambling losses tend to be a more accurate estimate of true losses compared to net loss, especially in problem gamblers (i.e., problem gamblers often report winning as much or more than they lose and thus may not report any net loss) (Wood, R.T. & Williams, R.J. (2007b). How much money do you spend on gambling? The comparative validity of question wordings used to assess gambling expenditure. International Journal of Social Research Methodology: Theory & Practice, 10 (1), 63-77. http://hdl.handle.net/10133/752. Note: The person’s income and net worth/debt can be taken into account when deciding whether the gambling loss criterion should apply.