The Political Economy under Monetary Union: has the euro made a
48
WORKING PAPER SERIES NO 956 / NOVEMBER 2008 THE POLITICAL ECONOMY UNDER MONETARY UNION HAS THE EURO MADE A DIFFERENCE? by Marcel Fratzscher and Livio Stracca
Transcript of The Political Economy under Monetary Union: has the euro made a

Work ing PaPer Ser i e Sno 956 / november 2008
The PoliTical economy under moneTary union
haS The euro made a difference?
by Marcel Fratzscher and Livio Stracca

WORKING PAPER SER IESNO 956 / NOVEMBER 2008
In 2008 all ECB publications
feature a motif taken from the
10 banknote.
THE POLITICAL ECONOMY
UNDER MONETARY UNION
HAS THE EURO MADE
A DIFFERENCE? 1
by Marcel Fratzscherand Livio Stracca 2
This paper can be downloaded without charge fromhttp://www.ecb.europa.eu or from the Social Science Research Network
electronic library at http://ssrn.com/abstract_id=1291164.
1 Paper prepared for the 48th Panel of Economic Policy. We would like to thank the editor in charge of this paper, Philippe Martin, and three
anonymous referees for comments. The views expressed in this paper are those of the authors and do not necessarily
reflect those of the European Central Bank.
2 European Central Bank, Kaiserstrasse 29, D-60311 Frankfurt am Main, Germany;
e-mail: [email protected] and [email protected]

© European Central Bank, 2008
Address Kaiserstrasse 29 60311 Frankfurt am Main, Germany
Postal address Postfach 16 03 19 60066 Frankfurt am Main, Germany
Telephone +49 69 1344 0
Website http://www.ecb.europa.eu
Fax +49 69 1344 6000
All rights reserved.
Any reproduction, publication and reprint in the form of a different publication, whether printed or produced electronically, in whole or in part, is permitted only with the explicit written authorisation of the ECB or the author(s).
The views expressed in this paper do not necessarily refl ect those of the European Central Bank.
The statement of purpose for the ECB Working Paper Series is available from the ECB website, http://www.ecb.europa.eu/pub/scientific/wps/date/html/index.en.html
ISSN 1561-0810 (print) ISSN 1725-2806 (online)

3ECB
Working Paper Series No 956November 2008
Abstract 4
Non-technical summary 5
1 Introduction 7
2 Data 10
2.1 Political news 11
2.2 Stock market data and other variables 12
3 The transmission of political shocks on stock markets and EMU 13
3.1 The role of EMU 13
3.2 Baseline results 14
4 The role of economic policy and institutions 18
5 Conclusions and policy implications 21
References 23
Appendix 26
European Central Bank Working Paper Series 45
CONTENTS

4ECBWorking Paper Series No 956November 2008
Abstract
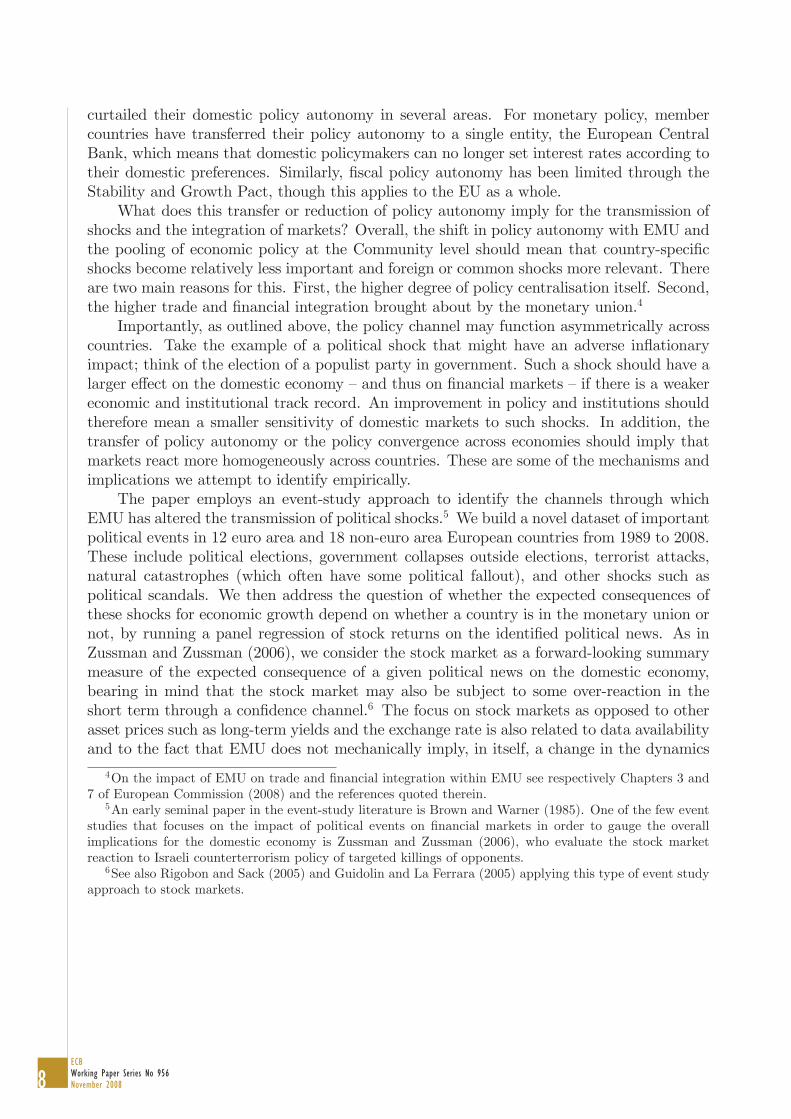
Economic and Monetary Union (EMU) has transformed Europe and has created an integrated pan-European economy. Much research has focused on understanding this integration process and what benefits and costs it entails. This paper identifies a political economy channel of EMU as the monetary union implies that member states had to transfer or at least curtail their policy autonomy in several areas, such as monetary policy and fiscal policy. The paper shows that EMU has helped reduce the impact of political shocks on the domestic economy of member states but magnified the transmission of political shocks within the euro area. Equally importantly, economies with a weaker track record in terms of economic and institutional quality exhibited a significantly higher sensitivity to domestic political shocks before EMU, but not thereafter. While this may entail that EMU has brought benefits to countries with a weaker economic and institutional stability by insulating them from adverse political developments at home, a potential drawback is that it may provide weaker market discipline for domestic political stability.
Keywords: EMU, political economy, political news, monetary policy, fiscal policy, stock markets, transmission.
JEL Classification: F31; F33; G14.

5ECB
Working Paper Series No 956November 2008
6ECBWorking Paper Series No 956November 2008

7ECB
Working Paper Series No 956November 2008
8ECBWorking Paper Series No 956November 2008

9ECB
Working Paper Series No 956November 2008

10ECBWorking Paper Series No 956November 2008

11ECB
Working Paper Series No 956November 2008

12ECBWorking Paper Series No 956November 2008

13ECB
Working Paper Series No 956November 2008

14ECBWorking Paper Series No 956November 2008
15ECB
Working Paper Series No 956November 2008

16ECBWorking Paper Series No 956November 2008

17ECB
Working Paper Series No 956November 2008

18ECBWorking Paper Series No 956November 2008

19ECB
Working Paper Series No 956November 2008

20ECBWorking Paper Series No 956November 2008

21ECB
Working Paper Series No 956November 2008

22ECBWorking Paper Series No 956November 2008

23ECB
Working Paper Series No 956November 2008

24ECBWorking Paper Series No 956November 2008

25ECB
Working Paper Series No 956November 2008

26ECBWorking Paper Series No 956November 2008
APPENDIX
Table A.1: Country sample
Austria Ireland Bulgaria Latvia Slovak Rep.Belgium Italy Cyprus Lithuania SloveniaFinland Luxembourg Czech Rep. Malta SwedenFrance Netherlands Denmark Poland Switzerland
Germany Portugal Estonia Romania UKGreece Spain Hungary Russia Ukraine
euro area non-euro area
Table A.2: Summary of identified shocks
Total
All 213
Euro area 99 Pre-EMU 38 Post-EMU 61
Non - euro area 114 Pre-EMU 35 Post-EMU 79
27ECB
Working Paper Series No 956November 2008
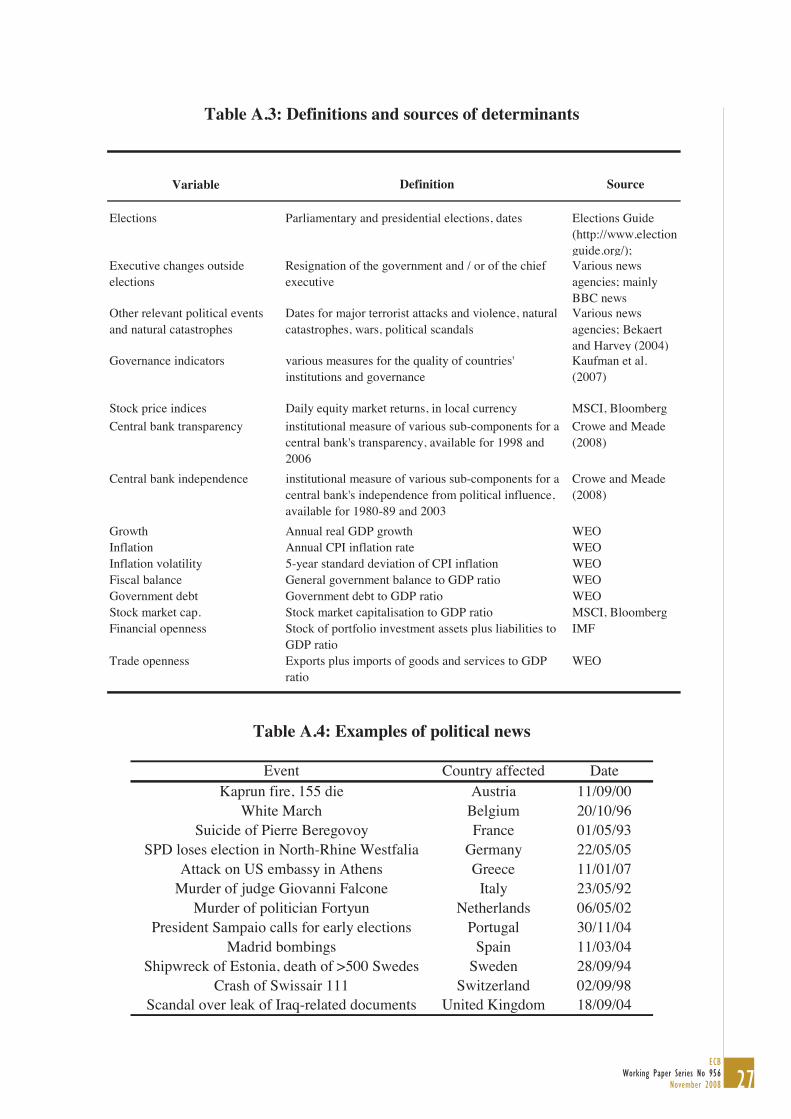
Table A.3: Definitions and sources of determinants
Variable Definition Source
Elections Parliamentary and presidential elections, dates Elections Guide (http://www.electionguide.org/);
Executive changes outside elections
Resignation of the government and / or of the chief executive
Various news agencies; mainly BBC news
Other relevant political events and natural catastrophes
Dates for major terrorist attacks and violence, natural catastrophes, wars, political scandals
Various news agencies; Bekaert and Harvey (2004)
Governance indicators various measures for the quality of countries' institutions and governance
Kaufman et al. (2007)
Stock price indices Daily equity market returns, in local currency MSCI, BloombergCentral bank transparency institutional measure of various sub-components for a
central bank's transparency, available for 1998 and 2006
Crowe and Meade (2008)
Central bank independence institutional measure of various sub-components for a central bank's independence from political influence, available for 1980-89 and 2003
Crowe and Meade (2008)
Growth Annual real GDP growth WEOInflation Annual CPI inflation rate WEOInflation volatility 5-year standard deviation of CPI inflation WEOFiscal balance General government balance to GDP ratio WEOGovernment debt Government debt to GDP ratio WEOStock market cap. Stock market capitalisation to GDP ratio MSCI, BloombergFinancial openness Stock of portfolio investment assets plus liabilities to
GDP ratioIMF
Trade openness Exports plus imports of goods and services to GDP ratio
WEO
Table A.4: Examples of political news
Event Country affected DateKaprun fire, 155 die Austria 11/09/00
White March Belgium 20/10/96Suicide of Pierre Beregovoy France 01/05/93
SPD loses election in North-Rhine Westfalia Germany 22/05/05Attack on US embassy in Athens Greece 11/01/07
Murder of judge Giovanni Falcone Italy 23/05/92Murder of politician Fortyun Netherlands 06/05/02
President Sampaio calls for early elections Portugal 30/11/04Madrid bombings Spain 11/03/04
Shipwreck of Estonia, death of >500 Swedes Sweden 28/09/94Crash of Swissair 111 Switzerland 02/09/98
Scandal over leak of Iraq-related documents United Kingdom 18/09/04

28ECBWorking Paper Series No 956November 2008
Table A.5: Summary statistics of determinants
Mean Std. Dev. Min Max
Inflation 5.554 11.86 -1.319 21.51Inflation volatility 2.186 2.555 0.263 8.345Fiscal balance -2.385 3.421 -16.963 8.339Government debt 0.408 0.317 -0.442 1.242Stock market cap. 0.686 0.716 0.004 3.024Financial openness 5.051 27.51 0.013 135.8Trade openness 0.291 0.210 0.016 1.085Political stability 0.844 0.486 -1.036 1.673Government effectiveness 1.322 0.770 -0.722 2.391Government accountability 1.126 0.462 -0.869 1.826Regulatory quality 1.081 0.529 -0.795 2.007Rule of law 1.692 0.441 0.750 2.220Enforcement of contracts 7.164 1.388 4.543 8.945
Table A.6: Correlations across determinants
InflationInflation volatility
Fiscal balance
Govern. debt
Stock mkt cap.
Financial openness
Trade openness
Political stability
Gov. effectiv.
Gov. account.
Regulat. quality Rule of law
Inflation 1Inflation volatility 0.5642 1Fiscal balance -0.4977 -0.4559 1Government debt 0.1234 0.0452 -0.4271 1Stock market cap. -0.2897 -0.3006 0.359 -0.0847 1Financial openness -0.049 -0.0038 0.3936 -0.4901 0.2013 1Trade openness -0.2956 -0.4277 0.1912 0.2408 0.2255 -0.1263 1Political stability -0.3698 -0.1561 0.4863 -0.5004 0.2274 0.4596 -0.2083 1Gov. effectiveness -0.4162 -0.3102 0.4895 -0.659 0.1857 0.2468 -0.0729 0.6759 1Gov. accountab. -0.5437 -0.4136 0.626 -0.511 0.3275 0.31 0.1819 0.6419 0.6598 1Regulatory quality -0.3791 -0.4075 0.6571 -0.5365 0.5092 0.425 0.2094 0.5763 0.6444 0.7389 1Rule of law -0.4694 -0.3723 0.5379 -0.6603 0.2142 0.3434 0.0464 0.7282 0.9325 0.7257 0.7186 1Enforcement -0.3794 -0.325 0.4409 -0.4474 0.2857 0.1964 0.1791 0.5405 0.8503 0.5623 0.6518 0.8904

29ECB
Working Paper Series No 956November 2008
Figu
re 1
: Mea
n an
d di
sper
sion
of i
nfla
tion
and
grow
th a
cros
s eur
o ar
ea c
ount
ries
02468std. deviation
02468percent
1990
1995
2000
2005
2010
.
CP
I Inf
latio
n
0.511.52std. deviation
.511.522.53percent
1990
1995
2000
2005
2010
.
CP
I Inf
latio
n vo
latil
ity
123456std. deviation
012345percent
1990
1995
2000
2005
2010
.
GD
P G
row
th
.511.5std. deviation
11.522.5percent
1990
1995
2000
2005
2010
.
GD
P G
row
th v
olat
ility
N
otes
: The
figu
res s
how
the
unw
eigh
ted
aver
age
(in p
erce
nt) a
nd th
e di
sper
sion
(mea
sure
d as
the
annu
al st
anda
rd d
evia
tion)
acr
oss t
he 1
2 eu
ro a
rea
coun
tries
, fo
r CPI
infla
tion,
GD
P gr
owth
and
bot
h of
thei
r vol
atili
ties (
mea
sure
d as
the
5-ye
ar m
ovin
g st
anda
rd d
evia
tion)
.
Mea
n (lh
s)
Dis
pers
ion
(rhs
)
30ECBWorking Paper Series No 956November 2008
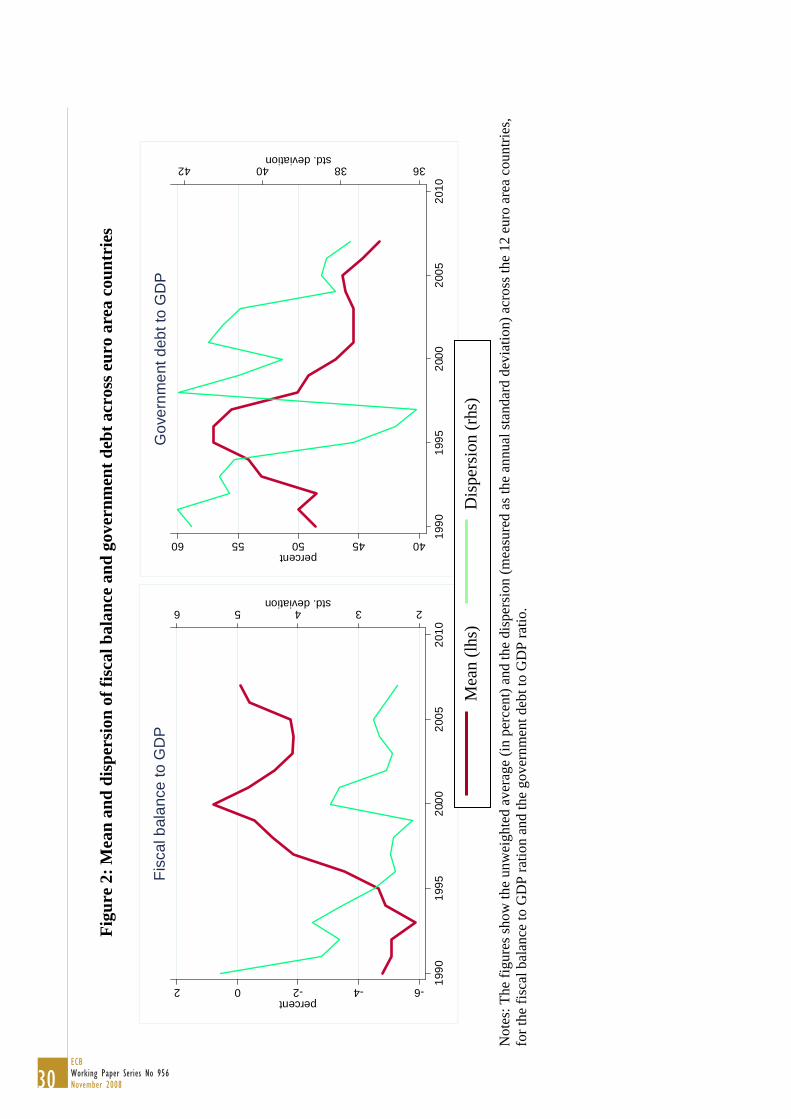
Figu
re 2
: Mea
n an
d di
sper
sion
of f
isca
l bal
ance
and
gov
ernm
ent d
ebt a
cros
s eur
o ar
ea c
ount
ries
23456std. deviation
-6-4-202percent
1990
1995
2000
2005
2010
.
Fisc
al b
alan
ce to
GD
P
36384042std. deviation
4045505560percent
1990
1995
2000
2005
2010
.
Gov
ernm
ent d
ebt t
o G
DP
N
otes
: The
figu
res s
how
the
unw
eigh
ted
aver
age
(in p
erce
nt) a
nd th
e di
sper
sion
(mea
sure
d as
the
annu
al st
anda
rd d
evia
tion)
acr
oss t
he 1
2 eu
ro a
rea
coun
tries
, fo
r the
fisc
al b
alan
ce to
GD
P ra
tion
and
the
gove
rnm
ent d
ebt t
o G
DP
ratio
.
Mea
n (lh
s)
Dis
pers
ion
(rhs
)

31ECB
Working Paper Series No 956November 2008
Figure 3: Time-varying equity market responses to shocks – euro area countries versus non-euro area countries
A. Equity market response to domestic shocks
1.2
1.4
1.6
1.8
22.
2.
1990 1995 2000 2005 2010.
Euro area Non-euro area
B. Equity market response to euro area shocks
.4.5
.6.7
.
1990 1995 2000 2005 2010.
Euro area Non-euro area
Notes: The figure show the equity market response of the 12 euro area countries and the 18 non-euro area countries to domestic shocks (Panel A) and to shocks in other euro area countries (Panel B), using recursive panel estimations by adding one year of data sequentially. The model specification is that of equation (1):
titititi ZSr ,,,, εωβα +++= (1) where ri,t are the daily equity returns, S=[Sdom,Sea,Snea] is a vector of the three types of shocks and Zt is a vector of controls.

32ECBWorking Paper Series No 956November 2008
Figure 4: Time-varying responses – euro area core versus periphery
A. Equity market response to domestic shocks
11.
52
2.5
resp
onse
coe
ffici
ent
1990 1995 2000 2005 2010.
Euro area core Euro area periphery
B. Equity market response to euro area shocks
.4.5
.6.7
resp
onse
coe
ffici
ent
1990 1995 2000 2005 2010.
Euro area core Euro area periphery
Notes: The figures show the equity market response of the euro area “core” countries versus the “periphery” countries to domestic shocks (Panel A) and shocks in other euro area countries (Panel B), using recursive panel estimations. The model specification is that of equation (1):
titititi ZSr ,,,, εωβα +++= (1) where ri,t are the daily equity returns, S=[Sdom,Sea,Snea] is a vector of the three types of shocks and Zt is a vector of controls, only that the panel is split into two country samples.

33ECB
Working Paper Series No 956November 2008
Figure 5: Time-varying heterogeneity in equity market responses to shocks – euro area countries
0.5
11.
52
std.
dev
iatio
n
1990 1995 2000 2005 2010.
Domestic shocks Euro area shocks
Notes: The figure show the dispersion – measured as the annual standard deviation across the response coefficients – in the equity market responses across the euro area 12 countries to domestic shocks and to shocks in other euro area countries, using recursive estimations for each country separately, using a model specification akin to that of equation (1):
titititi ZSr ,,,, εωβα +++= (1) only that here the model is estimated separately for each euro area country.

34ECBWorking Paper Series No 956November 2008
Figure 6: World Bank indicator for political stability in selected country groups
0.40
0.50
0.60
0.70
0.80
0.90
1.00
1.10
1.20
1.30
1996 1998 2000 2002 2003 2004 2005 2006
Euro area periphery Euro area core
Other European countries EU New Member States outside the euro area
Notes: The figure shows the indicator for Political Stability and Absence of Violence in the selected country groups. A higher reading of the indicator implies a more politically stable country. The indicator measures, inter alia, perceptions of the likelihood that the government will be destabilised or overthrown by unconstitutional or violent means, including domestic violence and terrorism. See Kaufmann et al. (2007) for further explanations. New EU Member States outside the euro area include Poland, the Czech Republic, Hungary, Romania, Bulgaria, Latvia, Estonia, and Lithuania.

35ECB
Working Paper Series No 956November 2008
Table 1: Baseline results – transmission of shocks to domestic equity markets
coef. s.e. coef. s.e.A. EMU effect: (St * Dt * EAi) Euro area countries - pre-1999: 1 + Domestic -0.601 ** 0.269 Domestic 1.584 *** 0.192 Euro area 0.362 ** 0.145 Euro area 0.423 *** 0.064 Non - euro area 0.102 0.096 Non - euro area 0.217 *** 0.025B. Post-99 common effect: (St * Dt) Euro area countries - post-1999: 1 + 2 + 1 + Domestic -0.144 0.189 Domestic 0.839 *** 0.082 Euro area 0.138 0.100 Euro area 0.922 *** 0.114 Non - euro area -0.071 0.076 Non - euro area 0.249 *** 0.051C. Euro area-specific effect: (St * EAi) Non-euro area countries - pre-1999: 1
Domestic 0.368 0.235 Domestic 1.216 *** 0.135 Euro area -0.050 0.094 Euro area 0.472 *** 0.069 Non - euro area 0.055 0.052 Non - euro area 0.163 *** 0.050D. Common overall effect: St Non-euro area countries - post-1999: 1 + Domestic 1.216 *** 0.135 Domestic 1.072 *** 0.191 Euro area 0.472 *** 0.069 Euro area 0.610 *** 0.107 Non - euro area 0.163 *** 0.050 Non - euro area 0.092 * 0.052
CountriesObs.R^2
Overall effects
30
Benchmark
52000.101
Notes: The table shows the effect of shocks from various origins (domestic, euro area, non – euro area) on equity markets, using the difference-in-difference specification of equation (2):
titiittiititti
ittiti
ZEADSEASDSEADSr
,,99
,1,299
,1
399
2,1,
)**()*()*( (2)
where EAi = 1 for a euro area country and zero otherwise, and Dt = 1 for the period since 1999. The left-hand panel shows the individual coefficients of (2); the right-hand panel gives the overall effects of shocks for different country groups and periods. The OLS estimator takes into account clustering across residuals by country. ***, **, and * indicates statistical significance at the 1%, 5%, and 10% levels, respectively.

36ECBWorking Paper Series No 956November 2008
Tab
le 2
: Rob
ustn
ess
– al
tern
ativ
e E
MU
bre
ak d
ate,
cou
ntry
sam
ple
and
time
sam
ple
coef
.s.e
.co
ef.
s.e.
coef
.s.e
.co
ef.
s.e.
coef
.s.e
.A
. EM
U e
ffec
t:
(S t
* D
t * E
Ai)
Dom
estic
-0.6
18**
0.286
-0.7
16**
0.339
-0.6
03**
0.271
-0.6
13**
0.270
-0.5
86**
0.275
Euro
are
a0.
367
**0.1
480.
478
***
0.141
0.36
2**
0.146
0.13
30.1
400.
060
0.132
Non
- eu
ro a
rea
0.09
10.0
980.
145
0.090
0.10
10.0
950.
267
*0.1
34-0
.057
0.103
B. P
ost-
99 c
omm
on e
ffec
t:
(S t
* D
t)D
omes
tic-0
.237
0.203
-0.0
300.2
79-0
.150
0.188
-0.1
330.1
89-0
.159
0.197
Euro
are
a0.
108
0.091
0.02
10.0
920.
129
0.100
0.15
8*
0.090
0.44
0**
*0.0
79N
on -
euro
are
a0.
141
**0.0
67-0
.118
*0.0
66-0
.075
0.073
-0.0
300.0
920.
093
0.086
C. E
uro
area
-spe
cific
eff
ect:
(S t
* E
Ai)
Dom
estic
0.40
2*
0.235
0.30
50.3
510.
368
0.234
0.37
70.2
350.
298
0.240
Euro
are
a-0
.072
0.097
-0.0
730.1
17-0
.050
0.094
0.01
00.1
03-0
.076
0.100
Non
- eu
ro a
rea
0.08
00.0
480.
031
0.040
0.05
70.0
49-0
.070
0.101
0.07
10.0
61D
. Com
mon
ove
rall
effe
ct:
S
t
Dom
estic
1.29
8**
*0.1
101.
279
***
0.294
1.21
6**
*0.1
351.
207
***
0.132
1.28
6**
*0.1
42Eu
ro a
rea
0.48
8**
*0.0
660.
495
***
0.098
0.47
2**
*0.0
690.
838
***
0.069
0.49
9**
*0.0
76N
on -
euro
are
a-0
.001
0.033
0.19
0**
*0.0
330.
162
***
0.046
0.91
6**
*0.0
900.
143
**0.0
59C
ount
ries
Obs
.R
^20.
003
EM
U-b
reak
199
7
0.10
3
30 5200
Eur
ope
27
27 4594
0.10
1
All
days
30
(1)
(2)
(3)
1485
450.
101
Ban
king
ret
urns
(5)
24 4231
0.00
3
Abs
olut
e re
turn
s
(4)
30 5200
ws t
he e
ffec
t of s
hock
s fro
m v
ario
us o
rigin
s on
equi
ty m
arke
ts, u
sing
the
diff
eren
ce-in
-diff
eren
ce sp
ecifi
catio
n of
equ
atio
n (2
):
titi
it
tii
tit
ti
it
titi
ZEA
DS
EAS
DS
EAD
Sr
,,
99,
1,
299
,1
399
2,
1,
)*
*(
)*
()
*(
1 fo
r a e
uro
area
cou
ntry
and
zer
o ot
herw
ise,
and
Dt=
1 fo
r the
per
iod
since
199
9. M
odel
(1) r
epla
ces
the
dum
my
for t
he b
egin
ning
of E
MU
in 1
MU
sta
rting
in 1
997.
Mod
el (2
) use
s a
redu
ced
coun
try s
ampl
e th
at e
xclu
des
the
thre
e “o
ld”
EU m
embe
rs D
enm
ark,
Sw
eden
and
UK
. Mod
el (3
) us
tion,
i.e.
not
onl
y th
ose
with
sho
cks
but a
lso
days
whe
n no
sho
ck o
ccur
red
in a
ny o
f the
30
coun
tries
in th
e sa
mpl
e. M
odel
(4) u
ses
abso
lute
retu
rs,
whi
le (5
) tak
es re
turn
s of
fina
ncia
l sec
tor e
quity
indi
ces a
s de
pend
ent v
aria
ble.
The
OLS
est
imat
or ta
kes
into
acc
ount
clu
ster
ing
acro
ss re
sidu
als
bin
dica
tes s
tatis
tical
sign
ifica
nce
at th
e 1%
, 5%
, and
10%
leve
ls, r
espe
ctiv
ely.

37ECB
Working Paper Series No 956November 2008
Table 3: Robustness tests – control for risk aversion, monetary policy shocks and macro shocks
coef. s.e. coef. s.e. coef. s.e. coef. s.e.A. EMU effect: (St * Dt * EAi)Domestic -0.601 ** 0.269 -0.531 * 0.290 -0.607 ** 0.266 -0.522 * 0.292Euro area 0.362 ** 0.145 0.366 ** 0.147 0.363 ** 0.146 0.365 ** 0.146Non - euro area 0.102 0.096 0.100 0.095 0.102 0.096 0.099 0.095Controls:1. VIX 0.033 ** 0.016 0.033 ** 0.0162. EA interest rates -3.170 *** 0.517 -3.108 *** 0.4983. US & EA macro news: US newsIndustrial production 1.608 *** 0.449 1.656 *** 0.454ISM - NAPM -0.006 0.031 -0.004 0.031Nonfarm payroll -0.001 0.002 -0.001 0.002Unemployment 0.664 0.417 0.697 * 0.407Consumer confidence -0.032 0.024 -0.031 0.023Trade balance 0.090 ** 0.033 0.098 *** 0.034Advance GDP 0.305 * 0.160 0.303 * 0.153CPI 0.889 1.210 0.781 1.204PPI 2.080 * 1.216 1.992 1.231Housing starts 0.000 0.001 0.000 0.001Retail sales 0.372 * 0.217 0.388 * 0.216Workweek 5.185 *** 1.180 5.096 *** 1.095 Euro area newsCPI Ger 0.518 0.531 0.590 0.512Trade balance Ger 0.005 0.042 0.002 0.042Current account Fra 0.000 0.000Consumer confid. Fra -0.009 0.045 0.006 0.046GDP Ita 2.875 *** 0.744 2.772 *** 0.740CPI euro area . *** 1.143 4.829 *** 1.133GDP euro area 0.000 0.000Retail sales euro area 0.569 *** 0.135 0.568 *** 0.132Unemployment euro area 1.260 1.027 1.262 1.021
Cty.Obs.R^2
(1) (2) (3) (4)
3052000.113
3052000.107
52000.101
3052000.119
30
Benchmark with all controls with macro newswith VIX & int. rates
Notes: The table shows the effect of shocks from various origins on equity markets, while controlling for risk aversion, monetary policy shocks and various US and euro area macro news in the vector Zi,t,based on equation (2):
titiittiititti
ittiti
ZEADSEASDSEADSr
,,99
,1,299
,1
399
2,1,
)**()*()*( (2)
where EAi = 1 for a euro area country and zero otherwise, and Dt = 1 for the period since 1999. The OLS estimator takes into account clustering across residuals by country. ***, **, and * indicates statistical significance at the 1%, 5%, and 10% levels, respectively.

38ECBWorking Paper Series No 956November 2008
Table 4: The role of monetary policy performance
Determinant X i,t :
coef. s.e. coef. s.e. coef. s.e. coef. s.e.EMU effect: Domestic -0.493 *** 0.138 -0.360 0.485 Euro area 0.293 *** 0.090 -0.154 0.148 Non - euro area -0.081 0.147 -0.256 0.220Euro area countries - pre-1999: 3 + Domestic 0.181 *** 0.043 0.002 0.161 Euro area 0.302 *** 0.073 0.201 0.276 Non - euro area 0.221 ** 0.076 -0.263 0.361Euro area countries - post-1999: 3 + 2 + 1 + Domestic -0.020 0.075 -0.111 ** 0.045 Euro area 0.100 0.096 0.087 0.231 Non - euro area 0.019 0.097 -0.376 0.326Non-euro area countries - pre-1999: 3
Domestic 0.108 0.068 -0.104 0.075 -0.030 0.088 0.028 0.193 Euro area -0.034 * 0.016 0.017 0.055 -0.091 * 0.049 0.226 *** 0.046 Non - euro area -0.033 ** 0.012 -0.064 ** 0.028 -0.015 0.043 -0.237 0.153Non-euro area countries - post-1999: 3 + Domestic 0.187 *** 0.038 0.273 0.371 Euro area 0.308 *** 0.081 0.472 0.470 Non - euro area 0.227 ** 0.094 0.008 0.477
CountriesObs.R^2
Inflation Inflation volatility(1) (2) (3) (4)
30 30 30 305081 5081 5065 50650.099 0.107 0.100 0.104
Notes: The table shows the effect of shocks, interacted with policy proxies Xi,t , for (1) and (3) based on equation (3):
titititiititti
ittiti
ZXSEASDSEADSr
,,,,3,299
,1
399
2,1,
)*()*()*( (3)
and for (2) and (4) based on equation (4):
tititiittiitti
tiitititti
titiititti
ittiti
ZXEADSEADSXEASXDS
XSEASDSEADSr
,,,99
,299
,1
,99
,2,99
,1
,,3,299
,1
399
2,1,
)***()**(
)**()**(
)*()*()*( (4)
where Zi,t includes the linear effects of Xi,t. The OLS estimator takes into account clustering across residuals by country. ***, **, and * indicates statistical significance at the 1%, 5%, and 10% levels, respectively.

39ECB
Working Paper Series No 956November 2008
Table 5: The role of fiscal policy
Determinant X i,t :
coef. s.e. coef. s.e. coef. s.e. coef. s.e.EMU effect: Domestic -0.041 0.086 -1.748 * 0.912 Euro area -0.066 0.069 1.026 * 0.497 Non - euro area -0.041 0.037 1.369 *** 0.439Euro area countries - pre-1999: 3 + Domestic -0.135 ** 0.057 0.225 0.407 Euro area 0.011 0.068 2.281 4.588 Non - euro area 0.019 0.075 2.317 4.958Euro area countries - post-1999: 3 + 2 + 1 + Domestic -0.049 ** 0.022 -0.061 0.414 Euro area 0.097 ** 0.043 1.995 4.589 Non - euro area 0.105 * 0.053 2.031 4.959Non-euro area countries - pre-1999: 3
Domestic -0.082 *** 0.019 -0.156 *** 0.047 0.128 0.226 -0.948 5.003 Euro area 0.013 0.015 -0.011 0.021 0.036 0.245 1.108 ** 0.462 Non - euro area 0.007 0.008 -0.003 0.015 0.130 0.090 1.144 * 0.626Non-euro area countries - post-1999: 3 + Domestic -0.029 * 0.016 0.515 *** 0.089 Euro area 0.117 *** 0.040 2.571 4.529 Non - euro area 0.125 ** 0.053 2.607 4.910
CountriesObs.R^2
Fiscal balance Government debt(1) (2) (3) (4)
30 30 30 305198 5198 4819 48190.102 0.105 0.096 0.099
Notes: See Table 4.

40ECBWorking Paper Series No 956November 2008
Table 6: The role of financial openness and trade openness
Determinant X i,t :
coef. s.e. coef. s.e. coef. s.e. coef. s.e. coef. s.e. coef. s.e.EMU effect: Domestic 1.504 ** 0.684 2.214 ** 0.887 -0.829 1.238 Euro area -0.082 0.274 -0.006 0.014 0.213 0.231 Non - euro area 0.142 0.213 0.006 0.009 0.279 ** 0.115Euro area countries - pre-1999: 3 + Domestic -0.453 * 0.246 -0.001 0.001 0.764 1.229 Euro area -0.981 * 0.581 -0.810 1.166 0.971 1.239 Non - euro area -0.558 0.578 -0.749 1.169 1.087 1.241Euro area countries - post-1999: 3 + 2 + 1 + Domestic 0.192 *** 0.063 0.100 0.159 0.229 *** 0.024 Euro area -0.336 0.487 -0.709 1.176 0.437 ** 0.161 Non - euro area 0.087 0.482 -0.648 1.179 0.552 *** 0.173Non-euro area countries - pre-1999: 3
Domestic -0.223 0.166 0.311 0.660 0.000 0.001 0.740 1.170 0.030 0.106 -0.298 * 0.170 Euro area 0.086 0.092 -0.218 0.180 -0.003 *** 0.001 -0.069 *** 0.010 -0.111 *** 0.017 -0.090 0.066 Non - euro area 0.005 0.047 0.206 0.193 -0.002 *** 0.000 -0.008 0.006 -0.028 ** 0.012 0.025 0.040Non-euro area countries - post-1999: 3 + Domestic -0.549 *** 0.125 -1.373 *** 0.374 -0.003 0.120 Euro area -1.077 ** 0.418 -2.182 ** 0.867 0.205 0.169 Non - euro area -0.653 0.417 -2.121 ** 0.870 0.320 * 0.179
CountriesObs.R^2
Stock market capitalisation Financial openness Trade openness(1) (2) (3) (4) (5) (6)
30 30 30 30 30 304137 4137 4789 4789 4595 45950.130 0.133 0.109 0.113 0.116 0.119
Notes: See Table 4.

41ECB
Working Paper Series No 956November 2008
Table 7: The role of institutions
Determinant X i,t :
coef. s.e. coef. s.e. coef. s.e. coef. s.e. coef. s.e. coef. s.e.EMU effect: Domestic 1.426 *** 0.330 1.100 *** 0.163 2.204 *** 0.476 Euro area -0.339 0.398 -0.226 0.298 -0.462 0.525 Non - euro area -0.337 0.219 -0.251 0.220 -0.458 0.395Euro area countries - pre-1999: 3 + Domestic -1.079 ** 0.437 -0.617 *** 0.205 -1.891 *** 0.511 Euro area -1.045 ** 0.451 -0.595 ** 0.231 -1.716 *** 0.531 Non - euro area -0.955 ** 0.454 -0.627 ** 0.240 -1.652 *** 0.536Euro area countries - post-1999: 3 + 2 + 1 + Domestic 0.122 0.316 0.120 0.207 0.247 0.331 Euro area 0.156 0.333 0.142 0.232 0.423 0.360 Non - euro area 0.246 0.337 0.111 0.242 0.487 0.368Non-euro area countries - pre-1999: 3
Domestic -0.357 *** 0.090 -0.136 0.139 -0.298 *** 0.078 -0.030 0.128 -0.385 *** 0.087 -0.259 * 0.134 Euro area 0.010 0.154 -0.102 0.137 0.178 ** 0.086 -0.008 0.074 0.138 0.161 -0.083 0.116 Non - euro area -0.054 0.059 -0.012 0.094 -0.003 0.036 -0.040 0.048 0.056 0.087 -0.019 0.102Non-euro area countries - post-1999: 3 + Domestic -0.362 *** 0.084 -0.393 *** 0.096 -0.324 *** 0.094 Euro area -0.327 ** 0.125 -0.371 *** 0.092 -0.149 0.155 Non - euro area -0.237 0.152 -0.402 *** 0.116 -0.085 0.196
CountriesObs.R^2
Political stability Government effectiveness Government accountability(1) (2) (3) (4) (5) (6)
30 30 30 30 30 304900 4900 4900 4900 4900 49000.094 0.098 0.097 0.100 0.095 0.098
(cont.)

42ECBWorking Paper Series No 956November 2008
Table 7: The role of institutions (continued)
Determinant X i,t :
coef. s.e. coef. s.e. coef. s.e. coef. s.e. coef. s.e. coef. s.e.EMU effect: Domestic 1.745 *** 0.374 1.222 *** 0.211 0.846 *** 0.265 Euro area -0.315 0.447 -0.497 0.367 -0.135 0.082 Non - euro area -0.436 0.299 -0.249 0.236 0.058 0.065Euro area countries - pre-1999: 3 + Domestic -1.320 ** 0.491 -0.851 *** 0.279 -0.163 * 0.081 Euro area -1.378 ** 0.511 -0.843 ** 0.304 -0.685 ** 0.288 Non - euro area -1.110 ** 0.513 -0.849 ** 0.310 -0.609 ** 0.274Euro area countries - post-1999: 3 + 2 + 1 + Domestic 0.217 0.262 0.078 0.247 0.088 * 0.045 Euro area 0.159 0.299 0.087 0.273 -0.433 0.281 Non - euro area 0.427 0.307 0.081 0.282 -0.357 0.268Non-euro area countries - pre-1999: 3
Domestic -0.414 *** 0.092 -0.221 * 0.118 -0.290 *** 0.066 -0.038 0.145 -0.061 0.052 0.438 0.274 Euro area 0.119 0.132 -0.278 *** 0.090 0.156 0.104 -0.029 0.085 0.038 0.042 -0.083 0.058 Non - euro area 0.000 0.063 -0.011 0.122 0.007 0.044 -0.035 0.060 0.004 0.013 -0.008 0.027Non-euro area countries - post-1999: 3 + Domestic -0.429 *** 0.101 -0.330 *** 0.062 -0.157 *** 0.028 Euro area -0.486 *** 0.154 -0.321 *** 0.106 -0.678 ** 0.253 Non - euro area -0.219 0.192 -0.327 ** 0.132 -0.602 ** 0.241
CountriesObs.R^2
Regulatory quality Rule of law Enforcement of contracts(7) (8) (9) (10) (11) (12)
30 30 30 30 30 304900 4900 4900 49000.095 0.098 0.096 0.099
3471 34710.137 0.139
Notes: See Table 4.

43ECB
Working Paper Series No 956November 2008
Table 8: Robustness – alternative starting point for EMU
Determinant X i,t :
coef. s.e. coef. s.e. coef. s.e. coef. s.e. coef. s.e. coef. s.e.EMU effect: Domestic -0.241 *** 0.080 -4.137 * 2.497 1.327 *** 0.308 Euro area 0.039 0.067 1.685 * 0.871 -0.373 0.425 Non - euro area -0.016 0.042 0.259 0.416 -0.446 * 0.245Euro area countries - pre-1997: 3 + Domestic 0.175 *** 0.058 0.227 0.473 -1.117 ** 0.409 Euro area 0.182 *** 0.058 4.949 * 2.738 -0.993 ** 0.450 Non - euro area 0.182 *** 0.058 3.947 2.776 -0.982 ** 0.417Euro area countries - post-1997: 3 + 2 + 1 + Domestic -0.010 0.062 -0.021 0.331 0.083 0.280 Euro area -0.002 0.062 4.702 * 2.717 0.207 0.336 Non - euro area -0.003 0.062 3.699 2.756 0.218 0.289Non-euro area countries - pre-1997: 3
Domestic 0.001 0.004 -0.008 *** 0.002 0.155 0.238 -3.580 2.565 -0.319 *** 0.089 -0.183 *** 0.063 Euro area -0.003 0.003 0.000 0.003 -0.008 0.216 1.143 0.841 0.006 0.154 -0.059 0.180 Non - euro area 0.000 0.001 -0.001 0.001 0.109 0.093 0.140 0.365 -0.052 0.065 -0.048 0.037Non-euro area countries - post-1997: 3 + Domestic 0.048 *** 0.016 0.309 0.681 -0.310 ** 0.116 Euro area 0.056 *** 0.016 5.031 * 2.542 -0.186 0.265 Non - euro area 0.055 *** 0.017 4.029 2.558 -0.174 0.167
CountriesObs.R^2
Inflation Government debt Political stability(1) (2) (3) (4) (5) (6)
30 30 30 30 30 305081 5081 4819 4819 4900 49000.100 0.107 0.098 0.101 0.096 0.099
Notes: See Table 4, only that the break point Dt is shifted to 1 January 1997 for all countries in the sample.

44ECBWorking Paper Series No 956November 2008
Table 9: Robustness – multiple determinants: controlling for financial openness
Determinant X i,t :
coef. s.e. coef. s.e. coef. s.e. coef. s.e. coef. s.e. coef. s.e.EMU effect: Domestic -0.258 ** 0.099 -3.039 * 1.558 1.382 *** 0.337 Euro area 0.003 0.074 0.752 * 0.403 -0.489 0.373 Non - euro area 0.068 0.053 -0.111 0.518 -0.360 0.252Euro area countries - pre-1997: 3 + Domestic 0.180 *** 0.048 0.223 0.398 -0.962 * 0.507 Euro area 0.188 *** 0.047 1.016 4.813 -0.983 * 0.490 Non - euro area 0.187 *** 0.047 1.012 4.841 -0.968 * 0.495Euro area countries - post-1997: 3 + 2 + 1 + Domestic -0.014 0.081 -0.072 0.425 0.114 0.454 Euro area -0.006 0.082 0.721 4.843 0.092 0.472 Non - euro area -0.008 0.082 0.717 4.868 0.108 0.463Non-euro area countries - pre-1997: 3
Domestic -0.202 0.180 -0.007 ** 0.003 -0.033 0.123 -0.895 4.836 -0.186 0.180 -0.070 0.127 Euro area 0.089 0.091 0.002 0.002 0.112 0.095 -0.102 0.627 0.106 0.098 -0.092 0.203 Non - euro area 0.012 0.046 0.000 0.002 0.025 0.042 -0.106 0.385 0.032 0.042 -0.076 0.132Non-euro area countries - post-1997: 3 + Domestic 0.057 *** 0.011 0.120 0.931 -0.377 *** 0.083 Euro area 0.066 *** 0.013 0.913 4.844 -0.399 * 0.209 Non - euro area 0.064 *** 0.011 0.909 4.848 -0.383 ** 0.169
CountriesObs.R^2
Inflation Government debt Political stability(1) (2) (3) (4) (5) (6)
30 30 30 30 30 304020 4020 3772 3772 3919 39190.129 0.136 0.126 0.127 0.121 0.123
Notes: See Table 4, only that for the estimations for this table all models control, in a linear and a non-linear way, for the degree of financial market openness based on stock market capitalisation as shown in Table 6.
45ECB
Working Paper Series No 956November 2008
European Central Bank Working Paper Series
For a complete list of Working Papers published by the ECB, please visit the ECB’s website
(http://www.ecb.europa.eu).
923 “Resuscitating the wage channel in models with unemployment fluctuations” by K. Christoffel and K. Kuester,
August 2008.
924 “Government spending volatility and the size of nations” by D. Furceri and M. Poplawski Ribeiro, August 2008.
925 “Flow on conjunctural information and forecast of euro area economic activity” by K. Drechsel and L. Maurin,
August 2008.
926 “Euro area money demand and international portfolio allocation: a contribution to assessing risks to price
stability” by R. A. De Santis, C. A. Favero and B. Roffia, August 2008.
927 “Monetary stabilisation in a currency union of small open economies” by M. Sánchez, August 2008.
928 “Corporate tax competition and the decline of public investment” by P. Gomes and F. Pouget, August 2008.
929 “Real convergence in Central and Eastern European EU Member States: which role for exchange rate volatility?”
by O. Arratibel, D. Furceri and R. Martin, September 2008.
930 “Sticky information Phillips curves: European evidence” by J. Döpke, J. Dovern, U. Fritsche and J. Slacalek,
September 2008.
931 “International stock return comovements” by G. Bekaert, R. J. Hodrick and X. Zhang, September 2008.
932 “How does competition affect efficiency and soundness in banking? New empirical evidence” by K. Schaeck
and M. Čihák, September 2008.
933 “Import price dynamics in major advanced economies and heterogeneity in exchange rate pass-through”
by S. Dées, M. Burgert and N. Parent, September 2008.
934 “Bank mergers and lending relationships” by J. Montoriol-Garriga, September 2008.
935 “Fiscal policies, the current account and Ricardian equivalence” by C. Nickel and I. Vansteenkiste,
September 2008.
936 “Sparse and stable Markowitz portfolios” by J. Brodie, I. Daubechies, C. De Mol, D. Giannone and I. Loris,
September 2008.
937 “Should quarterly government finance statistics be used for fiscal surveillance in Europe?” by D. J. Pedregal
and J. J. Pérez, September 2008.
938 “Channels of international risk-sharing: capital gains versus income flows” by T. Bracke and M. Schmitz,
September 2008.
939 “An application of index numbers theory to interest rates” by J. Huerga and L. Steklacova, September 2008.
940 “The effect of durable goods and ICT on euro area productivity growth?” by J. Jalava and I. K. Kavonius,
September 2008.
941 “The euro’s influence upon trade: Rose effect versus border effect” by G. Cafiso, September 2008.

46ECBWorking Paper Series No 956November 2008
942 “Towards a monetary policy evaluation framework” by S. Adjemian, M. Darracq Pariès and S. Moyen,
September 2008.
943 “The impact of financial position on investment: an analysis for non-financial corporations in the euro area”
by C. Martinez-Carrascal and A. Ferrando, September 2008.
944 “The New Area-Wide Model of the euro area: a micro-founded open-economy model for forecasting and policy
analysis” by K. Christoffel, G. Coenen and A. Warne, October 2008.
945 “Wage and price dynamics in Portugal” by C. Robalo Marques, October 2008.
946 “Macroeconomic adjustment to monetary union” by G. Fagan and V. Gaspar, October 2008.
947 “Foreign-currency bonds: currency choice and the role of uncovered and covered interest parity”
by M. M. Habib and M. Joy, October 2008.
948 “Clustering techniques applied to outlier detection of financial market series using a moving window filtering
algorithm” by J. M. Puigvert Gutiérrez and J. Fortiana Gregori, October 2008.
949 “Short-term forecasts of euro area GDP growth” by E. Angelini, G. Camba-Méndez, D. Giannone, L. Reichlin
and G. Rünstler, October 2008.
950
by R. Mestre and P. McAdam, October 2008.
951
and T. Peltonen, October 2008.
952 “How successful is the G7 in managing exchange rates?” by M. Fratzscher, October 2008.
953 “Estimating and forecasting the euro area monthly national accounts from a dynamic factor model”
by E. Angelini, M. Bańbura and G. Rünstler, October 2008.
954 “Fiscal policy responsiveness, persistence and discretion” by A. Afonso, L. Agnello and D. Furceri,
October 2008.
955 “Monetary policy and stock market boom-bust cycles” by L. Christiano, C. Ilut, R. Motto and M. Rostagno,
October 2008.
956 “The political economy under monetary union: has the euro made a difference?” by M. Fratzscher
and L. Stracca, November 2008.
“Exchange rate pass-through in the global economy: the role of emerging market economies” by M. Bussière
“Is forecasting with large models informative? Assessing the role of judgement in macroeconomic forecasts”

Work ing PaPer Ser i e Sno 956 / november 2008
The PoliTical economy under moneTary union
haS The euro made a difference?
by Marcel Fratzscher and Livio Stracca