The political economy of xenophobia and … political economy of xenophobia and distribution: the...
68
HAL Id: hal-00242915 https://hal.archives-ouvertes.fr/hal-00242915 Submitted on 6 Feb 2008 HAL is a multi-disciplinary open access archive for the deposit and dissemination of sci- entific research documents, whether they are pub- lished or not. The documents may come from teaching and research institutions in France or abroad, or from public or private research centers. L’archive ouverte pluridisciplinaire HAL, est destinée au dépôt et à la diffusion de documents scientifiques de niveau recherche, publiés ou non, émanant des établissements d’enseignement et de recherche français ou étrangers, des laboratoires publics ou privés. The political economy of xenophobia and distribution : the case of Denmark John Roemer, Karine Van Der Straeten To cite this version: John Roemer, Karine Van Der Straeten. The political economy of xenophobia and distribution : the case of Denmark. CECO-172. 2004. <hal-00242915>
Transcript of The political economy of xenophobia and … political economy of xenophobia and distribution: the...

HAL Id: hal-00242915https://hal.archives-ouvertes.fr/hal-00242915
Submitted on 6 Feb 2008
HAL is a multi-disciplinary open accessarchive for the deposit and dissemination of sci-entific research documents, whether they are pub-lished or not. The documents may come fromteaching and research institutions in France orabroad, or from public or private research centers.
L’archive ouverte pluridisciplinaire HAL, estdestinée au dépôt et à la diffusion de documentsscientifiques de niveau recherche, publiés ou non,émanant des établissements d’enseignement et derecherche français ou étrangers, des laboratoirespublics ou privés.
The political economy of xenophobia and distribution :the case of Denmark
John Roemer, Karine Van Der Straeten
To cite this version:John Roemer, Karine Van Der Straeten. The political economy of xenophobia and distribution : thecase of Denmark. CECO-172. 2004. <hal-00242915>

The political economy of xenophobia and distribution: the
case of Denmark
John E. ROEMER Karine VAN DER STRAETEN
April 2004
Cahier n° 2004-003
ECOLE POLYTECHNIQUE CENTRE NATIONAL DE LA RECHERCHE SCIENTIFIQUE
LABORATOIRE D'ECONOMETRIE 1rue Descartes F-75005 Paris
(33) 1 55558215 http://ceco.polytechnique.fr/
mailto:[email protected]

The political economy of xenophobia and distribution: the case of
Denmark
John E. Roemer1
Karine Van der Straeten2
April 2004
Cahier n° 2004-003
Résumé: Pour la première fois depuis de nombreuses années, un gouvernement conservateur a accédé au pouvoir au Danemark en 2001, en partie à cause de l'insatisfaction des électeurs quant aux politiques d'immigration menées par les socio-démocrates. On décrit la compétition électorale au Danemark comme portant essentiellement sur deux questions majeures -- la taille du secteur public et l'immigration -- et modélise l'équilibre politique à l'aide du concept de PUNE (Party Unanimity Nash Equilibrium), qui permet d'obtenir des équilibres dans des espaces politiques multi-dimensionnels lorsque les partis se forment de manière endogène. En calibrant le modèle sur des données électorales danoises, on montre que la xénophobie est susceptible de réduire la taille du secteur public danois d'un montant équivalent à la moitié de l'écart-type de la distribution de probabilité des opinions des électeurs danois concernant la taille idéale du secteur public.
Abstract: For the first time in many years, a conservative government came to power in Denmark in
2001, due primarily to the citizenry's dissatisfaction with social-democratic policies on immigration. We represent political competition in denmark as taking place on two issues -- the size of the public sector and immigration -- and model political equilibrium using the party-unanimity- Nash-equilibrium concept (PUNE), which generates equilibria on multi-dimensional policy spaces where parties form endogenously. By fitting the model to Danish data, we argue that citizen xenophobia may be expected to decrease the size of the Danish public sector by an amount equal to one-half of a standard deviation of the probability distribution of citizens' views as to what the optimal size of public sector is.
Mots clés : Equilibre politique, PUNE, xénophobie, redistribution Key Words : Political equilibrium, PUNE, xenophobia, distribution Classification JEL: D3, D72
1 Yale University 2 Laboratoire d’Econométrie, CNRS et Ecole Polytechnique

March 25, 2004
“The political economy of xenophobia and distribution: The case of Denmark*”
by
John E. Roemer**
Yale UniversityDepts of Political Science and Economics
PO Box 208301New Haven CT 06520
and
Karine Van der StraetenCNRS, Ecole Polytechnique
Contents
1. Politics and racism in Denmark2. Political equilibrium: Theory
3. The policy bundle (PB) and anti-solidarity (AS) effects: Theory
4. Estimation of model parametersa. Distribution of voter traits
b. Parties’ vote shares and platformsc. Estimation of voter preferences
d. Estimation of counterfactual preferences
5. Political equilibrium : Observation and prediction6. The Policy Bundle and Anti-Solidarity Effects: Computation
7. Conclusion
Figures, Tables, and Appendix
* This project has been financed by the Russell Sage Foundation, to whom we aregrateful. We thank Woojin Lee for his advice on econometric issues. We are grateful to
the Danish Statistical Archive for providing us with the Danish election studies. Theproject originated while Van der Straeten was visiting Yale University; financial support
for her stay from the Department of Economics and the Cowles Foundation is gratefully
acknowledged.** Corresponding author.

2
Abstract
For the first time in many years, a conservative government came to power inDenmark in 2001, due primarily to the citizenry’s disaffection with social-democratic
policies on immigration. We represent political competition in Denmark as taking placeover two issues --the size of the public sector and immigration -- and model political
equilibrium using the party-unanimity-Nash-equilibrium concept(PUNE), which
generates equilibria on multi-dimensional policy spaces where parties formendogenously. By fitting the model to Danish data, we argue that citizen xenophobia
may be expected to decrease the size of the Danish public sector by an amount equal toone-half of a standard deviation of the probability distribution of citizens’ views as to
what the optimal size of the public sector is.
Key words: political equilibrium, PUNE, xenophobia, distribution
JEL categories: D3, D72

1. Politics and racism in Denmark
With the 2001 election, the Social Democratic Party (SDP), primary architects of
the Danish welfare state, lost its status, for the first time since 1920, as the largest party.
The Liberal Party won a larger vote share (see Table 1), and formed a coalition
government with the Conservatives. For a parliamentary majority, this coalition has, in
the intervening period, relied upon the support of the rightwing populist, anti-immigrant
Danish People’s Party.
Many observers believe that the fall of the social-democratic government in
Denmark is due to its failure to respond adequately to the anti-immigrant sentiment
among the native citizenry. Although immigrants and their descendents account for
only about 7% of the population, their presence has provoked a remarkable reaction
among natives. Upon gaining power, the Liberal-Conservative coalition passed a law, in
May 2002, restricting the rights of immigrants in a number ways: (1) refugee status will
henceforth be granted only under stricter conditions (not to include those fleeing from
war or famine); (2) permanent-resident permits will be granted after seven years of
residence, instead of three; (3) residents are no longer permitted to bring in a foreign
spouse under the age of 24; (4) spouses will not be allowed to join their partners in
Denmark unless the couple have a sufficiently large income; (5) applicants for Danish
nationality must demonstrate linguistic ability of a 14-year old native, and (6)
reunification with parents over 60 years of age is abolished.
For the purposes of this article, we will often describe anti-immigrant feeling as
xenophobia. Ours is not a sociological or psychological investigation; we observe the

2
distribution of xenophobic views based on voter survey data, and do not inquire into their
causes or possible justifications.
Our concern in this article is with the effect that increasing Danish xenophobic
sentiment among voters will have on the size of the welfare state, as the latter is
determined through political competition. We will argue that the size of the welfare state
and the government’s position on immigration are the two most important issues in
contemporary Danish politics. Political parties – of which there are ten in Denmark—put
forward positions on both these issues, and voters choose among the parties based on
their preferences on the two issues. We will model the political game among these
parties, and then ask: How would the equilibrium values of the parties’ positions on the
size of the public sector change, were voters less xenophobic? We will attempt to answer
the question by computing what the equilibrium in political competition would deliver,
with regard to the size of the public sector, were the distribution of voter xenophobic
attitudes different from what it is.
It is conceptually useful to distinguish between two ways in which anti-immigrant
voter sentiment can alter the equilibrium party platforms on the issue of pubic-sector size.
First, there is a direct effect which we call the anti-solidarity effect (ASE): to the extent
that voters dislike immigrants, and believe that immigrants exploit the welfare state, they
may desire to decrease the generosity of state benefits. It is often said that the generous
welfare states of the Nordic countries are the historical consequence of population
homogeneity, engendering solidarity among citizens. The anti-solidarity effect is the
other side of this coin.

3
The second effect is indirect. Suppose that a voter is very xenophobic, although
quite moderate on the issue of public sector size: she may vote for a xenophobic party if
the immigration issue is sufficiently important for her, even if that party is more right-
wing on the size of the public sector than she is. If there are many voters of this kind,
then parties that want large cuts in the size of the public sector may gain larger support
than they would, were immigration not a political issue. We call this the policy-bundle
effect (PBE). It is a political portfolio effect, a consequence of the bundling of issues.
In our analysis, we decompose the total effect of xenophobia on equilibrium
values of party policy on public-sector size into these two effects.
Our data consist of micro-data from the Danish Election Survey, Year 1998 (2001
respondents, 327 variables) and Year 2001 (2026 respondents, 316 variables)*. Table 1
reports the vote shares obtained by the various parties, in the 1998 and 2001 elections. In
the first column, we report the vote shares obtained from the survey answers (among
respondents who answered the question); the second column reports the actual vote
shares. Note that reported vote share and actual vote share are generally very close
(although respondents in 1998 tend to underreport the vote for the Social Democratic
party).
* Our sources are the “Danish Election Survey 1998”, which was originally collected by
AC Nielsen AIM for J∅rgen Goul Andersen, Johannes Andersen, Ole Borre and Hans
J∅rgen Nielsen and the “Danish Election Survey 2001”, originally collected by J∅rgen
Goul Andersen, Ole Borre, Hans J∅rgen Nielsen, Johannes Andersen, S∅ren Risbjerg
Thomsen and J∅rgen Elklit. These surveys, along with the related documentation , have
been placed, for future access, in the Danish Data Archive (archive numbers DDA-4189
and DDA-12516). The results and interpretation in the current paper are the sole
responsibility of the authors.

4
Parties are ranked on a Left-Right scale, as perceived by the voters.1
The graph below depicts the distribution of voters’ Left/Right identification.2
0
5
10
15
20
25
0 1 2 3 4 5 6 7 8 9 10
Left-Right identification
1998
2001
Although the vote share of the Left parties decreased dramatically between the 1998 and
2001 elections, Left-Right identification among voters remained remarkably stable: the
distributions are almost identical. (For 1998, the average answer is 5.6 ; for 2001, the
average answer is 5.5.) Voters’ responses on this question may be related to the change in
perceived position of parties between 1998 and 2001: while Left parties are perceived to
be approximately stable, Right and Extreme Right parties are perceived to move toward
the center in 2001.
Table 2 presents the average perception among voters of the parties’ positions on
the economic issue (size of the public sector) and the immigration issue (see the exact
definition in section below). Note that on both issues, the ranking of parties is very
similar to their ranking on the Left-Right scale. In particular, the two most anti - 1 This scale derives from the answers to the following question: “In politics one often
talks about left and right. Where would you place yourself on this scale? Where would
you place the various parties on this scale?” (Show a card with 11 possible values, from 0
indicating left to 10 indicating right.) For each party we compute the average answer.2 That is, answers to the question “Where would you place yourself?”

5
immigrant parties, the Danish People’s Party and the Progress Party, are also the most
conservative on the economic issue.3 .
In order to assess the main political issues in Denmark, we use a question about
the problems that respondents perceive as being the most important in Denmark. Table 3
reports, for a selection of issues, the number of individuals (in 1998, out of a total of
2,001 respondents) who listed the issue in question as among the four most important
problems facing the country. Problems are ranked according to the number of
respondents who reported this specific problem as the single most important in the
country (down to a number of 14 respondents).
Clearly, the health issue is the single most important problem: over 900
respondents, almost one half of the sample, name either “Health sector and the hospital
sector” or “Nursing homes / domiciliary care” as one of the four most important
problems. Immigrant and refugee- related issues appear second (670 respondents),
followed by a number of social or economic issues: conditions for the aged (393),
families with children / day-care centers (341), employment, unemployment including
labor market policy (303), and social problems including social policy (171).
Environmental issues are also considered to be important: environment / environmental
issues (377), and pollution (32). These problems are also ranked the highest on the list
when individuals are asked which problems were the most important when they decided
how to vote.
3 This contrasts with the French situation where the main xenophobic party, the “National
Front”, tends to adopt intermediary positions on economic issues, trying to attract both an
electorate of both self-employed conservative individuals and blue-collar workers
supportive of more public sector expenditure.

6
Assuming that the issues hospital / health services, education in state schools,
unemployment / welfare system are mainly questions about the size of the public sector,
modeling political competition as focusing on the two issues of public- sector size and
immigration appears to be an acceptable abstraction.
2. Political equilibrium: Theory
We propose that the spectrum of political parties can be captured, for our
purposes, with a model that postulates three parties: a Left, a Right, and an Extreme
Right. The Left party of the model will correspond to the union of the parties United
Left, Socialist People’s, Social Democratic and Liberal Democrat; the Right will
correspond to the Center Democrats, Christian People’s, Conservative, and Liberal
parties; the Extreme Right will correspond to the Danish People’s and Progress parties.
We propose in this section a model of political equilibrium in which three parties
compete on a two- dimensional policy space, which, in our application will be the size of
the public sector and the policy towards immigrants.
The model is an extension of party unanimity Nash equilibrium with endogenous
parties (PUNEEP) as defined in Roemer (2001, Chapter 13).
The data of the model consist of the information (H,F,T,v,n) where:
• H is a space of voter types equipped with a probability distribution F;
•
†
v(⋅,h) is the utility function of a voter type defined on the policy space T, and
• n is the number of parties.
The equilibrium will consist in: a tuple (L,R,ER,tL,tR,tER) where:

7
• (L,R,ER) is a partition of the set of voter types into party memberships or
constituencies:
•
†
L » R » ER = H, L « R = ∅, L « ER = ∅, R « ER = ∅
•
†
t J ΠT is the equilibrium platform of party J, for J=L,R,ER.
There will be no confusion if we refer to a party and its constituency by the same
variable: e.g, ER for Extreme Right.
For our application, a voter’s type will be an ordered pair (p,r) where p is the
voter’s ideal public sector size (which we sometimes call, for short, her ‘tax rate’) and r
is her position on the immigration issue. The policy space T is a set of ordered pairs
(t,r), which we may take to be the real plane, where t is a party’s policy on the size of the
public sector and r is its policy on immigration. The utility function of the polity is a
function
†
v : T ¥ H Æ R given by
†
v(t,r;p,r) = -(t - p)2 - g(r - r)2 . (2.1)
We refer to g as the relative salience of the immigration issue, and assume it is the same
for all voters.
Given three policies
†
(t L ,t R ,t ER ) proposed by the parties, we define
†
j J (t L ,t R ,t ER ) , for J=L,R,ER, as the fraction of the polity who prefer the policy of party
J to the other two policies. In our model, if the policies are distinct, then the set of voters
indifferent between two policies will always have F-measure zero, and so, in the case of
distinct policies, these three fractions sum to unity.
Unlike the model of Downs, in our model, parties will generically propose distinct
policies in equilibrium.

8
We briefly review the concept of party unanimity Nash equilibrium (PUNE). A
party possesses entrepreneurs or organizers, and members or constituents. The members
of a party are citizens who, in equilibrium, prefer that party’s policy to the policies of the
other parties. The entrepreneurs are professional politicians who make policy in the
party. Think of them as a very small group of individuals, who are not identified with
citizens characterized by a type. (Their type is irrelevant.) We will assume that the
organizers of the Left and Right parties are each divided into two factions – an
Opportunist faction and a Militant faction. The Opportunist faction wishes, in the party
competition game, to propose a policy that will maximize the party’s vote share. The
Militant faction wishes to propose a policy that will maximize the average welfare of the
party’s constituency.
The proposal that parties consist of bargaining factions captures the view that
parties have conflicting goals: to represent constituencies, and to win office, or , more
generally, to maximize vote share. Mathematically, the virtue of the factional model of
parties is that it engenders the existence of political equilibria when policy spaces are
multi-dimensional.
We will assume that the Extreme Right party is a passive member of the party
–competition game: it proposes a fixed policy, which could be viewed as the ideal policy
of its organizers. Modeling the Extreme Right in this way is less than ideal: we would
have preferred to model it as a party with factions that behaves in the manner of the other
two parties. Doing so, however, immensely complicates the computation of equilibrium
–already a time-consuming task—and so we have elected to treat the policy it proposes as
exogenously given. Its membership, however, will be endogenous.

9
Without loss of generality, we could postulate a third faction in each of the L and
R parties – a Reformist faction, whose members desire to maximize the average expected
welfare of the party’s constituency. As is shown in Roemer (2001), the set of equilibria
will not change with this additional faction: in an appropriate sense, the Reformists are a
‘convex combination’ of the other two factions. Therefore we have dispensed with it,
and also with having to define the probability of victory, which would be essential, were
we have to discuss expected utility of voters, something of concern to Reformists.
We mention the Reformists because postulating their existence adds an important
element of realism to the model, although, it turns out, it does not alter the model’s
equilibria. Thus, from the formal viewpoint, we may ignore Reformists4.
The idea of PUNE is that parties compete against each other strategically, as in
Nash equlibrium, and factions bargain with each other, inside parties. At an
equilibrium, each party’s platform is a best response to the other parties’ platforms in the
sense that it is a bargaining solution between the party’s factions, given the platforms
proposed by the other parties. In our application, this will be the case for the L and R
parties.
Suppose the members of a party consist in all citizens whose types lie in the set
†
J Ã H . We define the average welfare function for this party as a function mapping
from T to the real numbers defined by :
4 The reader may be puzzled that adding the Reformist faction does not change theequilibrium set. Adding them does change something, however: the interpretation of the
bargaining powers of the factions associated with particular equilibria. Thus, we do notsay that Reformists don’t matter: it is just that they do not matter for the present analysis.

10
†
V J (t ) = v(t;h)dF(h)h ŒJÚ . (2.2)
That is, VJ(t) is just (a constant times) the average utility of the coalition J at the policy
t. For (2.2) to make sense, we must assume that the utility functions v are unit-
comparable.
Definition A party unanimity Nash equilibrium (PUNE) for the model (H,F,T,v,3) at the
exogenous ER policy tER is :
(a) a partition of the set of types
†
H = L » R » ER, possibly ignoring a set of
measure zero;
(b) a pair of policies
†
(t L ,t R )
such that:
(1a) Given
†
(t L ,t ER ) there is no policy
†
t ΠT such that:
†
V R (t ) ≥ V R (t R ) and jR (t L,t,t ER ) ≥ j R (t L ,t R ,t ER )
with at least one of these inequalities strict;
(1b) Given
†
(t R ,t ER ) there is no policy
†
t ΠT such that:
†
V L (t ) ≥ V L (t L ) and j L (t,t R ,t ER ) ≥ j L (t L ,t R ,t ER )
with at least one of these inequalities strict;
(2) for J=L,R,ER, every member of coalition J prefers policy tJ to the other two policies,
that is
†
h Œ J fi v(t J ,h) > v(t ¢ J ,h) for ¢ J ≠ J .
Condition (1a) states that, when facing the policies tER and tL, there is no feasible
policy that would increase both the average welfare of party R’s constituents and the vote

11
fraction of party R. Thus, we may view policy tR as being a bargaining solution between
party R’s two factions when facing the oppositions’ policies, as the Militants’ desire to
maximize the average welfare of constituents, and the Opportunists desire to maximize
vote share. All we employ here is the assumption that a bargain must be Pareto
efficient for the two players in the bargaining game. Condition (1b) similarly states that
policy tL is a bargaining solution for party L’s factions when facing the policies tER and
tR. Condition (2) states that the endogenous party memberships are stable: each party
member prefers her party’s policy to the other parties’ policies.
There are two ‘free’ parameters in this equilibrium concept: one might think that
the relative strength of the Militants with respect to the Opportunists in a party is an
important variable, in determining where on the mini-Pareto frontier of the factions the
bargaining solution lies. There is one such parameter for each party L and R. Thus, we
can expect that, if there an equilibrium, there will be a two-parameter manifold of
equilibria, where the elements in this manifold are associated with different pairs of
relative bargaining strengths of the pairs of factions in L and R. This indeed turns out to
be the case, as we will see below.
With differentiability, we can characterize a PUNE as the solution of a system of
simultaneous equations. Denote by the gradient of the function
†
j J
with respect to the policy
†
t J . Denote by
†
—V J the gradient of VJ. Then, we can write
the necessary conditions for a PUNE where tL and tR are interior points in T as:
(1a) there is a non-negative number x such that
†
-—LjL (t L ,t R ,t ER ) = x—V L (t L )
(FOC)
(1b) there is a non-negative number y such that
†
-—Rj R (t L ,t R ,t ER ) = y—V R (t R ) .

12
Condition (1a) says that the gradients of the vote share function and the average welfare
function for party L point in opposite directions, and so, assuming local convexity, there
is no direction in which the policy of the party can be altered so as to increase both the
party’s vote share and the average welfare of the party’s constituents. Thus conditions
(1a) and (1b) correspond exactly to the conditions (1a) and (1b) in the definition of
PUNE. (All policies are interior in our application, since T is an open set.)
Our next task is to characterize PUNE as a system of equations, which requires us
to formulate precisely the party constituencies. Denote the set of types who prefer a
policy
†
t a = (t a ,ra ) to policy t b = (t b ,rb ) by W(t a ,t b ), and compute that
†
W(t a ,t b ) ={(p ,r) | r <y(t a ,t b ,p) if ra < rb
{(p ,r) | r >y(t a ,t b ,p) if ra > rb
Ï Ì Ó
(2.3)
where
†
y(t a ,t b ,p) =t b 2
- t a 2+ 2p (t a - t b ) + g(rb 2
- ra 2)2(rb - ra )
. (2.4)
We will specify the value of the policy r so that larger r means more xenophobic (anti-
immigrant). Thus, at equilibrium, we will expect that
†
rL < rR < rER . For an equilibrium
with this characteristic, it follows from (2.3) that the constituency L will be precisely:
†
L = {(p ,r) ΠH | r < min[y(t L,t R ,p ),y(t L ,t ER ,p)]} ,
for these are the types who will prefer policy tL to both other policies. In like manner,
we have:
†
ER = {(p,r) | r > max[y(t ER ,t R ,p ),y(t ER ,t L ,p )]
and R , of course, comprises the remaining types (except for a set of measure zero). In
short-hand, if we define:

13
†
m(t L ,t R ,t ER ,p ) = min[y(t L ,t R ,p ),y(t L ,t ER ,p )]M(t L ,t R ,t ER ,p ) = max[y(t ER ,t R ,p ),y(t ER ,t L ,p )]
and we denote the vector consisting of all three policies as t, then we have:
†
L = {(p ,r) | r < m(t,p )}, R = {(p ,r) | m(t,p ) < r < M(t,p )}, ER = {(p ,r) | r > M(t,r)}.
Assuming the support of the distribution F is the real plane, we can therefore
write:
†
j L (t ) = dF(p ,r)-•
m(t ,p )
Ú-•
•
Ú , (2.5a)
where the inside integral is over r and the outside integral is over p, and in like manner:
†
j R (t ) = dF(p ,r), j ER
m(t ,p )
M (t ,p )
Ú-•
•
Ú (t) = dF(p ,t )M (t ,p )
•
Ú-•
•
Ú . (2.5b)
Similarly, we can write:
†
V L (t L ) = v(t L
-•
m(t ,p )
Ú-•
•
Ú ;p,r)dF(p ,r), V R (t R ) = v(t R
m(t ,p )
M (t ,p )
Ú-•
•
Ú ;p,r)dF(p ,r) . (2.6)
The corresponding average-welfare function for the ER is irrelevant, because the ER
plays a fixed policy.
Now we substitute these expressions into the first-order conditions (FOC), and we
have fully modeled PUNE – that is, condition (2) of the definition of PUNE holds by
construction.
The first-order conditions now comprise four equations in six unknowns – the
four policy unknowns of the Left and Right parties, and the two Lagrangian multipliers x
and y. If there is a solution, there will (generically) be, therefore, a two- parameter
family of solutions. As we described above, the points in this family or manifold can be

14
viewed as corresponding to equilibria associated with different relative bargaining
strengths of the pairs of factions in the parties L and R.
3. The policy bundle and anti-solidarity effects: Theory
Our strategy to compute the two effects of voter xenophobia on the size of the
public sector will be to estimate the above PUNE model, and then to run two
counterfactual experiments, which we now describe. The reader may ask: How can we
calibrate a model to observation when the model only specifies a two dimensional
manifold of equilibria and the observation is one point? The answer is that, fortunately,
the equilibrium manifold turns out to be highly concentrated in the policy space, so that
little precision is lost by the fact that there is a continuum of equilibria. We will illustrate
this below.
We will summarize the values of the ‘tax policy’ t that parties propose in
equilibrium by one average expected policy, that we will define later, which we will
denote texp. Our concern is with the effect of xenophobia on the size of public sector (tax
policy).
In the first counterfactual experiment, we assume that immigration policy(r) is not
an issue in the election. Parties compete, that is, over the single issue of public-sector
size, t. Voters, however, continue to possess exactly the distribution of preferences on
public sector size as described by (the marginal distribution of) F. Since those
preferences are influenced by their views on immigration, it continues to be the case, in
this counterfactual contest, that voters’ views on immigration will indirectly affect the
political equilibrium, via their effect on preferences over size of the public sector. We

15
summarize the tax-policy equilibria of the set of PUNEs for this counterfactual election
by one policy ,
†
tIexp .
To compute these equilibria, we exogenously specify a fixed value for the r issue.
(It does not matter what that value is.) This counterfactual election is equivalent to an
election in which voter preferences are altered by setting g equal to zero. Thus the
difference
†
tIexp - t exp is exactly a measure of the policy-bundle effect: for in this election,
there is no portfolio problem for the voter, as immigration policy is not an issue.
Nevertheless, a voter’s xenophobia will still cause her to vote for a lower size of the
public sector than otherwise, if she does not wish to support immigrants with public
funds. So the anti-solidarity effect is still active.
Next, we estimate (to be described below in section 4) a distribution of racism-
free demands for the public sector That is, we estimate what the distribution of
preferences over public-sector size would be, were all voters non-xenophobic, or not anti-
immigrant. Call this distribution G. We next run a second unidimensional election, on
public-sector size, where we assume the distribution of voter preferences on the tax issue
is given by G. The results of this election will be sterilized of both the policy-bundle and
the anti-solidarity effects. If we summarize the policy of the PUNEs here calculated by
†
tIIexp then we say that the total effect of xenophobic is
†
tIIexp - t exp, and the anti-solidarity
effect is
†
tIIexp - tI
exp.
4. Estimation of model parameters
a. Distribution of voter traits

16
We discuss next our use of the Danish voter surveys to calibrate the distribution
of voter preferences on the size of the public sector and immigration policy. We select
questions that enable us to calibrate both voters’ preferences and their views about where
the parties stand on the issues in question. We use the two following questions.
i. The economic issue
Question : Among other things, the parties disagree about how big the public
sector should be. Some parties say we should cut down on public revenue andexpenditure, other say we should expect increasing expenditure and revenue in the
future. Here is a scale from 1 to 5, where 1 means the revenue and expenditureshould be cut substantially , 2 means that they should be cut a little, 3 means that
the public revenue and expenditure are appropriate as they are now, 4 means that
they should increase a little and 5 means that they should increase a lot. Wherewould you place party (name all the parties)? Where would you place yourself?
The distribution of answers to the question “Where would you place yourself?” is
presented in the following chart:

17
Size of the public sector
05
10152025303540
cut d
eeply
cut a
little
abou
t righ
t
incre
ase
a litt
le
incre
ase
a lot
do n
ot kn
ow
1998
2001
A very large proportion of respondents are either satisfied with the current size of the
public sector, or support only a small change in its size . About 37% of the respondents
think that the current size of the public sector is appropriate, and fewer than 8% are in
favor of a large change (in either direction). Among the respondents who support a
change, a decrease in the size of the public sector receives more support than an increase.
Between 1998 and 2001 preferences are quite stable; only a small increase in the
number of people who support a smaller public sector is observed.
ii. the immigration issue
Question: Among other things, the parties disagree about how many refugees wecan take. Some say we take too many. Other say we could easily take more. Here
is a scale from 1 to 5, where 1 means that we should take far fewer refugees, 2means we should take somewhat fewer, 3 means that we should continue to take
the same number as now, 4 means that we should take somewhat more and 5

18
means that we should take a lot more refugees that we do now. Where would you
place party X / yourself on this scale?
The distribution of answers to the question “Where would you place yourself?” is
the following:
Number of refugees
05
10152025303540
far m
ore
som
ewha
t mor
e
sam
e
som
ewha
t less
far l
ess
do n
ot kn
ow
1998
2001
We observe, first, that respondents favor a decrease in the number of refugees accepted.
Over 50% of the respondents think that the country takes too many refugees while fewer
than 15% think that the country should take more. Second we observe stability of
answers in this time period ; there is only a slight increase in the number of people
wanting fewer refugees.
The correlation between views on the size of the public sector and the immigrant/
refugee issue will play an important part in our analysis of the anti-solidarity effect.
Figures 1a and 1b present – respectively for years 1998 and 2001 -- the distribution of
views on the economic issue, by answers to the refugee question. There is globally a

19
strong negative relationship between pro-public sector and pro-refugee views. In 1998,
among people who want far fewer refugees, 18% want more public expenditure, and over
50% want less public expenditure, versus respectively 1% and 20% among those who
think that the number of refugees is about right. Among people who want far more
refugees, over 70% want more public expenditure, while only 20% of those who think
that the number of refugees is about right want a larger public sector. Figures are similar
in 2001.
To construct voters’ preferences we used only these two questions, although the
survey contains many questions regarding individuals’ opinions on economic policy and
immigration policy. Our choice was constrained by our desire to calibrate not only
voters’ preferences, but parties’ positions on the issues.
To better understand exactly what these variables mean, we checked the
correlation of our selected variables with other related variables. In particular, the
interpretation of the economic variable is not obvious: respondents may desire an
increase in the size of the public sector because they want a larger police force or more
defense or more culture, which would have little bearing on the question we want to
study. To have more information about what respondents have in mind when they answer
this question, we studied the correlation with opinions about whether public expenditures
for specific purposes (e.g.,defense, health care system, old age pensions, environmental
problems, cultural purposes, police force, welfare benefits paid to the individual, and aid
to refugees) should be increased or not. We find that our economic variable is highly
correlated with support for public expenditures targeted to the poor (unemployment
benefits, welfare benefits, wage support) and families (daycare, subsidies to families with

20
children, education). These are the kind of expenditures that are likely to be influenced
by the anti-solidarity effect (immigrants are perceived as poorer and having more
children than native Danes). Similarly, our economic variable is negatively correlated
with support for an increase of spending on defense or police. We are therefore
confident that the variable we use measures the kind of public expenditures with which
we are concerned. Note that there is less possible misinterpretation with the immigration
variable, since the scope of the question is in a sense limited.
Being confident that the two variables selected are good indicators of the
preferences we want to estimate, we now proceed to construct a joint distribution of
voters’ traits. The questions on the size of the public sector and on the immigration issue
call for qualitative answers. Because we wish to construct quantitative variables, we need
to assign numerical values to the different possible answers. We chose to do the
following: for both questions the value 0 is assigned to the status quo (same size of the
public sector or same number of refugees). The value +1 (resp. –1) is assigned to the
answer “somewhat more public sector” and “somewhat fewer refugees”, (resp. to the
answer “somewhat smaller public sector” and “somewhat more refugees”); the value +2
(resp. –2) is assigned to the answer “much larger public sector” and “far fewer refugees”
(resp. to the answer “much smaller public sector” and “many more refugees”. The
quantitative variables thus defined are labeled ! for the economic issue and r for the
immigration issue.
Here are some descriptive statistics for these two variables:

21
1998 2001
Variable Mean Std. Dev. Obs Mean Std. Dev. Obs
! -0.15 0.92 1,914 -0.24 0.91 1,967
r +0.67 1.02 1,948 +0.70 1.01 1,972
Correlation -0.33 1,886 -0.34 1,933
As noted, individuals are on average favorable to a small decrease in the size of the
public sector and to a large decrease in the number of refugees. The correlation
coefficient between the two variables is –0.33 in 1998, and -0.34 in 2001. We
approximate the joint distribution by a bivariate normal density with mean and standard
deviation of the marginal distributions given in the table above and correlation coefficient
= -0.33 in 1998 and –0.34 in 2001.
Remark on the choice of coding. Note that our two variables do not have a direct
quantitative interpretation: they do not represent a tax rate or a number of refugees. When
choosing the code for the economic variable and the immigration-related variable, we
chose to select values that make sense relative to the context of the questionnaire (0 is the
value of the status quo for the two options, 1 is the value to the answers “somewhat larger
public sector” and “somewhat fewer refugees). Another option would have been to find
numerical values that would have a meaning independent of the survey: for example, to
translate answers into desired tax rates or numbers of refugees. This option seemed
more hazardous to us in terms of interpretation, given the limited information contained
in the survey data, and so we elected not to pursue it.
Note also that a linear transformation of the values scale leaves preferences
unchanged, up to a transformation in .g Since the parameter g will be estimated from the
data, the question of the scale (the multiplicative constant) is unimportant. Given the
symmetry in the wording of the question, we chose to assign symmetrical values (relative
to the value of the status quo) to the answers “somewhat more” and “somewhat less”. The
only remaining question is how to compare “A lot more” to “Somewhat more. ” We

22
have chosen to assume that “A lot more” is twice as much as “Somewhat more”. A
different choice would probably have given slightly different results.
b. Parties’ vote shares and platforms
Vote shares obtained by the various parties, in the 1998 and 2001 elections, as
well as the parties’ proposals on the issues we are concerned about , were presented in
Tables 1 and 2. As explained in section 2, we model Danish politics in terms of broader
coalitions of parties: Left, Right and Extreme Right. We compute the broader parties’
vote shares by summing the vote shares of the parties forming the coalition. These are
reported in Table 4a. We also compute coalitions’ positions, defined as the average of the
parties’ positions on the various issues, weighted by their vote share within the coalition.
These are reported in Table 4b.
Note that, as far as the immigration issue is concerned, the Right party is closer to
the voters’ average point of view than the Left. As to the size of the public sector, the
average point of view of voters is equidistant from the Left and Right positions.
If we compare the voters’ perceived positions of the parties across time, we see
that the Left coalition is viewed as almost stable, with only a very small anti-public
sector, anti-immigrants shift over the three year period, whereas the Right and Extreme
Right parties are viewed as having made more spectacular changes. The Right party
becomes much more anti-immigrant and the Extreme Right party favors a higher public
sector in the voters’ perceptions. The Right and Extreme Right are viewed as converging:
the Right moving on the immigrant issue and the Extreme Right moving on the
economic issue.

23
c. Estimation of the salience parameter g
An individual with ideal public sector policy ! and ideal immigration policy r
evaluates the policy platform (t,r) with the utility function
.)()( ,; 22 rgprp ----= rt)v(t,r Therefore, an individual with ideal tax policy ! and
ideal immigration policy r prefers the policy platform (t,r) to the policy platform (t’,r’) if
and only if
02
')'(
2
')'( >˜
¯
ˆÁË
Ê +--+˜
¯
ˆÁË
Ê +--
rrrr
tttt rgp . (4.1)
In order to estimate g , we first approximate the choice voters face by a binary
choice: they can either vote for the Left coalition or a broad Right - Extreme Right
coalition . The platform of the broad R-ER coalition is the average of Right and Extreme
Right platforms, weighted by their vote shares. The platforms and vote shares of these
two broad coalitions are given in the table below:
1998 2001
Pub. Sector Immigration Vote share Pub. Sector Immigration Vote share
Left +0.67 -0.37 48.0 +0.53 -0.28 42.2
Right+ER -0.94 +0.94 52.0 -0.95 +1.18 57.8
In the two party model, a rational voter with ideal tax policy p and ideal immigration
policy r votes for the R-ER coalition if and only if
02
)(2
)( >˜̃¯
ˆÁÁË
Ê +--+˜̃
¯
ˆÁÁË
Ê +--
--
--
LERRLERR
LERRLERR rr
rrtt
tt rgp . (4.2)

24
Using the observed positions of parties reported in the table above, (4.2) yields the
following inequalities. For 1998, a voter of type (p,r) should prefer the R-ER to the L
coalition exactly when
˜̃¯
ˆÁÁË
Ê++>
gp
gr
17.029.0
23.1; (4.3a)
for 2001, the analogous inequality is
.21.0
45.001.1
˜̃¯
ˆÁÁË
Ê++>
gp
gr (4.3b)
The locus of voter types in type space who are indifferent between the R-ER group and
the Left is a straight line containing the type
†
(p ,r) =( ,2
ERRL tt -+)
2
ERRL rr -+. In (p,r)
space, the indifference curve become flatter as g increases.
In order to estimate g , we introduce uncertainty. In the probabilistic model we
assume that an individual votes for the Right coalition rather than for the Left if
0>+++ iii cst ebpar , where ie is a random variable, i.i.d. across individuals, with
mean zero. If we assume a standard normal distribution for the disturbances, we can use a
probit model to estimate the vote equation. Results are given in Table 5, columns (1) and
(3).
The empirical estimation of the indifference curves is therefore:
Year 1998: 73.094.1 += pr , Year 2001: ,48.045.1 += pr
to be compared with the indifference curves from the theory, given above. Note that
for each year, we have only one parameter (g ) to adjust two variables (the constant and
the slope). The fit of the model will be good if we can fit both the slope ( 94.123.1
=g
for

25
1998, 45.101.1
=g
for 2001) and the constant (0.29+g17.0
=0.73 for 1998, 0.45+g21.0
=0.48 for 2001). In 1998, the former equation yields g =0.63 and the latter g =0.39 ; in
2001, the slope equation yields g =0.70 whereas the constant equation gives a very high
value for g .
This suggests that the relative weight of the race-related issue is quite stable over
time, but there is as well a significant party fixed effect that our model does not capture.
We can also estimate a constrained empirical indifference curve, where we impose that a
voter with ideal policy
†
(p ,r) =( ,2
ERRL tt -+)
2
ERRL rr -+be indifferent (in expectation)
between the two parties. In that case, the estimate for g is 0.43 in 1998, and 0.66 for
2001. For 1998, a value of g between 0.40 and 0.60 seems sensible, in 2001, a value
between 0.60 and 0.70 would seem more appropriate. The data appear to reveal an
increased importance of the immigration issue in voters’ preferences.
Thus far, in the regression of table 6, we have used only the two independent
variables size of the public sector and anti-immigration. Our estimation may be biased if
these variables are correlated with other determinants of the vote. To avoid this omitted
variable bias we add more controls to the estimation. (See Table 5, columns (2) and (4).
The definition of the added independent variables is provided in an appendix) Adding
controls reduces the size (in absolute values) of the coefficients on anti-immigrant and
size of the public sector, but they still remain highly significant. The drop is particularly
important in 2001. Yet, this does not substantially alter the ratio of these two coefficients,
which is all that matters for our estimation of g . Indeed, the slope estimation for 1998

26
yields g =0.59 and for 2001 g =0.56. Thus the value of g is not very sensitive to the
specification.
We also use the explicit three-party model to estimate the salience parameter g,
employing multinomial logit estimation. In the three- party case, we have three
theoretical indifference curves to compute (indifference between ER and L, between R
and L, and between R and ER), and to compare to the empirically estimated indifference
curves. We do not report the details of those estimations here. Depending on the
indifference curve we consider in order to estimate g , we find quite different values for
salience parameter. If we want to explain the ER vote, we need a very large g (for 1998
96.1=g and for 2001 54.1=g ), whereas if we want to explain the split between Left
and Right, a smaller g is required (for 1998 43.0=g and for 2001 57.0=g ). The
selection of an intermediate value seems appropriate : we believe that gamma about 0.6
or 0.65, as predicted by the average of the values obtained in two-party model, is a
reasonable choice.
That the value of g appears to vary with the indifference curve estimated indicates
that, in reality, Danes may possess different saliences for the immigration issue. To
represent this variation would require expanding the space of types to possess three
dimensions. Unfortunately, this would render the calculation of equilibrium excessively
costly, if not intractable, with current hardware, and so we must be satisfied with the
assumption of a value of g that is invariant over the polity.

27
Because we do not want to overly rely only on these estimations, we choose to
compute the PUNEs and the counterfactual experiments for several values of g . We
select g =0.4, g =0.6,g =1, and g =1.4 as an appropriate set of choices.
d. Estimation of counterfactual preferences
To compute the anti-solidarity effect, as we have described above, we need to
construct counterfactual ‘racism free’ demands for the public sector, that is, voter
preferences on the size of the public sector that would be observed were hostility towards
immigrants and refugees not to reduce the feeling of solidarity. There is no unique way to
do this; our results will depend on exactly how we interpret the significant correlation
between opinions on the size of the public sector and the immigration issue. We next
present several alternative ways of proceeding.
The first option is to consider the distribution of economic preferences by r-type.
As figures 1a-1b showed, there is a strong negative relationship between support for a
larger public sector and support for a higher number of immigrants. The table below
presents the mean and standard deviation of desired public-sector sizes conditional upon
various values on the immigration issue.

28
1998 2001
! Mean St dev Obs. Mean St dev Obs.
r = -2 +0.91 0.91 46 +0.76 0.85 34
r = -1 +0.44 0.74 181 +0.29 0.83 196
r = 0 -0.01 0.72 581 -0.01 0.72 570
All -0.15 0.92 1914 -0.24 0.91 1967
Table 6 Size of the public sector by degree of xenophobia
Using r = -2 as the reference non-racist group is probably too extreme (Recall that
r = -2 for an individual who supports admitting many more refugees). The choice of r =
-1 or r = 0 seems more reasonable. The average value of ! in 1998 (resp. 2001) is +0.44
(resp. +0.29) among respondents with r = -1 and –0.01 ( both years) among the r = 0
group; it is –0.15 (resp. –0.24) in the whole population.
Another option is to use the question regarding ‘social rights that should be given
to immigrants or refugees’.
Question
Refugees and immigrants should have the same rights to social welfare as Danes,
even though they are not Danish citizens.
The graph below presents the distribution of answers.
Immigrants should be given the same rights as Danes : Distribution of answers.

29
05
101520253035
stro
ngly
agre
e
neith
erag
ree
ordi
sagr
ee
stro
ngly
disa
gree
1998
2001
Note that a large number of Danes oppose giving foreigners the same social rights as the
Danes.
Some summary statistics on economic preferences by answers to this question are
presented in the table below. ‘Agree’ stands for either agree or strongly agree; ‘don’t
disagree’ stands for the group who neither agree or disagree.
1998 2001
Mean Std. Dev. Obs Mean Std. Dev. Obs
Agee +0.17 0.85 529 +0.06 0.88 550
Don’t disagree +0.08 0.85 765 -0.01 0.86 838
All -0.15 0.92 1914 -0.24 0.91 1967
The conclusion of this preliminary analysis is that a reasonable counterfactual
distribution of p should have a mean between 0.1 and 0.2 and standard deviation about
0.85 for year 1998, and a mean between 0 and 0.1 and standard deviation about 0.85 for
year 2001.

30
A third option is to use regression analysis to explore the empirical relationship
between the size of the public sector and views on immigration. We estimate the
following model:
,' iiii X ebdrp ++-=
where iX is a set of individual characteristics, including social and demographic
variables, as well as responses to questions about how the respondents feel on a number
of justice issues, or about the behavior of people living on welfare. The disturbance
term ie represents the unobserved characteristics of individual i ; it is a zero mean
disturbance with standard normal distribution. We estimate the model with OLS. Results
are presented in table 7 (The definition of the added independent variables is provided in
an appendix).
The anti-immigration variable is highly significant and attracts the expected
negative sign. Unsurprisingly, people who think that the unemployed are lazy, that too
many people take advantage of the system, or who think that a higher level of justice is
not desirable tend to favor lower tax rates. The young, female respondents tend to support
a larger public sector.
There is no canonical way to decide upon the exact list of the variables that
should be included on the right-hand side of the regression in table 7. The following
example will show why this is the case. If we regress p on r alone with 1998 data, the
coefficient on r is –0.30 (column 1). Now consider adding the variable TakeAdvantage to
this regression, which measures whether the respondent thinks that too many people take
advantage of the public system and receive benefits although they do not need them (see
the appendix for the exact definition). The correlation between AntiImmigration and

31
TakeAdvantage is very large: 0.40. If we add the variable TakeAdvantage to the
regression, the coefficient on AntiImmigration drops to –0.20 (TakeAdvantage is the
variable that induces the biggest drop in the absolute value of the coefficient when added
to the regression). Whether we should add this variable to the right- hand side of the
regression depends on how we interpret the correlation between AntiImmigration and
TakeAdvantage. If we believe that both hostility towards immigrants and a negative
opinion of people who live on welfare are determined by the same psychological or social
traits—for example, some intrinsic general distrust-- then the TakeAdvantage variable
should be added. On the other hand, it might be argued that people who have a low
opinion of welfare recipients do so because ethnic minorities are over-represented among
them. In this case, including the TakeAdvantage variable on the right-hand side of the
equation will induce an under-estimate of the direct influence of AntiImmigration on
support for a larger public sector.5 The question is hard to settle. We chose here to add
all possible variables to the right-hand side of the regression.
The figures in the table 7 above suggest that an increase of 1 point (on the –2,2
scale) in the level of xenophobia reduces the ProPublicSector by d̂ = 0.18 in 1998 and
5 It is straightforward to deduce the direction of the bias in the simple starting case herewhere AntiImmigration is the single included variable, because it only depends on the
sign of the correlation between AntiImmigration and TakeAdvantage. When more that
one variable is included, what is required to deduce the direction of the bias is thecorrelation between AntiImmigration and TakeAdvantage net of the effect of other right-
hand side variables. Here, the partial correlation between AntiImmigration andTakeAdvantage remains positive although smaller (0.27).

32
by d̂ = 0.23 in 2001. We use this estimator to construct what we will define as racism-
free demands for the public sector. We proceed as follows.
1. We select a critical level of AntiImmigration refr that we take to be the non-
xenophobic threshold.
2. We define all individuals with
†
r £ rref to be free of racism, and take their observed
preferences for the public sector to be their racism-free economic preferences.
3. For all individuals with
†
r > rref , we assume that there is some racism at play, and
define their racism-free economic preferences to be those they would have if
†
r = rref .
More specifically, consider an individual with observed ideal policy p and r .
We define a racism- free demand for public sector by :
, if refrrp £ and refref if ) ( rrrrdp ≥-+ .
We will consider three different values for refr !: refr != -2 (option 1), refr != -1
(option 2), refr != 0 (option 3). The table below presents the mean and standard
deviation of the racism -free economic preferences for the three options, and the two
years under study. The last line also presents the figures for observed preferences.
1998 2001
Mean Std. Dev. Mean Std. Dev.
Racism free, option 1 +0.33 0.87 +0.37 0.86
Racism free, option 2 +0.15 0.87 +0.15 0.86
Racism free, option 3 -0.01 0.88 -0.05 0.87
Observed preferences -0.15 0.91 -0.24 0.91

33
Note that the obtained values are almost identical in 1998 and 2001. In 2001, there is a
slight decrease in the observed demand for public sector compared to 1998, but an
increase in the coefficient d balances this effect, so that racism-free demands are
practically the same. It should also be noted that these values are very similar to those
obtained with the simpler methods presented above.
We conclude that a reasonable set of racism-free distributions of public-sector
preferences for both years are normal distributions with mean = 0, mean = 0.15, mean =
0.3, and standard deviation 0.85.
5. Political equilibrium: Observation and prediction
As we described in section 4, we decided to perform all computations for each
year for the cross product of four values of g. We chose the distribution of types
†
(p ,r) to be a bivariate normal distribution whose parameters are given in section 4.
Almost the entire support of the distribution lies in the square
†
[-2,2]¥ [-2,2]. Figure 2
plots the density function for 1998. (The horizontal axis in the figure is p.)
We describe the computation of equilibrium PUNEs. We set the ER policy at its
observed value. For each value of g, we computed many (approximately thirty)
PUNEs6. Recall that to compute a PUNE, we must solve four simultaneous equations in
six unknowns, such that two of the unknowns, the Lagrangian multipliers, are non-
negative. We indeed find many PUNEs, as predicted by the theory. In what we now
6 We do not compute more PUNEs because even this computation requires about eighthours of computer time, for each value of the g. And we tried many more variations ofthe model than we report here.

34
report, we restrict to PUNEs, for the 1998 election, where the L vote share lies in the
interval [0.38, 0.58], whose mid-point, 0.48, is the observed vote share of L in the 1998
election. For the 2001 election, we performed a slightly different treatment. After
computing 30 PUNEs, we selected the subset of 15 whose 3-vectors of party vote shares
were closest to the observed vote share vector. Thus, we are adding one more condition
to the model, to fit it to the data – namely, that the predicted vote shares should be as
close as possible to the observed vote shares.
In Figures 3a-3b, we graph these PUNEs in the full model for g=0.6. The space
of the figure is (t,r); consult the legend of figure 3a. Recall, we fix the ER PUNE policy
at its observed value.
Ideally, we desire that the observed policy lie in manifold of equilibrium PUNEs.
That is not quite the case here: in both years, the observed L policy has a larger public
sector and is more pro-immigrant than the PUNE policies for Left; the observed public-
sector R policy calls for a smaller public sector than the t policy in the R-PUNEs, and the
observed Right immigrant policy is less anti-immigrant than the equilibrium policies. To
summarize, the PUNEs predict that both L and R parties should be more anti-immigrant
than they are, and on the economic dimension, the parties are more polarized than they
‘should’ be, according to the model.
It must be emphasized that our utility function has only one degree of freedom;
had we a more complex utility function, we would probably be able to calibrate the
model to better fit the data. Nevertheless, it may also be the case that the preferences of

35
the Danish polity are in a state of flux, due to the immigration issue, and that the parties
have not fully adjusted to them7.
The set of PUNEs computed for these values of g are presented in Tables 8a-8b.
The second and third columns, labeled ‘BPD’ and ‘BPC’, present the relative bargaining
power of the Opportunists with respect to the Militants at the PUNE, in the L and R
parties, respectively. These relative bargaining powers at an equilibrium can be
computed from a theory and formula provided in Roemer (2001, page 165). A relative
bargaining power of 0.5 means the factions are equally strong in the bargaining game.
When the relative bargaining power is greater (less) than 0.5, then the Opportunists
(Militants) are more powerful in the party in question.
The observed vote shares in the 1998 election were (.48, .426, .094) respectively
for L,R,ER. The average shares of the parties in the PUNEs in the above table are (.51,
.34, .14). Thus, we predict that the Right should receive fewer votes, and the Left and
Extreme Right more votes, than they did in reality. This seems consistent with our
observation above that the Right’s observed policy is insufficiently anti-immigrant, and
the Left’s public-sector policy is too far left.
In 2001, the observed vote shares were for L, R, and ER were (.422, .466, .112).
Compared with 1998, the Left lost substantially and the Right and Extreme Right gained.
The average shares in the PUNEs reported in Table 8b for L, R, and ER are (.584, .209,
7 Although we say preferences are in a state of flux, we really mean that the type towhich a particular voter belongs is in a state of flux. Fundamental preferences, as defined
by the function v, are assumed to be stable. But voters change their type when theychange their attitudes towards immigrants or the size of the public sector.

36
.208). Thus, we do not correctly predict the change in vote share between Left and
Right, although we do predict a large increase in vote share of the ER. Figure 3b
provides some understanding: in reality, Left proposed a much more left policy on the
public sector than it ‘should’ have, and Right a much more right policy on the public
sector than it should have. Note from Figure 3b that Left’s PUNE platforms are very
close to the average ideal platform of voters, which explains why, in the PUNEs, it
receives such a large vote share.
We next display the predicted partition of the space of voter types into the three
party memberships at the average of the PUNEs in Tables 8ab. Note from equations
(2.3) and (2.4) that the set of types that prefer one policy to another is the set of types
below or above a straight line in
†
(p ,r) space. In figures 4a-4b we present the partition
of voter types into the three party memberships for the average of the PUNEs of Table 8.
The figures present two straight lines drawn over a density plot of the distribution of
voter types: in the density plot, light color means high density. The space is
†
(p ,r) . All
types to the right of the light (green) line comprise Left; all types between the two lines
comprise Right; all types to the left of the dark line comprise Extreme Right.
To show the effect of the size of
†
g on the party partition, we graph in figure 5
the party-membership partition for g=1.4. The lines demarcating the party partition have
much steeper slope in figure 4a than in figure 5. In other words, as the salience of the
race issue increases, the racial position of the voter becomes more important for
predicting his party membership. If the lines in these figures were vertical, party
identification would be determined entirely by one’s preferences on the economic issue.

37
Perhaps the most interesting feature about the type-decomposition into parties of
figures 4ab and 5 is that the two lines in the figure diverge as p increases. This means
that, as p increases, the ‘space’ for the Right party increases, in the sense that there are
more values of r that will generate a Right vote. For voters with a large ideal public-
sector size, the choice is essentially between voting Left and Right, whereas for voters
with a low ideal public-sector size, the choice is essentially between voting Left and
Extreme Right. This does not correspond to anecdotal evidence about the shift towards
extreme-right politics in Europe, in which it is often said that the unskilled native
working class is shifting its vote from Left to Extreme Right because of the immigration
issue -- and these voters should have a quite high ideal value for the size of the public
sector.
By examining equation (2.4), we see that, at a PUNE, the slope of the line
separating the Left and Right constituencies is
†
t L - t R
rR - rL , and the slope of the line
separating the Right and Extreme Right constituencies is
†
t ER - t R
rR - rER . Note that these
ratios are just negative reciprocals of the slopes of the line segments joining the policy
pairs
†
(t L ,t R ) and (t R ,t ER ) , respectively. Now in figure 4a, the three observed policies
are virtually collinear, but the three predicted policies are not. If our party partition in
figure 4a were drawn using the observed policies, it follows that the two separating lines
would be virtually parallel. This shows how the divergence of the lines in figures 4 and
5 derives from the fact that our predicted equilibrium policies for the three parties are not
collinear.
We summarize our results to this point as follows.

38
• in PUNE, both L and R parties are more anti-immigrant than the corresponding
parties were, in fact, in 1998 and in 2001;
• in PUNE, the L party is less left on the economic issue than it was, in fact,
in1998 and in 2001;
• in PUNE, the R party is more left on the economic issue than it was, in fact, in
1998 and in 2001;
• in PUNE the L and ER parties are larger (receive more votes) than they were, in
observation, and the R party is smaller than it was, in observation.
There are several possible sources of the error the model makes with respect to
prediction, among which are that:
1. actual parties do not contain a faction that attempts to represent those who vote
for the party, as does the Militant faction in our model (more on this below) ;
2. the voter utility function we have used is not a sufficiently precise
representation of voter preferences;
3. voters are strategic (in a multi-party election), while we have modeled them as
sincere;
4. many voters are changing their type rapidly (e.g., becoming more anti-
immigrant), and parties, especially the L and R, have misestimated the true distribution
of types;
5. many citizens vote for a party out of habit or family tradition, even if the party
they vote for is not the optimal choice given their type.
39
Note, in particular, that strategic voting and voting out of habit could well explain
why the R party received, in reality, more votes than it ‘should’ have: that is, it may have
received many votes that, absent effects 3 and 5, would have gone to the ER.
Regarding point #2, it would surely be desirable to introduce at least one more parameter
in the voter’s utility function. One might, as we mentioned earlier, wish to differentiate
voters with respect to
†
g ; this would require a three-dimensional type space, where a
voter’s type was
†
(p ,r,g) . While the theory of PUNEs on such a type space is no more
complicated than on the two-dimensional type space, the computational problems
become forbidding, because the equation-solving required for computing PUNEs would
involve computing three-dimensional integrals, instead of two-dimensional integrals,
which, given the existing Mathematica software, is, for practical purposes, infeasible.
Without further research, we do not wish to conjecture further about the relative
importance of these deviations of reality from the model.
6. The policy bundle and anti-solidarity effects: Computation
For values of
†
g Π{0.4,0.6,1.0,1.4} in 1998, and
†
g Π{0.4,0.65,1.0,1.4} in 2001,
we computed PUNEs for the full two-dimensional model. For a given PUNE, i, we
define the ‘expected tax policy’ as
†
(t exp)i = (j L t L + j R tR + j ER tER )i, that is, the share-
weighted average of the ‘tax’ policy of the parties8. Our summary statistic for the tax
policy of the election is the average of
†
{t exp i} over all the PUNEs found for the particular
value of g. We define this statistic as
†
t exp(g).
8 This is meant to be a simple approximation of the process by which legislated outcomecompromises among the positions of parties.

40
In the first counterfactual, we compute PUNEs for a model with two parties, in
which the policy space is unidimensional , as described in section 3. We restricted to
PUNEs in the counterfactual for which the vote share of the L party was between 30%
and 70%. This can be justified by saying that the Opportunists in either the L or the R
party would be sufficiently strong to veto any policy which would give their party less
than 30% of the vote.
We chose a two-party model for the counterfactual, because, first, it would be
computationally difficult to find equilibria for three endogenous parties (in the
counterfactual model, we would have no way to set the policy of the ER party
exogenously). Secondly, were politics indeed unidimensional, it is questionable that an
ER party would receive an appreciable vote share, so a two-party model is a reasonable
counterfactual.
Recall that, in the first counterfactual, we use the actual distribution of voter
types, F. This counterfactual is equivalent to holding an election where the
government’s position on the immigration issue is fixed, and all voters take it to be so.
We again take as the summary statistic the average of share-weighted tax policies found
in all PUNEs (for which the shares of both parties are at least 30%). Denote this value
†
tIexp(g).
For the second counterfactual, which computes the anti-solidarity effect, we
changed the distribution of voter types to the estimated racism-free distribution, G,
described in section 4. We took the racism -free distribution to be a normal distribution
on p with standard deviation 0.85 and mean in the set
†
m* Π{0,0.15,0.3} . Thus, for each
value of g, we ran three versions of the second counterfactual.

41
For each counterfactual, we again take the summary statistic for expected policy
on the size of the public sector as the average of the ‘expected tax policies’ over all
PUNEs found. Denote this value by
†
tIIexp(g,m*) .
In the unidimensional models, it remains the case that there is a two-manifold of
PUNEs. The policy equilibria live, now, in a two-dimensional space (one dimension for
each party), and so the PUNEs pave a region in the plane. We computed over 400
PUNEs for each version of the counterfactual models.
We now define the PBE and the ASE, which are functions of
†
(g,m*) by:
†
PBE(g) = tIexp(g) - t exp(g)
ASE(g,m*) = tIIexp(g,m*) - tI
exp(g).
Clearly the total effect of xenophobia on the size of the public sector is:
†
TOT(g,m*) = PBE(g) + ASE(g,m*) = tIIexp(g,m*) - t exp(g).
Tables 9a-9b report the results.
The appropriate way to think of the size of these effects is in comparison to the
standard deviation of the distribution of ideal public–sector values (p), which is 0.92 in
1998 and 0.91 in 2001. Note that both the PBE and ASE are quite insensitive to
changes in g. By definition, the PBE is invariant with respect to changes in m*. Thus,
virtually all the variation in the two effects is attributable to changes in the ASE as we
vary the value of m*. As we would predict, the ASE increases as we increase the value
of m*.
The 1998 PBE is 6-12% of one standard deviation in the distribution of ideal tax
rates, and the 2001 PBE is smaller still. We should expect a positive PBE for Denmark,
because, as we demonstrated earlier, the observed positions of the eleven parties are

42
strongly correlated across the two dimensions: as Table 2 shows, parties that are more
right-wing on the immigration issue are also more right-wing on the economic issue.
Therefore, a voter who strongly wishes to vote anti-immigrant must vote anti-tax, even if
he wants a large public sector.
The fact that the PBE fell between 1998 and 2001 is theoretically predictable.
Note that the ER party became significantly less extreme (and right) on the economic
issue in 2001. Thus, it became possible to switch one’s vote from Right to Extreme
Right in 2001 without supporting a much more right position on the public sector. (This
was even more true at the observed platforms than at the PUNE platforms.) This
suggests that the PBE should diminish.
It appears that the PBE is significantly smaller than the ASE in both years and for
all values of the parameters.
Our summary of Table 9 is that the total effect of xenophobia in Denmark on the
equilibrium size of the public sector is to reduce that size by somewhere between 0.25
and 0.50 of one standard deviation of the actual distribution of the polity’s ideal sizes of
the public sector. The effect does not seem to have changed substantially between 1998
and 2001. Note, however, that these effects are computed taking the full-model PUNE
policies as the benchmark, not the observed policies— except for the ER party group,
whose PUNE policy is its observed policy.
7. Conclusion
Our model of party unanimity Nash equilibrium conceptualizes party competition
in a way that provides existence of political equilibrium when the policy space is multi-
43
dimensional, and, moreover, predicts that parties propose different policies in
equilibrium. By virtue of these features, it is superior to the Downsian model of purely
opportunist politics, in which equilibria rarely exist if the policy space is multi-
dimensional, and to other models of political equilibrium with multi-dimensional policy
spaces (e.g., the model of Coughlin(1992)), which predict that parties propose the same
policy in equilibrium. The PUNE model conceptualizes the decision makers in parties as
having varied interests, regarding winning versus representation, and that the factions
organizing these disparate interests bargain with other when facing the opposition parties’
platforms.
Like all equilibrium models, ours is best viewed as one that describes a political
system in which preferences of voters are stable. In periods when voter preferences are
in flux, we cannot expect the PUNE model to give perfect predictions. With stable
constituencies, party entrepreneurs will come to know their constituencies’ interests well,
and we can expect that those entrepreneurs who wish to represent constituents will do so
with more precision than when voter preferences are unstable and constituencies are
shifting. The mechanism by which this occurs may well be that those Militants who rise
within the party structure are ones who best represent the constituents’ interests. Once
ensconced, however, a particular Militant will have a career within the party that may last
for years or decades. Thus, in periods of voter-preference flux, the established Militants
in a party may cease to represent its evolving constituency.

44
We believe this may be the case in Denmark9, and so our calculations concerning
the effect of voter xenophobia on the size of the public sector are ones we would expect
to hold in the future, if voter preferences remain as they are now, and parties adjust to
them over time. In 2001, the share-weighted average of the observed parties’ policies on
the size of the public sector was -0.324 ; the share-weighted averages of the PUNE
policies, depending upon the value of g, are -.271, -.307, -.280, and -.275 , for g = 0.4,
0.65, 1.0, and 1.4, respectively. Recalling that a public sector size of ‘0’ corresponds to
the present size, we might predict that the size of the public sector will shrink in
Denmark10.
Our policy space is only two dimensional. In actual politics, the policy space has
many more dimensions. In particular, it is possible, in reality, to differentiate public-
sector policy towards immigrants from policy towards natives: for example, immigrants
may receive less favorable treatment with regard to transfer payments than natives, as is
currently the case in Denmark. To represent this possibility in our model would require
a third policy dimension. With such a third dimension, both the anti-solidarity and
policy-bundle effects should decrease, because presumably parties could then propose to
retain high public-sector benefits for natives, while reducing them for immigrants. We
9 For example, the SDP’s militants may reflect the preferences of its constituents in an era
which is now past.10 Of course, parliamentary politics produce an outcome that is considerably more
complex than that which would be predicted by taking a share-weighted average of theparties’ positions.

45
cannot, therefore, predict that the total size of the welfare state will radically fall in
Denmark11.
Indeed, this point illustrates the necessity for political economists to model
political competition as occurring over multi-dimensional policy spaces. Our work
begins this task, although, as we have just noted, it still falls short of what is desirable.
The binding constraint, at this point, is the difficulty of computing equilibria in real time,
when the dimension of the type space and/or policy space is larger than two.
11 We contrast this with the United States, where voter racism is directed primarily
towards African-Americans, who, as citizens, cannot be legally discriminated against, ascan aliens. Thus, we would expect the size of the welfare state to be more affected by
voter racism in the US than by voter xenophobia in Denmark. See Lee and Roemer(2004) for further analysis.
46
References
Coughlin, Peter. 1992. Probabilistic voting theory, New York: Cambridge
University Press
Lee, Woojin, and J.E. Roemer, 2004. “Racism and redistribution in the United
States: A solution to the problem of American exceptionalism”
Roemer, John E. 2001. Political Competition, Cambridge, MA: Harvard
University Press
Danish Statistical Archive, Data Material DDA-4189: Election Survey 1998.
Primary researchers: J∅rgen Goul Andersen, Johannes Andersen, Ole Borre and Hans
J∅rgen Nielsen. DDA-4189 1st edition (with Birgitte Gr∅nlund Jensen, Jens Wagner and
Lena Wul). Danish Data Archive 1999. 1 data file (2001 respondents, 327 variables) with
related documentation (249 pp.).
Danish Statistical Archive, Data Material DDA-12516: Election Survey 2001.
Primary researchers: J∅rgen Goul Andersen, Ole Borre, Hans J∅rgen Nielsen, Johannes
Andersen, S∅ren Risbjerg Thomsen and J∅rgen Elklit. DDA-12516 1st edition (with
Henning Lauritsen, Birgitte Gr∅nlund Jensen, and Jens Wagner). Danish Data Archive
2003. 1 data file (2026 respondents, 316 variables) with related documentation (299 pp.).

47
Year 1998
0%
20%
40%
60%
80%
100%
muc
h m
ore
refu
gees
sam
e nu
mbe
r of
refu
gees
muc
h fe
wer
refu
gees
increase publicsector a lot
increase publicsector a little
public sector aboutright
cut public sector alittle
cut public sector alot
Figure 1a The distribution of economic views by xenophobic type, year 1998
Year 2001
0%
20%
40%
60%
80%
100%
muc
h m
ore
refu
gees
sam
e nu
mbe
r of
refu
gees
muc
h fe
wer
refu
gees
increase publicsector a lot
increase publicsector a little
public sector aboutright
cut public sector alittle
cut public sector alot
Figure 1b The distribution of economic views by xenophobic type, year 2001

48
Figure 2 The bivariate normal density function for 1998

49
Figure 3a PUNEs, 1998, g=0.6.
Legend: Abscissa is t, ordinate is r. The large dot is the average ideal point of voters.The three small dots are the observed policies of ER,R, and L parties. The cluster of reddots are PUNE policies of Left; the cluster of green dots are PUNE policies of Right.
Figure 3b PUNEs, 2001, g=0.65. See legend for figure 3a.
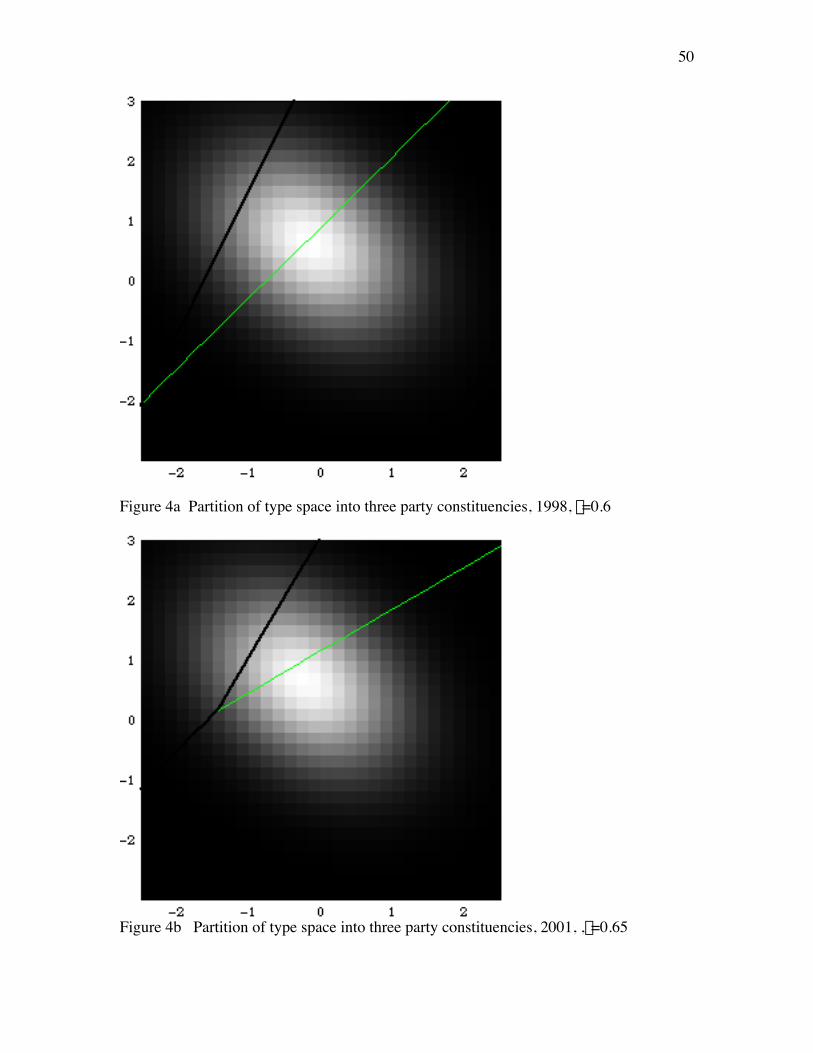
50
Figure 4a Partition of type space into three party constituencies, 1998, g=0.6
Figure 4b Partition of type space into three party constituencies, 2001, ,g=0.65

51
Figure 5 Party partition, 1998 average PUNEs, g=1.4

52
1998 2001
Reported
vote
share (1)
Actual
vote
share
Left-
Right
(11-point
scale)
Reported
vote
share (1)
Actual
vote
share
Left-
Right
(11-point
scale)
United Left Wing party 3.2 2.7 1.21 2.7 2.4 1.47
Socialist People’s Party 8.8 7.5 2.52 6.4 6.4 2.78
Social Democratic Party 31.5 36.1 4.35 27.6 29.1 4.38
Liberal Democrats 4.5 3.9 4.67 5.5 5.2 4.61
Center Democratic Party 4.4 4.3 5.54 1.2 1.2 Not
Asked
Christian People’s Party 2.2 2.5 5.93 2.1 2.3 5.48
Conservative People’s
Party
10.7 8.9 7.23 9.0 9.1 6.98
Liberal Party 25.3 24.0 7.55 34.4 31.3 7.32
Danish People’s Party 7.2 7.4 8.64 10.9 12.0 8.13
Progress Party 2.2 2.4 8.64 0.3 0.6 Not
Asked
Note: (1) Among voters who answered the question.
Table 1 Danish Political Parties – Vote shares

53
1998 2001
More Public
Sector
Immigration
Stand point
More Public
Sector
Immigration
Stand point
United Left Wing party 1.40 -1.24 1.08 -1.05
Socialist People’s Party 1.13 -0.96 0.89 -0.78
Social Democratic Party 0.53 -0.12 0.46 -0.08
Liberal Democrats 0.20 -0.32 0.22 -0.35
Center Democratic Party -0.07 -0.20 Not asked Not asked
Christian People’s Party 0.00 -0.12 0.07 -0.17
Conservative People’s Party -0.93 0.88 -0.88 1.04
Liberal Party -1.00 0.88 -1.01 1.07
Danish People’s Party -1.40 1.96 -1.02 1.90
Progress Party -1.53 1.88 Not asked Not asked
Table 2 Danish Political Parties – Perceived platforms

54
#1 #2 #3 #4 Total
Immigration of refugees and immigrants including the fight against
racism
305 195 123 47
670
Health sector and the hospital sector 305 256 107 38 706
Environment / Environmental issues 168 102 80 27 377
Conditions for the aged 153 161 60 19 393
Employment, unemployment including labor market policy 147 86 45 25 303
The economy 130 50 26 10 216
Families with children / day-care centers 119 144 62 16 341
Social problems including social policy 80 58 25 8 171
EU-related to in general, general handling of the Amsterdam treaty 78 52 31 14 175
Nursing homes / domiciliary care 59 88 48 7 202
Balance of payment / foreign debt 34 24 11 6 75
Violence, crime, law and order / justice policy 30 52 45 23 150
Tax reform / tax burden, including deterioration of private pensions 21 20 16 4 61
Unclear answer : everything 20 3 0 0 23
State schools / schools policy 19 42 36 11 108
Distribution of public expenditure 19 13 10 1 43
The pollution problem 16 8 4 4 32
Education / education standards 14 35 27 17 93
Social benefits including maternity and other such leave 14 9 5 0 28
Welfare state without further details 14 5 2 0 21
Do not know 28 1 8 0 29
Do not answer 19 362 1,053 1,645
Note : There are 2,001 respondents in the sample.
Question: We have, as you know, just had parliamentary elections, and therefore I would
like to ask you what problems you think are the most important ones that politicians
should be doing something about today?
(Most important problem #1, #2, #3, #4)
Table 3 The most important problems in Denmark: 1998 election survey

55
1998 elections 2001 elections
Reported vote share Actual vote share Reported vote share Actual vote share
Left 48.0 50.3 42.2 43.1
Right 42.6 39.9 46.6 44.5
ER 9.4 9.8 11.2 12.6
Table 4a Parties’ vote shares
1998 2001
Pub. Sector Immigration Vote share Pub. Sector Immigration Vote share
Left +0.67 -0.37 48.0 +0.53 -0.28 42.2
Right -0.83 +0.72 42.6 -0.93 +1.01 46.6
ER -1.43 +1.94 9.4 -1.02 +1.90 11.2
Voters -0.15 +0.67 -0.24 +0.70
Notes: (1) Observed policy of the Right ignoring the Center Democratic Party. (2)
Observed policy of the Extreme Right ignoring the Progress Party. (3) Observed policy
of the Right assuming that the Center Democratic Party proposes the same policy in 2001as in 1998. (4) Observed policy of the Extreme Right assuming that the Progress Party
proposes the same policy in 2001 as in 1998. (5) In the 2001 survey there is no questionabout the perceived position of the Center Democratic Party and of the Progress Party.
Since these parties receive only a small share of the votes (resp. 1.2 % and 0.3%) we
simply ignore them when computing the average observed policies of the Right andExtreme Right coalitions.
Table 4b Voters’ and parties’ positions on the various issues

56
1998 2001
(1) (2) (3) (4)
Anti Immigrants +0.324***
(0.035)
+0.207***
(0.044)
+0.409***
(0.036)
+0.364***
(0.043)
Pro Public Sector -0.628***
(0.040)
-0.587***
(0.048)
-0.595***
(0.041)
-0.556***
(0.046)
Constant -0.236***
(0.040)
-0.048
(0.376)
-0.195***
(0.040)
+0.370
(0.366)
Law and order +0.212***
(0.044)
+0.164***
(0.041)
Environment -0.254***
(0.025)
-0.226***
(0.031)
Household
income
+0.060***
(0.011)
+0.038***
(0.010)
Female +0.201***
(0.078)
-0.004
(0.074)
Age -0.058***
(0.014)
-0.047***
(0.014)
Age square +0.00065***
(0.0001)
+0.0004***
(0.0001)
City -0.044*
(0.027)
-0.050*
(0.028)
Education +0.122***
(0.045)
+0.115***
(0.043)
Nb observations 1,739 1,472 1,814 1,644
Log likelihood -972.98 -754.57 -976.50 -818.20
Pseudo R2 0.1916 0.2604 0.2101 0.2715
Note: *** means significant at the 1% level, ** at the 5% level and * at the 10% level.
Standard errors are in parentheses below the value of the coefficients.
Table 5 Dependent variable: Vote for the Right coalition (Probit estimation)

57
1998 2001
Anti Immigrants -0.295***
(0.020)
-0.173***
(0.023)
-0.308***
(0.019)
-0.226***
(0.023)
Constant +0.043*
(0.024)
+0.105
(0.203)
-0.028
(0.023)
0.051
(0.191)
Unemployed Lazy -0.103***
(0.018)
-0.044***
(0.017)
Take Advantage -0.104***
(0.020)
-0.125***
(0.018)
Same econ. conditions
for all
+0.088***
(0.016)
+0.104***
(0.015)
Household
Income
-0.017***
(0.006)
-0.021***
(0.006)
Female +0.313***
(0.043)
0.203***
(0.041)
Age +0.014*
(0.008)
0.013*
(0.007)
Age squared -0.0002**
(8.10-5)
-0.0002**
(7.10-5)
City -0.018
(0.015)
0.015
(0.015)
Education -0.036
(0.025)
-0.061***
(0.023)
Obs. 1,886 1,483 1,933 1,645
R-squared 0.1066 0.2411 0.1166 0.2156
Note: *** means significant at the 1% level, ** at the 5% level and * at the 10% level.
Standard errors are in parentheses below the value of the coefficients.
Table 7 Dependent variable: ProPublicSector (Estimation with OLS)

58
Table 8a PUNE values, 1998, g=0.60
Legend: BPD = relative bargaining power of Opportunists in Left party;BPC = relative bargaining power of Opportunists in Right party;{tD,tC,tR}=equilibrium values of parties {Left, Right, Extreme Right} on public-sectorsize; {RD,RC,RR}=equilibrium values of parties {Left, Right, ER} on immigrationissue; {jD, jC,jR}= vote shares of parties {Left, Right, ER} at equilibrium.
Table 8b PUNE values, 2001, g=0.65See Legend for table 8a.
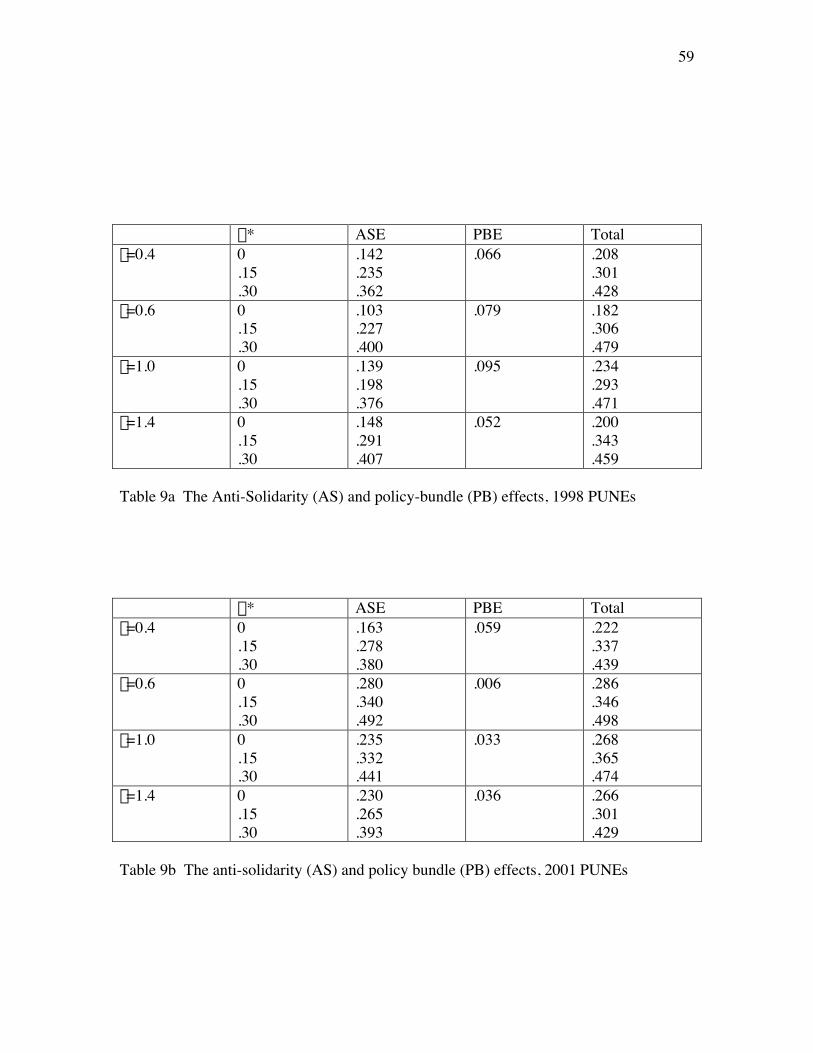
59
m* ASE PBE Totalg=0.4 0
.15
.30
.142
.235
.362
.066 .208.301.428
g=0.6 0.15.30
.103
.227
.400
.079 .182.306.479
g=1.0 0.15.30
.139
.198
.376
.095 .234.293.471
g=1.4 0.15.30
.148
.291
.407
.052 .200.343.459
Table 9a The Anti-Solidarity (AS) and policy-bundle (PB) effects, 1998 PUNEs
m* ASE PBE Totalg=0.4 0
.15
.30
.163
.278
.380
.059 .222.337.439
g=0.6 0.15.30
.280
.340
.492
.006 .286.346.498
g=1.0 0.15.30
.235
.332
.441
.033 .268.365.474
g=1.4 0.15.30
.230
.265
.393
.036 .266.301.429
Table 9b The anti-solidarity (AS) and policy bundle (PB) effects, 2001 PUNEs

60
Appendix Definition, mean, and standard deviation of the independent variables intables 6 and 7.
Pro Public SectorQuestion:Among other things, the parties disagree about how big the public sector should be. Someparties say we should cut down on public revenue and expenditure, other say we shouldexpect increasing expenditure and revenue in the future. Where would you placeyourself?Answers:Public revenue and expenditure should be cut down a lot (-2)Public revenue and expenditure should be cut down a little (-1)Public revenue and expenditure are appropriate as they are now (0)Public revenue and expenditure should increase a little (+1)Public revenue and expenditure should increase a lot (+2)
Anti ImmigrantsQuestion:Among other things, the parties disagree about how many refugees we can take. Somesay we take too many. Other say we could easily take more. Where would you placeyourself?Answers:We should take a lot more refugees than we do now (-2)We should take somewhat more refugees than we do now (-1)We should keep on taking the same number as we do now (0)We should take somewhat fewer refugees than we do now (+2)We should take far fewer refugees than we do now (+2)
Law And OrderQuestion:I am now going to mention some view points from the political debate, which one canagree with or disagree with. Violent offenses should be punished much harder than theyare today. Answers:Strongly disagree (-2)Slightly disagree (-1)Neither agree or disagree (0)Agree (+1)Strongly agree (+2)
EnvironmentQuestion:I am now going to mention some view points from the political debate, which one canagree with or disagree with. The economic growth should be insured through building upof industry, even if it conflicts with environmental interests.

61
Answers:Strongly agree (-2)Agree (-1)Neither agree or disagree (0)Slightly disagree (+1)Strongly disagree (+2)
Same econ conditionsQuestionI am now going to mention some view points from the political debate, which one canagree with or disagree with. In politics one should aim to provide the same economicsconditions for everyone, regardless of education or occupation.AnswersStrongly disagree (-2)Slightly disagree (-1)Neither agree or disagree (0)Agree (+1)Strongly agree (+2)
Unemployed LazyQuestionI am now going to mention some view points from the political debate, which one canagree with or disagree with. In reality, many of the unemployed don’t want to take a job.AnswersStrongly disagree (-2)Slightly disagree (-1)Neither agree or disagree (0)Agree (+1)Strongly agree (+2)
Take AdvantageQuestionI am now going to mention some view points from the political debate, which one canagree with or disagree with. There are too many getting social security benefits, whodon’t need it.AnswersStrongly disagree (-2)Slightly disagree (-1)Neither agree or disagree (0)Agree (+1)Strongly agree (+2)
Household incomeQuestionWhat is your household’s total annual gross income – ie before tax?Answers

62
Under 75,000 kr (1)Between 75,000 and 99,999 kr (2)Between 100,000 and 124,999 kr (3)Between 125,000 and 149,999 kr (4)Between 1505,000 and 174,999 kr (5)Between 175,000 and 199,999 kr (6)Between 200,000 and 249,999 kr (7)Between 250,000 and 299,999 kr (8)Between 300,000 and 349,999 kr (9)Between 350,000 and 399,999 kr (10)Between 400,000 and 449,999 kr (11)Between 450,000 and 499,999 kr (12)Between 500,000 and 599,999 kr (13)Between 600,000 and 699,999 kr (14)Between 700,000 and 799,999 kr (15)800,000 kr and over (16)
CityQuestionWhat type of town do you live in?AnswerRural district (1)Town with less than 10,000 inhabitants (2)Town with 10,001-50,000 inhabitants (3)Town with 50,001-500,000 inhabitants (4)Capital city area (5)
EducationQuestionWhat level of schooling did you complete?AnwersPrimary schools, 7 years or less (1)Primary and lower secondary school, 8/9 years (2)10 years schooling / School leaving exam (3)Matriculation / Senior high school exam (4)

63
Means and standard deviations
1997 2001
Mean St. dev. Obs. Mean St. dev. Obs.
Anti Immigrants +0.67 1.02 1948 +0.70 1.01 1972
Pro Public Sector -0.15 0.92 1914 -0.24 0.91 1967
Law and order +1.38 1.01 1976 +1.43 0.99 2008
Environment +0.54 1.29 1933 +0.49 1.28 1944
Unemployed Lazy +0.09 1.40 1935 +0.02 1.39 1977
Take Advantage +0.64 1.23 1844 +0.54 1.27 1886
Same Econ Cond. -0.42 1.39 1933 -0.29 1.41 1968
Household income 8.59 3.91 1746 9.58 4.15 1857
Female 0.46 0.50 2001 0.48 0.50 2026
Age 46.00 16.63 2000 47.41 19.95 2026
City 2.89 1.44 1998 2.73 1.34 2023
Education 2.72 1.09 1992 2.76 1.08 2025