The Political Economy of the Essential Air Service Program
34
Department of Economics Working Paper Series The Political Economy of the Essential Air Service Program Joshua Hall, Amanda Ross and Christopher Yencha Working Paper No. 15-18 This paper can be found at the College of Business and Economics Working Paper Series homepage: http://be.wvu.edu/phd_economics/working-papers.htm
Transcript of The Political Economy of the Essential Air Service Program
Department of Economics Working Paper Series
The Political Economy of the Essential Air Service Program Joshua Hall, Amanda Ross and Christopher Yencha
Working Paper No. 15-18
This paper can be found at the College of Business and Economics Working Paper Series homepage:
http://be.wvu.edu/phd_economics/working-papers.htm

The Political Economy of the Essential Air Service Program
Joshua Hall* Associate Professor of Economics
West Virginia University PO Box 6025
Morgantown, WV 26506 [email protected]
Amanda Ross
West Virginia University PO Box 6025
Morgantown, WV 26506 [email protected]
Christopher Yencha
West Virginia University PO Box 6025
Morgantown, WV 26506 [email protected]
Abstract
We find that congressional influences affect the amount of airport subsidies that a congressional district receives from the Essential Air Service (EAS) program. The EAS program was passed with the goal of helping to continue commercial air service to rural communities following the deregulation of the airline industry. Using subsidy data from 1998-2014, we find strong evidence that subsidies are higher in districts having congressional representation on the House Transportation Committee. Representation on the House Appropriations Committee is also associated with higher subsidies. Our empirical results, combined with news reports, are consistent with the EAS serving private as well as public interests.
Keywords: congressional dominance, deregulation, airports JEL Codes: D73, L93
* Corresponding author. The authors would like to acknowledge the helpful comments of E. Frank Stephenson, John Dove, Jamie Bologna, and session participants at the 2015 Public Choice Society meetings in San Antonio, TX.

1
The political economy of the Essential Air Service program
1 Introduction
The structure of the airline industry in the United States changed dramatically in 1978 with the
passage of the Airline Deregulation Act (ADA). The ADA ended almost all federal control over
fares, routes, and entry of airlines into the commercial passenger airline industry. Bundled with
this legislation was the Essential Air Service (EAS) program, which guaranteed that any
community that had received commercial passenger service before deregulation would continue
to maintain service in the years following deregulation (Ozcan 2014). The intent of the EAS
program was to provide continuity to communities that might have lost commercial service after
deregulation due to the ending of implicit cross-subsidies provided under pre-1978 regulation
(Cunningham and Eckard 1987; Wei and Grubesic 2015). Initially designed to operate for a
decade post-deregulation, the EAS program has been funded continuously by Congress since
1978 (Grubesic and Wei 2013). In addition to being an excellent example of the transitional
gains trap (Tullock 1975), the EAS program is also an example of the congressional dominance
model in action.1
The ability of members of Congress to impose their preferences on bureaus is known as
congressional dominance (Ryan 2014). The theoretical basis for the model is laid out by
Weingast and Moran (1983), who highlight several direct and indirect reasons why bureaus have
1 The transitional gains trap occurs when a government subsidy or regulation is put in place to benefit a particular group and those benefits become capitalized into asset prices. As a result, the current recipients are no better off from the program but will be harmed by its elimination. Two implications follow from the transitional gains trap that are relevant to the EAS program. First, subsidy recipients will be harmed by the loss of subsidies and thus will expend resources to ensure that they continue. Second, resources expended through the political process can bring new one-time benefits if subsidies are increased or new airports are added to the program.

2
an incentive to respond to Congress. First, Congress determines the budget of bureaus through a
competitive process. Bureaus that respond more effectively to the wishes of Congress will do
better in the budgetary process, other things being equal. Second, oversight of agencies by
congressional committees provides further opportunities for legislators to monitor and control
the activities of bureaus, either directly through legislation or indirectly through congressional
hearings. Third, Congress influences the activities of bureaus through the appointment process.
The political structure of the bureau system thus creates strong incentives for bureaus to be
responsive to the wishes of Congress, but especially the committees charged with overseeing it
or some of its activities (Ryan 2014).
The geographic nature of US political representation creates an institutional structure
wherein legislators need to provide benefits to their geographic constituencies. When the
political structure of the bureau system interacts with the institutional structure of geographically
based political districts, the result is geographically based benefits disproportionate to what
would be expected based on a public interest reading of the bureau’s activities. Given that the
disproportionate geographic benefits are the easiest part of the congressional dominance model
to test empirically, it is no surprise that studies looking at the role of congressional committees in
the allocation of bureau activities and resources are most prevalent. Prominent works in this
literature include Hunter and Nelson (1995), Alvarez and Saving (1997), Young et al. (2001),
Garrett and Sobel (2003), Garrett et al. (2006), Young and Sobel (2013), and Ryan (2014). As a
whole, these studies provide strong evidence that congressional committee oversight can be an
important mechanism through which politicians are able to secure political benefits, often at the
expense of the public interest.2 For example, Ryan (2014) looks at the distribution of the H1N1
2 Two exceptions to this are Sobel et al. (2007) and Beaulier et al. (2011). Both papers find no congressional committee influence following reforms, suggesting that in certain circumstances reform

3
flu vaccine by the Department of Health and Human Services (HHS). He shows that states with
majority-party members on congressional oversight committees of the HHS received a
disproportionate share of doses, while states with more at-risk citizens received at best an
average amount of the vaccine.
Our paper contributes to the congressional dominance literature by testing whether
congressional oversight plays an important role in the amount of funding a congressional district
receives through the EAS program. In addition, our work adds to research on the EAS by
transportation scholars. For example, Matisziw et al. (2012) compare actual activity under the
EAS program with a model designed to minimize the cost of hub access conditional on rural
communities having access to the commercial air system. They find that tremendous
opportunities exist to improve the efficiency of the EAS program given those goals. Similarly,
Grubesic and Wei (2012) use Data Envelopment Analysis to estimate a production frontier for
service provision at the community level and find large inefficiencies.3 While these studies help
identify inefficiencies, they lend little insight into the institutional sources of said inefficiencies.
The experience of successful institutional reforms such as the Base Realignment and Closure
(BRAC) Act demonstrates the need for a strong understanding of how political incentives
interact with the institutional structure to produce the current status quo. Representative Dick
may be able to minimize the power of committee oversight. Sobel et al. (2007) find that political influence over FEMA by members of FEMA oversight committees was eliminated through the introduction of additional layers of bureaucracy. Beaulier et al. (2011) show that the Base Realignment and Closure Act seems to eliminate political influence by Congressional committees overseeing the armed services by bundling together all closures into one up or down vote. 3 Other studies of the EAS focus primarily on the effects on local communities. Warren (2008) uses a matching methodology combined with a difference-in-differences approach to evaluate the impact of the EAS program on local economies and finds that the EAS program is positively related to county income, employment, and population. Grubesic and Matisziw (2011) argue that other Federal Aviation Administration programs seem to make the EAS program redundant when it comes to improving economic performance.

4
Armey and Senator Phil Gramm, due to their experience in Congress and background as
economists, were able successfully to identify and reform the institutional structures that had
blocked all pre-BRAC attempts to close or align military bases (Beaulier et al. 2011).
To test for congressional influence on the allocation of funds to rural communities, we
utilize subsidy data by congressional district for two-year periods from 1998 to 2014. We find
strong evidence that subsidies are larger in districts having congressional representation on the
House Transportation and Ways and Means Committees. Our results are robust to the inclusion
of numerous variables controlling for factors that are consistent with a public interest view, such
as population density, median household income, or distance to the nearest hub. In addition, our
results do not change when we limit our sample to more rural districts nor when we change our
unit of observation to the airport. In addition to our empirical results being consistent with the
congressional dominance model, they provide a better understanding of the geographic
distribution of EAS expenditures and insight into why the program has remained in place long
after its original expiration date.
2 The EAS program and political influence
The EAS program was conceived as part of the ADA of 1978 to ensure that rural airports would
maintain uninterrupted commercial passenger service after the deregulation of the airline
industry. Under the requirements of the EAS program and the Department of Transportation’s
(DOT) mandate, the DOT is responsible for doling out subsidy packages to communities eligible
to receive assistance. In 2014, the DOT provided subsidies to about 160 communities in the
United States, 115 of which are in the lower 48 states, that would otherwise be unable to attract
airlines to provide regular commercial passenger air service. As the purpose of the EAS program

5
is to ensure that rural communities continue to be connected to the nation’s air transportation
network, the program guarantees regular service from the airport to a nearby medium or large
hub (U.S. Department of Transportation 2015).
The EAS program was originally set to expire ten years after the passage of the ADA;
however, the program has been renewed many times since its inception and continues to operate
today. The intention of the program was for the subsidies to act as temporary aid for
communities lacking commercial passenger air service until they developed the resources to
attract airlines without federal assistance (Warren 2008). In practice, the number of airports
being subsidized since the 1990s has increased considerably, as demonstrated in Figure 1.
Combined with the fact that subsidy rates per community are increasing and graduation rates
from the program are quite low, it seems as though the EAS program is generally not achieving
its stated public interest goal of helping rural airports become more competitive.
Insert Figure 1 Here
Even though EAS subsidies rarely seem to help rural airports become more competitive,
subsidized air service may still be crucial for local economies to attract businesses. While it has
been argued that commercial passenger service is essential to rural communities, patronage rates
are so low at airports in some rural communities that subsidy amounts can exceed hundreds of
dollars per passenger (Lowell et al. 2011). Such low patronage rates, in part, indicate that
subsidy packages at these airports may be trying to satisfy a demand for commercial passenger
service that simply does not exist. This potential waste of federal funds is exacerbated by the
way that the EAS program pays out subsidies per seat, regardless of whether or not the seat is
filled. To combat the potential for subsidizing inefficient routes, Congress instituted rules that
threaten to pull subsidies from those communities unable to keep per-passenger subsidy rates

6
below a certain threshold. Over the lifetime of this program, Congress has continually refined the
requirements that eligible communities must satisfy. The penalties associated with these rules
have led airports occasionally to find unproductive means of meeting the subsidy requirements in
order to continue to receive funding from the EAS program.4
Although the value of providing subsidies to rural communities for maintaining
commercial air service is questionable, especially within the contiguous United States, as other
modes of transportation could perform the same function without subsidies,5 it is easy to imagine
that ensuring or protecting subsidies to these communities would be a politically popular move.
In fact, members of Congress sometimes refer in press releases of speeches to the efforts they
have made to protect communities from being dropped from the program (WVNSTV 2011). For
example, on September 27, 2014, Senator Bob Casey and Representative Glenn Thompson
announced that Bradford Regional Airport in northwestern Pennsylvania had been granted a
yearlong waiver of eligibility requirements (Schellhammer 2014).
In many of these cases, the communities protected effectively by their representatives are
struggling to meet or already are in violation of the requirements to receive subsidies. According
to the criteria established under the EAS Act, airports that serve fewer than ten passengers per
day, have per-passenger subsidies exceeding $1,000, or are located within a specified driving
distance of a medium or large hub are ineligible for funding (U.S. Department of Transportation
2015). Though these requirements usually bind, airports from time to time are granted temporary
4 For instance, Morgantown Municipal Airport (MGW) in West Virginia, with help from the City of Morgantown, offered free flights to Wheeling, WV, in November 2014 to meet the annual passenger requirement of the EAS program (McCloud 2014). However, the airline with which MGW contracted subsidized service is allowed only to serve the route between Morgantown and the nearest hub in Washington, D.C. 5 See Lowell et al. (2011) for a case study from the coach bus industry about efficiency differences between subsidized air service and private bus service.

7
exception to the rules in order to fix the violation. For example, McKellar-Sipes Regional
Airport in Jackson, Tennessee, was set to lose its EAS status as the airport was averaging fewer
than eight passengers a day. The airport recently was granted a two-year waiver to try to get its
passenger numbers up, for which the airport director thanked the area’s elected officials for their
assistance (Thomas 2014). Bradford Regional Airport, which was mentioned earlier, was one of
12 airports on the chopping block in 2014 receiving waivers despite being in violation of DOT
requirements. In both of these cases, the waivers were touted as victories for the local member of
Congress.
Over the last decade, many changes have been made to the requirements of the EAS
program. The Century of Aviation Reauthorization Act of 2003 is responsible for reauthorizing
the EAS program for another four years, while also increasing drastically the amount of funding
appropriated to the Department of Transportation. The FAA Reauthorization Act of 2007
extended the EAS program for four years and included a stipulation that subsidies will be capped
at $200 per passenger, with an exception for airports very far from a hub. The Airport and
Airway Extension Act of 2011 terminated airports that were receiving more than $1,000 per
passenger regardless of distance to the nearest hub.
Congress passed the FAA Modernization and Reform Act of 2012. That law effectively
eliminated new entry into the EAS program by communities in the contiguous US states and
threatened permanent termination of current communities' subsidy packages should they violate
any previously stated rules. The new legislation changed the structure under which legislators are
likely to bargain for subsidies, because legislators that represent communities with airports not
currently receiving subsidies are no longer able to compete for them.

8
3 Empirical approach
We estimate the effect of a congressional district representative’s committee assignments on the
subsidy amount that a community receives through the EAS program. While the actual bidding
over the amount of the subsidy package takes place between eligible communities, the DOT, and
prospective airlines, legislators still maintain the power to shape the rules under which those
parties bargain, as the bargaining occurs in the shadow of future budgetary allocations and
committee assignments. Given the evolving regulatory environment that has attended the EAS
program’s renewal over the last two decades, it is not implausible to expect that these rules may
have been altered strategically to benefit the communities that the rule makers in Congress
represent. To this end, we consider a number of variables, such as committee membership and
various leadership roles that are likely to be correlated with the influence that individual
legislators exercise.
To estimate the effect of a congressional representative’s characteristics on the amounts
of subsidies received by his or her constituents, we estimate an equation of the following form:
,
where is the dollar amount of the subsidy allocated to district i during congressional
term t; is a vector of fixed effects for congressional terms to control for period-specific effects
and is the idiosyncratic error term.
The vector of is the collection of representatives’ characteristics of
interest, indexed by congressional district, i, and congressional term, t. We look at several
characteristics of a member of Congress that may affect how much money his or her district
receives from the EAS program. This includes membership on four key committees:
Transportation, Appropriations, Ways and Means, and Rules. Transportation is highly relevant

9
as this committee handles the renewal of the EAS subsidy program. Appropriations, Ways and
Means, and Rules are three key committees in the House of Representatives: the first two make
recommendations on the distribution of federal spending and tax policy matters; Rules
establishes the terms of debate before any legislation can go to the floor of the House.6 While the
influence of the latter three committees on the EAS program is less direct than that of the
Transportation committee, we feel it is important not to limit ourselves to Transportation a
priori. We use membership on these three committees because (1) Appropriations, Ways and
Means, and Rules are among the most powerful committees in the House with broad control over
all legislative matters and (2) representation on those committees has been found to significantly
affect various outcome in similar studies (Krehbiel et al. 1987, Alvarez & Saving 1997, Garret et
al. 2006) We also consider other variables that may be appropriate for measuring the relative
power of representatives, including seniority on the committee, holding another House
leadership position, being in the majority party, or being affiliated with the same party as the
president.
In addition to the basic congressional dominance regression above, we also include
specifications that control for district-level characteristics that might influence EAS funding and
would be more in line with the intent of the program. For example, more densely populated
congressional districts will find it easier to support an airport without subsidies (or with less
subsidization). Similarly, richer congressional districts are less likely to require subsidies and
thus we expect median household income to be negatively related to subsidy amounts, ceteris
6 The EAS is funded out of the FAA’s Airport and Airway Trust Fund (AATF). Revenues deposited into this fund are obtained from aviation-related excise taxes on cargo, fuel and passengers (Federal Aviation Administration 2015). The AATF therefore falls under the purview of the Ways and Means Committee and we expect the Ways and Means Committee to be more politically important for the EAS than the Appropriation or Rules Committee.

10
paribus. We also include the percentage of individuals in poverty and the district population’s
median age. By entering those economic and demographic variables in addition to our
congressional influence variables, we are following in the footsteps of seminal papers by Faith et
al. (1982), Altrogge and Shughart (1984), Congleton and Shughart (1990), and Young et al.
(2001).
For the basic model, we examine the outcome during the same year that the legislator
served in the House, as well as the subsidy two years beforehand. Because we are interested in
how the amount of the EAS subsidy changes depending upon the role played by a community’s
congressional representative, it is necessary to consider the possible lag between when
legislation is enacted and when communities may effectively internalize these new rules. We use
a two-year difference to account for the fact that programmatic changes may not influence the
current subsidy but the subsidy two years later.
4 Data
Throughout our analysis, we consider only the contiguous 48 states. Even though Alaska boasts
the most subsidized commercial airports of any state within the EAS program, the rules under
which airports in that state apply for subsidies are looser than in the contiguous United States.7 In
addition, the average subsidy to a community in Alaska is far less than that to an airport in the
lower forty-eight states. Furthermore, given that for numerous areas in Alaska air travel is the
only mode of transportation, the reliance on air transportation is not comparable to rural areas in
the lower 48 states. For these reasons, it would be erroneous to treat the outcomes for
7 Asking why the rules are less stringent for Alaska may be an interesting political economy question in and of itself, but is beyond the scope of the present article.

11
communities in Alaska the same as those elsewhere in United States. We also exclude
communities in Hawaii and Puerto Rico from our sample for similar reasons: they are not held to
the same standards as those in the contiguous states when requesting subsidies from the DOT.8
Data for the values of subsidies received by each subsidized community were retrieved
from the US Department of Transportation’s website and from DOT dockets ordering changes to
or renewals of service for commercial air carriers to the benefitting communities. Figure 2
illustrates changes in subsidy volumes given to the states in the contiguous United States over
the sample period at an annual frequency; the dotted lines indicate the timing of important EAS
program policy revisions. Since 1998, total subsidy amounts have been on the rise (Warren
2008).
As evidenced in Figure 2, average subsidies received by each EAS community have
increased every year except for the period right after 2003. While the majority of funding for the
EAS program comes from the AATF, additional monies sometimes are appropriated. For
example, the Century of Aviation Reauthorization Act of 2003 increased budgetary allocations to
EAS from $15 million to $77 million. Following this budget expansion, communities were added
to the program at a rate unseen during any other period of the sample. As can be seen in Table 1,
which presents summary statistics of our subvention data, the number of communities subsidized
under the EAS program has risen dramatically. Besides this break from trend, the change in
average subsidy that a community receives in any given year follows a pattern similar to the
growth in the total EAS subsidies.9
8 Communities in Alaska, Hawaii, and Puerto Rico are exempt from legislation dictating that communities must average ten passengers per day in order to remain eligible for subsidies from the EAS program, for instance. 9 Revenues to the AATF from excise taxes have risen nearly 40% since FY 2000, according to the Federal Aviation Administration (2015). While beyond the scope of our paper, explaining the more generous

12
Insert Figure 2 Here
Insert Table 1 Here
To gain a better understanding of where communities benefitting from the EAS program
are located geographically, Figure 3 shows every US county that received EAS subsidies at some
point between 1998 and 2014. Similarly, Figure 4 indicates all of the counties to which subsidies
were paid in 2014 alone, with color gradients representing the subsidies that each community
received over the course of the year. In comparing Figures 3 and 4, it is interesting to note the
relative permanence of EAS subsidies in the eastern half of the United States versus the western
half. A reasonable prior is that the western half of the country, with generally greater distances
between cities, would require more subsidies to provide commercial air service to rural
communities, but the data do not reflect this.
Insert Figure 3 Here
Insert Figure 4 Here
Our sample of subsidies covers years from 1998 to 2014. The sample begins in 1998
because this is the first year that Congress was required to fund the EAS program. In addition,
1998 marks the year that the Essential Air Service program would have ended had it not been
extended by the Federal Aviation Administration Reauthorization Act of 1996. The two-year gap
between 1996 and 1998 ensures that communities had ample time to adjust to the new subsidy
allocation regime in their biennial requests for funds.
To answer the question of how subsidy amounts to a community are affected by the
characteristics of its congressional representatives, information on committee membership,
among other data such as leadership roles and length of time in Congress, is crucial. In
funding of EAS airports relative to other possible budgetary priorities, such as expanding facilities and equipment at major airports, would be a fruitful avenue for future research.

13
particular, we use public domain data about congressional representation compiled from various
sources, such as GovTrack.us and the Congressional Biographical Directory, in combination
with Stewart and Woon’s (2011) excellent dataset on historical standing congressional
committees for the period of our sample.10 Our data on demographics and characteristics of
congressional districts were obtained from the U.S. Census Bureau and distance to the nearest
hub airport was calculated by the authors using Google Maps.
5 Results
We first examine the effect of a representative’s characteristics on the amount of subsidy that his
her constituents receive through the EAS program. These results are presented in Tables 2 and 3,
where Table 2 estimates the value of the subsidy package for the same year a House member
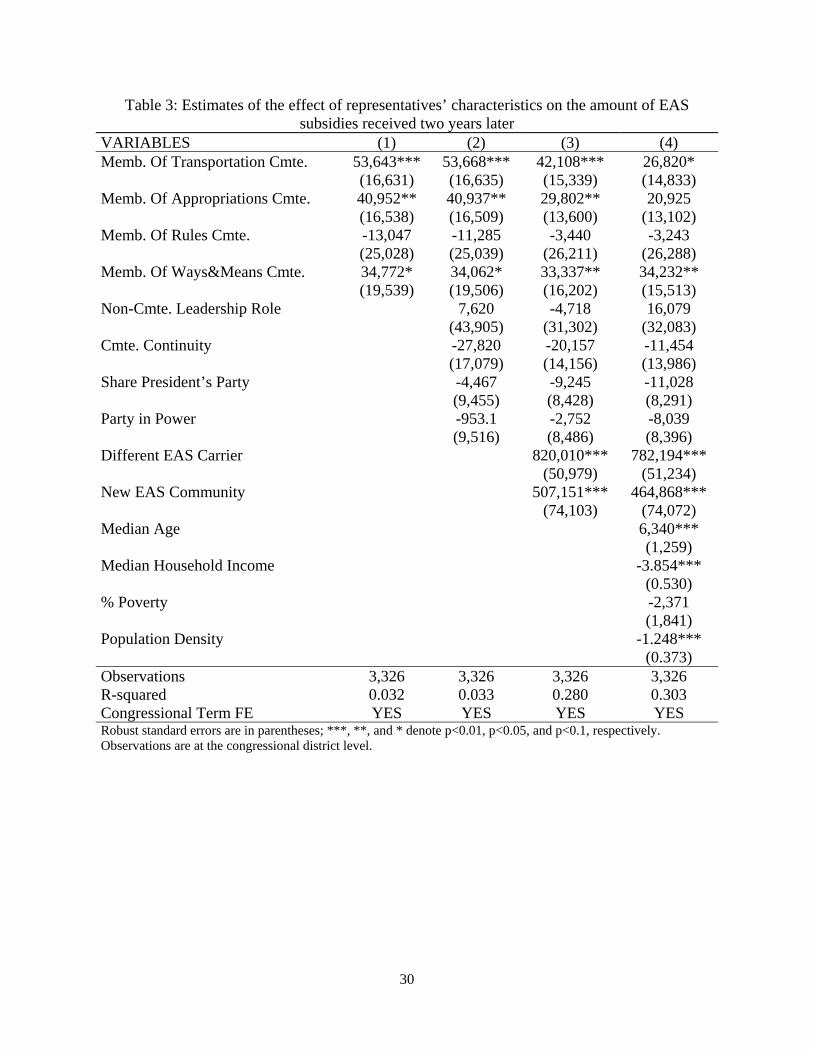
represents the district and Table 3 is based on a two-year lead.11 This two-year lead allows for
the possibility that programmatic changes may not take effect immediately.12
Insert Table 2 Here
10 Congressional representation data were retrieved from https://github.com/unitedstates/congress-legislators/, while congressional committee membership was found at http://web.mit.edu/17.251/www/data_page.html#0. 11 For robustness, we also estimated our results by Tobit due to the censoring of subsidies at zero. Doing so results in very similar results in terms of statistical significance, although the rules committee is statistically significant in some regressions and district-level economic variables are not statistically significant. To take into account that less than 10 percent of Congressional districts contain multiple airports and distance to the nearest hub, we also re-estimated Tables 2-4 using subsidies per district airport as the dependent variable and average distance to hub as an explanatory variable. The results were quantitatively and qualitatively similar to the results presented in the paper. 12 In unreported regressions, we include the subsidy during the previous period as an explanatory variable to account for persistence in EAS contracts. For example, a district whose member is on the Ways and Means Committee is replaced. The effect on the level of subsidy is unlikely to be immediate. While the subsidy the previous period is statistically significant, it does not quantitatively or qualitatively change our findings for committee representation.

14
Looking first at column (1) in Table 2, in which only committee assignments are entered,
we find that membership on the Transportation, Appropriations, and Ways and Means
committees is associated with larger subsidies for communities whose representatives had seats
on those committees. The marginal effect of committee membership is greatest for membership
on the Transportation Committee, followed by Ways and Means and then Appropriations. Our
results in column (1) suggest that being a member of the Transportation Committee is worth over
$50,000 per biennium. In columns (2) and (3), we expand upon committee assignments to see
what other political and airport characteristics may affect EAS subsidy amounts. In column (2),
we add additional measures of US House member characteristics. We include an indicator
variable equaling one if the representative was in a powerful leadership position: majority or
minority party leader, Speaker of the House, or majority or minority whip. We also include a
committee continuity variable, i.e., how long the representative had been a member of one of the
four committees, to approximate whether legislative seniority has influence on the process. We
also include indicators for whether the representative is in the same party as the president and for
whether the representative’s party has won a majority of the seats in the House. None of these
measures are statistically significant, but membership on Transportation, Appropriations, or
Ways and Means continues to be correlated with larger EAS subsidies for constituencies so
represented, although the marginal effect of subsidy per district is reduced.13
13 It may be surprising to some that a House leadership position is not associated with larger EAS subsidies. When we looked at the identities of holders of congressional leadership positions over our sample period, we found that the majority of individuals did not represent EAS-eligible districts. Of the 20 individuals who occupied leadership positions, only six represented communities that were EAS eligible when the program was created. Of those six individuals, three represented districts did not receive subsidies under the EAS program, likely because while the districts may have been eligible when the EAS program was implemented, the area is unlikely to have met the criteria afterwards. For example, Congressman Brady represents part of Philadelphia, which was not an airport hub in the 1970s, but currently is one and, hence, no longer is eligible for the program. Similar considerations and effects are present when we look at committee chairs. We therefore believe that that variable is insignificant because

15
In column (3), we include indicator variables to account for salient characteristics of the
EAS routes within each congressional district. We include an indicator for whether the carrier
operating on an existing EAS-subsidized route changed since the previous Congress. During the
sample period, passenger air service utilization declined and fuel prices increased sharply. It is
crucial to control for changes in funding to communities whose carriers became unable to
continue service at current subsidized rates for cost reasons – not doing so would over-attribute
larger subsidy allotments to the political process. In addition, we include a dummy for whether
the community received subsidies during the current congressional term but did not receive them
in the last biennium. It is important to control for the magnitude of funding increases for
communities that already had EAS subsidized routes and those that did not. The results in
column (3) support the hypothesis that not including such indicators biased the coefficients of
key committee membership upwards, but we find that including those variables did not eliminate
the influence of the four congressional committees on EAS funding to incumbent airports.
Finally, in column (4), we include a variety of characteristics of the congressional district
that could affect the distribution of resources – median population age, median household
income, percentage of the population below the poverty line, and population density. When we
include these variables, we still find that membership on the Transportation and Ways and
Means committees has a strong, positive influence on the amount of subsidy received. This is
not unexpected as the Transportation Committee handles FAA reauthorization and the Ways and
Means Committee is responsible for levying the federal excise taxes that fund the AATF and,
hence, large fractions of the EAS program. However, we no longer find that membership on
the subsidies no longer are substantially important to the districts of those individuals who occupy these leadership positions, and thus these individuals do not push to receive these resources.

16
Appropriations has a statistically significant effect on the amount of EAS subsidy received once
these other explanatory variables are included.
Table 3 follows the same structure as Table 2, but uses the same explanatory variables to
predict the subsidy amount two years later. The reason for investigating this is to allow airports
to adapt to new EAS rules and larger total subsidies. The results with respect to committee
membership in Table 3 follow the results in Table 2.14 Controls for changes in air carriers to
recipient airports and new EAS routes remain important. Other measures of leadership,
committee continuity, and party status still do not affect the size the subsidy package allocated to
benefitting congressional districts. The inclusion of non-congressional and airport variables in
Column 4 affects the magnitude of the effect of being on the Transportation Committee but does
not affect its statistical significance. As in Table 2, entering these additional explanatory
variables relegates the Appropriations Committee to statistical insignificance, while
strengthening our finding regarding the Ways and Means Committee.
Insert Table 3 Here
6 Robustness checks
As shown in Figures 3 and 4, the EAS-subsidized airports largely are located in rural
communities. Congressional districts that are more urban but EAS-eligible should be less likely
to need subsidies for economic reasons. In Table 4, we examine how the coefficients change
when the sample excludes predominantly urban districts. If EAS subsidy amounts decline as our
sample becomes more rural, that finding would suggest that it is actually the rural nature of
14 In the interests of space, we do not report results using the two-year-ahead subsidy amount for all our robustness checks in the paper. Those results, however, are quantitatively similar to those reported using the current period subsidy.

17
congressional districts that is driving our estimates over the full sample. Conversely, if the
subsidies rise as our sample becomes less urban, the implication is that committee membership is
important to the amounts of subsidy received, conditional on having other economically relevant
factors, such as being rural and poor. Because the stated intent of the EAS program was to assist
rural communities in maintaining commercial air service following deregulation of the
commercial airline industry, we expect congressional representation to weigh more heavily on
subsidy allocations if the House member represents a district with a large rural population.
Insert Table 4 Here
Column (1) in Table 4 is the same unrestricted estimates represented in the full
specification in Table 2 for comparison purposes. Beginning with column (2) we progressively
restrict the sample on the basis of the percentage of populations living in rural areas until we
reach districts that are more than 40% rural in column (6).15 In the table, as we move from left to
right, we see that the more rural a district is, the larger in magnitude are the coefficients on the
effects of representation on the Transportation and Ways and Means committees. The results
suggest that members of Congress from rural communities, whose constituents stand to gain the
most from the EAS program, may be actively seeking seats on committees having influence over
the distribution of subsidies.
Thus far, we have conducted our analysis using the congressional district as the unit of
observation. The airport, not the congressional district, might be the relevant unit of observation
since it is airports that receive the funding. Moving to the airport as the unit of observation has
15 We end our analysis here as our sample size is sufficiently small that we have power issues when estimating our coefficients. Entering % Rural in column (1) of Table 4 leaves our findings unchanged, but does not show the rising magnitude of the effect of being a member of the Transportation and Ways and Means Committees as the sample becomes ever more rural.

18
the additional advantage of being able to precisely control for distance to the nearest hub.16 This
is important because that distance is one of the most important geographic factors in determining
eligibility for EAS funding (Tang 2014). In Table 5 we reproduce the analysis of Table 4, but use
the airport as the unit of observation and its distance to the nearest hub.17
Insert Table 5 Here
The full sample of EAS-eligible airports is included in Column (1) of Table 5. While
distance to the nearest hub has the expected positive sign and is statistically significant at the 1%
level, it does not affect our findings regarding the importance of membership on the
Transportation and Ways and Means Committees. Both variables remain positive and
statistically significant at the 5% level or higher. As was the case in Table 4, the estimated
coefficient increases in size as we progressively restrict the sample to ever more rural districts in
columns (2) through (6). The remainder of our results, including the absence of a relationship
between party power variables and EAS subsidy levels, is approximately the same as in all of our
other regressions.
7 Conclusions and future research
We examine the influence that a member of the House of Representatives may have on the
amount of the subsidy that his or her district can expect to receive from the Essential Air Service
program. Persistent across all model specifications is the apparent importance of seats on the
legislative committees most relevant to the evolution of the Essential Air Service program: the
Transportation and Ways and Means Committees. While unable to affect the value of subsidies
16 It is more complicated to control for distance to the nearest hub in the congressional district regressions since several districts contain more than one EAS-eligible airport. 17 All non-airport, non-political variables are observed at the county level.

19
that his district receives from the program directly, a representative who sits on relevant
committees can shape the environment within which prospective benefitting constituents bargain
for subsidies with new legislation.
Further work on this topic will look to expand the time span of the sample. The period
before 1998 is very different from the sample period as policy changes were far fewer. In
addition, the drastic policy change to the EAS in 2012 is sure to yield interesting stories as soon
as enough time has passed to explore its impact. No longer able to re-enter the EAS program,
currently funded airports will have to be very careful to maintain reasonably strong
congressional support to continue to receive subsidies. Owing to the prospect of being dropped
from the program, airports and their surrounding communities will rely more heavily on their
congressional representatives to protect their subsidies.
We provide anecdotal evidence that members of Congress can effectively persuade the
US Department of Transportation to selectively waive requirements of airport patronage rates
and distance-to-hub rules. The real danger is that after 2012, representatives on key oversight
committees no longer need worry about competition from their peers and can focus efforts on
influencing subsidy levels. The 2012 changes to the EAS program block new airports from
applying for subsidies; that policy change by itself would lead to reductions in total program
budgetary appropriations. On the other hand, as the representatives of districts in which
currently participating airports run into financial trouble compete to protect their constituents,
average funding may rise to allow the airports to continue to operate. One institutional change
that prevents the EAS program from expanding without bound would be to limit the DOT’s
discretion to waive subsidy-eligibility rules regarding distances from airport hubs and passenger
load factors. The congressional dominance model of bureaucracy suggests that legislators

20
nevertheless will intervene to control the waiver process whenever it is in their political self-
interest to do so.
Acknowledgements
The authors would like to acknowledge helpful comments of E. Frank Stephenson, John Dove,
Jamie Bologna, and session participants at the 2015 Public Choice Society meetings in San
Antonio, TX.

21
References
Altrogge, P., and Shughart, W. F. II. 1984. The regressive nature of civil penalties. International Review of Law and Economics 4(1): 55-66. Alvarez, R. M., and Saving, J. L. 1997. Congressional committees and the political economy of federal outlays. Public Choice 92(1-2): 55-73. Beaulier, S. A., Hall, J.C., and Lynch, A. K. 2011. The impact of political factors on military base closures. Journal of Economic Policy Reform 14(4): 333-42. Congleton, R. D., and Shughart, W. F. II. 1990. The growth of social security: electoral push or political pull?. Economic Inquiry 28(1): 109-132. Cunningham, L. F., and Eckard, E. W. 1987. US small community air service subsidies: essential or superfluous?. Journal of Transport Economics and Policy 21(3): 255-77. Faith, R. L., Leavens, D. R., and Tollison, R. D. 1982. Antitrust pork barrel. Journal of Law and Economics 25(2): 329-42. Federal Aviation Administration. 2015. Airport and Airway Trust Fund (AATF) fact sheet. Available at: https://www.faa.gov/about/office_org/headquarters_offices/apl/aatf/media/AATF_Fact_Sheet.pdf. Accessed 19 May 2015. Garrett, T.A., Marsh, T. L., and Marshall, M.I. 2006. Political allocation of U.S. agricultural disaster payments in the 1990s. International Review of Law and Economics 26(2): 143-61. Garrett, T., and Sobel, R. 2003. The political economy of FEMA disaster payments. Economic Inquiry 41(3): 496-509. Grubesic, T.H. and Matisziw T.C. 2011. A spatial analysis of air transport access and the Essential Air Service program in the United States. Journal of Transport Geography 19: 93-105. Grubesic, T. H., and Wei, F. 2012. Evaluating the efficiency of the Essential Air Service program in the United States. Transportation Research Part A: Policy and Practice 46(10): 1562-73. Grubesic, T. H., and Wei, F. 2013. Essential air service: a local, geographic market perspective. Journal of Transport Geography 30, 17-25. Hunter, W. J., and Nelson, M.A. 1995. Tax enforcement: a public choice perspective. Public Choice 82(1/2): 53-67. Krehbiel, K., Shepsle, K. A., and Weingast, B. R. 1987. Why are congressional committees powerful?. American Political Science Review 81(3), 929-945.

22
Lowell, D., Curry, T., Hoffman-Andrews, L., and Reynolds, L. 2011. Comparison of Essential Air Service program to alternative coach bus service: keeping rural communities connected. M.J. Bradley and Associated Research Paper. Matisziw, T. C., Lee, C.L., and Grubesic, T.H. 2012. An analysis of Essential Air Service structure and performance. Journal of Air Transport Management 18(1): 5-11. McCloud, C. 2014. Morgantown airport giving free plane rides to Wheeling, WV. The State Journal, 14 November. Ozcan, I. C. 2014. Economic contribution of Essential Air Service flights on small and remote communities. Journal of Air Transport Management 34: 24-29. Ryan, M. E. 2014. Allocating infection: the political economy of the Swine Flu (H1N1) vaccine. Economic Inquiry 52(1): 138-54. Schellhammer, M. 2014. Bradford Airport granted waiver. The Bradford Era, 27 September. Sobel, R. S., Coyne, C. J., and Leeson, P. T. 2007. The political economy of FEMA: did reorganization matter?. Journal of Public Finance and Public Choice 25(2-3): 49–65. Stewart, C. III and Woon, J. 2011. Congressional Committee Assignments, 103rd to 112th Congresses, 1993--2011: House of Representatives. Tang, R.Y. 2014. Essential Air Service (EAS): Frequently Asked Questions. Congressional Research Service, Washington, DC. Thomas, D. 2014. Airport granted two-year waiver for Essential Air Service. Jackson Sun, 27 September. Tullock, G. 1975. The transitional gains trap. Bell Journal of Economics 6(2): 671-678. U.S. Department of Transportation. 2015. Essential Air Service. Available at: http://www.transportation.gov/policy/aviation-policy/small-community-rural-air-service/essential-air-service. Accessed 19 May 2015. Warren, D. E., 2008. The regional economic effects of commercial passenger air service at small airports. University of Illinois at Urbana-Champaign, Dissertation. Wei, F. and Grubesic, T. 2015. A typology of rural airports in the United States: evaluating network accessibility. Review of Regional Studies 45(1): 57-85. Weingast, B. R., and Moran. M. J. 1983. Bureaucracy discretion or congressional control? regulatory policy-making by the Federal Trade Commission. Journal of Political Economy 91(5): 765-800.

23
WVNSTV. 2011. Sen. Rockefeller works to protect essential services in W.Va. Available at: http://www.wvnstv.com/story/16075734/sen-rockefeller-works-to-protect-essential-services-in-wva?clienttype=generic&mobilecgbypass. Accessed 19 May 2015. Young, M., Reksulak, M., and Shughart, W. F. II. 2001. The political economy of the IRS. Economics and Politics 13(2): 201-20. Young, A.T., and Sobel, R. S. 2011. Recovery and Reinvestment Act spending at the state level: Keynesian stimulus or distributive politics?. Public Choice 155(3-4): 449-68.

24
Source: US Department of Transportation
0
20
40
60
80
100
120
140
1998 1999 2000 2001 2002 2003 2004 2005 2006 2007 2008 2009 2010 2011 2012 2013 2014
Figure 1: Number of EAS Subsidized Airports in the Contiguous United States

25
Figure 2: Plots of subsidy allotments to communities in the contiguous United States over the sample period of 1998-2014 (with major legislative changes to the Essential Air Service program indicated by dotted lines).

26
Figure 3: Map of the 150 EAS subsidy recipient counties in the sample (darkened), 1998 to 2014.

27
Figure 4: Map of EAS subsidy recipient counties in November 2014 (decile gradient with cooler colors indicating smaller annual subsidy packages and hotter colors indicating larger annual subsidy packages).

28
Table 1: Summary statistics: total EAS subsidies, by year
Year # Total Mean Std. Dev. Min Max
1998 71 $41,077,615 $594,836 $270,359 $161,902 $1,337,230 1999 72 $43,143,509 $602,930 $254,423 $158,417 $1,308,444 2000 74 $44,130,242 $580,131 $258,859 $102,508 $1,265,265 2001 74 $47,619,905 $614,275 $219,706 $99,752 $1,247,097 2002 78 $55,514,311 $669,713 $238,323 $98,162 $1,227,218 2003 81 $70,463,785 $797,510 $387,694 $269,358 $2,509,679 2004 90 $78,984,252 $778,608 $340,873 $262,512 $2,445,897 2005 100 $83,698,589 $716,905 $280,126 $248,182 $1,596,667 2006 107 $89,238,768 $696,075 $260,546 $240,326 $1,546,128 2007 111 $95,940,637 $703,045 $270,862 $198,686 $1,394,134 2008 102 $95,255,400 $722,820 $249,764 $191,272 $1,494,408 2009 101 $129,711,996 $997,883 $366,439 $235,862 $2,054,068 2010 105 $150,042,243 $1,091,736 $346,750 $330,045 $2,019,701 2011 107 $162,997,195 $1,128,794 $374,710 $316,968 $2,284,061 2012 116 $195,746,024 $1,225,100 $388,703 $255,594 $2,212,828 2013 117 $221,037,673 $1,350,786 $472,615 $251,722 $2,782,905 2014 115 $237,304,678 $1,471,044 $549,468 $241,162 $3,316,321
Values are in 1999 constant US dollars. Bolded text indicates a year during which major policy legislation was passed.

29
Table 2: Estimates of the effect of representative characteristics on the amount of subsidies received in the current biennium
VARIABLES (1) (2) (3) (4) Memb. Of Transportation Cmte. 51,478*** 51,125*** 42,104*** 30,294*** (13,624) (13,641) (12,186) (11,714) Memb. Of Appropriations Cmte. 29,325** 29,264** 21,185** 14,659 (13,221) (13,212) (10,776) (10,312) Memb. Of Rules Cmte. 6,967 7,607 8,805 8,775 (24,249) (24,420) (20,259) (20,506) Memb. Of Ways&Means Cmte. 28,123* 27,946* 25,140* 25,919** (15,785) (15,767) (13,514) (12,999) Non-Cmte. Leadership Role -21,141 -22,260 -7,000 (26,205) (24,788) (25,498) Cmte. Continuity -14,069 -6,312 497.7 (13,388) (10,878) (10,725) Share President’s Party -2,942 -4,863 -6,308 (8,004) (6,704) (6,628) Party in Power -1,423 -470.8 -4,671 (8,069) (6,772) (6,704) Different EAS Carrier 752,420*** 723,471*** (36,678) (36,930) New EAS Community 196,936*** 164,946*** (48,944) (50,427) Median Age 4,440*** (1,042) Median Household Income -3.052*** (0.426) % Poverty -2,140 (1,397) Population Density -1.018*** (0.276) Observations 3,326 3,326 3,326 3,326 R-squared 0.023 0.023 0.295 0.316 Congressional Term FE YES YES YES YES Robust standard errors are in parentheses; ***, **, and * denote p<0.01, p<0.05, and p<0.1, respectively. Observations are at the congressional district level.
30
Table 3: Estimates of the effect of representatives’ characteristics on the amount of EAS subsidies received two years later
VARIABLES (1) (2) (3) (4) Memb. Of Transportation Cmte. 53,643*** 53,668*** 42,108*** 26,820* (16,631) (16,635) (15,339) (14,833) Memb. Of Appropriations Cmte. 40,952** 40,937** 29,802** 20,925 (16,538) (16,509) (13,600) (13,102) Memb. Of Rules Cmte. -13,047 -11,285 -3,440 -3,243 (25,028) (25,039) (26,211) (26,288) Memb. Of Ways&Means Cmte. 34,772* 34,062* 33,337** 34,232** (19,539) (19,506) (16,202) (15,513) Non-Cmte. Leadership Role 7,620 -4,718 16,079 (43,905) (31,302) (32,083) Cmte. Continuity -27,820 -20,157 -11,454 (17,079) (14,156) (13,986) Share President’s Party -4,467 -9,245 -11,028 (9,455) (8,428) (8,291) Party in Power -953.1 -2,752 -8,039 (9,516) (8,486) (8,396) Different EAS Carrier 820,010*** 782,194*** (50,979) (51,234) New EAS Community 507,151*** 464,868*** (74,103) (74,072) Median Age 6,340*** (1,259) Median Household Income -3.854*** (0.530) % Poverty -2,371 (1,841) Population Density -1.248*** (0.373) Observations 3,326 3,326 3,326 3,326 R-squared 0.032 0.033 0.280 0.303 Congressional Term FE YES YES YES YES Robust standard errors are in parentheses; ***, **, and * denote p<0.01, p<0.05, and p<0.1, respectively. Observations are at the congressional district level.

31
Table 4: Estimates of the effect of congressman characteristics on the amount of subsidies received in current biennium by percentage of the population that is located in a rural area
VARIABLES (1) (2) (3) (4) (5) (6) Memb. Of Transportation Cmte. 30,294*** 31,856** 38,467** 31,445 50,923* 83,555** (11,714) (12,711) (16,738) (19,236) (26,046) (36,426) Memb. Of Appropriations Cmte. 14,659 17,152 22,623 28,741 28,909 37,121 (10,312) (11,773) (15,060) (19,210) (25,480) (34,603) Memb. Of Rules Cmte. 8,775 8,745 86,399* 125,466* -24,044 -7,471 (20,506) (20,487) (47,819) (71,198) (70,785) (136,445) Memb. Of Ways&Means Cmte. 25,919** 32,730** 60,520*** 93,868*** 125,607*** 97,610** (12,999) (14,847) (22,830) (32,058) (40,836) (47,902) Non-Cmte. Leadership Role -7,000 -3,226 -4,289 -38,197 -72,228 -50,959 (25,498) (29,368) (41,433) (38,020) (66,449) (92,153) Cmte. Continuity 497.7 280.1 -5,630 -8,870 -16,928 -4,921 (10,725) (11,534) (16,297) (20,170) (26,977) (37,540) Share President’s Party -6,308 -8,066 -10,357 -6,496 -15,413 -30,640 (6,628) (7,453) (11,551) (14,833) (19,408) (25,250) Party in Power -4,671 -4,653 -9,460 -12,647 -14,691 -4,884 (6,704) (7,480) (11,631) (15,007) (19,571) (25,593) Different EAS Carrier 723,471*** 718,164*** 673,108*** 660,767*** 627,319*** 663,090*** (36,930) (36,903) (37,486) (40,683) (44,477) (52,159) New EAS Community 164,946*** 161,280*** 165,923*** 157,537*** 70,962 10,656 (50,427) (50,393) (53,672) (59,091) (54,582) (74,613) Median Age 4,440*** 4,141*** 5,534*** 11,744*** 19,086*** 18,920*** (1,042) (1,106) (1,511) (2,341) (3,343) (4,341) Median Household Income -3.052*** -2.835*** -3.089*** -5.941*** -10.39*** -8.383** (0.426) (0.470) (0.733) (1.573) (2.448) (3.497) % Poverty -2,140 -1,616 -3,260* -7,040*** -12,500*** -10,974*** (1,397) (1,476) (1,764) (2,334) (3,054) (3,639) Population Density -1.018*** -5.161*** -38.15*** -58.85* -110.3 -618.2*** (0.276) (1.574) (8.941) (32.26) (98.11) (143.9) Observations 3,326 2,979 1,957 1,482 1,034 680 R-squared 0.316 0.314 0.297 0.303 0.323 0.371 Congressional Term FE YES YES YES YES YES YES % Rural Any >0 >10 >20 >30 >40 Robust standard errors are in parentheses. ***, **, and * denote p<0.01, p<0.05, and p<0.1, respectively. Observations are at the congressional district level.

32
Table 5: Estimates of the effect of congressman characteristics on the amount of subsidies received in the current biennium using the airport as the unit of observation VARIABLES (1) (2) (3) (4) (5) (6) Memb. Of Transportation Cmte. 59,052*** 56,719*** 67,669*** 67,512*** 76,102*** 101,693*** (20,405) (20,959) (23,301) (25,139) (29,425) (38,677) Memb. Of Appropriations Cmte. 25,843 23,195 34,452 49,199* 26,840 37,951 (19,244) (20,094) (23,978) (26,012) (30,463) (44,791) Memb. Of Rules Cmte. 36,114 34,213 71,725 55,196 18,168 52,307 (57,129) (57,186) (79,007) (81,043) (88,253) (143,701) Memb. Of Ways&Means Cmte. 53,101** 57,419** 93,782*** 144,026*** 177,332*** 165,842** (25,315) (26,385) (34,593) (46,471) (51,120) (65,718) Non-Cmte. Leadership Role -91,500 -103,455 -108,162 -103,302 -110,731 -161,558 (74,830) (84,800) (84,184) (99,268) (103,738) (114,303) Cmte. Continuity -3,353 -4,858 -11,816 -11,316 -7,080 21,622 (18,968) (19,846) (24,023) (26,733) (32,132) (45,875) Share President’s Party -18,156 -19,903 -27,846 -22,928 -25,168 -39,539 (12,963) (13,561) (17,818) (19,858) (23,617) (31,996) Party in Power -16,087 -16,175 -13,320 -14,298 -21,983 -15,686 (13,156) (13,651) (17,990) (19,966) (23,569) (31,479) Different EAS Carrier 618,249*** 614,961*** 556,377*** 551,619*** 561,596*** 607,949*** (39,187) (39,207) (39,812) (42,795) (44,993) (47,567) New EAS Community 137,972*** 135,690*** 112,642** 89,402* 48,418 46,477 (49,394) (49,296) (51,094) (51,088) (50,566) (68,918) Median Age -2,691 -2,410 -3,026 97.92 478.5 -2,309 (2,084) (2,154) (2,522) (2,856) (3,183) (4,178) Median Household Income -6.779*** -6.779*** -7.557*** -7.906*** -6.956*** -4.824 (1.127) (1.229) (2.051) (2.251) (2.506) (4.274) % Poverty -11,019*** -10,715*** -11,172*** -9,229*** -9,442** -3,617 (2,587) (2,688) (3,173) (3,572) (3,988) (7,105) Population Density -0.614 -4.213 -48.86*** -68.24*** -59.51*** -169.6*** (0.490) (2.660) (9.386) (17.23) (20.66) (51.58) Distance to Nearest Hub 369.4*** 345.4*** 277.6** 352.6** 548.7*** 835.7*** (93.50) (101.8) (139.8) (157.1) (181.3) (270.6) Observations 1,715 1,658 1,292 1,115 888 571 R-squared 0.293 0.291 0.270 0.274 0.298 0.339 Congressional Term FE YES YES YES YES YES YES % Rural >0 >10 >20 >30 >40 Robust standard errors are in parentheses. ***, **, and * denote p<0.01, p<0.05, and p<0.1, respectively. Non-airport, non-political variables are observed at the county level