The Political Economy of Secession - users.ox.ac.ukusers.ox.ac.uk/~ball0144/self-det.pdf · The...
37
The Political Economy of Secession Paul Collier and Anke Hoeffler 23 rd December , 2002 Development Research Group, World Bank The findings, interpretations, and conclusions expressed in this paper are entirely those of the authors. They do not necessarily represent the views of the World Bank, its Executive Directors, or the countries they represent. Centre for the Study of African Economies, University of Oxford and International Peace Research Institute Oslo, corresponding author: [email protected]
Transcript of The Political Economy of Secession - users.ox.ac.ukusers.ox.ac.uk/~ball0144/self-det.pdf · The...

The Political Economy of Secession
Paul Collier�
and Anke Hoeffler�
23rd December , 2002
� Development Research Group, World Bank
The findings, interpretations, and conclusions expressed in this paper are entirely those of the authors. They do not necessarily represent the views of the World Bank, its Executive Directors, or the countries they represent. �
Centre for the Study of African Economies, University of Oxford and International Peace Research Institute Oslo, corresponding author: [email protected]

2
1. Introduction
Secessionist movements present themselves to the global public as analogues of colonial
liberation movements: long-established identities are denied rights of self-determination
by quasi-imperial authorities. Self-determination is presented as the solution to the
challenge of peaceful coexistence between distinct peoples. The global public not only
accepts this message but reinforces it: both Hollywood and diasporas relay it back to
populations in developing countries. In this paper, we wil l argue that the discourse of
secessionist movements cannot be taken at face value. We will suggest that a more
reali stic characterization of secessionist movements is that their sense of poli tical identity
is typically a recent contrivance designed to support perceived economic advantage, if the
secession is successful, and facilitated by popular ignorance.
2. The thesis: economic advantage determines political identity
Our analysis rests primarily upon two distinct building blocks. The first is that of
Anderson (1983). He argues that groups large enough to function politically cannot be
genuine ̀ communities’ in the sense of being networks of social interaction. People who
support the same political party, regardless of its agenda, do not generally know each
other, nor are they related. Nevertheless, some political parties attempt to attract votes by
appealing to a common sense of identity. Anderson’s key point is that this sense of
common identity must be ' imagined' since it does not reflect objective social interaction.
Potentially, people can ' imagine' any of a myriad of identities. In primitive societies,

3
tribal groupings based on kinship and genuine social interaction were seldom more than
10,000 people. These genuine communities can be amalgamated into larger poli tical
groupings, and correspondingly larger geographic units, in many ways: there are few, if
any, 'natural', 'organic', political communities resting on a common and exclusive ethnic
identity. We unlock the puzzle of identity politics by identifying which of these myriad
of potential identities 'work', in the sense of being accepted by sufficient people to
establish a functioning poli tical organization capable of mobilizing votes, violence or
both.
Our second building block is the analysis of Buchanan and Faith (1987). They make the
simple point that, since taxation is borne differentially by the rich, as the rate of taxation
is increased, at some point the rich would be better off if they could redraw the
boundaries of the tax authority so as to exclude themselves. They would lose the public
goods provided by the authority to its population, but would be able to provide such
goods themselves more cheaply. The actual context with which Buchanan and Faith are
concerned is local government boundaries within the USA. However, their insight can be
applied much more broadly.
We suggest that the common economic interest of the minority of the population that is
rich, as identified by Buchanan and Faith, functions as the vital ingredient in identity
politics. That is, secessionist poli tical communities invent themselves when part of the
population perceives secession to be economically advantageous.

4
Secession is by definition spatial. That is, the exiting group must inhabit contiguous
territories that can form a unity distinct from the existing political entity. In the normal
case in which the richer part of the national population is geographically dispersed – for
example, living in the better suburbs of each city – secession is not the appropriate
political response no matter how high the tax rate. At the most, rich people will simply
emigrate, possibly to a common location. Hence, if economic advantage drives secession,
it can only do so where economic advantage is spatially concentrated: locali ty X must be
significantly better off than locality Y. Once this is the case then the inhabitants of
locality X may come to identify themselves politically as ̀ X’s, with a political agenda of
separation.
Generally, however, overt greed tends to be understated as the main basis for political
mobilization. The viable poli tical discourse of X-identity is more likely to conjure up
some past shared roots of X-inhabitants or some perceived injustice perpetrated upon
them, currently or in the past. This is not to suggest that the politicians who present their
secessionist movements in such terms are anything other than genuine. The level of time
commitment necessary for poli tical leadership is li kely to attract those who genuinely
hold romantic attachments to their real or imagined roots, or those who are most
desperate to be included. It is relatively common that the most extreme players in identity
politics are not genuine members of the groups they purport to lead. For example, the
father of the Irish leader Devalera was Spanish, the father of the American black power
leader Michael X was white, and the mother of Goldsmith, leader of the British

5
isolationist Referendum Party, was French. These people were obviously not motivated
by economic considerations.
It is, however, critical to distinguish between the motivation of the leadership of a
secessionist movement and that of its supporters. There are thousands of minor poli tical
movements whose passionately committed leaders are of no consequence because they
cannot muster sufficient support. Especially where a movement is a political party rather
than an army, most of its support will come not from people who are passionately
committed, but from those who have only some vague sense that the party is advancing
their interests.
Natural resources are not the only way by which a contiguous part of the national
population can come to imagine itself as a political community. However, they are
particularly potent: they are usually `discovered’ at a particular moment, the arch-typical
event perhaps being a gold rush. Additionally, the prices of natural resources are volatile,
with periodic spikes, so that there are precise moments when the economic value of a
particular resource becomes dramaticall y valuable. A further attraction of natural
resources for the popular imagination is that, unlike say technological discoveries, the
resulting income accrues to ownership rather than to effort: in economic terms, these are
`rents’ rather than a return on capital or entrepreneurship. Ownership of a natural
resource discovery thus has some of the same appeal as winning a lottery – it is wealth
without work. The reality of natural resource discoveries has usually been quite
disappointing – revenues are seldom used well and resource-dependent economies have

6
actually substantially underperformed (Auty, 2001). We speculate that the allure of
claiming ownership of a natural resource discovery, like the allure of a lottery, depends in
part upon an exaggerated perception of its value, and that it disproportionately attracts the
support of the less educated.
Before elaborating, it might be useful to give a concrete example of this process at its
clearest, namely Scottish nationalism. Scotland ceased to be an independent polity some
300 years ago, when its population entered into a union with England and Wales. In the
nineteenth century, there was an `invention of culture,’ when writers such as Sir Walter
Scott imagined a rural Highlands identity for what was by then a highly urban population.
For much of the twentieth century, this cultural revivalism supported a minor political
movement for independence, which attracted very few votes.
This electoral irrelevance was transformed quite suddenly and can be dated with
precision because of the radically different success of the Scottish National Party in all
elections up to and including that of 1970, as compared to their breakthrough in both
elections in 1974. In the 1970 general election, the Scottish National Party had only one
Member of Parliament (representing the remote Western Isles), and received only 11% of
the Scottish vote. After the two general elections of 1974, the party had eleven members
of parliament and over 30% of the Scottish vote.1 Thus, in electoral terms Scotland as a
political community dates back only to 1974. Something happened between 1970 and
1974 as a result of which many people living in Scotland switched to imagining
themselves as part of a geographic political community, as opposed to their previous 1 Scottish National Party (2002).

7
class-based political identification. There is little doubt as to the cause, i.e., the dramatic
rise in the international price of oil price as a result of the Yom Kippur war of 1973.
Oil was discovered in the North Sea in 1966, and most of it was off the coast of
Scotland. When the price of oil quadrupled in 1973, the British government imposed
taxes on the oil companies so that approximately 90% of their additional oil revenues
accrued to the government. The Scottish Nationalist Party ran a campaign with the slogan
'It's Scotland's Oil' and argued that, if Scotland were independent, the tax revenues would
accrue to the five million people of Scotland rather than to the 50 million people of
Britain. Per capita oil revenues for inhabitants of Scotland would rise ten-fold if the other
45 million people were excluded. The fragile and recent cause of romantic nationalism
could thus be allied to the robust and ancient cause of economic self-interest.
The critical nature of oil resources in the emergence of Scotland as an 'imagined
community' is suggested not just be this striking temporal coincidence but by a
comparison with Welsh and Breton secessionist movements. These movements share the
same romantic Celtic nationalism as Scotland, but there is no oil on their territories. The
Welsh movement has attempted to build a parallel case by virtue of the fact that the water
supply for the English city of Birmingham comes from Wales (`hands off Welsh water').
However, perhaps because water is seen as being legitimately free, it has not ignited the
greed of Welsh voters. The Scottish Nationalist Party is an entirely conventional poli tical
party – it has had no association with violence. There have been attempts to establish

8
violent secessionist organizations in Scotland, Wales and Brittany, but none has become
politically significant.
We have dwelt on the rise of the secessionist movement in Scotland because it so
obviously supports our thesis. Natural resources are usually geographically concentrated
in a particular part of a country, so countries that are heavily dependent upon natural
resource exports are likely to be prone to secessionist movements. Sometimes natural
resources are not geographically concentrated, and sometimes other important sources of
income are highly concentrated, and we should expect to find exceptions. However, if
our thesis is correct, we should expect to find many other examples. In fact, there are
many such examples, usually masquerading under the guise of romantic nationalism.
However, before turning to them, we will present a systematic statistical analysis of
secession to the extent that this is possible.
3. Secession: a quantitative analysis
In our previous work, we have investigated empirically the causes of civil war (Collier
and Hoeffler, 1998, 2002a, 2002b). We considered all the large-scale civil wars that
began during the period 1960-1999 and sought to explain them in terms of observable
socio-economic characteristics. Specifically, we attempt to explain the risk of war
commencing in each five-year sub-period in terms of characteristics at the start of the
sub-period. Some of these wars had secessionist aspirations; others did not. Taking them
all together, our results appear somewhat surprisingly at variance with much of the

9
discourse on civil war. We find that there are three major risk factors: a low level of per
capita income, a slow rate of growth of income, and high dependence upon primary
commodity exports, this last being especially important. We have not found either
economic inequality or political repression to be statistically significant. Turning to the
social composition of the population, we find that, if the largest ethnic group constitutes
between 45 percent and 90 percent of the population, the risk of civil war is
approximately doubled, although this is a fairly small effect by comparison with primary
commodities. Further, having a large diaspora living in the United States also
substantially increases the risk of civil war (we allow for the fact that wars often increase
the size of diasporas). Other than this, a high degree of ethnic and religious diversity
actually makes a country significantly safer than if it were homogenous.
Our explanation for this superficially puzzling pattern has been that the occurrence of
civil war is better understood in terms of opportunity than in terms of motive. A high
degree of inequality, political repression, and ethnic and religious differentiation may all
increase the sense of grievance among parts of the population, but, in most situations,
people do not have a realistic opportunity to rebel. Primary commodity exports may be
important partly because they provide rebel organizations with a ready source of finance.
Similarly, low per capita income and slow growth may lower the costs of recruiting to the
rebel army, while at the same time they weaken the capacity of the government to oppose
such an army. In the limit, where rebellion is feasible it can be presumed to occur, and
there will always be some group sufficiently motivated to resort to violence regardless of
the intensity of objective grievances.

10
We now turn specifically to those civil wars, which appear in some sense to have been
motivated by secessionist goals. We are therefore focusing upon a subset of civil wars. If
our general thesis about secession were correct, then we would expect secessionist civil
wars to be strongly linked to primary commodity exports. Note that our existing results
constitute powerful evidence for this thesis. As we will see, most civil wars are in some
sense secessionist, and we have found that the single most important determinant of civil
wars is dependence upon primary commodity exports. However, here we can push the
test of the thesis further, since primary commodity dependence might be differentially
important in those civil wars that have secessionist objectives. If our general thesis about
civil wars were correct, then we would expect the key differences between poli tical and
violent secessionist movements to be the other major determinants of civil war – per
capita income and economic growth. Secession would be pursued by polit ical means in
high-income rapidly growing countries and by violent means in low-income slowly
growing countries.
The objectives of rebel groups are not always readily observable, and we distinguish
between secessionist and other civil wars by using data on ethnic and religious wars from
three different data sources: Sambanis (2000), Licklider (1995) and the State Failure
Project (Esty et al, 1998). We concentrate our analysis on the data collected by Sambanis
(2000) and list all civil wars in Appendix Table 5A. In addition, we present further results
using data from the alternative data sources in the Appendix. These robustness checks
show that all three data sets provide similar results.
11
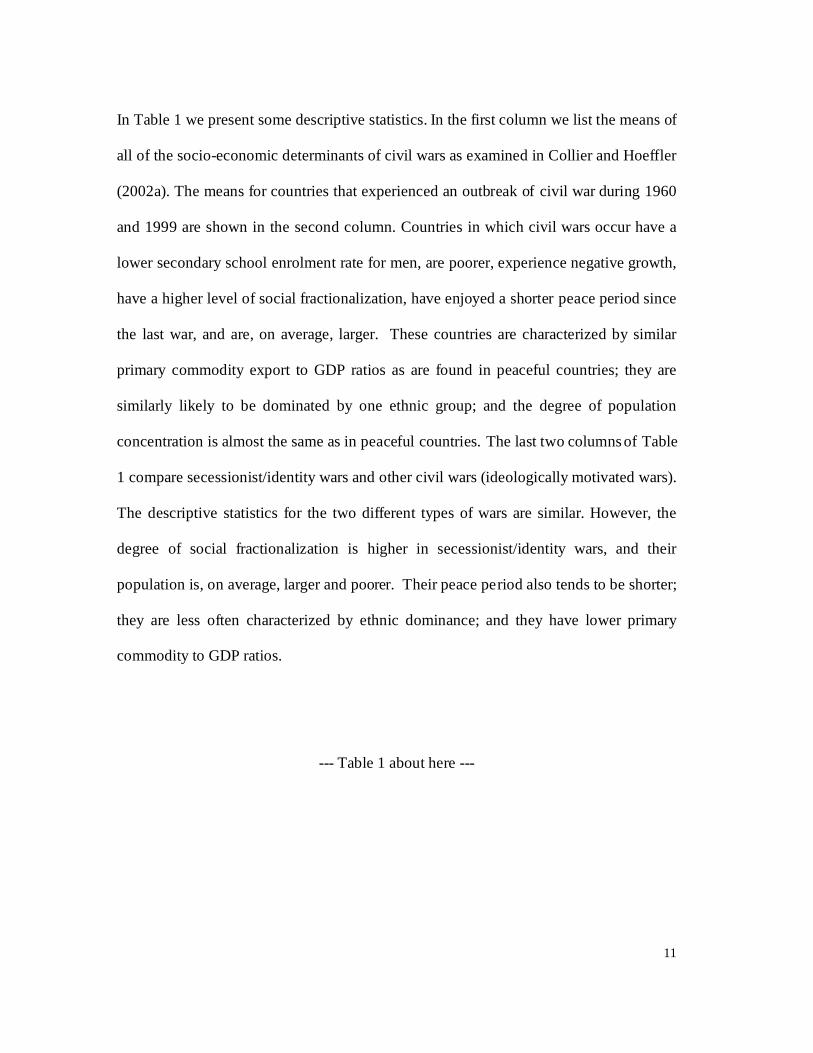
In Table 1 we present some descriptive statistics. In the first column we list the means of
all of the socio-economic determinants of civil wars as examined in Collier and Hoeffler
(2002a). The means for countries that experienced an outbreak of civil war during 1960
and 1999 are shown in the second column. Countries in which civil wars occur have a
lower secondary school enrolment rate for men, are poorer, experience negative growth,
have a higher level of social fractionalization, have enjoyed a shorter peace period since
the last war, and are, on average, larger. These countries are characterized by similar
primary commodity export to GDP ratios as are found in peaceful countries; they are
similarly likely to be dominated by one ethnic group; and the degree of population
concentration is almost the same as in peaceful countries. The last two columns of Table
1 compare secessionist/identity wars and other civil wars (ideologically motivated wars).
The descriptive statistics for the two different types of wars are similar. However, the
degree of social fractionalization is higher in secessionist/identity wars, and their
population is, on average, larger and poorer. Their peace period also tends to be shorter;
they are less often characterized by ethnic dominance; and they have lower primary
commodity to GDP ratios.
--- Table 1 about here ---

12
We now use logit regression analysis to determine whether those wars that are in some
sense 'about' identity have different causes from those with other discourses such as
ideology. As a benchmark, we replicate the results from Coll ier and Hoeffler (2002a) in
Table 2, column 1. We find that we can clearly distinguish between war and peace
countries: countries with certain characteristics were on average more or less likely to
experience a civil war than others. In this sample, we analyze 46 wars.
In column 2, we run the same regression but confine the event to be explained to those
civil wars that are secessionist. We then compare this regression with that for
ideologicall y motivated wars (column 3). The key hypothesis to be tested here is that
primary commodity exports are more li kely to cause a secessionist civil war than an
ideological civil war. Recall that when we take civil wars in their entirety, these natural
resources play a powerful and dangerous role, greatly increasing risk. There are two
major reasons why natural resources might be a powerful risk factor – the opportunity
which they provide to rebel groups to finance their activities during conflict and the lure
of capturing resource ownership permanently if the rebell ion is victorious. The former is
common to both ideological and secessionist rebellions, but the latter – long-term capture
– is differentially important for secession. After all , if victorious, the secessionists will
carry off the resources.
The regressions support the hypothesis that natural resources are differentiall y li kely to
cause secessionist civil wars. Although primary commodity exports increase the risk of
both types of civil war, the coefficient in the identity war regression is three times larger

13
that that for ideological wars. Despite the small size of the sample, this difference is
statistically significant at the five percent level. This result is not dependent upon the
particular definition of identity wars used by Sambanis. In the Appendix we show that the
same result is reached using the two alternative specifications of secessionist wars. Table
3A uses data from Licklider (1995) and Table 4A uses data from the State Failure Project
(1998). In Table 2A we show that the result is also robust to changing the specification of
the regression: here we use income per capita rather than secondary school enrolment
rates and the results are similar.
The last two columns of Table 2 are limited the to war observations, i.e., where there is a
civil war, we examine whether identity wars are different from ideological wars. The
event in these logit regressions is defined as identity war, i.e., if a war was about identity,
the dependent variable takes a value of one and otherwise takes a value of zero. Our
results rest on a limited number of war observations, but the measure of overall fit
(pseudo R2) is quite respectable at around 0.35. Four sets of variables are significant or
approaching significance.
--- Table 2 about here ---
In order to examine the primary commodity results in more detail, we include a dummy
for oil exporting countries (column 4). The coefficient is close to being significant and is
significant in the alternative specification (see Table 2A). Conditional upon the overall

14
level of primary commodity exports, civil wars in countries with large oil exports are
more likely to be secessionist and less likely to be about ideology. We investigated other
primary commodities but could not find any evidence that other raw materials have
distinct effects. This is consistent with our speculation that oil wealth has an exaggerated
effect on popular political imagination.
Wars are more likely to be secessionist the smaller the proportion of the male population
that has secondary education (column 5). Although secondary education is fairly closely
correlated with per capita income, if the regression is repeated with per capita income
instead of secondary education as an explanatory variable, per capita income is
completely insignificant (see Table 2A). Thus, it appears that it is education rather than
income that is important. This is consistent with our speculation that the allure of natural
resources is reinforced by popular ignorance. It is easier for polit icians to exaggerate the
value of a geographic identity associated with a natural resource endowment if the
population is uneducated. A lack of education might also make it easier for politicians to
appeal to romantic notions of belonging to a common community based on ethnicity or
religion. For example, the study by Sacerdote and Glaeser (2001) finds that, as the level
of education rises, the intensity of religious identity diminishes. It seems plausible that
identity politics is easier to play if citizens are uneducated.
Geographic variables are also significant – civil wars are more likely to be secessionist
the larger and more dispersed the population. This is consistent with the natural resource
thesis: if there is a large and highly dispersed national population then inequali ty of

15
resource endowment is likely to be more pronounced – a minority of the population is
likely to be located on top of the natural resources.
A final variable that is close to significance (or significant in the alternative
specifications) is social fractionalization, reflecting the extent to which the society is
differentiated by ethnicity and religion. Wars of identity are actually less likely to occur,
relative to ideological wars, the more fragmented is the society. Why might this be? A
possible explanation is that a successful secessionist resource grab depends upon creating
an imagined community that is broadly coincident with that which occupies the territory
on which the resources are located. If the society is too fragmented, this wil l require
unifying disparate groups of people at the same time as these groups are persuaded to see
themselves as distinct from the national population. As we see when we turn to some
examples of attempted secessions, sometimes this is highly problematic.
Thus, the characteristics that generate a high risk of secessionist civil war appear to be a
combination of high levels of natural resource endowments and low levels of education.
This is consistent with the hypothesis that resource capture is an important objective of
the rebellion. We should stress that objectives and motivations, especially when they are
an amorphous mixture of romanticism and self-interest, are better revealed by behavior
than by study of the political discourse utilized, which includes both propaganda and self-
delusion. The Scottish Nationalist Party did not say, ̀ If we turn ourselves into a poli tical
community, we can grab the oil wealth'. The leaders of the party were drawn from the
tiny handful of romantic nationalists who already thought of Scotland as a political

16
community. Their message was, `The oil i s really ours, but it is being stolen by the
English'. But the massive redefinition of working-class inhabitants of Scotland between
1970 and 1974 from being members of the British working class – and hence voting for
the Labour Party – to being members of Scotland – and hence voting for the SNP – is
surely better accounted for by a perceived change in economic self-interest than by a
sudden recognition of primal identity.
4. Some secessions in practice
We have suggested that secessions depend upon the invention of an imagined political
community and that natural resources wil l often be instrumental in transforming this
invention from the pipe-dream of a handful of romantics to the reali ty of a large poli tical
or military organization. Once this transformation has occurred, the history of the
secessionist movement wil l, of course, trace its origins back to the supposedly 'far-seeing'
romantics and from them to the misty shared origins of kinship or religion. However,
such histories do not provide an even approximately accurate explanation of how
secessionist movements become serious organizations. There are literall y hundreds of
romantic secessionist groups – probably most areas of the earth are subject to the claims
of one or more of them. But the mere existence of such a group does not help us to
understand those few secessionist movements that, by virtue of their violence or electoral
support, have become serious political phenomena.2
2 For a detailed discussion of the determinants of secessionist claims please refer to Jenne (2003).

17
We will now consider some of these serious secessionist movements case-by-case, to see
whether our thesis has plausibili ty beyond the evidence of the regression analysis and the
example of Scotland.
First, consider two major failed secessionist movements in Africa, the attempt of Katanga
to secede from the Congo, and the attempt of Biafra to secede from Nigeria. Since all
African countries are composed of many ethno-linguistic groups, these movements each
laid claim to nationhood for an ethnic group. Again, the only question of importance is
why it was these ethnic groups and not others. Biafra provides a particularly clear
illustration of the role of natural resources, because oil became significant for the
Nigerian economy only in the mid-1960s. Prior to oil , Nigerian politics had been
dominated by an all iance between the dominant tribe in the South-East, the Ibo, with the
dominant tribe in the North, the Hausa-Fulani. This alliance excluded the dominant tribe
of the South-West, the Yoruba. Far from coincidentally, the main natural resource in
Nigeria prior to oil was cocoa, which was produced in the South-West. Hence, the long-
standing Nigerian political alliance was between the two natural resource-scarce tribes, to
enforce the sharing of the rents on cocoa production.
The discovery of oil , which was located entirely in South East Nigeria, destroyed the
rationale for this political alignment. Very rapidly, a new coalition formed between the
North and the South-West against the oil-rich South-East. In response, the Ibo of the
South-West declared their independence, and war followed for the next three years. This
was decidedly not a war of ethnic identity – the oil resources being fought over were

18
actually off the coast of Port Harcourt, whereas the Ibo heartland was inland, around
Enugu. The Ibo, like the other large tribes, was largely a nineteenth century
amalgamation of hundreds of much smaller genuine communities, and so precisely who
was and was not an Ibo was not fixed. When Biafra was defeated, many small ethnic
groups redefined themselves as non-Ibo: identity fluctuated according to convenience.
Biafra was a natural resource grab as unmistakable as the rise of the Scottish Nationalist
Party. It is notable that Nigeria currently has one serious secessionist rebellion, in the
Niger Delta. Even more than was the case in Biafra, the rebellion is geographicall y
coincident with the oil resources. In the intervening thirty years, however, Nigeria has
done much to diffuse secessionist pressures. The chosen technique has been a formula for
sharing oil revenues between regional governments: each regional government receives a
fixed amount, plus an allowance for its population. This has created strong financial
incentives to create new regions. If a region is divided, its population gets more money –
the same population allowance, but two fixed amounts instead of one. So strongly are the
boundaries of imagined political communities driven by perceived economic interests
from oil rents that, whereas in 1970 Nigeria had only three regions, it now has 36. Of
course, each of these splits has occurred as groups within a region have asserted their
`historic rights' to self-government. Surely, to the extent that most Nigerians think about
why they want new regions, uppermost in their minds may well be these 'historic
identities'. But to interpret why Nigeria has divided into so many regions as simply a
reassertion of local identity would be to miss why this has happened in Nigeria rather
than elsewhere.

19
The Katanga secession is similarly intimately related to the fact that this was the mineral
heartland of the Congo. There was overt involvement in the secession by South African
mining interests, so that it could more plausibly be interpreted as an external and
commercial movement than as a bottom-up cry to protect a historic identity. As in
Nigeria, thirty years after the initial secession was defeated, there is renewed secessionist
pressure, far more intense than in Nigeria, and quite evidently related to natural
resources. As previously, the secessionist movement appears to be more closely related to
external commercial interests than to bottom-up assertions of identity or demands for
self-government for its own sake.
Indonesia is, like Nigeria, a large, resource-rich country facing secessionist pressures. To
date, that of East Timor has been successful, and that of Aceh, at the other end of the
archipelago, has been contained. Both of these provinces are rich in natural gas with
small populations, whereas the island on which most of the Indonesian population lives,
Java, has neither oil nor gas. East Timor, despite having a population of only 800,000
people, is not socially cohesive: indeed, it has a prior history of war.3 Since gaining
independence the government has concluded an offshore oil and gas contract. Prior to
independence, these resources were untapped, because of the disputed legal status of the
oil and gas fields. Aceh has a per capita GDP triple the Indonesian average, although this
is not reflected in living standards, since the oil income accrues nationally rather than
locally. After a dispute about an oil contract, a businessman formed the independence
3 In 1975 the Portuguese colony of East Timor was invaded by Indonesian forces. For an in depth analysis of the conflicts in Indonesia see Ross (2002).

20
movement in 1976. Both East Timor and Aceh indisputably have distinct historic
identities that can be tapped. However, this is true all over Indonesia. The abili ty of these
particular secessionist movements to function effectively over long periods may,
however, be related to the perception on the part of the populations of these areas that
secession would confer ownership of important resources.
Another long-standing secessionist movement is that of the Southern Sudan. The
populations of the Southern Sudan do not have a common identity – indeed, there has
been civil war within the region as well as between it and Northern Sudan. In the late
1960s, substantial oil fields were discovered in Southern Sudan. Until very recently these
could not be exploited because of war, but they may have provided these disparate
populations some sense of political commonality.
We now turn to three secessions that are not linked to natural resources – Eritrea,
Slovenia, and Croatia. Superficially, these do not fit our thesis at all, since they are all
supposedly about deep-rooted assertions of identity. However, all three of them fit
surprisingly closely into the Buchanan-Faith framework. Eritrea was the richest region of
Ethiopia. This was not due to natural resources, but because Italian colonists had
occupied Eritrea well before the rest of Ethiopia and so had established industry there.
Eritrea had a per capita income around double that of the rest of Ethiopia. In 1951,
following the withdrawal of the Italians and their successors, the British, Eritrea held a
referendum as to whether to become independent or to federate with Ethiopia. The
population voted for federation, suggesting that at that time Eritrea was not an 'imagined

21
political community'. A decade later, the emperor of Ethiopia dissolved the Federation
and imposed direct rule. This had important fiscal implications – net tax transfers would
evidently be from Eritrea to Ethiopia. Shortly after the dissolution of the Federation, the
Eritrean independence movement was formed. With the support of a large diaspora, it
was astonishingly successful, although independence came only after a very long military
struggle.
Slovenia was the richest region of Yugoslavia. In the Tito years, Yugoslavia was a
federation, so that large income inequalities were not offset by taxation. However, in the
economic chaos following the collapse of the Soviet Union, economic policy in
Yugoslavia was substantiall y centralized; for example, foreign exchange reserves were
pooled. This enabled the Serbian dictator to use non-Serb resources for his own agenda.
Slovenia was able to secede from Yugoslavia, partly thanks to diplomatic cover from the
EU. Once Slovenia had seceded, Croatia became the richest region of the remaining
Yugoslavia. With the Slovene precedent, it too seceded, although in this case the
secession was not peaceful.4
Thus, all three of these successful secessions had elements of `tax-exits'. Of course, in
each case the shared economic interest coincided with cultural identities. However,
cultural identities are usually fluid. For example, Eritrea, although a country of only 2.5
million people carved out of the 50 million people of Ethiopia, is far from culturall y
4 Although Slovenia and Croatia declared independence on the same day ( 25th July 1991), Slovenia held a referendum and prepared for independence before Croatia. Croats did not want to be left behind and president Tudjman stated that if Slovenia seceded, Croatia would not stay “a day longer” in Yugoslavia (Silber and Little, p 148).

22
homogenous. Its population includes three major religious groups, five ethnic groups,
nine off icial languages, and three official writing scripts. Further, the creation of the
country split its major ethno-linguistic group, the Tigrini, into a majority living in
Ethiopia and a minority in Eritrea. Ethiopia is full of groups with secessionist aspirations,
but the only question of interest is why the only successful secession is that of Eritrea.
We now turn to two major secessionist movements that, while not linked to natural
resources, can be seen as having economic causes: Bangladesh and the Confederacy.
Bangladesh was initially East Pakistan. Pakistan was itself created as a religious
secession from India negotiated by a few polit ical leaders as part of independence from
Britain. Because Pakistan did not secede from an independent India but was created as
part of the process of decolonization, it is probably best treated as distinct from the
secessions that we are analyzing. The secession of East Pakistan from Pakistan, despite a
common religious identity, can be seen in economic terms. During the 1950s and 1960s,
Pakistan embarked upon an industrialization strategy of import substitution behind high
protective tariff barriers. This was a standard strategy at the time, but Pakistan took the
policy to extremes. In the early stages of such industrialization, industry tends to
agglomerate in a single location to reap scale economies, and, in Pakistan, the industry
agglomerated in the West. As is inevitable with highly protected import substitution, the
policy involved a massive transfer from exports, which were implicitly taxed through
exchange rate overvaluation, to industry. Pakistan’s exports at the time were dominated
by jute, which was produced in East Pakistan. Hence, the economic policy involved a
massive transfer from East Pakistan to West Pakistan. The lack of contiguity of East and

23
West Pakistan, and the evident interest of India in dividing Pakistan, greatly facili tated
secession. However, there also was a clear economic incentive for East Pakistan to
secede.
Somewhat surprisingly, the secession of the US Confederacy was very similar to the
secession of East Pakistan. The Northern states were primarily manufacturing, while the
Southern states produced the export good, cotton. In 1828, the North attempted to impose
high protective tariffs, which would have produced a large income transfer from the
South to the North. This tariff proposal was termed in the South the `tariff of
abominations’ and was vigorously opposed. Northern interests backed down until 1860,
when the tariff was imposed. Obviously, this was not the only issue that provoked
Southern secession, but it is often greatly underplayed relative to the more readily
grasped issue of slavery (World Bank, 2000).
There is one important recent secession which radically contradicts our thesis, that of
Slovakia. Slovakia was the poorer part of the Czech-Slovak federation and so stood to
benefit fiscall y from continued federation. In economic terms, Slovakia made a serious
mistake by seceding. There is only one respect in which the secession of Slovakia is
compatible with out thesis, which was that it was not resisted by the richer partner, the
Czechs, but instead was agreed to with an otherwise astonishing alacrity. However, fully
peaceful secessions are rare, because the circumstances in which they are in the interests
of both parties are rare. Usually, secession appears to be initiated by the party that will

24
benefit economically from it, and these attempts are invariably opposed by the party that
will suffer economically.
5. Diasporas and secession
We noted above that in our previous work we have found that the size of the diaspora in
the United States relative to the population in the home country is a significant predictor
of the revival of conflict in post-conflict societies. Our results have focused on the US for
the simple reason that data are readily available. Further, since immigrants to the US have
a common economic and legal environment, they can more meaningfully be aggregated
than immigrants located in many different societies. The presumption should be that
diasporas in other high-income countries have similar effects.
There are various ways in which a diaspora might revive conflict. The two most obvious
routes are to continue to publicize grievances and/or to finance violent organizations.
Diasporas are likely to use both of these techniques. First, migration is often partly
related to a group grievance. Once detached from the home society and living in a highly
absorptive multi-cultural society, the cultural incentive is for the diaspora to preserve
prominent aspects of its identity; extremist political allegiance is an inexpensive means of
asserting that identity. Diasporas do not suffer from the violence that they support and so
face lower costs than the home population. The diaspora is also considerably richer than
the home population, so its financial contribution to organizations of violence is

25
disproportionately important. Further, detachment means that the diaspora never has to
find a modus vivendi with the group that it opposes, whereas those who remain behind
face a real need, and are presented with real opportunities, to move on from violence.
Our descriptive statistics in Table 1 do not indicate that countries with identity wars have
proportionately larger diasporas. However, as discussed above, we rely exclusively on
US immigration data and therefore place a disproportionate importance on the analysis of
diaspora communities originating from Latin America and the Caribbean. None of these
countries experienced a war about identity, and it is thus difficult to find statistical
evidence for our hypothesis. We would prefer to use aggregated immigration data from
OECD countries in this analysis; unfortunately no such data set exists. However, case
study evidence supports the role of diasporas in secession and the revival of violence5.
The secession of Slovakia was apparently initiated within the Czechoslovak societies of
cities in North America. Most recently, the Kosovo Liberation Army, which desires the
secession of Kosovo from Yugoslavia and perhaps the secession of the Albanian minority
from Montenegro, apparently receives substantial material support from Kosovars based
in Europe. The Liberation Tigers of Tamil Eelam (LTTE) secessionist movement in Sri
Lanka is financed in part from Canada; for example, the 1996 bomb that kil led 86
civil ians and injured a further 1,400 in Colombo was mainly financed by the Tamil
diaspora in Canada.6 We have already noted the critical role played by the Eritrean
5 For an overview see for example Angoustures and Pascal (1996). 6 ‘A Singapore bank account opened by a Canadian of Sri Lankan origin was used to pay for 60 tons of explosives … imported from the Ukraine by the Liberation Tigers of Tamil Eelam …’ (S. Bell , National Post 10th March 2000). It is estimated that the Tamil diaspora raised about $450-500mill ions worldwide per year, much of it was used to supply the Tamil Tigers with arms. However, fewer governments are now wil ling to sanction these fund raising efforts and following the Tigers’ ban in the UK and other countries, their funds are drying up (The Economist, March 10th 2001).

26
diaspora in the USA. Equally evident, the Irish Republican Army has for many years
received its material support predominantly from the Irish diaspora in the USA. The
globalization of political violence thus long pre-dates September 11th; only the targets
have changed.
6. Conclusion: do secessions deserve support?
Clearly, no generic analysis such as our own can answer the question of whether, in a
particular case, a secession is likely to be broadly beneficial or to carry serious dangers.
In economic terms, the trend is towards greater integration rather than secession. Thus,
the European Union is attempting to forge a common policy across fifteen states and is
likely to have several more members in the near future. On a more modest scale, NAFTA
is also building a common economic area among the USA, Canada, and Mexico. In
contrast to these integrating trends among developed countries, many developing and
transition countries are facing strong secessionist pressures, often supported by diasporas
in multi-cultural high-income societies.
If our statistical analysis of civil conflict is broadly correct, then secessions in low-
income countries may carry some dangers. Secession commonly reduces ethnic and
religious fractionalization without eliminating it: the quest for an ethnically pure society
is a chimera. Our results suggest that a reduction in ethnic and religious fractionalization

27
is likely to increase the danger of civil war rather than diminish it. Indeed, the most
dangerous countries from the aspect of social composition are those in which the largest
ethnic group is in a majority, but with a significant minority present. At present, most
developing countries are too diverse to be characterized by such ̀ ethnic dominance,’ but
secessions are more likely to create such dominance than to eliminate it. For example,
once Slovenia and Croatia had seceded from Yugoslavia, Serbs became ethnicall y
dominant in the remaining territory, perhaps contributing to the violent conflicts in
Bosnia and Kosovo.
Further, if our analysis is broadly correct, secessionist movements should not in general
be seen as cries for social justice. Those few secessionist movements that are able to
scale-up to being organizations with a serious polit ical or military capability are likely to
occur in rich regions and contain an element of a ‘resource grab’. They may also reflect
the fantasies of diasporas settled in rich countries and a poorly educated population.
Secessionist organizations are usually built on the foundations of romantic localism, and
this wil l continue to shape their discourse. However, such localism is found almost
everywhere. That viable secessionist organizations are rare indicates that romantic
localism, and its associated discourse of grievance, is not by itself decisive. Romantic
localism is not necessarily dishonest or irrelevant, but it offers a misleading explanation
for what makes a secessionist organization strong.
If the cocktail of natural resource wealth, diasporas, and illi teracy succeeds in
dismembering large, multi-cultural developing and transition societies, the world is

28
unlikely to become a safer place. The secession of Eritrea from Ethiopia, heroic as it was,
has not resulted in peace. It transformed a civil war into an international war, with a huge
escalation in human and economic costs. It also has created a nation of 50 million people
without direct access to the sea.
Nor are the small new societies that are created by secession necessarily internally
cohesive. In Eritrea, the President recently arrested around half of the members of his
cabinet. East Timor has sixteen different political parties, one for every 50,000 people. It
would surely be disturbing if, at the same time as developed countries were integrating as
never before, developing countries were disintegrating into tiny but disputatious ethnic
theme parks.

29
References
Anderson, Benedict R. O'G. 1983. Imagined Communities : Reflections on the Origin and Spread of Nationalism. Verso: London. Angoustures, Aline and Valerie Pascal. 1996. ‘Diasporas et financement des confli ts,’ in Francois Jean and Jean-Christohpe Rufin (eds.) Economie des Guerres Civiles, Hachette, Paris. Auty, Richard M (ed.). 2001. Resource Abundance and Economic Development. Oxford University Press, Oxford. Bell , S. 2000. Tamil Tigers used TNT to kill dozens in 1996 attack. National Post 10th March 2000. Buchanan, J. M., and R. L. Faith. 1987. Secession and the Limits of Taxation: Toward a Theory of Internal Exit. American Economic Review 77:1023-31. Coll ier, Paul and Anke Hoeffler. 1998. On Economic Causes of Civil War. Oxford Economic Papers 50: 563-573. ------, 2002a. Greed and Grievance in Civil Wars, Centre for the Study of African Economies Working Paper 2002-01. http://www.economics.ox.ac.uk/CSAEadmin/workingpapers/pdfs/2002-01text.pdf ------, 2002b. On the Incidence of Civil War in Africa, Journal of Conflict Resolution 46:13-28. Esty, Daniel C. et al. 1998. The State Failure Project: Early Warning Research for US Foreign Policy Planning. In Davies, Hohn L. and Ted Robert Gurr (eds.). Preventive Measures: Building Risk Assessment and Crisis Early Warning Systems. Rowman and Littlefield, Boulder, Colo. and Totowas, N.J. Licklider, Roy. 1995. The Consequences of Negotiated Settlements in Civil Wars, 2945-1993. American Political Science Review 89:681-90. Ross, M.L. 2002. Resources and Rebellion in Indonesia. University of California, Los Angeles. Mimeo. http://www.polisci.ucla.edu/faculty/ross/ Sacerdote, Bruce and Edward Glaeser. 2001. Education and Religion, National Bureau of Economic Research Working Paper 8080. Sambanis, Nicholas. 2000. Partition as a Solution to Ethnic War. World Politics 52:437-83.

30
Silber, L. and A. Little. 1996. The Death of Yugoslavia. Revised edition. Penguin Books, London. The Economist. 2001. Hitting the Tigers in their pockets. 10th March 2001. The Scottish National Party. 2002. A Brief History. Mimeo. http://www.snp.org/ The World Bank. 2000. Trade Blocs. Oxford University Press, Oxford and World Bank, Washington D.C.

31
Tables Table 1: Means of the Socio-Economic Determinants of War (1) (2) (3) (4) Sample War
Starts Identity War
Ideology War
Male Secondary Schooling (Gross Enrolment Rates)
42.7 30.3 29 29.2
GDP per capita (constant US$)
3921 1645 1571 1870
GDP per capita growth (previous five years)
1.56 -0.23 -0.26 0.18
Primary commodity exports/GDP 0.164 0.149 0.134 0.165 Social fractionalization (Index 0-10,000)
1784 2320 2348 1959
Ethnic Dominance (% with main ethnic group 45-90%)
0.47 0.45 0.42 0.57
Peace duration (Months)
327 221 209 258
Population (Millions)
26.1 43.8 61 11.5
Geographic concentration of the Population (Gini-Coefficient 0-1)
0.58 0.60 0.59 0.62
% of observations where Oil is the main export commodity
0.168 0.25 0.30 0.17
Diaspora (relative to population of country of origin)
0.017 0.004 0.003 0.016
Observations (max-min) 918-1266 54-78 36-47 14-24

32
Table 2: Determinants of Identity Wars (1) (2) (3) (4) (5) Dependent Variable War Start Identity War Ideology War
War Type War Type
Male Secondary -0.032 -0.054 -0.008 -0.074 -0.081 Schooling (0.001)*** (0.000)*** (0.509) (0.091)* (0.035)**
(GDP growth)t-1 -0.115 -0.125 -0.088 -0.011 -0.159 (0.007)*** (0.016)** (0.223) (0.949) (0.278)
Primary Commodity 18.937 30.461 10.456 19.191 28.231 Exports/GDP (0.001)*** (0.002)*** (0.182) (0.405) (0.184)
(Primary Commodity -29.443 -55.722 -15.730 -53.192 -48.728 Exports/GDP)2 (0.012)** (0.009)*** (0.286) (0.217) (0.205)
Social Fractionalization -0.000 -0.000 -0.000 -0.000 -0.000 (0.019)** (0.010)** (0.465) (0.709) (0.264)
Ethnic Dominance 0.670 0.785 0.949 0.757 0.929 (45-90%) (0.058)* (0.083)* (0.113) (0.506) (0.401)
Peace Duration -0.004 -0.005 -0.002 -0.002 -0.002 (0.001)*** (0.000)*** (0.370) (0.545) (0.652)
ln Population 0.768 1.139 0.254 1.601 2.164 (0.000)*** (0.000)*** (0.288) (0.093)* (0.016)**
Geographic Dispersion -2.487 -4.523 -0.045 -6.619 -5.838 (0.013)*** (0.002)*** (0.976) (0.088)* (0.094)*
Oil Dummy 3.872 (0.144)
Observations 688 688 688 42 43 No of events (war observations)
46 30 13 29 30
pseudo R2 0.24 0.34 0.07 0.38 0.36
Note: Logit regressions, all specifications include a constant, p values in parentheses, * significant at 10%; ** significant at 5%; *** significant at 1%.

33
Appendix Table 2A: Determinants of Identity Wars (Alternative Specification) (1) (2) (3) (4) (5) Dependent Variable War Start Identity War Ideology War
War Type War Type
ln GDP per capita -0.950 -1.098 -0.489 -1.826 -0.492 (0.000)*** (0.001)*** (0.175) (0.117) (0.504)
(GDP growth)t-1 -0.098 -0.080 -0.076 0.130 0.013 (0.018)** (0.100) (0.285) (0.414) (0.897)
Primary Commodity 16.773 20.362 12.514 -7.208 -4.475 Exports/GDP (0.001)*** (0.008)*** (0.092)* (0.660) (0.756)
(Primary Commodity -23.800 -34.827 -16.843 -15.280 -0.373 Exports/GDP)2 (0.018)** (0.033)** (0.211) (0.652) (0.989)
Social Fractionalization -0.000 -0.000 -0.000 -0.000 0.000 (0.007)*** (0.015)** (0.343) (0.806) (0.835)
Ethnic Dominance 0.480 0.519 0.822 0.126 -0.195 (45-90%) (0.144) (0.202) (0.150) (0.898) (0.821)
Peace Duration -0.004 -0.005 -0.001 -0.003 -0.006 (0.000)*** (0.000)*** (0.517) (0.314) (0.053)*
ln Population 0.510 0.588 0.254 0.172 0.254 (0.000)*** (0.000)*** (0.247) (0.724) (0.432)
Geographic Dispersion -0.992 -1.760 0.279 -3.022 -0.679 (0.275) (0.142) (0.847) (0.389) (0.785)
Oil Dummy 5.071 (0.044)**
Observations 750 750 750 45 48 No of events (war observations)
52 34 14 32 34
pseudo R2 0.22 0.34 0.07 0.33 0.21
Note: Logit regressions, all specifications include a constant, p values in parentheses, * significant at 10%; ** significant at 5%; *** significant at 1%.

34
Table 3A: Determinants of Identity Wars (Licklider Data) (1) (2) (3) (4) Dependent Variable Identity War Ideology War
War Type War Type
ln GDP per capita -0.050 -0.014 -0.695 -0.081 (0.001)*** (0.289) (0.134) (0.053)*
(GDP growth)t-1 -0.111 -0.129 4.774 -0.049 (0.029)** (0.120) (0.137) (0.807)
Primary Commodity 29.903 7.158 577.603 51.449 Exports/GDP (0.001)*** (0.402) (0.119) (0.196)
(Primary Commodity -51.078 -13.630 -1,560.809 -64.362 Exports/GDP)2 (0.008)*** (0.422) (0.123) (0.501)
Social Fractionalization -0.000 -0.000 -0.005 -0.001 (0.005)*** (0.591) (0.137) (0.107)
Ethnic Dominance 0.706 1.051 -2.267 0.882 (45-90%) (0.117) (0.110) (0.488) (0.477)
Peace Duration -0.006 -0.000 -0.157 -0.006 (0.000)*** (0.838) (0.135) (0.229)
ln Population 1.135 0.136 32.119 3.350 (0.000)*** (0.593) (0.119) (0.019)**
Geographic Dispersion -4.735 0.984 -161.931 -11.062 (0.001)*** (0.551) (0.115) (0.033)**
Oil Dummy 138.239 (.)
Observations 688 688 41 42 No of events (war observations)
31 11 31 31
pseudo R2 0.35 0.07 0.78 0.51
Note: Logit regressions, all specifications include a constant, p values in parentheses, * significant at 10%; ** significant at 5%; *** significant at 1%.

35
Table 4A: Determinants of Identity Wars (State Failure Project Data) (1) (2) (3) (4) Dependent Variable Identity War Ideology War
War Type War Type
ln GDP per capita -0.046 -0.015 -0.048 -0.059 (0.002)*** (0.250) (0.237) (0.126)
(GDP growth)t-1 -0.149 -0.033 -0.254 -0.316 (0.005)*** (0.672) (0.219) (0.116)
Primary Commodity 28.758 11.331 16.143 22.492 Exports/GDP (0.004)*** (0.149) (0.477) (0.293)
(Primary Commodity -51.485 -17.249 -37.606 -40.457 Exports/GDP)2 (0.016)** (0.247) (0.340) (0.283)
Social Fractionalization
-0.000 -0.000 -0.001 -0.001
(0.005)*** (0.671) (0.200) (0.121)
Ethnic Dominance 0.805 1.008 1.035 0.994 (45-90%) (0.085)* (0.095)* (0.403) (0.415)
Peace Duration -0.006 -0.000 -0.007 -0.006 (0.000)*** (0.864) (0.119) (0.131)
ln Population 1.082 0.353 1.871 2.331 (0.000)*** (0.144) (0.097)* (0.029)**
Geographic Dispersion
-4.020 -0.539 -6.760 -6.145
(0.008)*** (0.710) (0.124) (0.136)
Oil Dummy 1.835 (0.357)
Observations 688 688 41 42 No of events (war observations)
29 13 29 29
pseudo R2 0.35 0.06 0.37 0.38
Note: Logit regressions, all specifications include a constant, p values in parentheses, * significant at 10%; ** significant at 5%; *** significant at 1%.

36
Table 5A: Classification of Identity/Ideology Wars (Sambanis, 2000) Country Start of the
War End of the War
Identity War
Ideology War
Afghanistan 04/78 02/92 * Afghanistan 05/92 Ongoing * Algeria 07/62 12/62 * Algeria 05/91 Ongoing * Angola 02/61 11/75 * Angola 11/75 05/91 * Angola 09/92 Ongoing * Azerbaijan 04/91 10/94 * Bosnia 03/92 11/95 * Burma/Myanmar 68 10/80 * Burma/Myanmar 02/83 07/95 * Burundi 04/72 12/73 * Burundi 08/88 08/88 * Burundi 11/91 ongoing * Cambodia 03/70 10/91 * Chad 03/80 08/88 * China 01/67 09/68 * Columbia 04/84 ongoing * Congo 97 10/97 * Cyprus 07/74 08/74 * Dominican Rep. 04/65 09/65 * El Salvador 10/79 01/92 * Ethiopia 07/74 05/91 * Georgia 06/91 12/93 * Guatemala 07/66 07/72 * Guatemala 03/78 03/84 * Guinea-Bissau 12/62 12/74 * India 08/65 08/65 * India 84 94 * Indonesia 06/75 09/82 * Iran 03/74 03/75 Iran 09/78 12/79 * Iran 06/81 05/82 * Iraq 09/61 11/63 * Iraq 07/74 03/75 * Iraq 01/85 12/92 * Jordan 09/71 09/71 * Laos 07/60 02/73 * Lebanon 05/75 09/92 * Liberia 12/89 11/91 * Liberia 10/92 11/96 * Morocco 10/75 11/89 * Mozambique 10/64 11/75 Mozambique 07/76 10/92 *

37
Table 5A continued Country Start of the
War End of the War
Identity War
Ideology War
Nicaragua 10/78 07/79 * Nicaragua 03/82 04/90 * Nigeria 01/66 01/70 * Nigeria 12/80 08/84 * Pakistan 03/71 12/71 * Pakistan 01/73 07/77 * Peru 03/82 12/96 * Philippines 09/72 12/96 * Romania 12/89 12/89 * Russia 12/94 08/96 * Russia 09/99 Ongoing Rwanda 11/63 02/64 * Rwanda 10/90 07/94 * Sierra Leone 03/91 11/96 * Sierra Leone 05/97 07/99 Somalia 04/82 05/88 Somalia 05/88 12/92 * Sri Lanka 04/71 05/71 * Sri Lanka 07/83 ongoing * Sudan 10/63 02/72 * Sudan 07/83 ongoing * Tajikistan 04/92 12/94 * Turkey 07/91 ongoing * Uganda 05/66 06/66 * Uganda 10/80 04/88 * Vietnam 01/60 04/75 * Yemen 05/90 10/94 * Yemen, Arab Rep. 11/62 09/69 * Yemen, People’s Rep. 01/86 01/86 * Yugoslavia 04/90 01/92 * Yugoslavia 10/98 04/99 * Zaire/Dem. Rep. of Congo 07/60 09/65 * Zaire/Dem. Rep. of Congo 09/91 12/96 * Zaire/Dem. Rep. of Congo 09/97 09/99 Zimbabwe 12/72 12/79 * Note: Wars for which there is no indication whether they are identity or ideology wars are not included in the Sambanis data set.