The PMO in Practice - gpm-ipma.de · The PMO in Practice Dispersal – Acceptance – Performance...
44
The PMO in Practice Dispersal – Acceptance – Performance Measurement The study was carried out by the German Association for Project Management (GPM Deutsche Gesellschaft für Projektmanagement e. V.) in cooperation with Nürtingen-Geislingen University (HfWU Hochschule für Wirtschaft und Umwelt, Nürtingen-Geislingen). Empirical PMO Study 2013 / 14 KNOW-HOW
Transcript of The PMO in Practice - gpm-ipma.de · The PMO in Practice Dispersal – Acceptance – Performance...
The PMO in PracticeDispersal – Acceptance – Performance Measurement
The study was carried out by the German Association for Project Management (GPM Deutsche Gesellschaft für Projektmanagement e. V.) in cooperation with Nürtingen-Geislingen University (HfWU Hochschule für Wirtschaft und Umwelt, Nürtingen-Geislingen).
Empirical PMO Study 2013 / 14
KNOW-HOW

Authors
Prof. Christian Arndt Prof. Lorenz BraunMichael RibeiroStephen RietikerDr. Wolfram von Schneyder Prof. Steffen Scheurer
Contact
ifmme – Institute for Modern Management Development at Nürtingen-Geislingen University (HfWU)Sigmaringer Str. 1472622 Nü[email protected]
2

Brief DescriptionProject management is becoming ever more im-portant for many companies. This does not only imply running individual projects successfully but increasingly raises the question of: How can a whole portfolio of projects be managed success-fully? The Project Management Office (PMO) might be able to provide a few answers here.
Yet how does a PMO have to be integrated into the organisation? What tasks should be per-formed by a PMO? Can and must a PMO provide evidence for its added value for the organisation? Practice quickly poses these and further ques-tions.
The aim of the present study is to provide answers for these and other questions on the topic of PMO, which are particularly important for practitioners.
The research questions were identified togeth-er with experts from the sections "PMO" and "New Perspectives In Project Work" of the GPM Deutsche Gesellschaft für Projektmanagement e. V. (GPM) together with an advisory board of PMO practitioners. This focus on practice and the breadth of the question spectrum are in addition to the systematic application of scientific methods unique selling points of this study.
The main topics include, among others, the cur-rent dispersal and acceptance of PMOs and the contribution of PMOs to company success.
The total of 257 answers by PMO practitioners cover all stakeholder groups of the PMO from all sizes of organisations from all industries. The study serves as the kick-off for follow-up research in the coming years.

Table of Contents
Table of Figures 6
Preamble 8
1 Introduction 9
1.1 Background and Aim of the Study 9
1.2 Design of the Practice-Oriented Study 10
1.3 Character, Structure and Quality of the HfWU / GPM Survey 2013 10
2 Dispersal of PMOs 14
2.1 Preliminary Remarks 14
2.2 Frequency of PMOs in PMO-Close Organisations 14
2.3 Number of PMOs by the Organisation and Size of the PMOs 16
3 Acceptance of PMOs 18
3.1 Preliminary Remarks 18
3.2 Acceptance of PMOs in the Organisation 18
3.3 Acceptance of PMOs Among Stakeholders 18
3.4 Acceptance of PMOs Against the Background of Their Benefits, Their Strategic Integration and Performance Measurement in the PMO 20
4 Contribution of PMOs to Organisations 23
4.1 Preliminary Remarks 23
4.2 General Contributions of PMOs 23
4.3 Concrete Contributions of PMOs to the Organisation 23
5 Performance Measurement in PMOs 26
6 Features of Projects Managed by PMOs 29
6.1 Preliminary Remarks 29
6.2 Project Types of PMOs 29
6.3 Specialisation of PMOs 30
7 Tasks of PMOs 34
7.1 Preliminary Remarks 34
7.2 List of Precedence of the Tasks of PMOs 34
4
7.3 Influence of the Size of the Organisation and the Size of the PMO on the Exercise of Functions in the PMO 34
8 Strategic and Organisational Integration of PMOs 37
8.1 Preliminary Remarks 37
8.2 Strategic Integration of PMOs in the Organisation 37
8.3 Hierarchical and Organisational Integration of PMOs 38
8.4 Link Between Strategic Integration and Organisational Integration of the PMO 41
9 Summary 42
10 Annex 43
10.1 Further Research Requirements 43
10.2 Contributors to the Study 43
5

Table of Figures
Figure 1 Linking Practice and Science in the Context of this Study 10
Figure 2 Survey Participation by Stakeholder Groups of the PMO 11
Figure 3 Size Distribution for the Organisations Involved 12
Figure 4 Time for Which the PMOs Involved in the Study have been in Existence 12
Figure 5 Industry Distribution for the Organisations Involved 13
Figure 6 Frequency Distribution of PMOs 14
Figure 7 Proportion of Organisations with PMOs by Size of the Organisations 15
Figure 8 Average Number of PMOs per Organisation by Size of the Organisation 15
Figure 9 Average Number of PMOs per Organisation by Industry Group 16
Figure 10 Average Number of Projects Managed by PMOs by Size of the Organisation 17
Figure 11 Acceptance of the PMO in Practice 18
Figure 12 Acceptance of the PMO Among the Stakeholder Groups 19
Figure 13 Internal and External Estimate of the Acceptance of the PMO Among Selected Stakeholder Groups 20
Figure 14 Estimate of Benefits and Acceptance of PMOs in the Stakeholder Groups 21
Figure 15 Acceptance of the PMO in the Organisation 21
Figure 16 Acceptance of the PMO by Type of Performance Measurement 22
Figure 17 Acceptance of the PMO by Type of Performance Management II 22
Figure 18 General Contribution of the PMO 23
Figure 19 Concrete Contribution of the PMO 24
Figure 20 Contribution of the PMO from the Perspective of the PMO Manager and the Project Manager 24
Figure 21 Intensity of the Integration of the PMO in the Strategic Decision-Making and Control Processes of the Organisation 25
Figure 22 Distribution by Performance Measurement of PMOs 26
Figure 23 Performance Measurement for PMOs in Different Industries 27
Figure 24 Key Ratios for Measuring the Performance of PMOs 27
Figure 25 Distribution of the Project Budget in Relation to Project Features 29
Figure 26 Homogeneous and Heterogeneous Project Portfolios 30
6

Figure 27 Homogeneous and Heterogeneous Project Portfolios by Hierarchy Level of the PMOs 31
Figure 28 Internally and Externally Focused Project Portfolios 31
Figure 29 Proportion of PMOs with Homogeneous Project Portfolios 32
Figure 30 Distribution of the Project Budget in Relation to Project Features by Industry 33
Figure 31 Tasks Performed by a PMO in Practice 34
Figure 32 Influence of the Factors "PMO Size" and "Size of the Organisation" on the Perception of Selected Tasks in the PMO 35
Figure 33 Integration of the PMO in the Strategic Decision-Making and Strategic Control Processes of the Organisation 37
Figure 34 Differences in the Evaluation of the Strategic Integration of the PMO by Stakeholder Groups 38
Figure 35 Hierarchical Integration Level of the PMO 39
Figure 36 Organisational Integration of the PMO on the First Level by Size of the Organisation 39
Figure 37 Acceptance of the PMO in the Organisational Structure 40
Figure 38 Position of the PMO in the Line Organisation by the Size of the Organisation 40
Figure 39 Hierarchical Integration and Intensity of the Strategic Integration 41
Figure 40 Main Factors and Correlations 42
7

Preamble
After the initial PMO hype of the past years has now died down, and many large companies as well as medium-sized enterprises (as this study shows) have introduced a PMO in their organisa-tion, the PMO must now show that it contributes benefits for the organisations. The present PMO study, which was carried out by GPM Deutsche Gesellschaft für Projektmanagement e. V. in collaboration with ifmme – Institute for Modern Management Development at Nürtingen-Geislin-gen University at the end of 2013, impressively shows that this is the case to a larger extent than previously assumed.
I would like to mention one aspect of the study, which was food for thought. This study was able to disprove the hypothesis that PMOs are not very popular among different stakeholder groups in the organisations. Nevertheless, a problem with acceptance exists in the group of project managers. At first glance, this sounds contradic-tory: after all, it is one of the main tasks of PMOs to support and relieve projects and hence project managers in their work. And this is the target group most unwilling to accept PMOs?
But then I remembered my own time as a project manager in the automotive industry. One of the biggest problems of all project managers are chronic capacity bottlenecks. Staff resources are never enough. And as "entrepreneurs in the company", which is how project managers see themselves, budgets and resources are always scarce. And then there is the PMO: often integrated high up in the organisational hierarchy as a staff section and an apparent theoretical team working miles away from hands-on project business. Tasks such as implementing company strategy in project portfolios, designing control and reporting systems for projects or further
developing PM standards are important strategic tasks, but project managers who are always on the brink of their capacity limit in everyday project business with their team are more likely to view them not as help but possibly as only generating additional administrative requirements. This could result in the identified lack of appreciation that project managers have for the work of PMOs.
But if PMOs do not manage to demonstrate their benefit and contribution to the value of the organ-isation in a measurable way visible to everyone, then they run the risk of being sacrificed – at the latest at times of crisis.
In addition, PMOs must also develop further in terms of their content. In times of increasing com-plexity, volatility and uncertainty in the corporate environment, mastering an integrating, con-flict-solving project process design is required, which goes beyond linear project design and schematic project handling. This is where PMOs are facing new project guidance and governance tasks. On the one hand, this relates to the usual routines of trying out new ways, developing new process designs and designing new solutions. But on the other hand, project guidance and governance are more complex types of project management, which each and every organi-sation must develop individually. These tasks, which play an integral part in the future success of organisations, smooth the path of PMOs not only to project managers, but also to company management, and make every discussion on their contribution to benefits null and void in one fell swoop.
Berlin / Nuremberg, in September 2014
Prof. Yvonne G. Schoper GPM Deutsche Gesellschaft für Projektmanagement e. V. Board Member for Research
8

1.1 Background and Aim of the Study
Project management is becoming ever more im-portant for many companies. This does not only imply running individual projects successfully but increasingly raises the question of: How can a whole portfolio of projects be managed success-fully? The Project Management Office (PMO) might be able to provide a few answers here.
At the same time, it can be noted that – from the perspective of practitioners – many questions regarding the PMO still remain unanswered. Aim of the study: wide-ranging practice-rele-vant PMO know-how
The aim of the present study is to provide an-swers for these and questions on the other topic of the PMO, which are particularly important for practitioners.
The research questions were identified togeth-er with experts from the sections "PMO" and "New Perspectives in Project Work" of the GPM Deutsche Gesellschaft für Projektmanagement e. V. together with an advisory board of PMO practitioners. The themes, which the practitioners considered to be most important, include the cur-rent dispersal of PMOs, the acceptance of PMOs among different stakeholders and the contribution of PMOs to the success of the organisation.
In addition, the practitioners expressed a need for information regarding the question of how the success of PMOs is measured in practice, what are the features of the managed projects, what tasks PMOs perform in practice as well as whether and how PMOs are integrated in strategy formulation and in the hierarchy of organisations in the German-speaking region, i. e. Austria, Germany, and the German-speaking part of Switzerland.
The breadth of the question spectrum is at the same time a further unique selling point of this study and distinguishes it from former contri-butions, which had a narrower thematic focus or specific prioritisations.1 This comprehensive approach allows to identify dependencies be-tween single topics in order to work out the main success factors of the PMO.
Involvement of the PMO Community
Today, organisations and corporate consultan-cies are already experienced in setting up and managing PMOs. Using a three-step survey concept, not just PMO practitioners but also the project management community could be involved in creating the data basis. Access to the PMO stakeholders was during the GPM PMO Day and the PM Forum 2013, the biggest events of the project management community in the German-speaking region, as well as using internet-based surveys of identical content, which were advertised in a targeted manner in special-ised journals and newsletters.
This survey concept made it possible to reach all stakeholder groups of the PMO – PMO managers, PMO employees, project managers, project employees, medium- and upper-level line managers as well as top managers – from all industries and from organisations of all sizes. The study results are thus representative for the target group of PMO-close organisations in the German-speaking region.
The total of 257 responses from PMO practition-ers in the survey were evaluated using modern empirical methods. All correlations were checked systematically for statistical significance. The text carefully distinguishes between hypotheses, facts and the evaluation of the results. The outcomes are explained and visualised as clearly as possi-ble and in as much detail as required. The study serves as the kick-off for follow-up research in the coming years.
What is a PMO?
A Project Management Office (PMO) is permanently integrated into the project business of the organisation or a part of the organisation. As the process owner, it is responsible for the entirety of the processes shown here. It is a Centre of Competence, which further develops project management in the organisa-tion. The present study does not look at project offices, working on only a single project. The study bases its definition of the terms Project, Programme, etc. on DIN 699092.
1 see by way of example: Gemünden, H. G. / Dammer, H. / Jonas, D.: Die Zusammenarbeit der Akteure im Multiprojektmanagement. In: Steinle, C. / Eßeling, V. / Eichenberg, T. (ed.): Handbuch Multiprojekt-management und -controlling, 2008.
2 German Institute for Standardisation (Deutsches Institut für Normung e. V.), DIN 69901-5 Project management – Project management systems - Part 5: Concepts, Berlin 2009.
1 Introduction
9
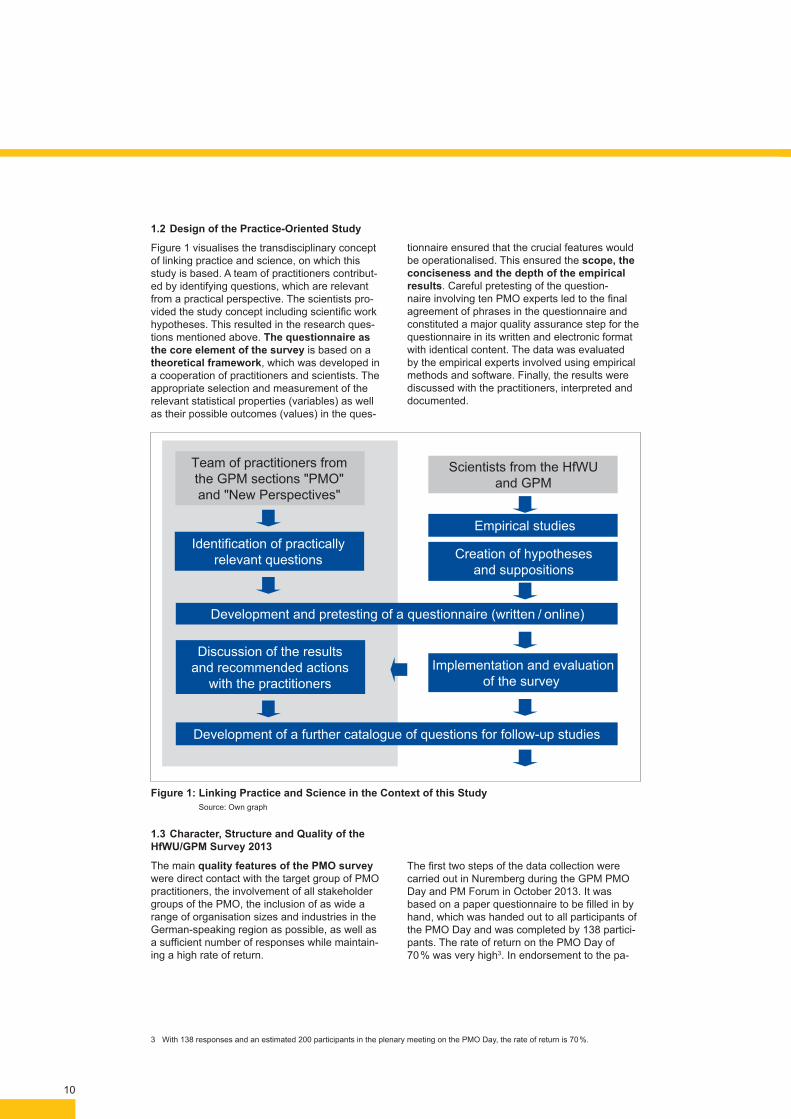
1.2 Design of the Practice-Oriented Study
Figure 1 visualises the transdisciplinary concept of linking practice and science, on which this study is based. A team of practitioners contribut-ed by identifying questions, which are relevant from a practical perspective. The scientists pro-vided the study concept including scientific work hypotheses. This resulted in the research ques-tions mentioned above. The questionnaire as the core element of the survey is based on a theoretical framework, which was developed in a cooperation of practitioners and scientists. The appropriate selection and measurement of the relevant statistical properties (variables) as well as their possible outcomes (values) in the ques-
tionnaire ensured that the crucial features would be operationalised. This ensured the scope, the conciseness and the depth of the empirical results. Careful pretesting of the question-naire involving ten PMO experts led to the final agreement of phrases in the questionnaire and constituted a major quality assurance step for the questionnaire in its written and electronic format with identical content. The data was evaluated by the empirical experts involved using empirical methods and software. Finally, the results were discussed with the practitioners, interpreted and documented.
1.3 Character, Structure and Quality of the HfWU/GPM Survey 2013
The main quality features of the PMO survey were direct contact with the target group of PMO practitioners, the involvement of all stakeholder groups of the PMO, the inclusion of as wide a range of organisation sizes and industries in the German-speaking region as possible, as well as a sufficient number of responses while maintain-ing a high rate of return.
The first two steps of the data collection were carried out in Nuremberg during the GPM PMO Day and PM Forum in October 2013. It was based on a paper questionnaire to be filled in by hand, which was handed out to all participants of the PMO Day and was completed by 138 partici-pants. The rate of return on the PMO Day of 70 % was very high3. In endorsement to the pa-
Team of practitioners fromthe GPM sections "PMO"and "New Perspectives"
Scientists from the HfWUand GPM
Development and pretesting of a questionnaire (written / online)
Identification of practicallyrelevant questions Creation of hypotheses
and suppositions
Discussion of the resultsand recommended actions
with the practitionersImplementation and evaluation
of the survey
Empirical studies
Development of a further catalogue of questions for follow-up studies
Figure 1: Linking Practice and Science in the Context of this Study Source: Own graph
3 With 138 responses and an estimated 200 participants in the plenary meeting on the PMO Day, the rate of return is 70 %.
10

per-based survey, an online survey with identical questions was carried out. The online survey, which was advertised in the magazine 'Projekt-management Aktuell' and in the GPM newsletter, was open from October 2013 until the end of January 2014. A further 119 responses from PMO stakeholders were gained in the online survey4. The data basis therefore has a return of N = 257 responses from the target group of practitioners in PMO-close organisations.
Figure 2 shows that the entirety of PMO stake-holders is represented in the data basis. With 85 responses (33 %), PMO managers are the largest group of stakeholders, followed by PMO employees with 64 responses (25 %), project managers with 46 responses (18 %) and line managers (a total of 23 responses, 9 %, from medium- and top-level managers are included in the data). In addition, three project employees and three top managers (each approx. 1 %) took part in the study5.
3
3
11
12
46
64
85
0 20 40 60 80Number of stakeholders involved in the study
Top manager /Board of directors
Project employees
Line manager(top level)
Line manager(intermediate level)
Project manager
PMO employees
PMO manager
Sta
keho
lder
gro
ups
of th
e P
MO
Remark: Response regarding the stakeholder group is missing for 33 participants
Figure 2: Survey Participation by Stakeholder Groups of the PMO Source: HfWU / GPM 2013 Survey on PMOs in Practice, own calculations
4 A rate of return cannot be determined here.5 These two last stakeholder groups are too small to be included in the stakeholder-specifi c partial analyses below.
11
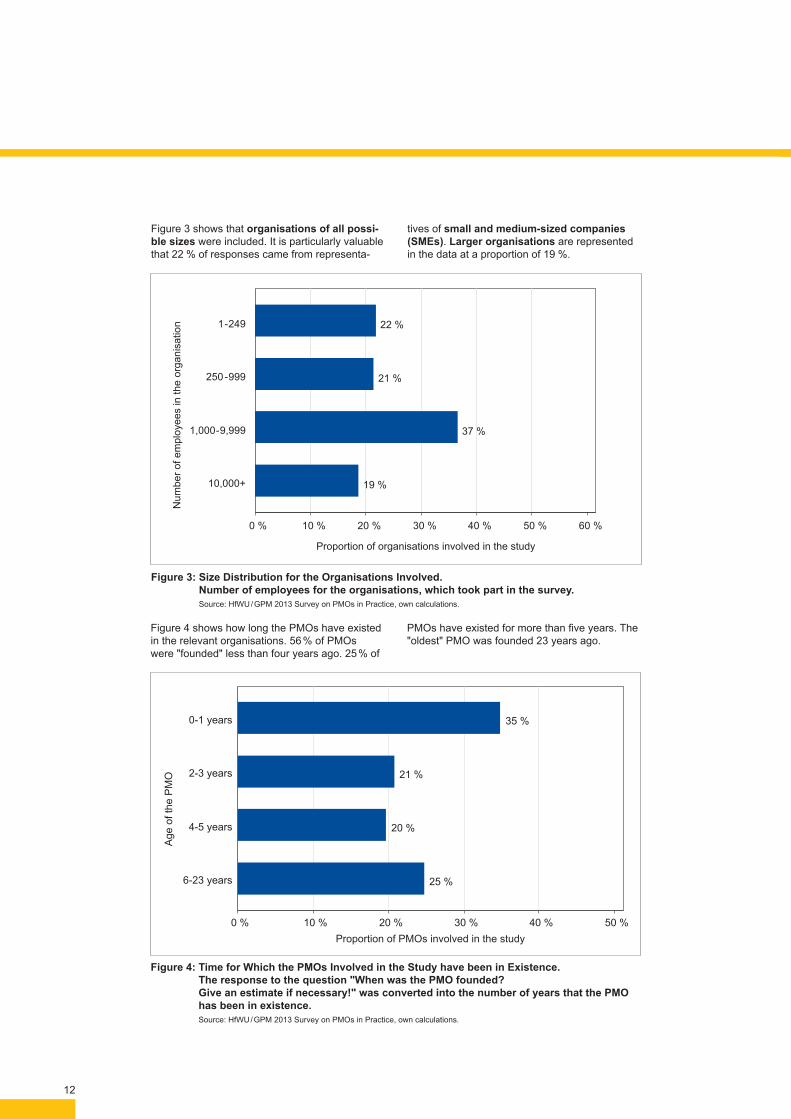
Figure 3 shows that organisations of all possi-ble sizes were included. It is particularly valuable that 22 % of responses came from representa-
tives of small and medium-sized companies (SMEs). Larger organisations are represented in the data at a proportion of 19 %.
Figure 3: Size Distribution for the Organisations Involved. Number of employees for the organisations, which took part in the survey.
Source: HfWU / GPM 2013 Survey on PMOs in Practice, own calculations.
19 %
37 %
21 %
22 %
0 % 10 % 20 % 30 % 40 % 50 % 60 %
Proportion of organisations involved in the study
10,000+
1,000-9,999
250-999
1-249
Num
ber o
f em
ploy
ees
in th
e or
gani
satio
n
Figure 4 shows how long the PMOs have existed in the relevant organisations. 56 % of PMOs were "founded" less than four years ago. 25 % of
PMOs have existed for more than five years. The "oldest" PMO was founded 23 years ago.
Figure 4: Time for Which the PMOs Involved in the Study have been in Existence. The response to the question "When was the PMO founded? Give an estimate if necessary!" was converted into the number of years that the PMO has been in existence.
Source: HfWU / GPM 2013 Survey on PMOs in Practice, own calculations.
25 %
20 %
21 %
35 %
0 % 10 % 20 % 30 % 40 % 50 %Proportion of PMOs involved in the study
6-23 years
4-5 years
2-3 years
0-1 years
Age
of t
he P
MO
12

Figure 5 documents that the sample comprises the entire range of industries and that as a result, PMO-close organisations exist in all indus-tries (independent of whether these organisations have a PMO or not). The industry groups were selected based on the industry keys used by the IAB Establishment Panel, a survey of employers conducted by the Institute for Employment Re-search (IAB) of the German Federal Employment Office.
The results and conclusions of this study are therefore based on the participation of all major stakeholder groups and all major types of or-ganisation i. e. organisations from all size groups and all industries. The number of observations is sufficiently large for the reliable results.
The basic features of the sample already show that PMOs constitute a cross-sectional topic
for all organisations, regardless of their size and industry. As a result, PMOs are in no way only interesting to large organisations. There has been a need for PMOs in practice for more than two decades. The fact that these were newly founded or reopened shows that the need for PMOs continues unabated or has even gone up. Unfortunately, the data do not allow to distinguish between new or replacement PMOs. The question how long PMOs have been in existence can neither be answered based on the data available.
The focus on the target group of PMO-close organisations also means that some of the results, particularly those regarding the dispersal of PMOs in Chapter 2, might be representative of PMO-close organisations, but they are not representative of the entirety of organisations in the German-speaking region.
Figure 5: Industry Distribution for the Organisations Involved. "Which industry does your organisation belong to?"
Source: HfWU / GPM 2013 Survey on PMOs in Practice, own calculations.
Number of organisations involved in the study
Other services
Public administration
Business administrationand consultancy
Financial and insurance services
Information and communication
Trade, transport
Other manufacturing industries
Manufacture of cars
Machinery
Chemicals and pharmaceuticals
Power and water supply
Indu
stry
gro
ups
Remark: Two organisations are agricultural businesses (not represented).Response regarding the industry sector is missing for 14 organisations.
0 20 40 60
29
11
11
29
56
17
28
19
17
13
11
13

Figure 7 shows that the proportion of organisa-tions, which run a PMO officially or unofficially, is between 67 % and 83 % for all size classes. The frequency of PMOs in the sample is therefore
at a similar level across all organisation sizes. This explicitly also applies to small and medi-um-sized enterprises (SMEs).
2.1 Preliminary Remarks
Interest in PMOs is high within the project man-agement community and among those responsi-ble in the organisations. The number of organisa-tions which currently run a PMO, and which these are, had previously been unknown. It had only been possible to guess which organisations run several PMOs, what sizes the PMOs have and how the PMOs are distributed across the different industries.
2.2 Frequency of PMOs in PMO-Close Organi-sations
Suppositions and Hypotheses
It is assumed that larger organisations can "afford" a PMO easier than smaller organisations.
This supposition leaves unclear whether PMOs are also interesting to smaller organisations in practice. It is generally not known how many organisations organise their project business within a PMO.
Results
Figure 6 shows that 80 % of the organisations involved in the study run a PMO officially or unofficially. 8 % of organisations are planning to introduce a PMO. 12 % of organisations are not running a PMO and have stated that they are not planning to introduce a PMO in the foreseeable future.
12 %
8 %
10 %
70 %
0 % 20 % 40 % 60 % 80 %Proportion of organisations involved in the study
no, a PMO is not expectedto be established
no, but there are concreteplans for a PMO
yes, unofficially
yes, officially
Figure 6: Frequency Distribution of PMOs. "Does your organisation run a PMO?" Source: HfWU / GPM 2013 Survey on PMOs in Practice, own calculations.
2 Dispersal of PMOs
14
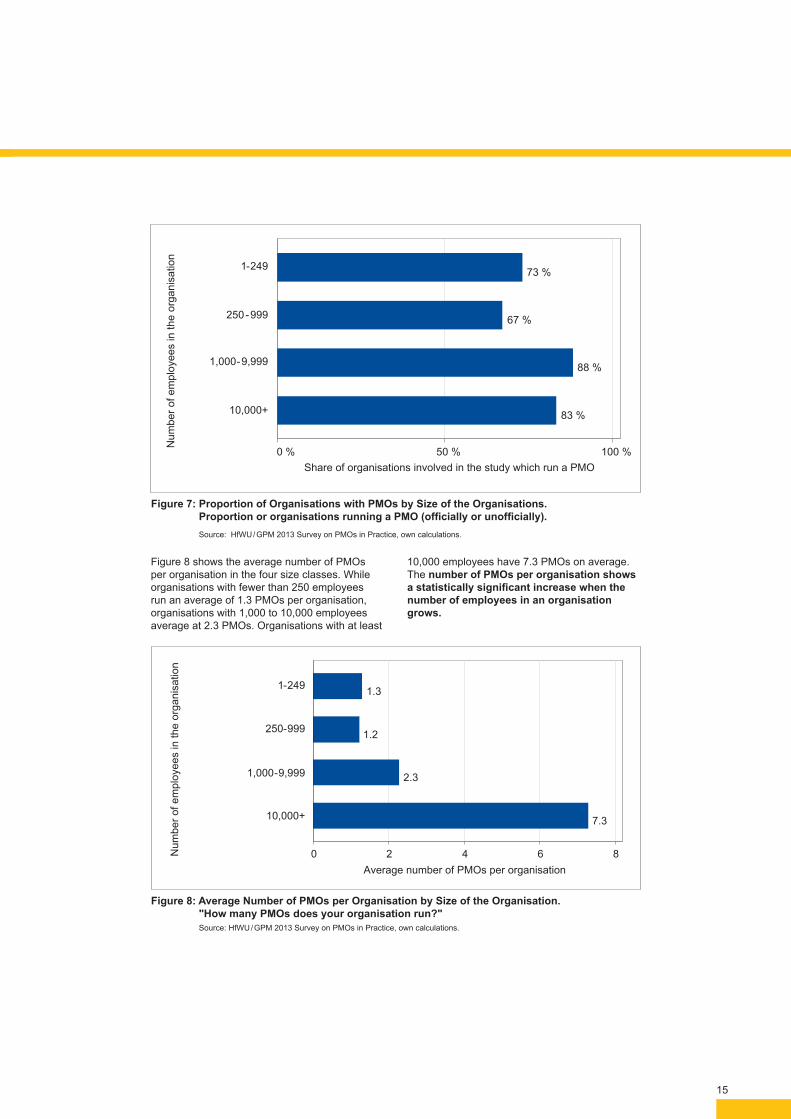
Figure 8 shows the average number of PMOs per organisation in the four size classes. While organisations with fewer than 250 employees run an average of 1.3 PMOs per organisation, organisations with 1,000 to 10,000 employees average at 2.3 PMOs. Organisations with at least
10,000 employees have 7.3 PMOs on average. The number of PMOs per organisation shows a statistically significant increase when the number of employees in an organisation grows.
83 %
88 %
67 %
73 %
0 % 50 % 100 %Share of organisations involved in the study which run a PMO
10,000+
1,000-9,999
250-999
1-249
Num
ber o
f em
ploy
ees
in th
e or
gani
satio
n
Figure 7: Proportion of Organisations with PMOs by Size of the Organisations. Proportion or organisations running a PMO (officially or unofficially). Source: HfWU / GPM 2013 Survey on PMOs in Practice, own calculations.
Figure 8: Average Number of PMOs per Organisation by Size of the Organisation. "How many PMOs does your organisation run?"
Source: HfWU / GPM 2013 Survey on PMOs in Practice, own calculations.
7.3
2.3
1.2
1.3
0 2 4 6 8Average number of PMOs per organisation
10,000+
1,000-9,999
250-999
1-249
Num
ber o
f em
ploy
ees
in th
e or
gani
satio
n
15

Figure 10 shows that the more employees an organisation has in practice, the more projects a PMO will manage. In organisations with fewer than 500 employees, each PMO looks after an average of 35.3 projects. By contrast, in organisations with at least 1,000 and fewer than 10,000 employees, PMOs manage 92 projects on average. In organisations with more than 10,000
employees, each PMO actually looks after 106 projects. Regressions can be used to show that a PMO manages 1 % more projects on average if the number of employees increases by 10 %. However, comparing the different age groups of PMOs, the number of projects managed by the PMO is largely the same (no figure).
Interpretation and Evaluation
It is apparent that not just interest in but also the degree of dispersion of PMOs is currently very high among PMO-close companies. The subject of PMO is not just interesting to large companies, as many SMEs have also set up a PMO. When assessing costs and benefits, many SMEs apparently decide in favour of a PMO. We interpret this result to mean that PMOs can also provide added value for SMEs.
2.3 Number of PMOs by the Organisation and Size of the PMOs
Suppositions and Hypotheses
Larger companies often face the challenge of having to manage several PMOs. The number of projects managed by a PMO can depend on the
size of the company, and it is possible for a PMO to be looking after a growing number of projects as it gets older.
Results
Figure 9 shows that the average number of PMOs of an organisation varies across indus-tries. Whereas the industry "Manufacture of cars" has an average of 9.3 PMOs per organisation, an organisation in the industry "Administration and corporate consultancy" has one PMO on average. Using regression, it can be shown that the comparatively high number of PMOs in the industry "Manufacture of cars" is rather due to the higher number of employees per organisations in this industry group.
Figure 9: Average Number of PMOs per Organisation by Industry Group. "How many PMOs does your organisation run?"
Source: HfWU / GPM 2013 Survey on PMOs in Practice, own calculations.
Average number of PMOs per organisation
Other services
Public administration
Business administration and consultancy
Financial and insurance services
Information and communication
Trade, transport
Other manufacturing industries
Manufacture of cars
Machine construction
Chemicals and pharmaceuticals
Power and water supply
Indu
stry
gro
up
2.3
1.4
1.0
2.6
2.0
1.4
1.8
9.3
4.6
3.9
4.8
0 2 4 6 8 10
16

Interpretation and Evaluation
The analyses show that larger companies have several PMOs. The industry "Manufacture of cars", in which many companies are above aver-age in size, exhibits an especially high number of PMOs per organisation. This raises the ques-tion what kind of coordination is required to manage the activities of several PMOs in an organisation.
It is a fact that a PMO that belongs to a larger organisation also tends to manage more projects per PMO. As a result, the character of PMOs might vary between small and large organisa-tions (also see Chapter 7, where it is shown that the size of the organisation and the size of the PMO significantly impact on the range of tasks performed by the PMO). The number of projects managed by a PMO does not increase systemati-cally with increasing age of the PMO.
106.1
91.8
42.5
35.3
0 20 40 60 80 100
Average number of projects per PMO
10,000+
1,000-9,999
250-999
1-249
Num
ber o
f em
ploy
ees
in th
e or
gani
satio
n
Figure 10: Average Number of Projects Managed by PMOs by Size of the Organisation. Source: HfWU / GPM 2013 Survey on PMOs in Practice, own calculations.
17
3 Acceptance of PMOs
3.1 Preliminary Remarks
Acceptance of the PMO among colleagues and supervisors in the organisation is a major soft factor for the success of the PMO in practice. Previously, it was only possible to guess to what extent stakeholders actually accept the PMO, where stakeholders experience acceptance defi-cits, and which factors determine acceptance of the PMO. Among them, the focus is on the bene-fits of the PMO to the organisation, the strategic integration of the PMO and on the presence of performance measurement within the PMO.
3.2 Acceptance of PMOs in the Organisation
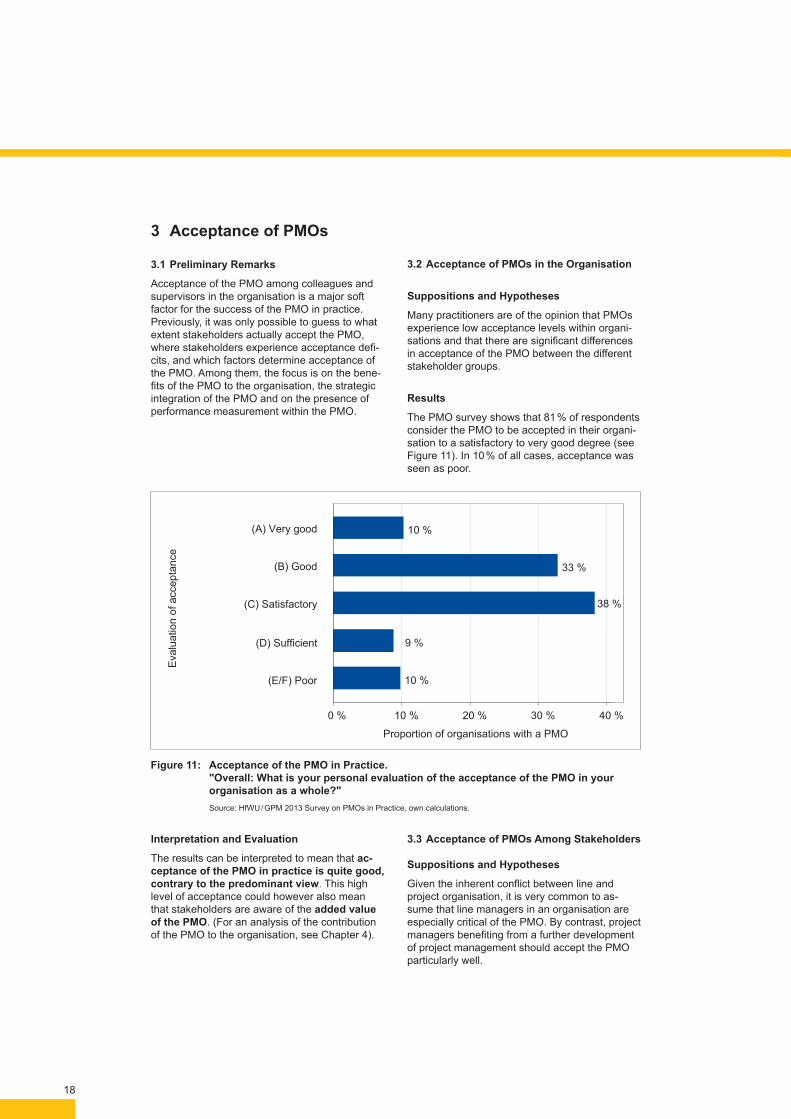
Suppositions and Hypotheses
Many practitioners are of the opinion that PMOs experience low acceptance levels within organi-sations and that there are significant differences in acceptance of the PMO between the different stakeholder groups.
Results
The PMO survey shows that 81 % of respondents consider the PMO to be accepted in their organi-sation to a satisfactory to very good degree (see Figure 11). In 10 % of all cases, acceptance was seen as poor.
Interpretation and Evaluation
The results can be interpreted to mean that ac-ceptance of the PMO in practice is quite good, contrary to the predominant view. This high level of acceptance could however also mean that stakeholders are aware of the added value of the PMO. (For an analysis of the contribution of the PMO to the organisation, see Chapter 4).
3.3 Acceptance of PMOs Among Stakeholders
Suppositions and Hypotheses
Given the inherent conflict between line and project organisation, it is very common to as-sume that line managers in an organisation are especially critical of the PMO. By contrast, project managers benefiting from a further development of project management should accept the PMO particularly well.
Figure 11: Acceptance of the PMO in Practice. "Overall: What is your personal evaluation of the acceptance of the PMO in your organisation as a whole?"
Source: HfWU / GPM 2013 Survey on PMOs in Practice, own calculations.
10 %
9 %
38 %
33 %
10 %
0 % 10 % 20 % 30 % 40 %
Proportion of organisations with a PMO
(E/F) Poor
(D) Sufficient
(C) Satisfactory
(B) Good
(A) Very good
Eva
luat
ion
of a
ccep
tanc
e
18
Results
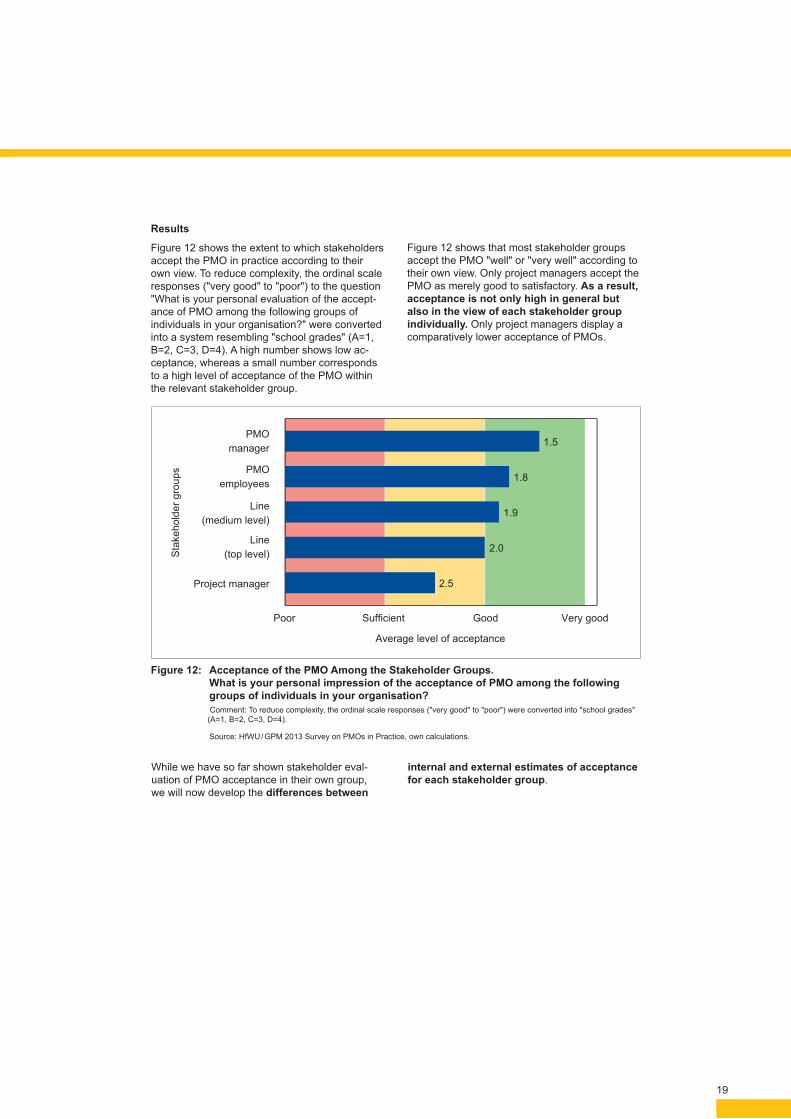
Figure 12 shows the extent to which stakeholders accept the PMO in practice according to their own view. To reduce complexity, the ordinal scale responses ("very good" to "poor") to the question "What is your personal evaluation of the accept-ance of PMO among the following groups of individuals in your organisation?" were converted into a system resembling "school grades" (A=1, B=2, C=3, D=4). A high number shows low ac-ceptance, whereas a small number corresponds to a high level of acceptance of the PMO within the relevant stakeholder group.
Figure 12 shows that most stakeholder groups accept the PMO "well" or "very well" according to their own view. Only project managers accept the PMO as merely good to satisfactory. As a result, acceptance is not only high in general but also in the view of each stakeholder group individually. Only project managers display a comparatively lower acceptance of PMOs.
While we have so far shown stakeholder eval-uation of PMO acceptance in their own group, we will now develop the differences between
internal and external estimates of acceptance for each stakeholder group.
2.5
2.0
1.9
1.8
1.5
Poor Very goodGoodSufficient
Average level of acceptance
Project manager
Line(top level)
Line(medium level)
PMOemployees
PMOmanager
Sta
keho
lder
gro
ups
Figure 12: Acceptance of the PMO Among the Stakeholder Groups.What is your personal impression of the acceptance of PMO among the following groups of individuals in your organisation?
Comment: To reduce complexity, the ordinal scale responses ("very good" to "poor") were converted into "school grades" (A=1, B=2, C=3, D=4).
Source: HfWU / GPM 2013 Survey on PMOs in Practice, own calculations.
19
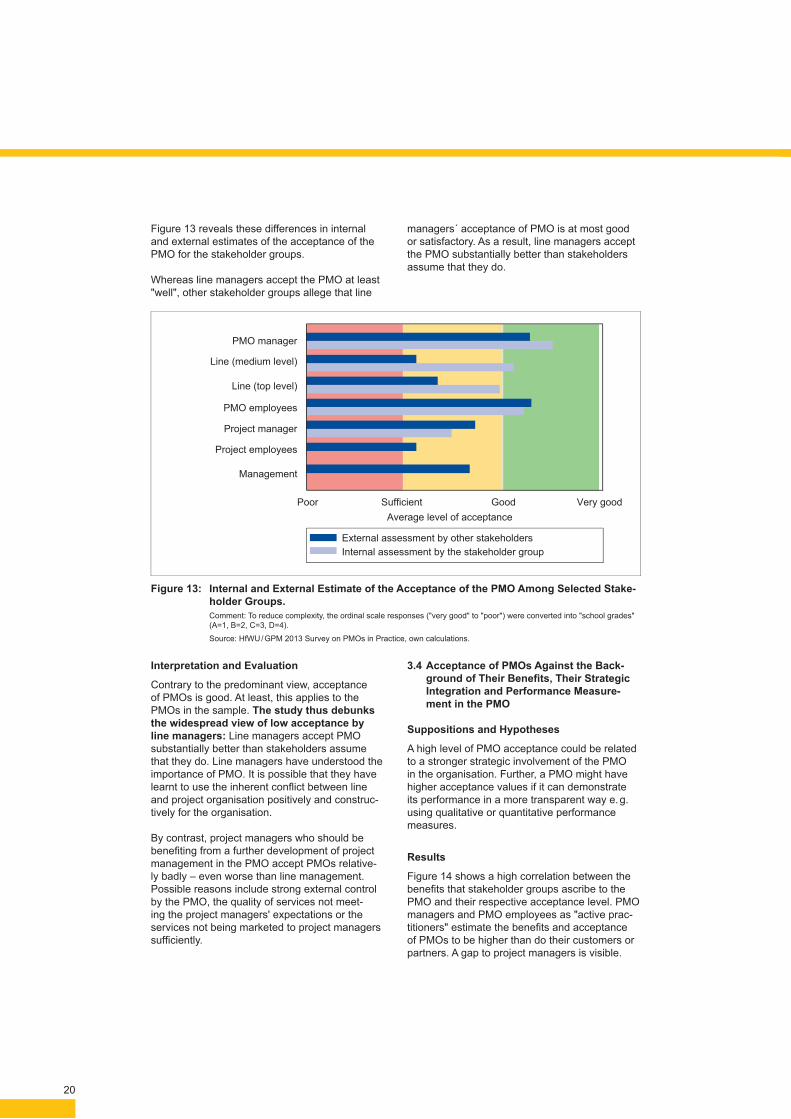
Figure 13 reveals these differences in internal and external estimates of the acceptance of the PMO for the stakeholder groups.
Whereas line managers accept the PMO at least "well", other stakeholder groups allege that line
managers´ acceptance of PMO is at most good or satisfactory. As a result, line managers accept the PMO substantially better than stakeholders assume that they do.
Interpretation and Evaluation
Contrary to the predominant view, acceptance of PMOs is good. At least, this applies to the PMOs in the sample. The study thus debunks the widespread view of low acceptance by line managers: Line managers accept PMO substantially better than stakeholders assume that they do. Line managers have understood the importance of PMO. It is possible that they have learnt to use the inherent confl ict between line and project organisation positively and construc-tively for the organisation.
By contrast, project managers who should be benefi ting from a further development of project management in the PMO accept PMOs relative-ly badly – even worse than line management. Possible reasons include strong external control by the PMO, the quality of services not meet-ing the project managers' expectations or the services not being marketed to project managers suffi ciently.
3.4 Acceptance of PMOs Against the Back-ground of Their Benefi ts, Their Strategic Integration and Performance Measure-ment in the PMO
Suppositions and Hypotheses
A high level of PMO acceptance could be related to a stronger strategic involvement of the PMO in the organisation. Further, a PMO might have higher acceptance values if it can demonstrate its performance in a more transparent way e. g. using qualitative or quantitative performance measures.
Results
Figure 14 shows a high correlation between the benefi ts that stakeholder groups ascribe to the PMO and their respective acceptance level. PMO managers and PMO employees as "active prac-titioners" estimate the benefi ts and acceptance of PMOs to be higher than do their customers or partners. A gap to project managers is visible.
Very goodGoodSufficientPoorAverage level of acceptance
Management
Project employees
Project manager
PMO employees
Line (top level)
Line (medium level)
PMO manager
External assessment by other stakeholdersInternal assessment by the stakeholder group
Figure 13: Internal and External Estimate of the Acceptance of the PMO Among Selected Stake-holder Groups.
Comment: To reduce complexity, the ordinal scale responses ("very good" to "poor") were converted into "school grades" (A=1, B=2, C=3, D=4).
Source: HfWU / GPM 2013 Survey on PMOs in Practice, own calculations.
20

The results in Figure 15 show that an intensive strategic involvement and good acceptance of PMOs are linked systematically. In organi-sations which closely involve the PMO in their strategic decision-making and control pro-cesses, the PMO is accepted well or very well in approx. 60 % of the cases. Acceptance in organisations where the PMO is not strategically
involved at all is only 20 %. These differences are statistically signifi cant. This evaluation does not show whether a clear directional causality exists, i. e. whether intensive strategic involve-ment results in high acceptance of the PMO, whether causality runs in the opposite direction, or whether both variables are pushed in the same direction by a third factor.
PMO manager
Line (medium level)
Line (top level)
PMOemployees
Project manager
Very good
Good
Satisfactory
Poor
Acc
epta
nce
of th
e P
MO
in th
e st
akeh
olde
r gro
up
Mor
e ex
pens
eth
an in
com
e
Doe
s no
har
m,
prov
ides
no
bene
fits
Hel
pful
Ver
y va
luab
le
Indi
spen
sabl
e
Assessment of the benefits of the PMO for the organisation by the stakeholder group
Figure 14: Estimate of Benefi ts and Acceptance of PMOs in the Stakeholder Groups. Source: HfWU / GPM 2013 Survey on PMOs in Practice, own calculations.
Figure 15: Acceptance of the PMO in the Organisation."Overall: What is your personal evaluation of the acceptance of PMO in your organi-sation as a whole?"
Source: HfWU / GPM 2013 Survey on PMOs in Practice, own calculations.
3 18 36 15 27
8 36 41 8 8
11 40 36 9 4
30 30 35 4
0 % 25 % 50 % 75 % 100 %
Not involvedat all
Less intensive
Intensive
Very intensive
Stra
tegi
c in
tegr
atio
n of
the
PM
O
Very good Good SatisfactoryAdequate Poor
Acceptance of the PMO
21

Figures 16 and 17 show that PMO acceptance in organisations is generally better if its perfor-mance is measured. Whereas 37 % of PMOs are accepted well or very well without performance measurement, this is the case with 44 % of PMOs whose performance is measured either quali-tatively or quantitatively. The proportion among
PMOs whose performance is measured quan-titatively is 76 %. Acceptance is significantly higher in organisations where performance is measured quantitatively. It is worth noting that not a single PMO where success is measured quantitatively was accepted only adequately or poorly by the respondents.
Interpretation and Evaluation
A strategic involvement of PMOs and quantitative performance measurement within PMOs seem to be key for PMO acceptance. However, a strategic
involvement could also be interpreted as a result of a good acceptance of PMOs in the organisa-tion.
Figure 16: Acceptance of the PMO by Type of Performance Measurement. "Overall: What is your personal evaluation of the acceptance of PMOs in your organ-isation as a whole?"
Source: HfWU / GPM 2013 Survey on PMOs in Practice, own calculations.
20.7 55.2 24.1
12.5 31.3 40.6 9.4 6.3
7.9 28.6 40.7 10.7 12.1
0 % 25 % 50 % 75 % 100 %
Quantitative
Qualitative
None
Per
form
ance
mea
sure
men
t of t
he P
MO
Very good Good SatisfactoryAdequate Poor
Acceptance of the PMO
10.5 89.5
16.7 83.3
26.0 74.0
39.4 60.6
47.6 52.4
0 % 25 % 50 % 75 % 100 %
Poor
Adequate
Satisfactory
Good
Very good
Acc
epta
nce
of th
e P
MO
Qualitative or quantitativeNone
Performance measurement at the PMO
Figure 17: Acceptance of PMO by Type of Performance Measurement II. "Overall: What is your personal evaluation of the acceptance of PMOs in your organ-isation as a whole?”
Source: HfWU / GPM 2013 Survey on PMOs in Practice, own calculations.
22
4.1 Preliminary Remarks
The question to what degree a PMO can add value to a company is of key interest to all PMO practitioners. Given the difficulties of quantifying this "added value" in this study PMO stakehold-ers were asked non-specifically for their opinion about the contribution that "a PMO can gener-ally make in organisations". In order to specify this general contribution to organisations a little further though (see Chapter 4.2), a ques-tion regarding the type of contribution in the respondent's organisation (see Chapter 4.3) was added. Again, the answers from the different stakeholder groups were compared.
4.2 General Contributions of PMOs
Suppositions and Hypotheses
It is generally assumed that PMOs provide added value for organisations.
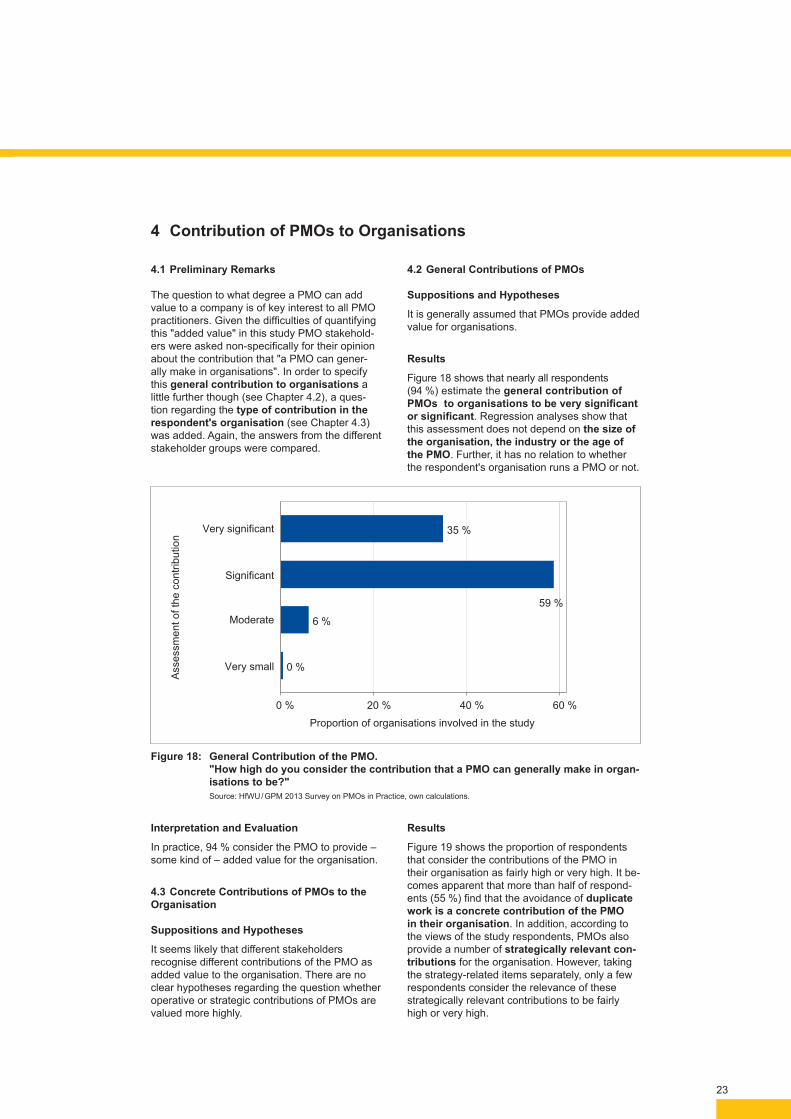
Results
Figure 18 shows that nearly all respondents (94 %) estimate the general contribution of PMOs to organisations to be very significant or significant. Regression analyses show that this assessment does not depend on the size of the organisation, the industry or the age of the PMO. Further, it has no relation to whether the respondent's organisation runs a PMO or not.
Interpretation and Evaluation
In practice, 94 % consider the PMO to provide –some kind of – added value for the organisation.
4.3 Concrete Contributions of PMOs to the Organisation
Suppositions and Hypotheses
It seems likely that different stakeholders recognise different contributions of the PMO as added value to the organisation. There are no clear hypotheses regarding the question whether operative or strategic contributions of PMOs are valued more highly.
Results
Figure 19 shows the proportion of respondents that consider the contributions of the PMO in their organisation as fairly high or very high. It be-comes apparent that more than half of respond-ents (55 %) find that the avoidance of duplicate work is a concrete contribution of the PMO in their organisation. In addition, according to the views of the study respondents, PMOs also provide a number of strategically relevant con-tributions for the organisation. However, taking the strategy-related items separately, only a few respondents consider the relevance of these strategically relevant contributions to be fairly high or very high.
0 %
6 %
59 %
35 %
0 % 20 % 40 % 60 %
Proportion of organisations involved in the study
Very small
Moderate
Significant
Very significant
Ass
essm
ent o
f the
con
tribu
tion
4 Contribution of PMOs to Organisations
Figure 18: General Contribution of the PMO. "How high do you consider the contribution that a PMO can generally make in organ-isations to be?"
Source: HfWU / GPM 2013 Survey on PMOs in Practice, own calculations.
23
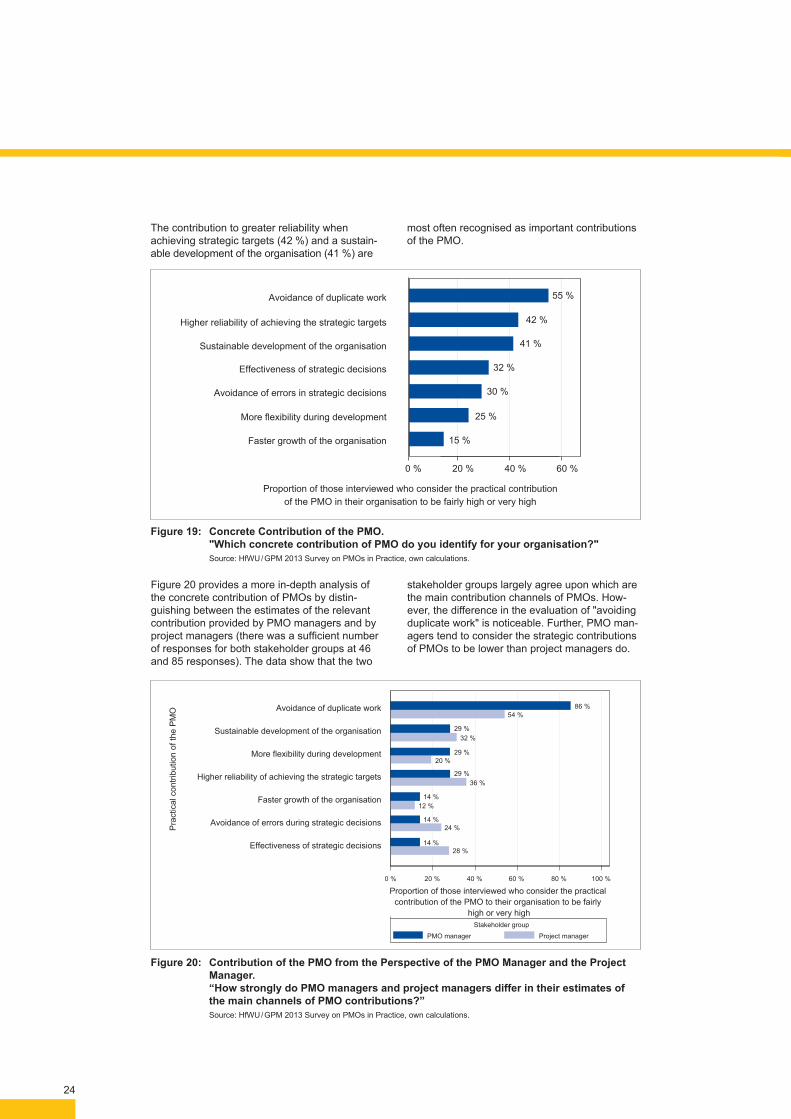
Figure 20 provides a more in-depth analysis of the concrete contribution of PMOs by distin-guishing between the estimates of the relevant contribution provided by PMO managers and by project managers (there was a sufficient number of responses for both stakeholder groups at 46 and 85 responses). The data show that the two
stakeholder groups largely agree upon which are the main contribution channels of PMOs. How-ever, the difference in the evaluation of "avoiding duplicate work" is noticeable. Further, PMO man-agers tend to consider the strategic contributions of PMOs to be lower than project managers do.
Figure 20: Contribution of the PMO from the Perspective of the PMO Manager and the Project Manager. “How strongly do PMO managers and project managers differ in their estimates of the main channels of PMO contributions?”
Source: HfWU / GPM 2013 Survey on PMOs in Practice, own calculations.
0 % 20 % 40 % 60 % 80 % 100 %
Proportion of those interviewed who consider the practical contribution of the PMO to their organisation to be fairly
high or very high
Avoidance of errors during strategic decisions
Effectiveness of strategic decisions
Faster growth of the organisation
Higher reliability of achieving the strategic targets
More flexibility during development
Sustainable development of the organisation
Avoidance of duplicate work
Pra
ctic
al c
ontri
butio
n of
the
PM
O
PMO manager Project manager
Stakeholder group
28 %14 %
24 %14 %
12 %14 %
36 %29 %
20 %29 %
32 %29 %
54 %86 %
Figure 19: Concrete Contribution of the PMO. "Which concrete contribution of PMO do you identify for your organisation?"
Source: HfWU / GPM 2013 Survey on PMOs in Practice, own calculations.
15 %
25 %
30 %
32 %
41 %
42 %
55 %
0 % 20 % 40 % 60 %
Proportion of those interviewed who consider the practical contributionof the PMO in their organisation to be fairly high or very high
Faster growth of the organisation
More flexibility during development
Avoidance of errors in strategic decisions
Effectiveness of strategic decisions
Sustainable development of the organisation
Higher reliability of achieving the strategic targets
Avoidance of duplicate work
The contribution to greater reliability when achieving strategic targets (42 %) and a sustain-able development of the organisation (41 %) are
most often recognised as important contributions of the PMO.
24
However, the importance of the specific strategic contributions of PMOs to the organisation must be put into perspective, considering that the majority of study respondents consider PMOs to have a limited or no strategic involvement.
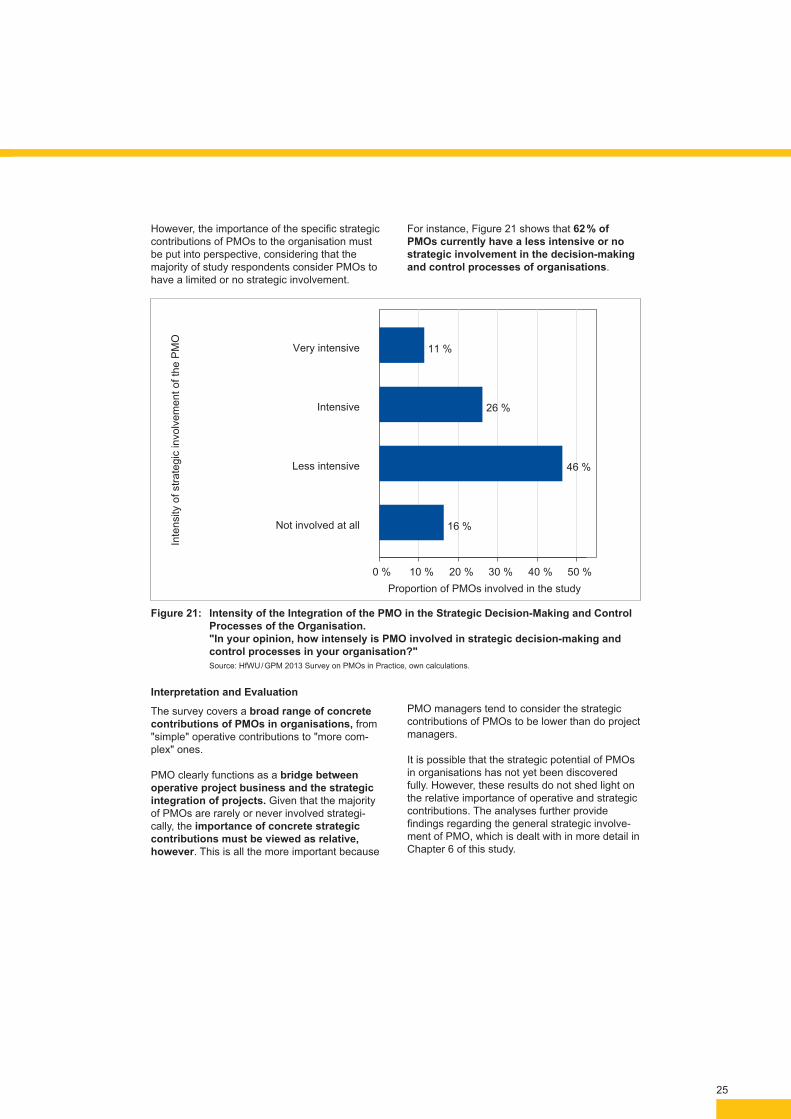
For instance, Figure 21 shows that 62 % of PMOs currently have a less intensive or no strategic involvement in the decision-making and control processes of organisations.
Interpretation and Evaluation
The survey covers a broad range of concrete contributions of PMOs in organisations, from "simple" operative contributions to "more com-plex" ones.
PMO clearly functions as a bridge between operative project business and the strategic integration of projects. Given that the majority of PMOs are rarely or never involved strategi-cally, the importance of concrete strategic contributions must be viewed as relative, however. This is all the more important because
PMO managers tend to consider the strategic contributions of PMOs to be lower than do project managers.
It is possible that the strategic potential of PMOs in organisations has not yet been discovered fully. However, these results do not shed light on the relative importance of operative and strategic contributions. The analyses further provide findings regarding the general strategic involve-ment of PMO, which is dealt with in more detail in Chapter 6 of this study.
16 %
46 %
26 %
11 %
0 % 10 % 20 % 30 % 40 % 50 %Proportion of PMOs involved in the study
Not involved at all
Less intensive
Intensive
Very intensive
Inte
nsity
of s
trate
gic
invo
lvem
ent o
f the
PM
O
Figure 21: Intensity of the Integration of the PMO in the Strategic Decision-Making and Control Processes of the Organisation. "In your opinion, how intensely is PMO involved in strategic decision-making and control processes in your organisation?"
Source: HfWU / GPM 2013 Survey on PMOs in Practice, own calculations.
25

Figure 23 shows there are significant differenc-es across industries regarding the distribu-tion of performance measurement in PMOs. It is particularly noticeable that 60 % of PMOs in the "Manufacture of cars" industry measure performance qualitatively or quantitatively –
a much higher proportion than in other indus-tries. By contrast, the also high frequency in the industry "Administration and consultancy" is not statistically significant, what might be due to the low number of responses from organisations in this industry.
Figure 22: Distribution by Performance Measurement of PMOs. "Do you 'measure' PMO performance in your organisation, either qualitatively or quantitatively?"
Source: HfWU / GPM 2013 Survey on PMOs in Practice, own calculations.
Preliminary Remarks
Performance measurement is a particular challenge for all PMO managers. It is not only seen as difficult but also as essential for man-aging PMOs and developing them further within organisations. The question which performance measures are applied in practice is of particular interest to PMO practitioners.
Suppositions and Hypotheses
The assumption that a PMO would provide added value for an organisation is often sufficient grounds for starting a PMO in practice. But, it can be assumed that PMOs must provide concrete evidence of their performance in order to obtain additional budgets and expand.
Such evidence of performance probably is one of the most difficult challenges of PMO practice. Given that it is generally easier to implement qualitative than quantitative performance meas-
urement processes, it can be expected that PMO performance has so far been measured more frequently by qualitative than by quantitative measures.
Results
Figure 22 shows the frequency and the types of performance measurement processes involved in the study. The data allow us to distinguish between qualitative and quantitative processes. The analysis shows that 70 % and thus the vast majority of PMOs measure their performance neither qualitatively nor quantitatively. 30 % of PMOs measure their performance either quali-tatively or quantitatively. 14 % of PMOs meas-ure their performance quantitatively. Using regression, it can be shown that the frequency with which PMOs measure their performance bears no relation to the number of employees in the organisation or the age of the PMOs.
5 Performance Measurement in PMOs
14 %
30 %
70 %
0 % 20 % 40 % 60 % 80 %
Proportion of PMOs involved in the study
Quantitative
Qualitative orQuantitative
No measurement
Det
ails
of t
he p
erfo
rman
ce m
easu
rem
ent
in th
e P
MO
26

30 %
25 %
57 %
18 %
20 %
36 %
35 %
60 %
27 %
20 %
33 %
0 % 25 % 50 % 75 %Share
Other services
Public administration
Business administration and consultancy
Financial and insurance services
Information and communication
Trade, transport
Other manufacturing industries
Manufacture of cars
Machine construction
Chemicals and pharmaceuticals
Power and water supply
Indu
stry
gro
up
Figure 23: Performance Measurement for PMOs in Different Industries. "Do you 'measure' PMO performance in your organisation, either qualitatively or quantitatively?"
Source: HfWU / GPM 2013 Survey on PMOs in Practice, own calculations.
Figure 24 shows the value that is ascribed to selected criteria used in qualitative or quantita-tive performance measurement processes in the PMOs. "Compliance with the project manage-ment process" is mentioned most frequently (75 %) as is "Target achievement for the man-aged projects". This is followed by "Controllability of the project portfolio", "Feasibility of the planned project portfolio" and "Degree of implementation
of the planned project portfolio". This means that PMO practitioners consider the most important tasks of PMOs to consist in standardising the process using performance measurement. In second place, this is followed by key ratios used to evaluate single projects. Third in line in terms of performance measurements are services at project portfolio level.
Figure 24: Key Ratios for Measuring the Performance of PMOs. "What importance does your organisation attach to the following circumstances or key ratio in measuring the performance of PMOs in your organisation?"
Source: HfWU / GPM 2013 Survey on PMOs in Practice, own calculations.
58 %
61 %
62 %
73 %
75 %
0 % 20 % 40 % 60 % 80 %Proportion of those interviewed who considerthe role of this aspect to be high or very high
Degree of implementation of the plannedproject portfolio
Feasibility of the planned project portfolio
Controllability of the project portfolio
Target achievement for the managed projects
Compliance with the project management process
27
Interpretation and Evaluation
Given the difficulty of performance measurement, it must be stated that a third of PMOs apply systematic performance meas-urement processes. But the vast majority of PMOs measure performance neither qualitatively nor quantitatively.
The importance of quantitative performance measurement for PMOs becomes apparent from its positive influence on the acceptance of PMOs (see Chapter 3). Considering how important it is for the acceptance and financing of PMOs to pro-vide evidence of performance, PMO practitioners
must catch up particularly regarding quantita-tive performance measurement.
Looking at the details, it becomes apparent that performance measurement in PMOs is used both for individual projects and at project portfolio level. Significant differences in the frequency of performance measurement show up when comparing industries. Given the results, it can be supposed that organisations in the in-dustry "Manufacture of cars" have special needs of concrete performance measurement in PMOs due to high competition.
28
6.1 Preliminary Remarks
The features of the projects managed in the PMOs have a pivotal impact on the nature of the work and development of a PMO in practice. They comprise different project types, such as projects whose purpose is research and develop-ment (R&D) or which focus on the IT infrastruc-ture (see Chapter 6.2). What we do not know so far is how frequently and under what conditions PMOs specialise in homogeneous project port-folios, or have more mixed project portfolios (see Chapter 6.3). It also is of importance whether a PMO primarily manages projects with an internal or with an external, customer-related, focus (see Chapter 6.4).
6.2 Project Types of PMOs
Suppositions and Hypotheses
It makes sense to assume that in practice, PMOs manage different project types at the same time. The partners from science and practice involved
in the study suggested in advance and as a hypothesis that the project types IT projects, R&D projects, investment and organisational projects are seen as particularly relevant in practice.
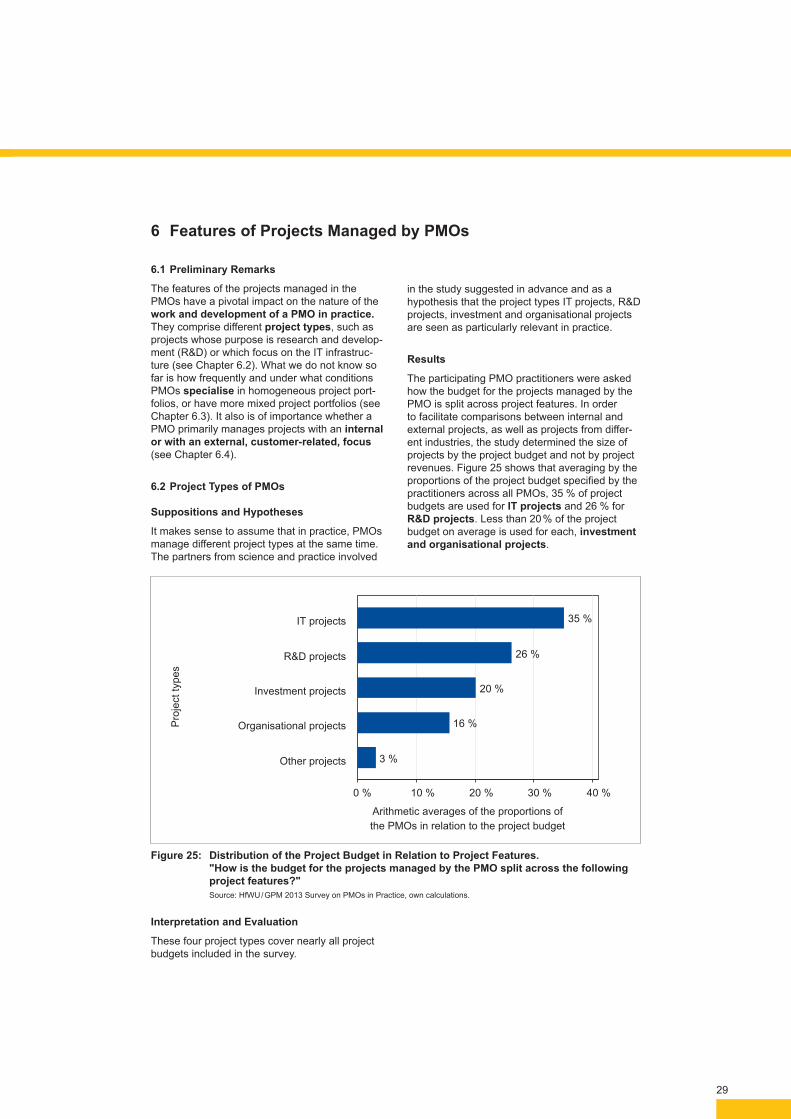
Results
The participating PMO practitioners were asked how the budget for the projects managed by the PMO is split across project features. In order to facilitate comparisons between internal and external projects, as well as projects from differ-ent industries, the study determined the size of projects by the project budget and not by project revenues. Figure 25 shows that averaging by the proportions of the project budget specified by the practitioners across all PMOs, 35 % of project budgets are used for IT projects and 26 % for R&D projects. Less than 20 % of the project budget on average is used for each, investment and organisational projects.
6 Features of Projects Managed by PMOs
3 %
16 %
20 %
26 %
35 %
0 % 10 % 20 % 30 % 40 %
Arithmetic averages of the proportions ofthe PMOs in relation to the project budget
Other projects
Organisational projects
Investment projects
R&D projects
IT projects
Pro
ject
type
s
Figure 25: Distribution of the Project Budget in Relation to Project Features. "How is the budget for the projects managed by the PMO split across the following project features?"
Source: HfWU / GPM 2013 Survey on PMOs in Practice, own calculations.
Interpretation and Evaluation
These four project types cover nearly all project budgets included in the survey.
29

Figure 27 shows that, as expected, homogenei-ty is more prevalent on lower hierarchy levels and therefore, as a result, specialised PMOs are more frequent on lower levels in practice.
To be precise, of the PMOs at first management level, 21 % are homogeneous in terms of project types. By contrast, the proportion for PMOs at second or third management level is 40 %.
Figure 26: Homogeneous and Heterogeneous Project Portfolios. Proportion of PMOs with homogeneous and heterogeneous project portfolios by type of project managed.
Source: HfWU / GPM 2013 Survey on PMOs in Practice, own calculations.
6.3 Specialisation of PMOs
Suppositions and Hypotheses
Results obtained so far still do not reveal to what extent PMOs have specialised in individual project types and as such have a "homogeneous" project portfolio.
In this context, it is likely that PMOs look after either "internal" or "external" projects. We also do not know whether specific patterns are pre-dominant in practice regarding the distribution of the project budget to project types or project specialisations.
It can be assumed that, the higher a PMO is po-sitioned in the organisational hierarchy, the more likely it is to manage different project types. By contrast, homogeneous PMOs would occur more frequently on lower levels, where there is also often a greater focus in terms of expertise.
In addition, the organisation's industry and the age of the PMO might have an impact on the type of the project portfolio.
Results
Figure 26 shows the degree of "homogeneity" of the PMO or its specialisation towards four pro-ject types. It reveals that 66 % of PMOs manage several different types of projects at the same time. 34 % of PMOs look after only one type of project. Project portfolios are called "homoge-neous" if at least 90 percent of the project budget is used for one project type. 15 % of PMOs deal almost exclusively with R&D projects, and the portfolios of 12.5 % of PMOs consist almost entirely of IT projects. 5 % of PMOs almost only look after investment projects.
15.0 12.5 5.0
1.9
65.6
0 % 10 % 20 % 30 % 40 % 50 % 60 % 70 % 80 % 90 % 100 %Proportion of all organisations with a PMO
... R&D projects
... IT projects
... Investment projects
... Organisational projectsPMOs with different project types
PMOs where at least 90 % of the project budget relates to …
30

The proportion of PMOs specialising in either internal or external projects is slightly larger still. The project portfolio of 56 % of PMOs con-sists almost exclusively of either internal or
external projects (for customers), with internal projects making up a far larger percentage. 44 % of PMOs look after both internal and exter-nal projects.
0 % 10 % 20 % 30 % 40 % 50 % 60 % 70 % 80 % 90 % 100 %
2nd or 3rd level
1st level
Hie
rarc
hica
l lev
el o
f the
PM
O
... homogeneous project portfolio
... heterogeneous project portfolio
Proportion of PMOs with a ...
40 % 60 %
21 % 79 %
Figure 27: Homogeneous and Heterogeneous Project Portfolios by Hierarchy Level of the PMOs. Proportion of PMOs with homogeneous and heterogeneous project portfolio by the PMO's hierarchy level.
Source: HfWU / GPM 2013 Survey on PMOs in Practice, own calculations.
Figure 28: Internally and Externally Focused Project Portfolios. Proportion of PMOs with project portfolios focused exclusively on internal or on external projects.
Source: HfWU / GPM 2013 Survey on PMOs in Practice, own calculations.
0 % 10 % 20 % 30 % 40 % 50 % 60 % 70 % 80 % 90 % 100 %Proportion of all organisations with a PMO
at least 90 % of the budget in internal projectsat least 90 % of the budget in external projectsmixed (internal / external)
Focus of the PMO project portfolio
40.7 15.3 43.9
More profound results are revealed on investi-gating to what extent specialisation on project content coincides with an internal or external focus in practice.
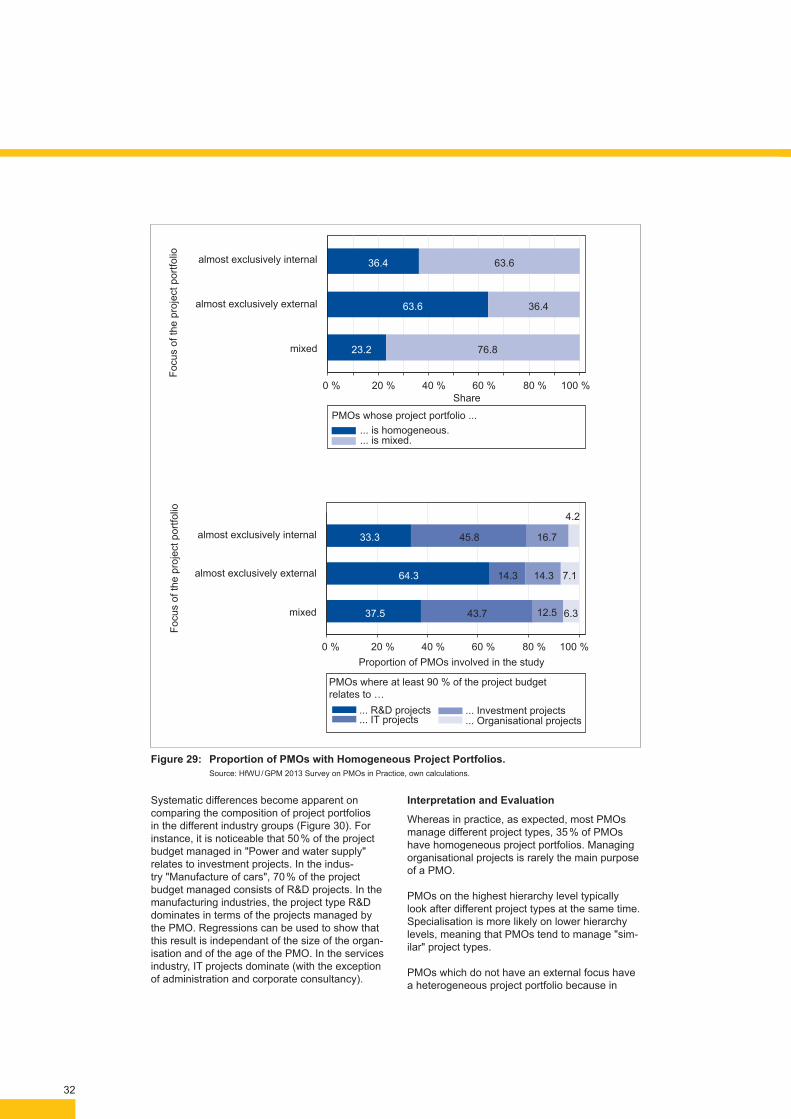
PMOs that are focused almost exclusively on external projects (for customers) tend to work on homogeneous project portfolios, consisting
almost exclusively of the project types IT, R&D, investment and organisational projects (see Figure 29). There is a statistically significant re-lationship between homogeneity of project types and focus of the project portfolio on internal or external projects. In particular, PMOs with an ex-ternal focus primarily work on R&D projects.
31
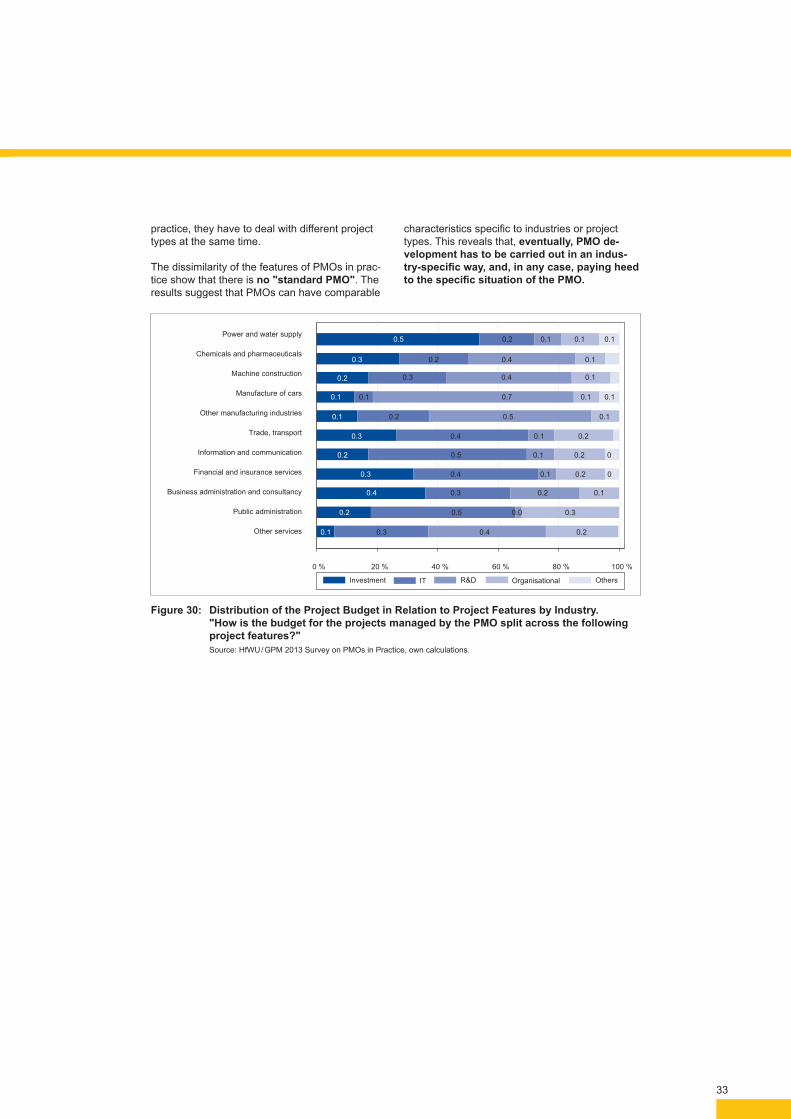
Systematic differences become apparent on comparing the composition of project portfolios in the different industry groups (Figure 30). For instance, it is noticeable that 50 % of the project budget managed in "Power and water supply" relates to investment projects. In the indus-try "Manufacture of cars", 70 % of the project budget managed consists of R&D projects. In the manufacturing industries, the project type R&D dominates in terms of the projects managed by the PMO. Regressions can be used to show that this result is independant of the size of the organ-isation and of the age of the PMO. In the services industry, IT projects dominate (with the exception of administration and corporate consultancy).
Interpretation and Evaluation
Whereas in practice, as expected, most PMOs manage different project types, 35 % of PMOs have homogeneous project portfolios. Managing organisational projects is rarely the main purpose of a PMO.
PMOs on the highest hierarchy level typically look after different project types at the same time. Specialisation is more likely on lower hierarchy levels, meaning that PMOs tend to manage "sim-ilar" project types.
PMOs which do not have an external focus have a heterogeneous project portfolio because in
Figure 29: Proportion of PMOs with Homogeneous Project Portfolios. Source: HfWU / GPM 2013 Survey on PMOs in Practice, own calculations.
23.2 76.8
63.6 36.4
36.4 63.6
0 % 20 % 40 % 60 % 80 % 100 %Share
mixed
almost exclusively external
almost exclusively internal
Focu
s of
the
proj
ect p
ortfo
lio
... is homogeneous.
... is mixed.
PMOs whose project portfolio ...
37.5 43.7 12.5 6.3
64.3 14.3 14.3 7.1
33.3 45.8 16.7
4.2
0 % 20 % 40 % 60 % 80 % 100 %Proportion of PMOs involved in the study
mixed
almost exclusively external
almost exclusively internal
Focu
s of
the
proj
ect p
ortfo
lio
... R&D projects
... IT projects... Investment projects... Organisational projects
PMOs where at least 90 % of the project budgetrelates to …
32
0 % 20 % 40 % 60 % 80 % 100 %
Other services
Public administration
Business administration and consultancy
Financial and insurance services
Information and communication
Trade, transport
Other manufacturing industries
Manufacture of cars
Machine construction
Chemicals and pharmaceuticals
Power and water supply
Investment IT R&D Organisational Others
0.1 0.3 0.4 0.2
0.2 0.5 0.0 0.3
0.4 0.3 0.2 0.1
0.3 0.4 0.1 0.2 0
0.2 0.5 0.1 0.2 0
0.3 0.4 0.1 0.2
0.1 0.2 0.5 0.1
0.1 0.1 0.7 0.1 0.1
0.2 0.3 0.4 0.1
0.3 0.2 0.4 0.1
0.5 0.2 0.1 0.1 0.1
Figure 30: Distribution of the Project Budget in Relation to Project Features by Industry. "How is the budget for the projects managed by the PMO split across the following project features?"
Source: HfWU / GPM 2013 Survey on PMOs in Practice, own calculations.
practice, they have to deal with different project types at the same time.
The dissimilarity of the features of PMOs in prac-tice show that there is no "standard PMO". The results suggest that PMOs can have comparable
characteristics specific to industries or project types. This reveals that, eventually, PMO de-velopment has to be carried out in an indus-try-specific way, and, in any case, paying heed to the specific situation of the PMO.
33

It is interesting that the ranking of tasks is largely independent of the management level, the age of the PMO, its strategic involvement and the acceptance of the PMO.
Interpretation and Evaluation
Nearly all PMOs in the organisations carried out essential basic tasks. The development of meth-ods, processes, tools and templates dominate here. Overall, the PMOs perform both operative and strategic tasks. The ranking does not reveal a "structure".
7.3 Influence of the Size of the Organisation and the Size of the PMO on the Exercise of Functions in the PMO
Suppositions and Hypotheses
We had already assumed that the size of the organisation and the size of the PMO could be factors impacting on the type and scope of tasks, which the PMOs perform within organisations. For example, it can be conjectured that, the higher the number of projects managed by the PMO, the more likely it is for the PMO to carry out project portfolio management. It can further
Figure 31: Tasks Performed by a PMO in Practice. "What Tasks does the PMO Perform in your Organisation?”
Source: HfWU / GPM 2013 Survey on PMOs in Practice, own calculations.
0 % 25 % 50 % 75 % 100 %Proportion of PMOS, which e. g.also perform the relevant tasks
Provision of project managers
Resource management
Assuming responsibility for the performance of individual projects
Quality management, e. g. by monitoring quality gates
Shared services
Educational offers in project management
Project monitoring
Creation and further development of a project management community
Project portfolio management
Provision of support services for individual projects
Coaching for project managers
Multi-project reporting
Development of methods, processes, tools and templates
47 %
52 %
53 %
60 %
62 %
68 %
70 %
75 %
76 %
79 %
81 %
87 %
98 %
7.1 Preliminary Remarks
The analysis of the tasks of PMOs supplement the previous results on project types and can offer clues regarding a PMO's focus on operative or strategic tasks. In particular, we will examine whether external factors such as the size of the organisation or the size of the PMO impact on the type and scope of tasks performed by the PMO.
7.2 List of Precedence of the Tasks of PMOs
Suppositions and Hypotheses
It is known that PMOs cover a large range of op-erative and, at times, also strategic tasks. What we do not know, however, is how frequently they actually exercise which tasks. Some tasks, such as development and the maintenance of project
management processes and methods, can be assumed to be typical basic tasks of a PMO and should therefore already be widespread in practice.
Results
Figure 31 presents a ranking of selected tasks sorted by the frequency with which PMOs perform these tasks in practice. Almost all PMOs in the survey carry out the task "Development of methods, processes, tools and templates". More than three quarters of all PMOs involved in the study also perform multi-project reporting, coaching for project managers, provide support services for individual projects or run project portfolio management.
7 Tasks of PMOs
34

be presumed that, with increasing organisational size, a PMO will not only look after operative standard tasks but also after additional tasks.
Results
In order to find as systematic a structure as possible regarding the tasks performed by PMOs, it was investigated whether the range of tasks of a PMO relates to its size and to the size of the organisation. The results were summarized in a matrix (see Figure 32). It must be stressed that this is not a "theoretical" typology as can be found in textbooks, but a concrete empirical evaluation of the tasks performed by PMOs in the German-speaking region.
Three different types of relations were investigat-ed for each of the 13 tasks, and it was checked whether there is evidence for a statistically significant relation with the factor "PMO size" or the factor "Size of organisation". Below, we use the term 'influence' to denote that at least two of the three model variants display a statistically significant relation ("5 % significance level").
Figure 32 shows that in practice, the frequen-cy with which specific tasks are performed clearly depends on the size of the PMO or the organisation, and that other tasks are performed independently of these factors. The tasks "Quality management", "Education-al offers in PM" and "Coaching for project managers" as well as "Shared Services" depend on the factors PMO size and size of the organisation.
The tasks "Project portfolio management" and "Multi-project reporting" as well as "Resource management" merely depend on the factor PMO size. The factor 'Size of the organisation' does not have an influence. 50 % of PMOs, which
look after up to ten projects, perform project port-folio management. In the PMO classes with more than ten projects, this proportion is 75 % to 84 %. It is surprising that the frequency of the task "Project portfolio management" already increases significantly starting from a threshold of ten man-aged projects. It is interesting that as many as 50 % of PMOs with up to ten projects stated that they perform project portfolio management.
The tasks "Creation and further development of a project management community" and "Provision of support services for individual projects" depend only on the factor 'Size of the organisation'. The factor 'PMO size' does not have an influence. 61 % of PMOs of organisa-tions with fewer than 250 employees perform the task "Creation and further development of a project management community". This rises to 84 % for organisations with more than 10,000 employees. Interestingly, it becomes apparent that "Creation and further development of a project management community" is the only task where there is a significant positive relation to the number of PMOs in the organisation.
The tasks "Project controlling", "Provision of project managers", "Development of meth-ods, processes, tools and templates" and "Acceptance of responsibility for the perfor-mance of individual projects" are independent of the two factors. They are influenced neither by the number of projects managed by the PMO nor by the number of employees in the organisa-tion. The task "Provision of project managers" is already performed quite frequently where there is a small number of managed projects.
Interpretation and Evaluation
All PMOs perform basic tasks irrespectively of the size of the PMO or that of the organisation.
Is the task carried out by the PMO more frequentlythe more managed projects there are in the PMO?
no yes
Is the task carried out by the PMO
more frequentlythe more employees
there are in theorganisation?
yes
no
Factor"Size of the organisation"
I Creation and further developmentof a PM community
I Provision of support servicesfor individual projects
I Quality ManagementI Educational offer in PMI Coaching for project managersI Shared services
I Development of methods,processes, tools and templates
I Project monitoringI Transfer of responsibility for the
performance of individual projectsI Provision of project managers
I Project portfolio managementI Multi-project reportingI Resource management
Factor "PMO size"
Figure 32: Influence of the Factors "PMO Size" and "Size of the Organisation" on the Perception of Selected Tasks in the PMO.
Source: HfWU / GPM 2013 Survey on PMOs in Practice, own calculations.
35

The development of methods, processes, tools and templates dominate here.
In some categories of tasks, economies of scale or size-specific, possibly strategic requirements, appear to be relevant for the exertion of tasks by the PMO. For larger PMOs, this might e. g. apply to project portfolio management, multi-project re-porting or for carrying out resource management.
Generally, it can be taken for sure that the range of tasks performed by PMOs expands with the size of the PMO or the size of the organisation in question.
36
8.1 Preliminary Remarks
Once an organisation has made the general decision to manage project work using a PMO, in practice this raises the question of the strategical and organisational positioning of the PMO within the organisation.
What role can the PMO play in terms of formu-lating, implementing and monitoring strategies (see Chapter 8.2)? In practice, where are PMOs typically positioned in the organisational structure (see Chapter 8.3)? Is there an interdependency between the strategic position and the position within the organisation (see chapter 8.4)?
8.2 Strategic Integration of PMOs in the Or-ganisation
Suppositions and Hypotheses
Analyses so far have shown that PMOs perform both organisational and strategic tasks. It can be
conjectured that PMOs add the most value to the organisation where they are closely integrated into the organisation's strategy. However, we can merely speculate how strongly PMOs are cur-rently integrated into strategy formulation within organisations.
Results
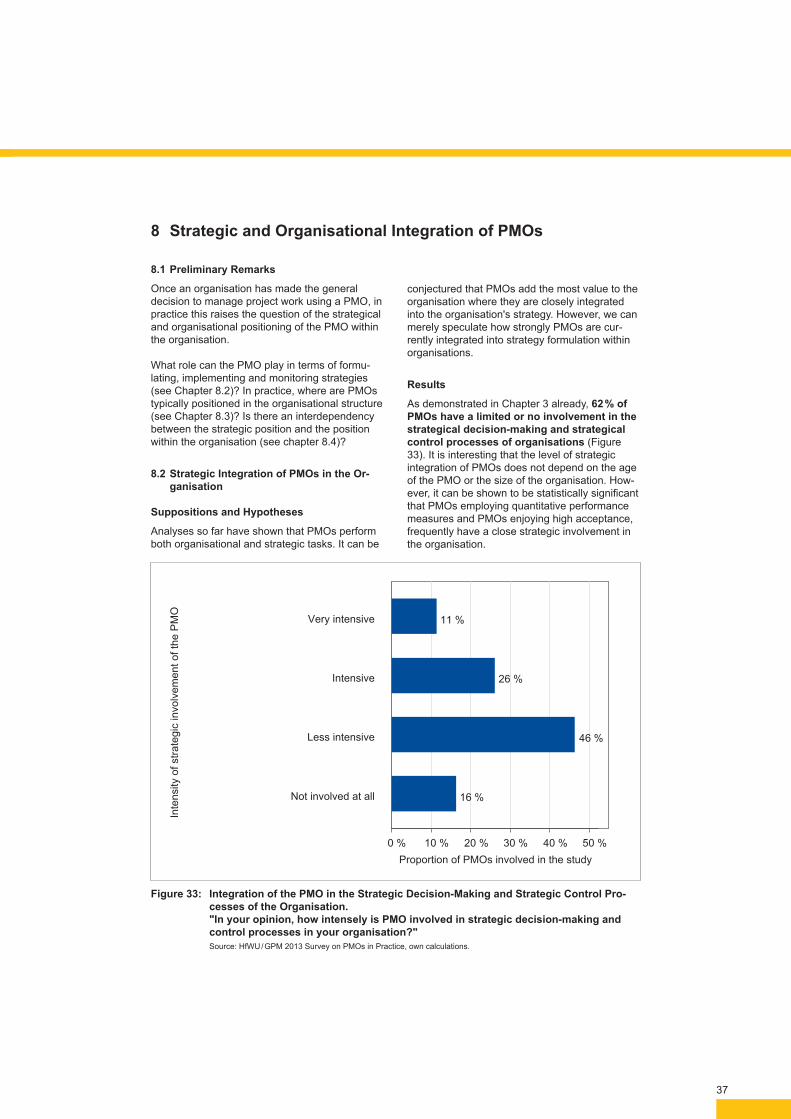
As demonstrated in Chapter 3 already, 62 % of PMOs have a limited or no involvement in the strategical decision-making and strategical control processes of organisations (Figure 33). It is interesting that the level of strategic integration of PMOs does not depend on the age of the PMO or the size of the organisation. How-ever, it can be shown to be statistically significant that PMOs employing quantitative performance measures and PMOs enjoying high acceptance, frequently have a close strategic involvement in the organisation.
8 Strategic and Organisational Integration of PMOs
16 %
46 %
26 %
11 %
0 % 10 % 20 % 30 % 40 % 50 %Proportion of PMOs involved in the study
Not involved at all
Less intensive
Intensive
Very intensive
Inte
nsity
of s
trate
gic
invo
lvem
ent o
f the
PM
O
Figure 33: Integration of the PMO in the Strategic Decision-Making and Strategic Control Pro-cesses of the Organisation. "In your opinion, how intensely is PMO involved in strategic decision-making and control processes in your organisation?"
Source: HfWU / GPM 2013 Survey on PMOs in Practice, own calculations.
37

Interpretation and Evaluation
Figure 34 shows that different stakeholder groups estimate the degree of strategic integration of PMOs very differently. 54 % of PMO managers
state that the PMO is closely or very closely integrated into the organisation, but only 26 % of project managers agree with this.
8.3 Hierarchical and Organisational Integra-tion of PMOs
Suppositions and Hypotheses
It has been surmised that in practice, managers often view PMOs as staff sections and as such generally reject them. It will therefore be exciting to see whether in practice, PMOs are largely positioned as staff sections – possibly in order to deny PMOs direct managerial authority. The type of tasks performed by the PMO (operative or strategic) can also impinge on the positioning of the PMO within the organisation's "organi-gram" and determine whether the PMO is more likely to be a staff or a line section, or whether it will be positioned on the first or the second
management level. One can further conjecture that PMOs might be better established within a company with increasing age and therefore more frequently tend to perform a line function. Finally, the organisational position of PMOs as staff or line sections might also influence acceptance of the PMOs.
Results
Figure 35 shows that 60 % of PMOs are posi-tioned on the first or second management level.
Figure 34: Differences in the Evaluation of the Strategic Integration of the PMO by Stakeholder Groups. Proportion of respondents which think that the PMO in their organisation is closely or very closely integrated in strategic decision-making and strategic control processes.
Source: HfWU / GPM 2013 Survey on PMOs in Practice, own calculations.
17 %
26 %
29 %
32 %
50 %
54 %
0 % 20 % 40 % 60 %Proportion of PMOs which are intensively or highly intensively involvedin strategic decision-making and control processes in the organisation.
Line manager(top level)
Project manager
Line manager(intermediate level)
PMO employees
Others
PMO manager
Sta
keho
lder
gro
ups
of th
e P
MO
38
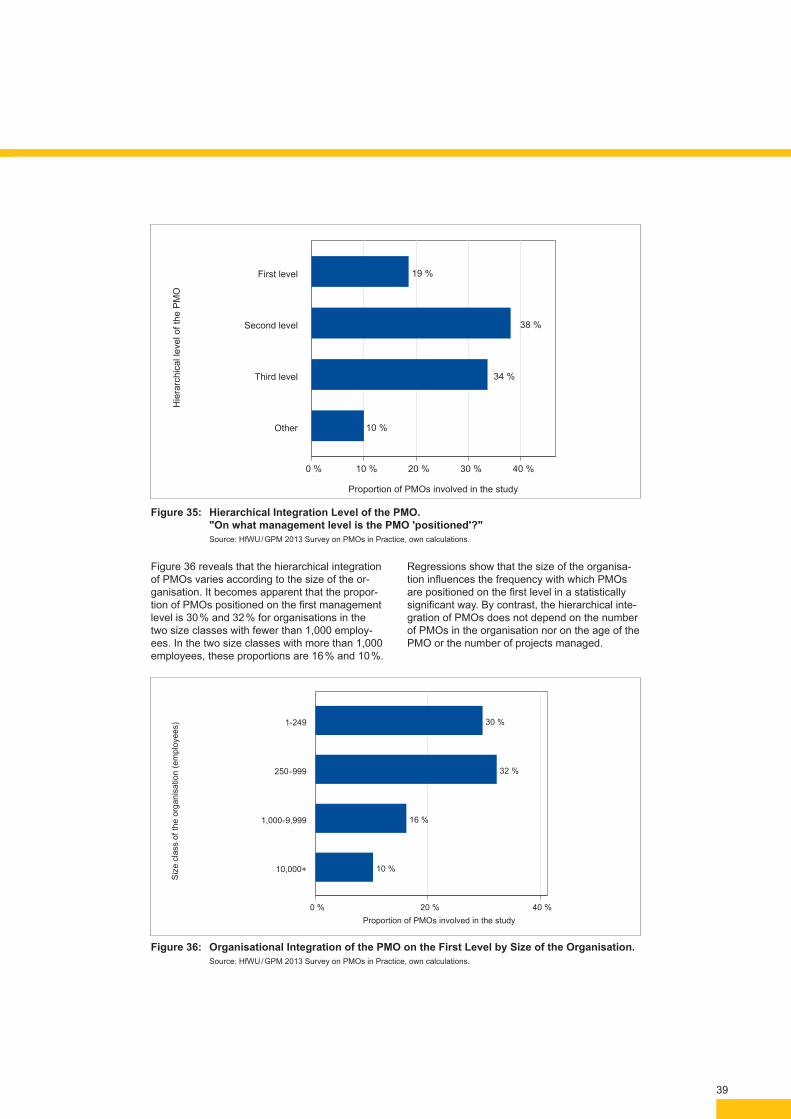
Figure 36 reveals that the hierarchical integration of PMOs varies according to the size of the or-ganisation. It becomes apparent that the propor-tion of PMOs positioned on the first management level is 30 % and 32 % for organisations in the two size classes with fewer than 1,000 employ-ees. In the two size classes with more than 1,000 employees, these proportions are 16 % and 10 %.
Regressions show that the size of the organisa-tion influences the frequency with which PMOs are positioned on the first level in a statistically significant way. By contrast, the hierarchical inte-gration of PMOs does not depend on the number of PMOs in the organisation nor on the age of the PMO or the number of projects managed.
10 %
34 %
38 %
19 %
0 % 10 % 20 % 30 % 40 %
Proportion of PMOs involved in the study
Other
Third level
Second level
First level
Hie
rarc
hica
l lev
el o
f the
PM
O
Figure 35: Hierarchical Integration Level of the PMO. "On what management level is the PMO 'positioned'?"
Source: HfWU / GPM 2013 Survey on PMOs in Practice, own calculations.
Figure 36: Organisational Integration of the PMO on the First Level by Size of the Organisation. Source: HfWU / GPM 2013 Survey on PMOs in Practice, own calculations.
10 %
16 %
32 %
30 %
0 % 20 % 40 %
10,000+
1,000-9,999
250-999
1-249
Siz
e cl
ass
of th
e or
gani
satio
n (e
mpl
oyee
s)
Proportion of PMOs involved in the study
39
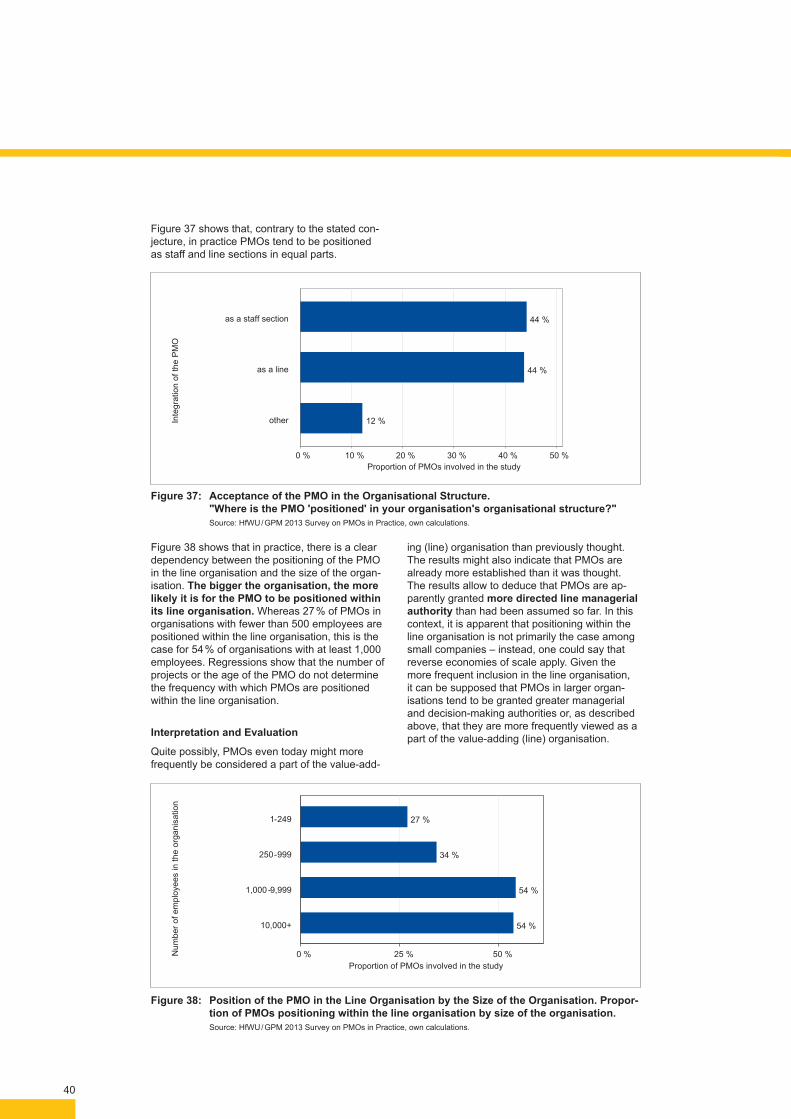
Figure 37 shows that, contrary to the stated con-jecture, in practice PMOs tend to be positioned as staff and line sections in equal parts.
Figure 38 shows that in practice, there is a clear dependency between the positioning of the PMO in the line organisation and the size of the organ-isation. The bigger the organisation, the more likely it is for the PMO to be positioned within its line organisation. Whereas 27 % of PMOs in organisations with fewer than 500 employees are positioned within the line organisation, this is the case for 54 % of organisations with at least 1,000 employees. Regressions show that the number of projects or the age of the PMO do not determine the frequency with which PMOs are positioned within the line organisation.
Interpretation and Evaluation
Quite possibly, PMOs even today might more frequently be considered a part of the value-add-
ing (line) organisation than previously thought. The results might also indicate that PMOs are already more established than it was thought. The results allow to deduce that PMOs are ap-parently granted more directed line managerial authority than had been assumed so far. In this context, it is apparent that positioning within the line organisation is not primarily the case among small companies – instead, one could say that reverse economies of scale apply. Given the more frequent inclusion in the line organisation, it can be supposed that PMOs in larger organ-isations tend to be granted greater managerial and decision-making authorities or, as described above, that they are more frequently viewed as a part of the value-adding (line) organisation.
12 %
44 %
44 %
0 % 10 % 20 % 30 % 40 % 50 %Proportion of PMOs involved in the study
other
as a line
as a staff section
Inte
grat
ion
of th
e P
MO
Figure 37: Acceptance of the PMO in the Organisational Structure. "Where is the PMO 'positioned' in your organisation's organisational structure?"
Source: HfWU / GPM 2013 Survey on PMOs in Practice, own calculations.
Figure 38: Position of the PMO in the Line Organisation by the Size of the Organisation. Propor-tion of PMOs positioning within the line organisation by size of the organisation.
Source: HfWU / GPM 2013 Survey on PMOs in Practice, own calculations.
54 %
54 %
34 %
27 %
0 % 25 % 50 %Proportion of PMOs involved in the study
10,000+
1,000 -9,999
250-999
1-249
Num
ber o
f em
ploy
ees
in th
e or
gani
satio
n
40
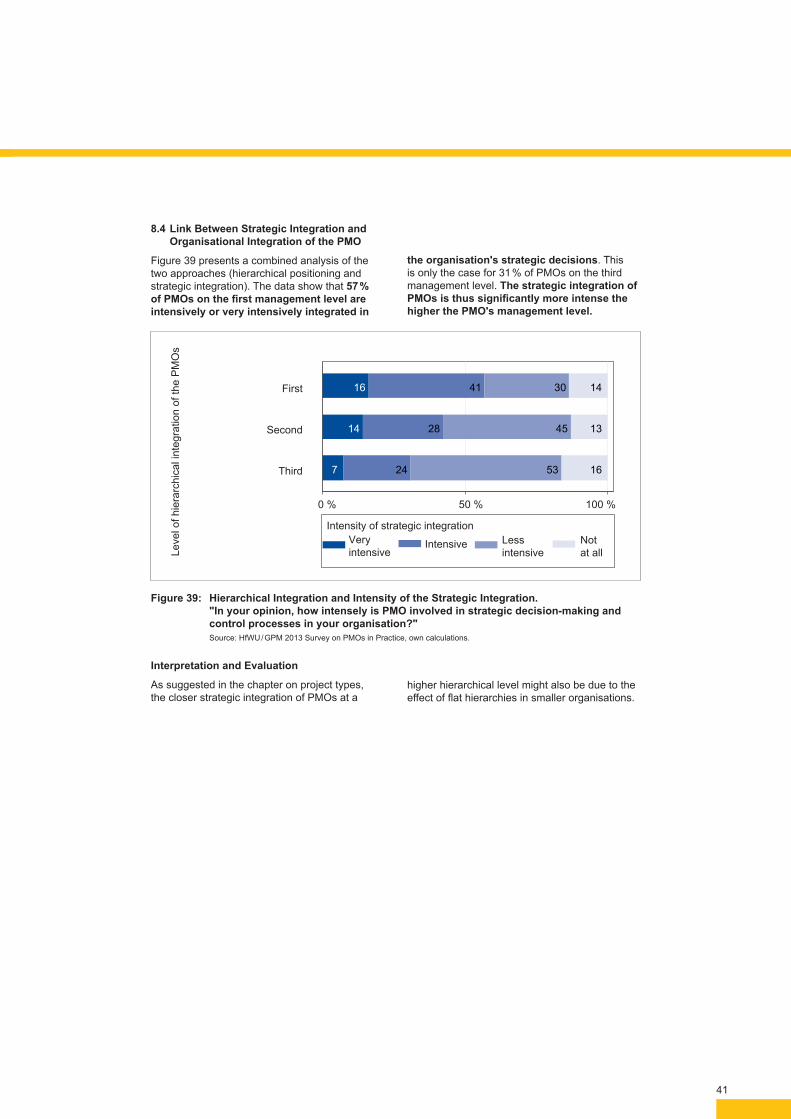
8.4 Link Between Strategic Integration and Organisational Integration of the PMO
Figure 39 presents a combined analysis of the two approaches (hierarchical positioning and strategic integration). The data show that 57 % of PMOs on the first management level are intensively or very intensively integrated in
the organisation's strategic decisions. This is only the case for 31 % of PMOs on the third management level. The strategic integration of PMOs is thus significantly more intense the higher the PMO's management level.
Interpretation and Evaluation
As suggested in the chapter on project types, the closer strategic integration of PMOs at a
higher hierarchical level might also be due to the effect of flat hierarchies in smaller organisations.
7 24 53 16
14 28 45 13
16 41 30 14
0 % 50 % 100 %
Third
Second
First
Veryintensive
Intensive Lessintensive
Notat all
Intensity of strategic integration
Leve
l of h
iera
rchi
cal i
nteg
ratio
n of
the
PM
Os
Figure 39: Hierarchical Integration and Intensity of the Strategic Integration. "In your opinion, how intensely is PMO involved in strategic decision-making and control processes in your organisation?"
Source: HfWU / GPM 2013 Survey on PMOs in Practice, own calculations.
41

The results of this study show that PMOs are by now widespread in the German-speaking regions, including in small and medium-sized enterprises (SMEs). This is an important signal, particularly for smaller organisations, which had previously assumed that PMOs are only relevant to larger organisations.
However, the data do not provide a recipe for success in terms of how a PMO should be designed. This means that PMOs must primar-ily be designed in relation to their company. Industry-specifi c or other variables play a less important role.
The results further demonstrate that differ-ent stakeholders in the company view PMOs different, particularly PMO managers and project managers. The overall acceptance of PMOs is surprisingly high, including among stakeholders like line managers, which are viewed as taking a more critical stance in relation to PMOs.
There is a two-sided relationship between the contribution that PMOs can make to an organi-sation, the tasks with which they are entrusted, their organisational integration and the level of acceptance of PMOs (see Figure 40).
The greater the value that a PMO can add to an organisation, the better it is communicated and the more the stakeholders of the PMO identify the added value as such, the greater is the level of acceptance of the PMO within the organisa-tion. The quantifi ability of this added value is the most important factor regarding the acceptance of the PMO.
The study further shows that most companies do not quantify the added value of PMOs. Given the great importance of precisely measurement the PMO's added value, this study recommends that PMOs should focus more strongly on a quantita-tive measurement of their performance in spite of the diffi culties involved.
The study has further shown that all stakehold-ers tend to view the role of PMOs as largely operative, and that this is the case even though acceptance of the PMOs increases alongside
greater strategic integration. Therefore, there still seems to be great potential for PMOs in terms of support for the strategic further development of organisations.
9 Summary
Figure 40: Main Factors and Correlations.
Acceptance
Contribution tothe organisation
Performancemeasurement
Organisationalclassification
Exercise ofoperative andstrategic tasks
42

10.1 Further Research Requirements
This study has shown that the added value of PMOs and the quantification of this added is so important that there is a requirement for further research in this area. As a new research objec-tive, it must be determined how the added value of PMOs can be calculated quantitatively and what obstacles there are to calculating the added value of PMOs. In addition, the determinants of the value contribution should be examined, par-ticularly the relationship between operative and strategic value contributions.
The present study is designed that a continuous development over time, such as regarding the distribution and tasks of PMOs, can be examined in subsequent studies.
10.2 Contributors to the Study
This study was carried out by the PMO Study Team
I Prof. Christian Arndt (Professor of Economics and Empirical Economic Research at HfWU)
I Prof. Lorenz Braun (Professor of Quantitative Methods and Business Sciences at HfWU)
I Michael Ribeiro (Department Head for Project Management at Institut ifmme at HfWU and of the MBA study programme "International Project Management")
I Stephen Rietiker (Head of the GPM section "New Perspectives in Project Work")
I Prof. Steffen Scheurer (Professor at HfWU, member of the GPM section "New Perspec-tives in Project Work" and "PM at Universi-ties" and course conductor of the MBA study programme "International Project Manage-ment" at HfWU)
I Dr. Wolfram von Schneyder (Head of the GPM section "Project Management Office")
The following experienced PMO practice experts contributed to the compilation and prioritisation of research questions and the interpretation of the results:
I Rita Frost (member of GPM SIG PM Experts)
I Thomas Klug (Thales Deutschland GmbH)
I Dr. Andrea Hennig (Bayer HealthCare AG)
I Roland Ehry (Rolls-Royce Power Systems AG)
I Karin Götz (HUK Coburg Insurance Group)
We would also like to thank the GPM Head of Research Prof. Yvonne Schoper for her valuable input.
10 Annex
43

GPM Deutsche Gesellschaftfür Projektmanagement e. V.Am Tullnaupark 1590402 NurembergGermany
Tel.: +49 911 433369-0Fax: +49 911 433369-99
GPM German Project Management Association® (GPM Deutsche Gesellschaft für Projektmanagement e. V.)
GPM is the leading professional project management association in Germany. GPM operates the larg-est network of project management experts in continental Europe with currently more than 7,000 mem-bers and 350 member companies from all industries, universities and public institutions. Established in 1979, GPM is mainly focussed on developing, systemising, standardising and further distributing the application of project management in Germany.
For further information, please visit www.gpm-ipma.de.
07_0
5_01
Mrz
15