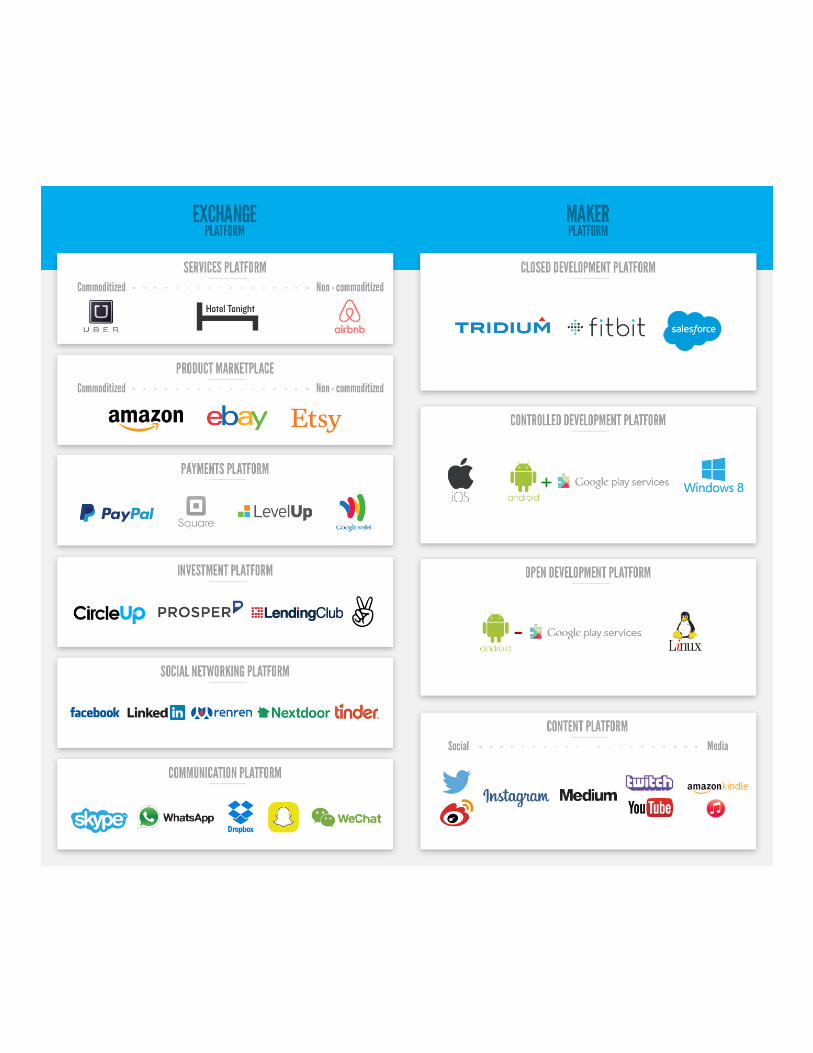
The Platform Cheatsheet to Mary Meeker’s Internet Trends Deck
59
-
Upload
applicoinc -
Category
Documents
-
view
32 -
download
0
Transcript of The Platform Cheatsheet to Mary Meeker’s Internet Trends Deck
31
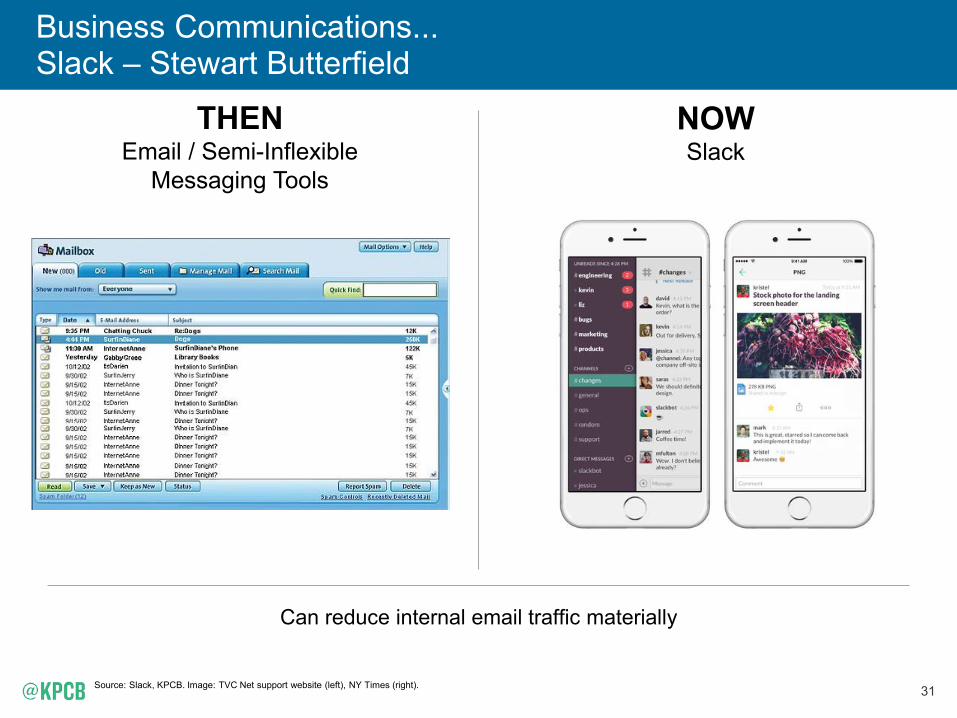
Business Communications... Slack – Stewart Butterfield
Source: Slack, KPCB. Image: TVC Net support website (left), NY Times (right).
THEN Email / Semi-Inflexible
Messaging Tools
NOW Slack
Can reduce internal email traffic materially
32
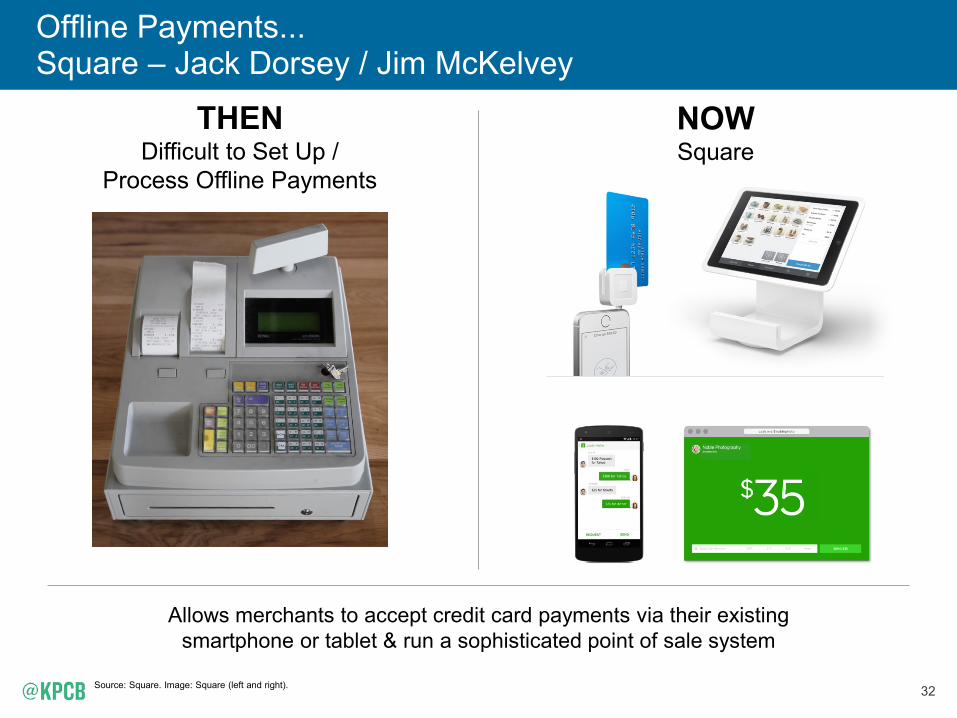
Offline Payments... Square – Jack Dorsey / Jim McKelvey
Source: Square. Image: Square (left and right).
THEN Difficult to Set Up /
Process Offline Payments
NOW Square
Allows merchants to accept credit card payments via their existing smartphone or tablet & run a sophisticated point of sale system
47
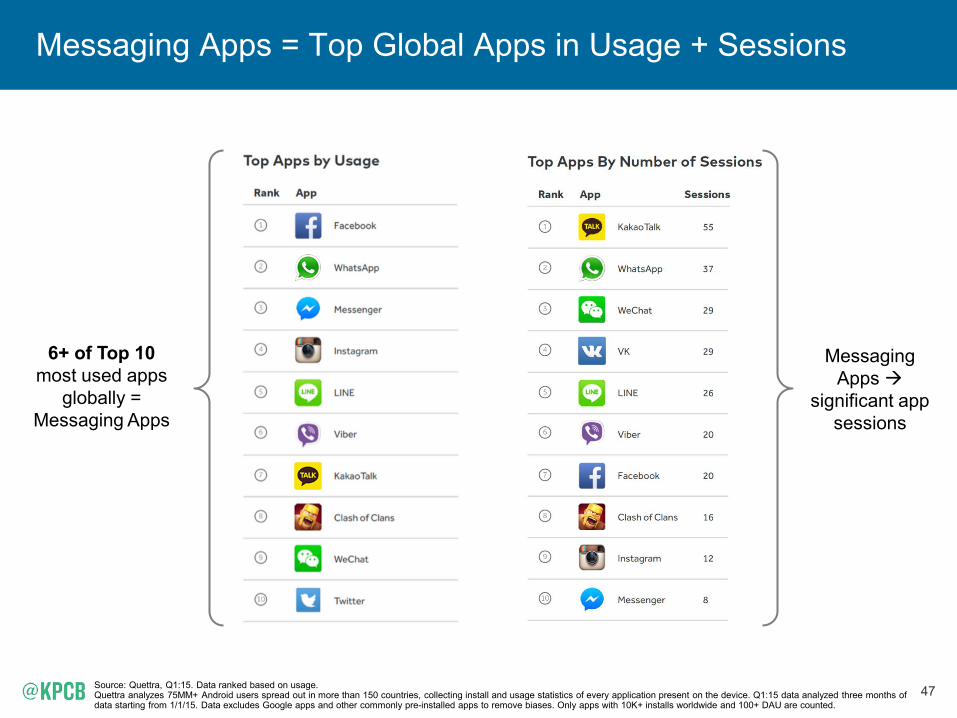
Messaging Apps = Top Global Apps in Usage + Sessions
6+ of Top 10 most used apps
globally = Messaging Apps
Messaging Apps Æ
significant app sessions
Source: Quettra, Q1:15. Data ranked based on usage. Quettra analyzes 75MM+ Android users spread out in more than 150 countries, collecting install and usage statistics of every application present on the device. Q1:15 data analyzed three months of data starting from 1/1/15. Data excludes Google apps and other commonly pre-installed apps to remove biases. Only apps with 10K+ installs worldwide and 100+ DAU are counted.
48
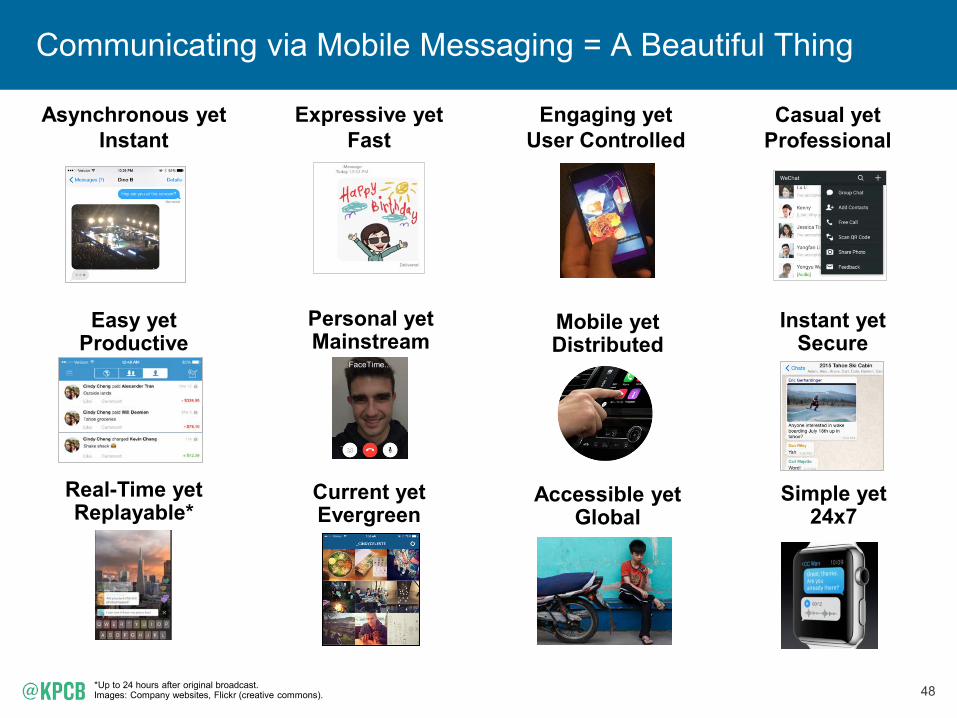
Communicating via Mobile Messaging = A Beautiful Thing
Asynchronous yet Instant
Expressive yet Fast
Engaging yet User Controlled
Easy yet Productive
Simple yet 24x7
Real-Time yet Replayable*
Current yet Evergreen
Accessible yet Global
Mobile yet Distributed
Instant yet Secure
Personal yet Mainstream
Casual yet Professional
FaceTime...
*Up to 24 hours after original broadcast. Images: Company websites, Flickr (creative commons).
49
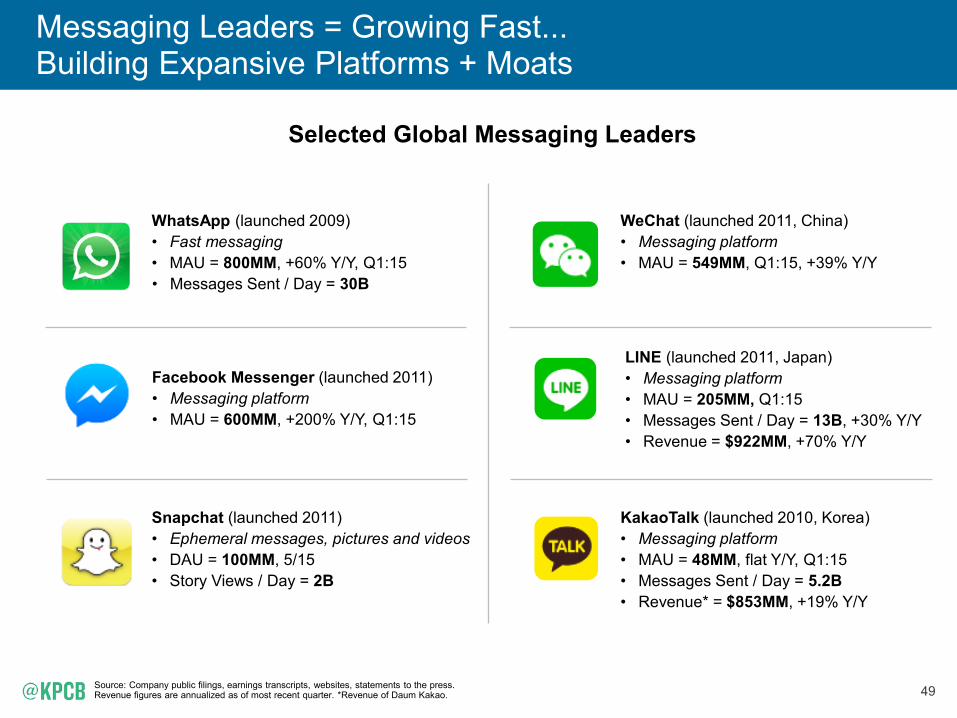
Facebook Messenger (launched 2011) • Messaging platform • MAU = 600MM, +200% Y/Y, Q1:15
WhatsApp (launched 2009) • Fast messaging • MAU = 800MM, +60% Y/Y, Q1:15 • Messages Sent / Day = 30B
Snapchat (launched 2011) • Ephemeral messages, pictures and videos • DAU = 100MM, 5/15 • Story Views / Day = 2B
KakaoTalk (launched 2010, Korea) • Messaging platform • MAU = 48MM, flat Y/Y, Q1:15 • Messages Sent / Day = 5.2B • Revenue* = $853MM, +19% Y/Y
LINE (launched 2011, Japan) • Messaging platform • MAU = 205MM, Q1:15 • Messages Sent / Day = 13B, +30% Y/Y • Revenue = $922MM, +70% Y/Y
WeChat (launched 2011, China) • Messaging platform • MAU = 549MM, Q1:15, +39% Y/Y
Messaging Leaders = Growing Fast... Building Expansive Platforms + Moats
Selected Global Messaging Leaders
Source: Company public filings, earnings transcripts, websites, statements to the press. Revenue figures are annualized as of most recent quarter. *Revenue of Daum Kakao.
50
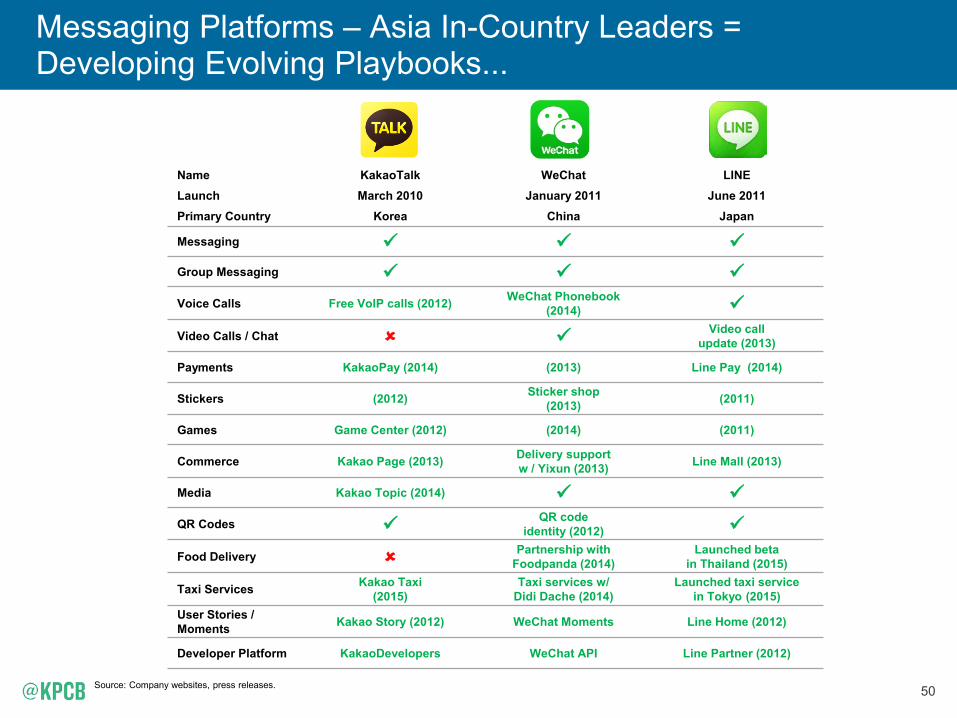
Messaging Platforms – Asia In-Country Leaders = Developing Evolving Playbooks...
Source: Company websites, press releases.
Name KakaoTalk WeChat LINE Launch March 2010 January 2011 June 2011 Primary Country Korea China Japan
Messaging 9 9 9 Group Messaging 9 9 9 Voice Calls Free VoIP calls (2012) WeChat Phonebook
(2014) 9 Video Calls / Chat 8 9 Video call
update (2013)
Payments KakaoPay (2014) (2013) Line Pay (2014)
Stickers (2012) Sticker shop (2013) (2011)
Games Game Center (2012) (2014) (2011)
Commerce Kakao Page (2013) Delivery support w / Yixun (2013) Line Mall (2013)
Media Kakao Topic (2014) 9 9 QR Codes 9 QR code
identity (2012) 9 Food Delivery 8 Partnership with
Foodpanda (2014) Launched beta
in Thailand (2015)
Taxi Services Kakao Taxi (2015)
Taxi services w/ Didi Dache (2014)
Launched taxi service in Tokyo (2015)
User Stories / Moments Kakao Story (2012) WeChat Moments Line Home (2012)
Developer Platform KakaoDevelopers WeChat API Line Partner (2012)
51
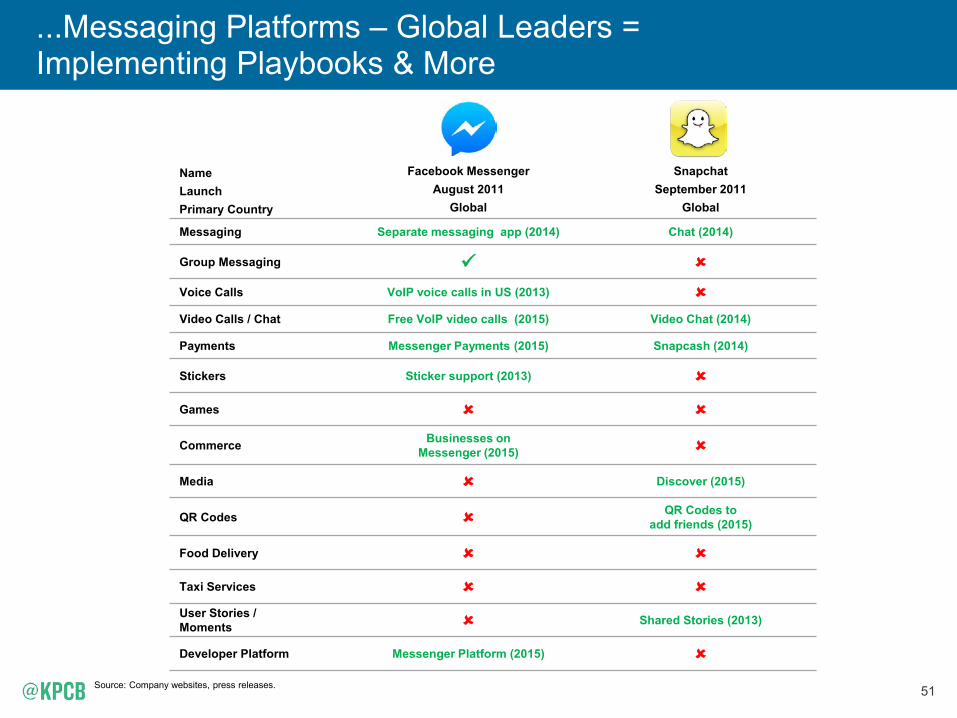
...Messaging Platforms – Global Leaders = Implementing Playbooks & More
Source: Company websites, press releases.
Name Facebook Messenger Snapchat Launch August 2011 September 2011 Primary Country Global Global
Messaging Separate messaging app (2014) Chat (2014)
Group Messaging 9 8 Voice Calls VoIP voice calls in US (2013) 8 Video Calls / Chat Free VoIP video calls (2015) Video Chat (2014)
Payments Messenger Payments (2015) Snapcash (2014)
Stickers Sticker support (2013) 8 Games 8 8 Commerce Businesses on
Messenger (2015) 8 Media 8 Discover (2015)
QR Codes 8 QR Codes to add friends (2015)
Food Delivery 8 8 Taxi Services 8 8 User Stories / Moments 8 Shared Stories (2013)
Developer Platform Messenger Platform (2015) 8
52
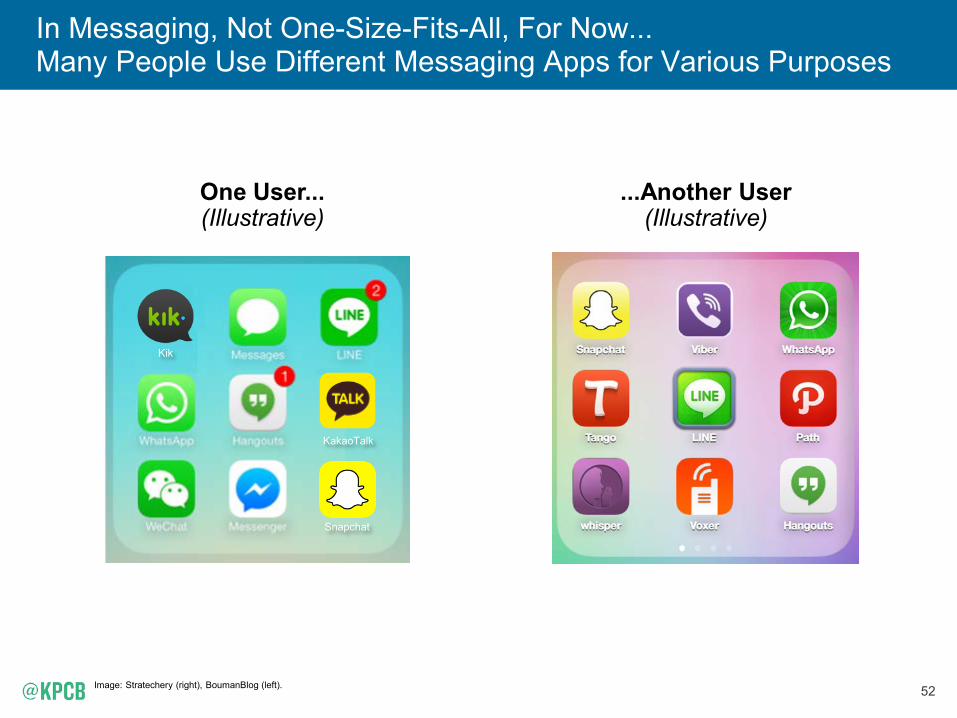
In Messaging, Not One-Size-Fits-All, For Now... Many People Use Different Messaging Apps for Various Purposes
One User... (Illustrative)
Image: Stratechery (right), BoumanBlog (left).
...Another User (Illustrative)
KakaoTalk
Snapchat
Kik
53
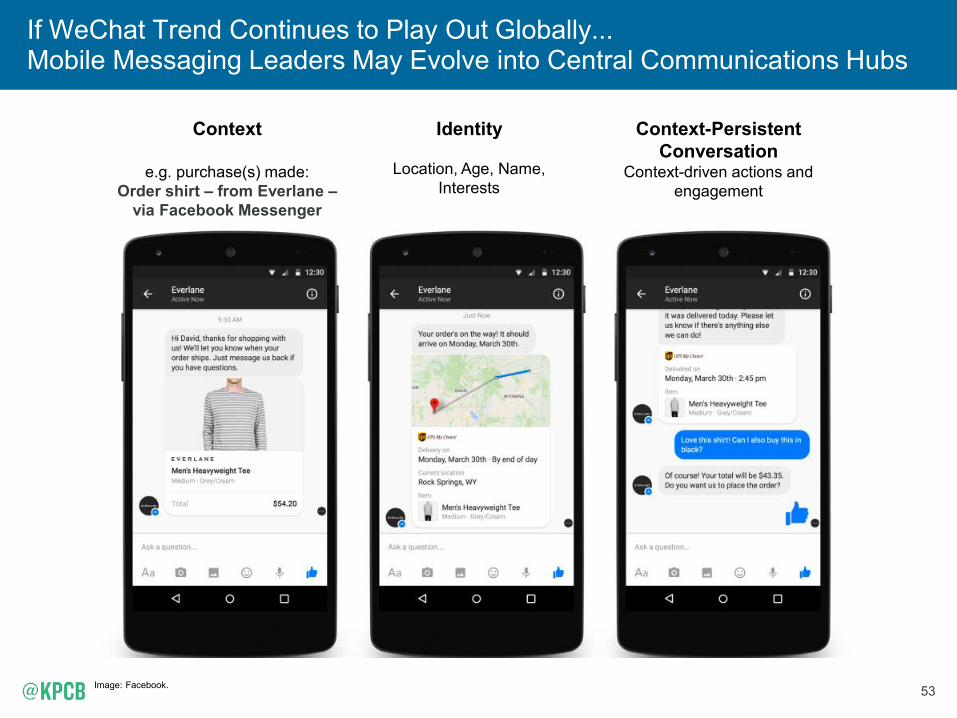
If WeChat Trend Continues to Play Out Globally... Mobile Messaging Leaders May Evolve into Central Communications Hubs
Image: Facebook.
Context
e.g. purchase(s) made: Order shirt – from Everlane –
via Facebook Messenger
Identity
Location, Age, Name, Interests
Context-Persistent Conversation
Context-driven actions and engagement
54
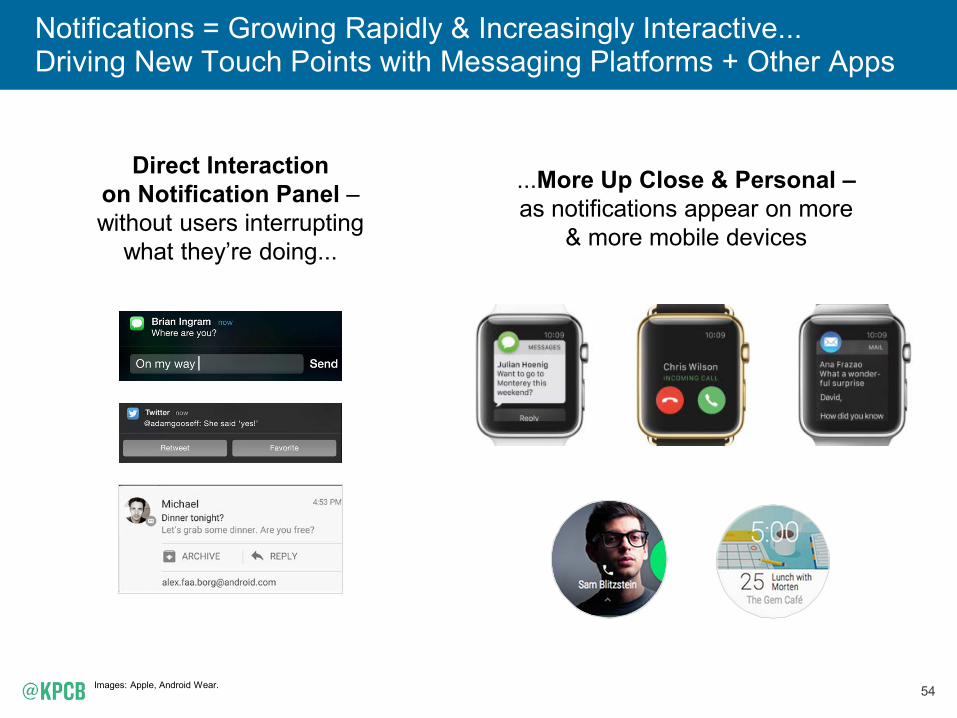
Notifications = Growing Rapidly & Increasingly Interactive... Driving New Touch Points with Messaging Platforms + Other Apps
Images: Apple, Android Wear.
...More Up Close & Personal – as notifications appear on more
& more mobile devices
Direct Interaction on Notification Panel – without users interrupting
what they’re doing...
55
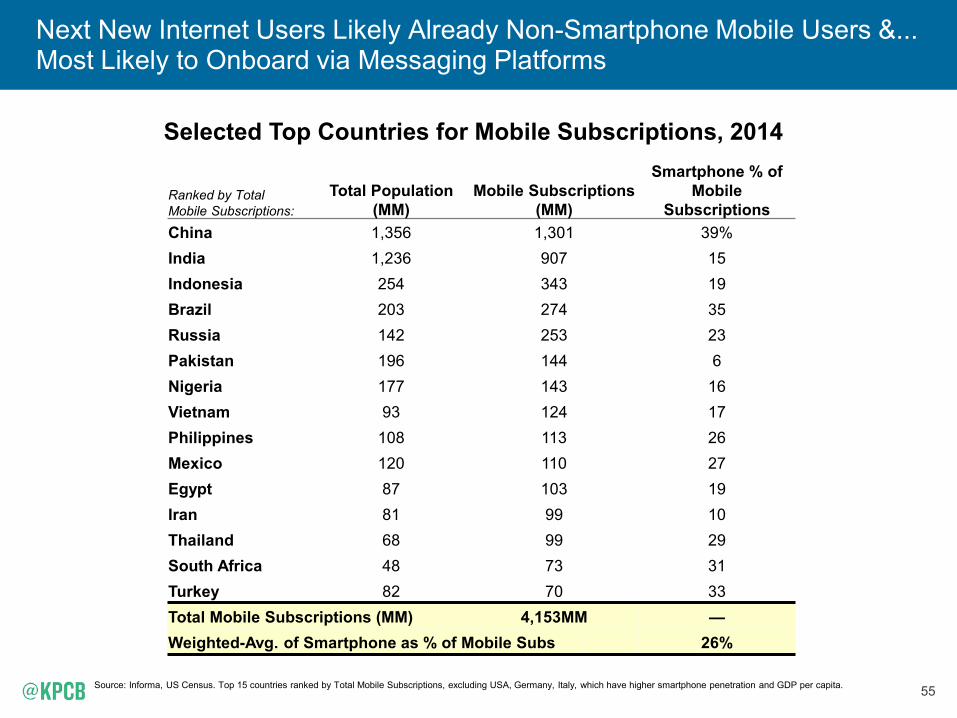
Next New Internet Users Likely Already Non-Smartphone Mobile Users &... Most Likely to Onboard via Messaging Platforms
Selected Top Countries for Mobile Subscriptions, 2014
Source: Informa, US Census. Top 15 countries ranked by Total Mobile Subscriptions, excluding USA, Germany, Italy, which have higher smartphone penetration and GDP per capita.
Ranked by Total Mobile Subscriptions:
Total Population (MM)
Mobile Subscriptions (MM)
Smartphone % of Mobile
Subscriptions China 1,356 1,301 39% India 1,236 907 15 Indonesia 254 343 19 Brazil 203 274 35 Russia 142 253 23 Pakistan 196 144 6 Nigeria 177 143 16 Vietnam 93 124 17 Philippines 108 113 26 Mexico 120 110 27 Egypt 87 103 19 Iran 81 99 10 Thailand 68 99 29 South Africa 48 73 31 Turkey 82 70 33 Total Mobile Subscriptions (MM) 4,153MM — Weighted-Avg. of Smartphone as % of Mobile Subs 26%
56
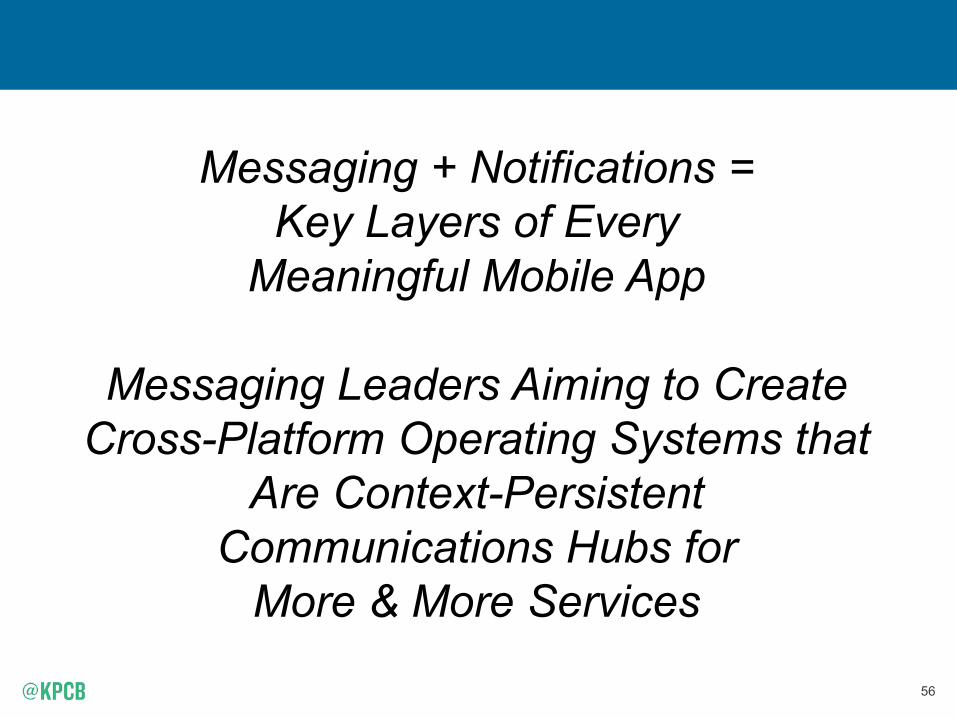
Messaging + Notifications = Key Layers of Every
Meaningful Mobile App
Messaging Leaders Aiming to Create Cross-Platform Operating Systems that
Are Context-Persistent Communications Hubs for
More & More Services

59
User-Generated Video from Millions of Creators... Curated by Snapchat = Growing Rapidly with Live Stories
Source: Snapchat.
Winter X-Games 1/15
30MM
Viewers in 24 Hours
Sports Music Holidays
Coachella 4/15
40MM
Viewers Over 3 Days
New Year's Eve 12/14
37MM
Viewers in 24 Hours
60
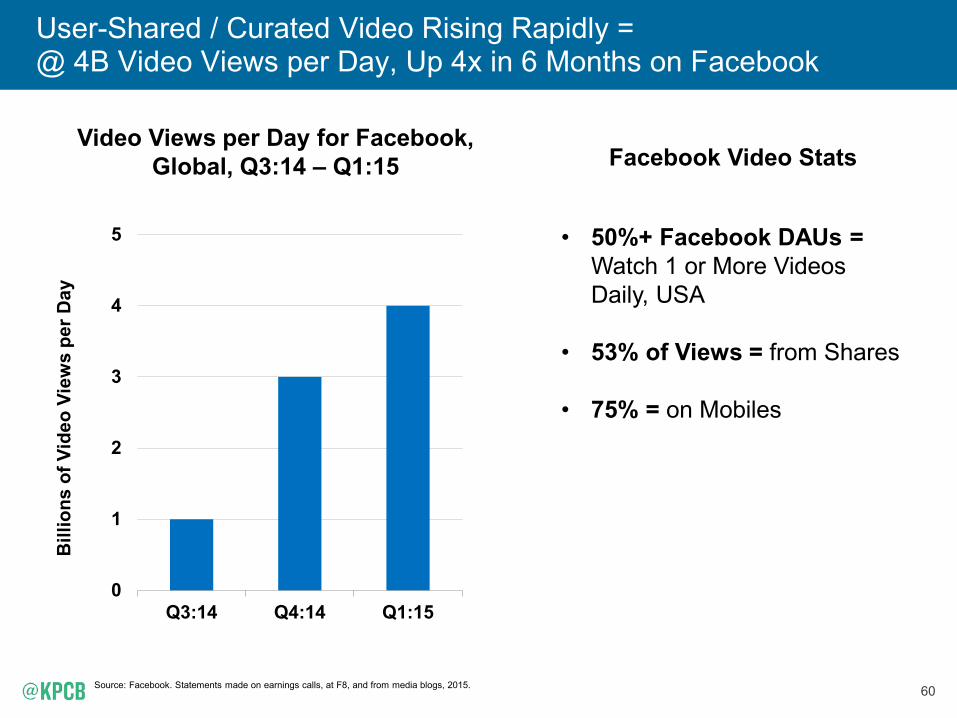
User-Shared / Curated Video Rising Rapidly = @ 4B Video Views per Day, Up 4x in 6 Months on Facebook
Source: Facebook. Statements made on earnings calls, at F8, and from media blogs, 2015.
0
1
2
3
4
5
Q3:14 Q4:14 Q1:15
Bill
ions
of V
ideo
Vie
ws
per D
ay
Video Views per Day for Facebook, Global, Q3:14 – Q1:15 Facebook Video Stats
• 50%+ Facebook DAUs = Watch 1 or More Videos Daily, USA
• 53% of Views = from Shares
• 75% = on Mobiles
61
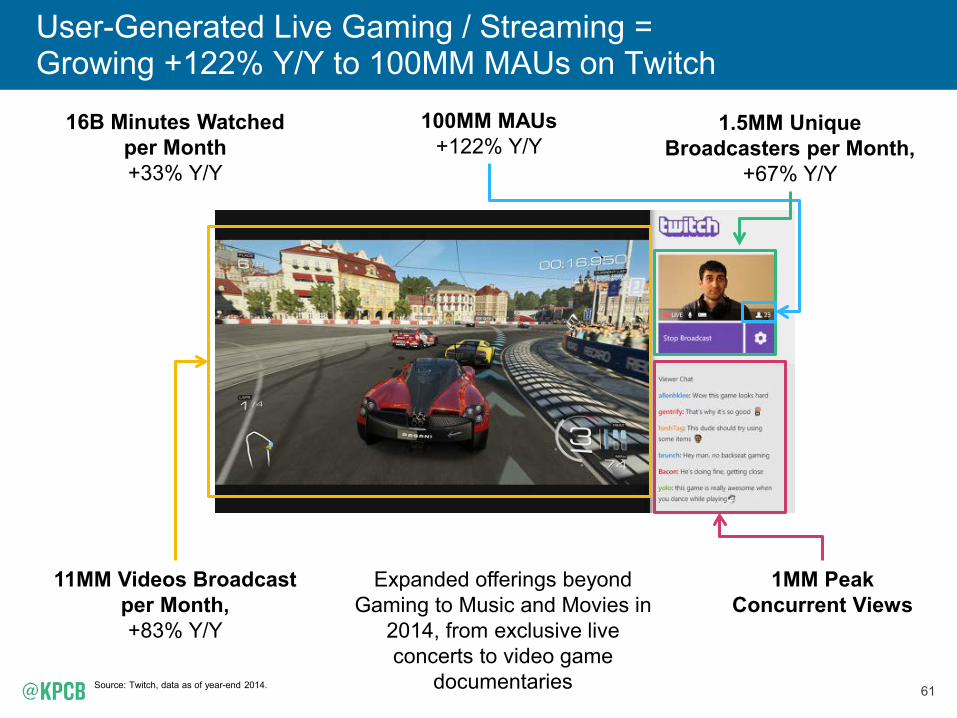
User-Generated Live Gaming / Streaming = Growing +122% Y/Y to 100MM MAUs on Twitch
Source: Twitch, data as of year-end 2014.
16B Minutes Watched per Month +33% Y/Y
1.5MM Unique Broadcasters per Month,
+67% Y/Y
11MM Videos Broadcast per Month, +83% Y/Y
1MM Peak Concurrent Views
Expanded offerings beyond Gaming to Music and Movies in
2014, from exclusive live concerts to video game
documentaries
100MM MAUs +122% Y/Y
62
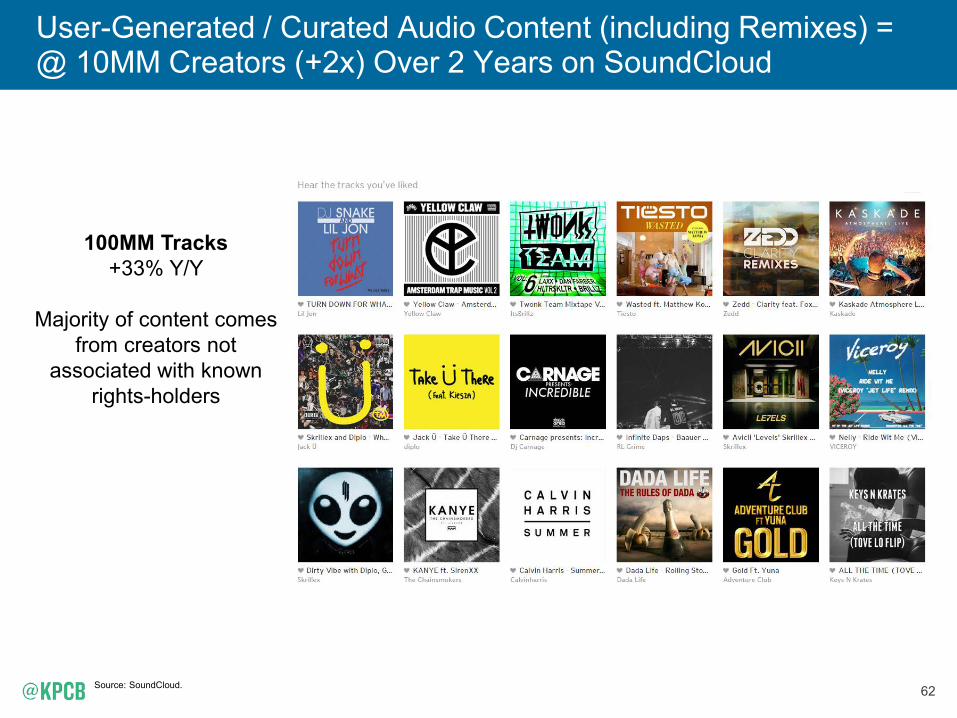
User-Generated / Curated Audio Content (including Remixes) = @ 10MM Creators (+2x) Over 2 Years on SoundCloud
Source: SoundCloud.
100MM Tracks +33% Y/Y
Majority of content comes
from creators not associated with known
rights-holders
63
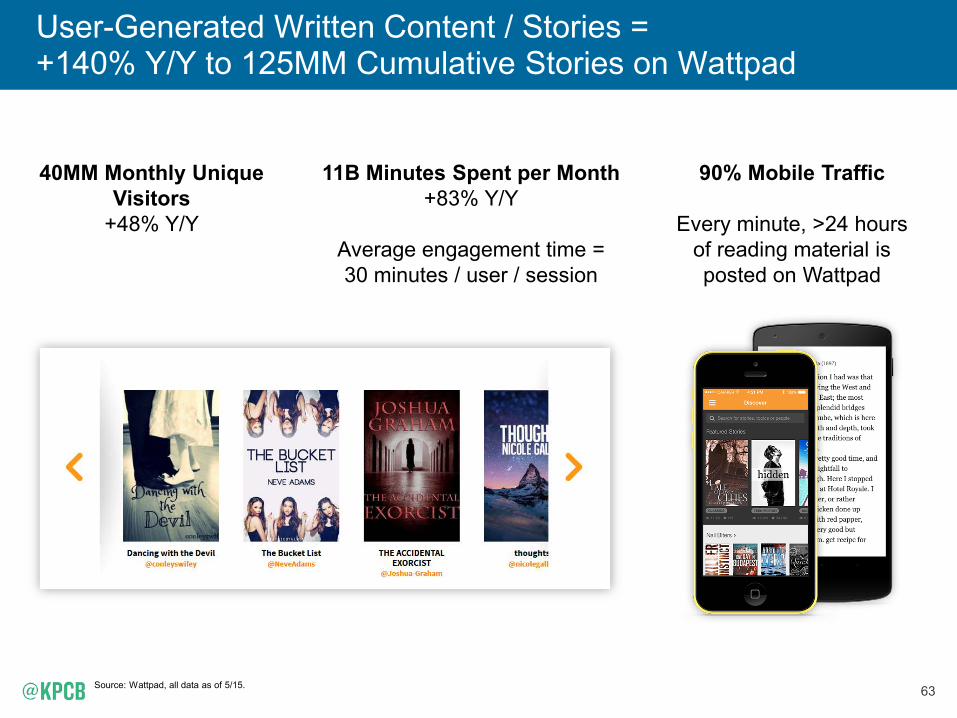
User-Generated Written Content / Stories = +140% Y/Y to 125MM Cumulative Stories on Wattpad
Source: Wattpad, all data as of 5/15.
11B Minutes Spent per Month +83% Y/Y
Average engagement time = 30 minutes / user / session
40MM Monthly Unique Visitors
+48% Y/Y
90% Mobile Traffic
Every minute, >24 hours of reading material is posted on Wattpad
64
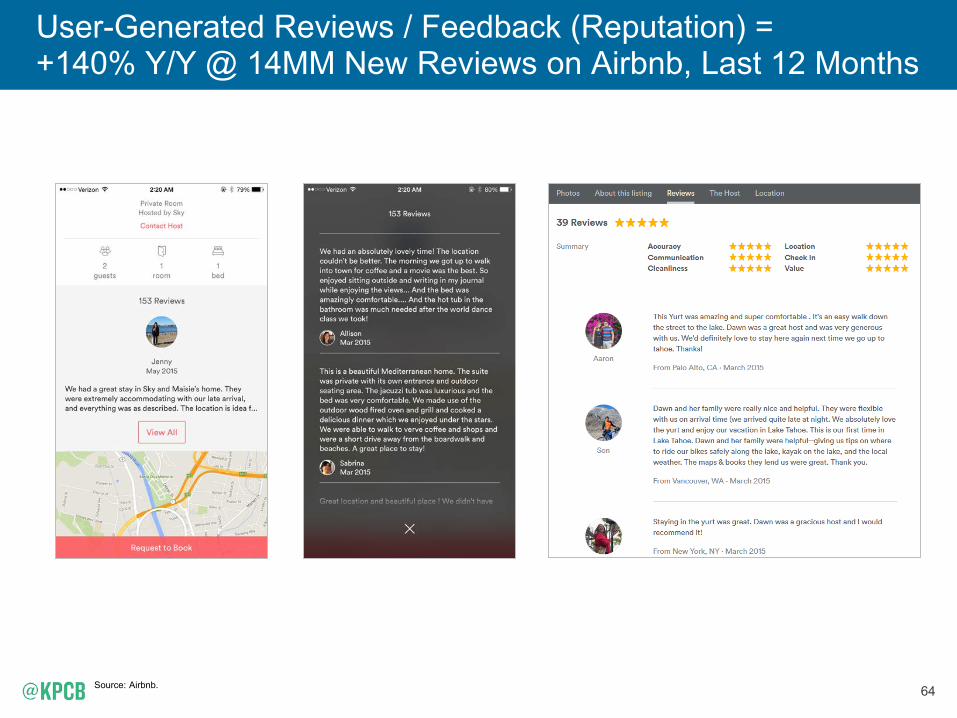
User-Generated Reviews / Feedback (Reputation) = +140% Y/Y @ 14MM New Reviews on Airbnb, Last 12 Months
Source: Airbnb.
65
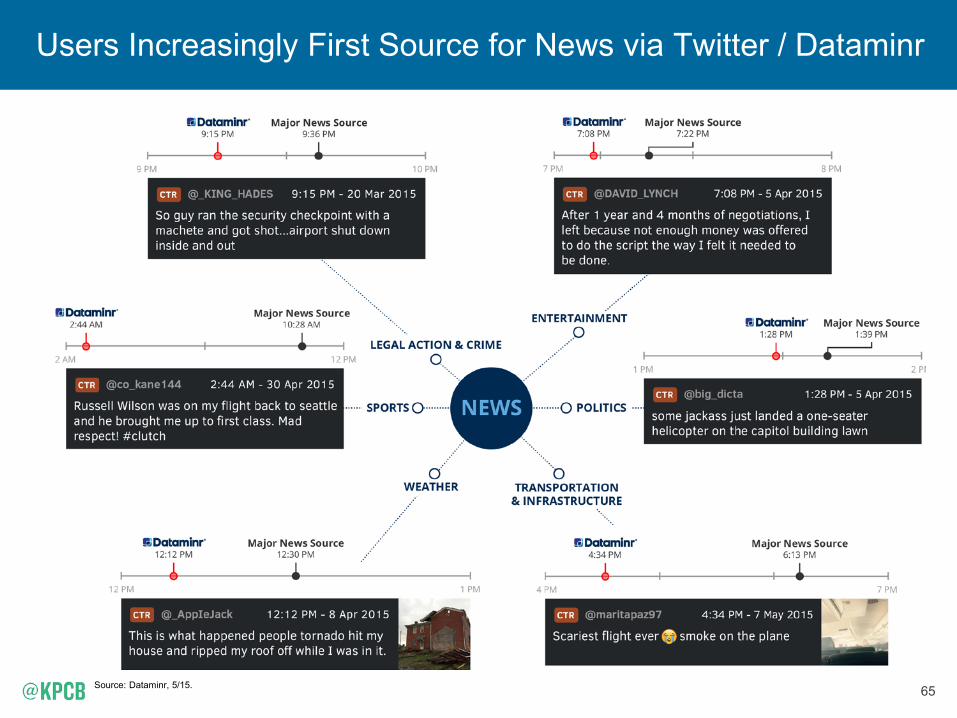
Users Increasingly First Source for News via Twitter / Dataminr
Source: Dataminr, 5/15.
68
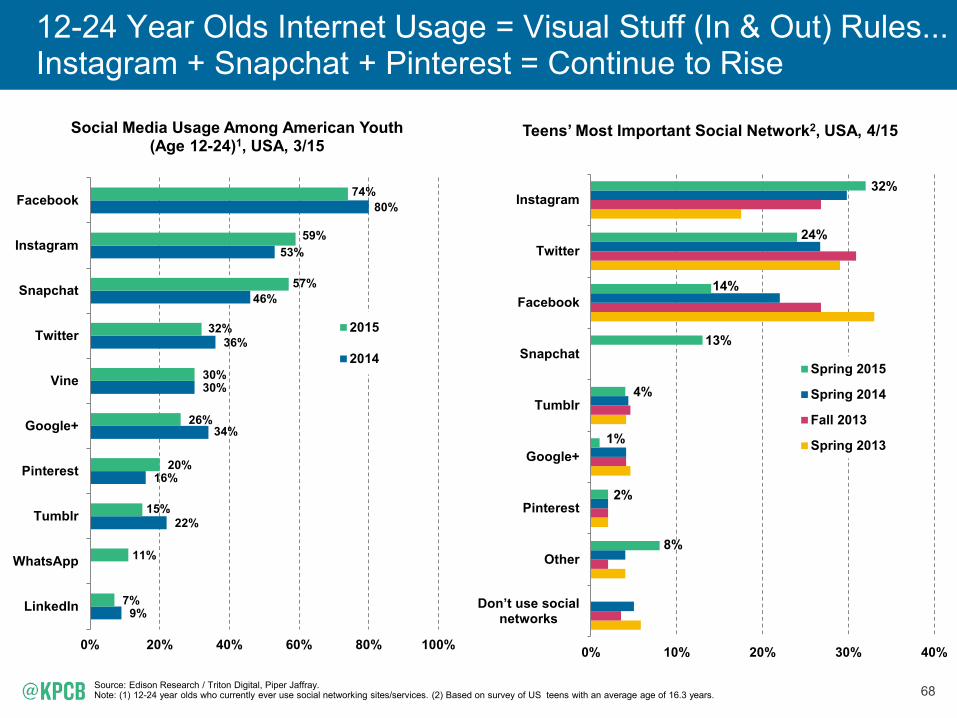
12-24 Year Olds Internet Usage = Visual Stuff (In & Out) Rules... Instagram + Snapchat + Pinterest = Continue to Rise
Source: Edison Research / Triton Digital, Piper Jaffray. Note: (1) 12-24 year olds who currently ever use social networking sites/services. (2) Based on survey of US teens with an average age of 16.3 years.
9%
22%
16%
34%
30%
36%
46%
53%
80%
7%
11%
15%
20%
26%
30%
32%
57%
59%
74%
0% 20% 40% 60% 80% 100%
Tumblr
Google+
Vine
Snapchat
Social Media Usage Among American Youth (Age 12-24)1, USA, 3/15
2015
2014
8%
2%
1%
4%
13%
14%
24%
32%
0% 10% 20% 30% 40%
Don’t use social networks
Other
Google+
Tumblr
Snapchat
Teens’ Most Important Social Network2, USA, 4/15
Spring 2015
Spring 2014
Fall 2013
Spring 2013
78
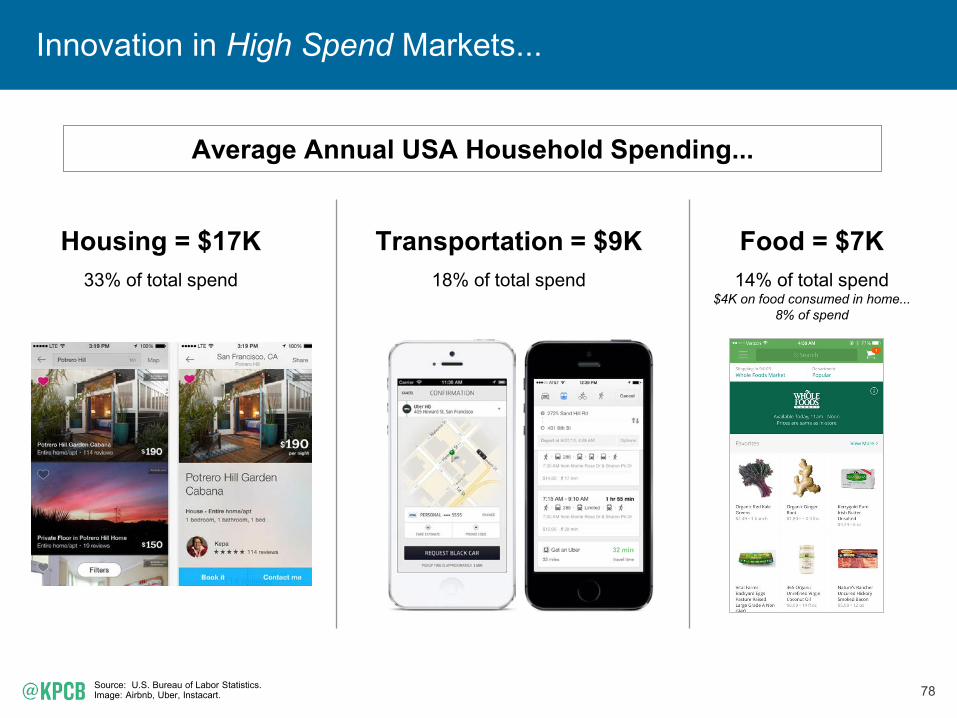
Innovation in High Spend Markets...
Source: U.S. Bureau of Labor Statistics. Image: Airbnb, Uber, Instacart.
Transportation = $9K 18% of total spend
Average Annual USA Household Spending...
Housing = $17K 33% of total spend
Food = $7K 14% of total spend
$4K on food consumed in home... 8% of spend
32 min
79
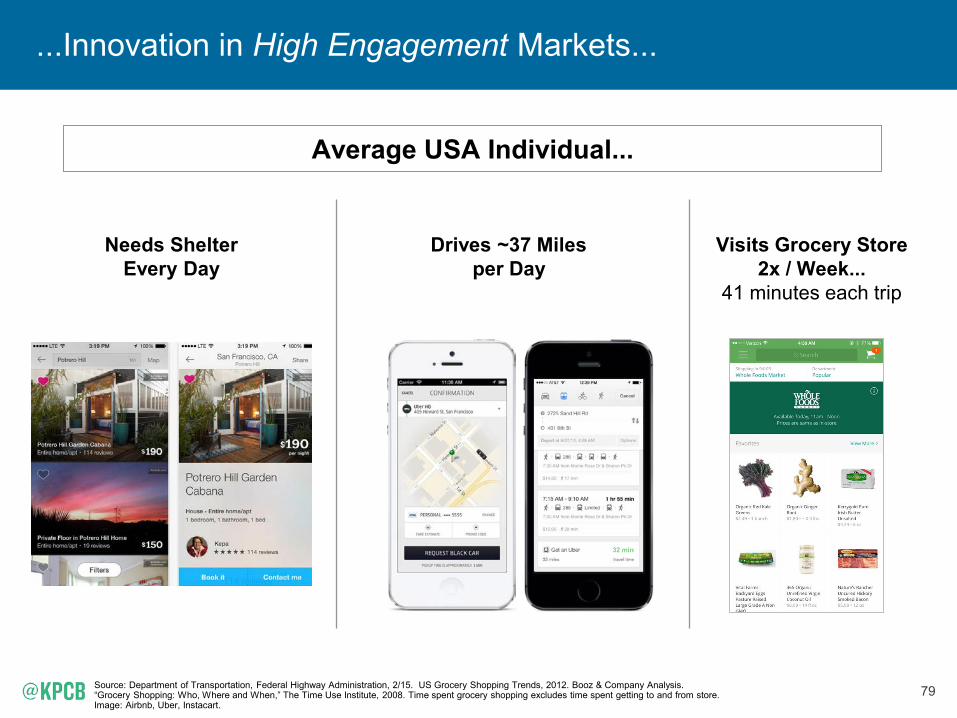
...Innovation in High Engagement Markets...
Source: Department of Transportation, Federal Highway Administration, 2/15. US Grocery Shopping Trends, 2012. Booz & Company Analysis. “Grocery Shopping: Who, Where and When,” The Time Use Institute, 2008. Time spent grocery shopping excludes time spent getting to and from store. Image: Airbnb, Uber, Instacart.
Drives ~37 Miles per Day
Average USA Individual...
Needs Shelter Every Day
Visits Grocery Store 2x / Week...
41 minutes each trip
32 min
80
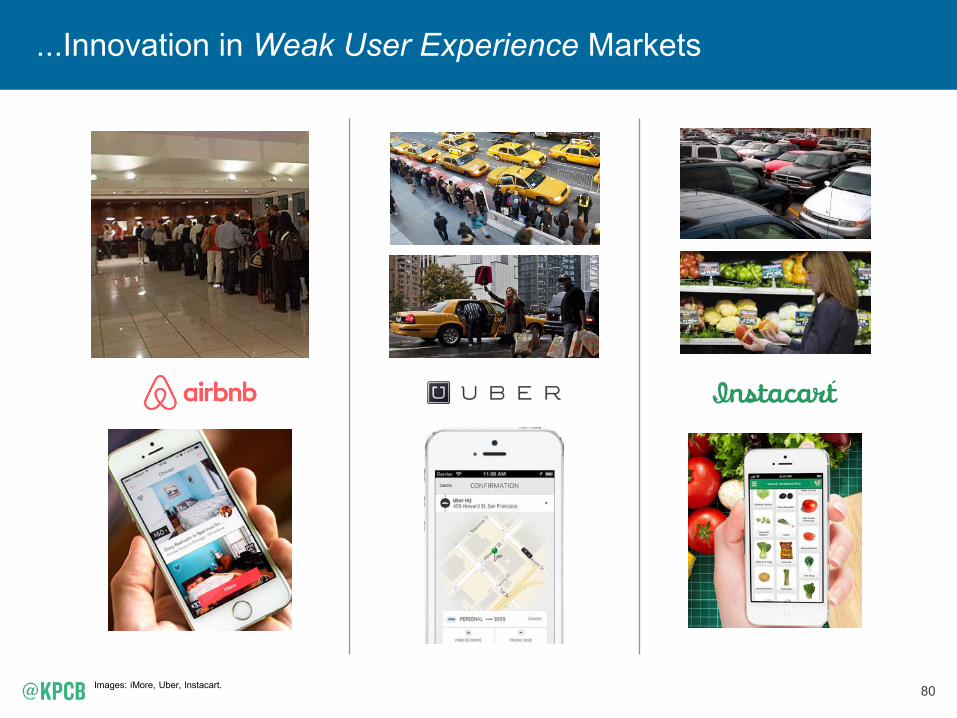
...Innovation in Weak User Experience Markets
Images: iMore, Uber, Instacart.
112
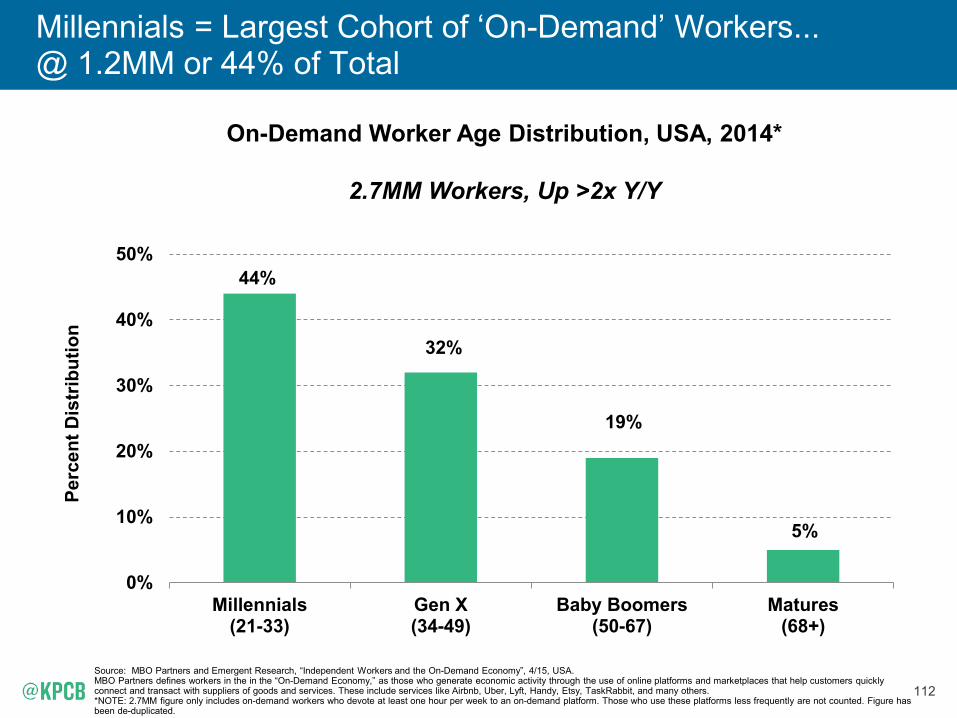
Millennials = Largest Cohort of ‘On-Demand’ Workers... @ 1.2MM or 44% of Total
Source: MBO Partners and Emergent Research, “Independent Workers and the On-Demand Economy”, 4/15, USA. MBO Partners defines workers in the in the “On-Demand Economy,” as those who generate economic activity through the use of online platforms and marketplaces that help customers quickly connect and transact with suppliers of goods and services. These include services like Airbnb, Uber, Lyft, Handy, Etsy, TaskRabbit, and many others. *NOTE: 2.7MM figure only includes on-demand workers who devote at least one hour per week to an on-demand platform. Those who use these platforms less frequently are not counted. Figure has been de-duplicated.
On-Demand Worker Age Distribution, USA, 2014*
2.7MM Workers, Up >2x Y/Y
44%
32%
19%
5%
0%
10%
20%
30%
40%
50%
Millennials(21-33)
Gen X(34-49)
Baby Boomers(50-67)
Matures(68+)
Perc
ent D
istr
ibut
ion
121
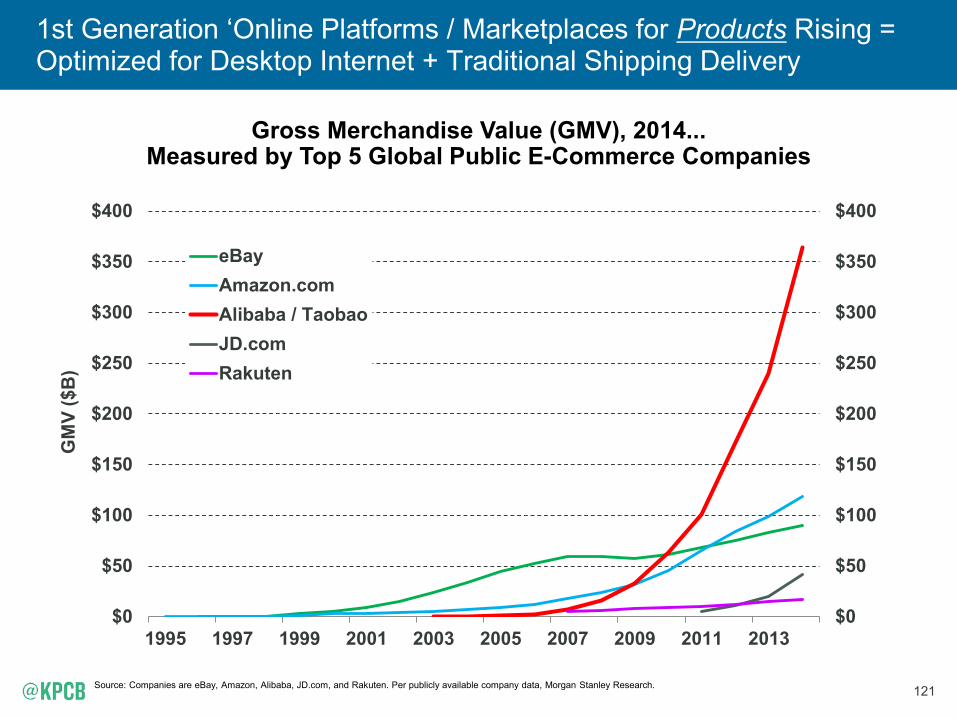
1st Generation ‘Online Platforms / Marketplaces for Products Rising = Optimized for Desktop Internet + Traditional Shipping Delivery
Gross Merchandise Value (GMV), 2014... Measured by Top 5 Global Public E-Commerce Companies
Source: Companies are eBay, Amazon, Alibaba, JD.com, and Rakuten. Per publicly available company data, Morgan Stanley Research.
$0
$50
$100
$150
$200
$250
$300
$350
$400
$0
$50
$100
$150
$200
$250
$300
$350
$400
1995 1997 1999 2001 2003 2005 2007 2009 2011 2013
GM
V ($
B)
eBayAmazon.comAlibaba / TaobaoJD.comRakuten
122
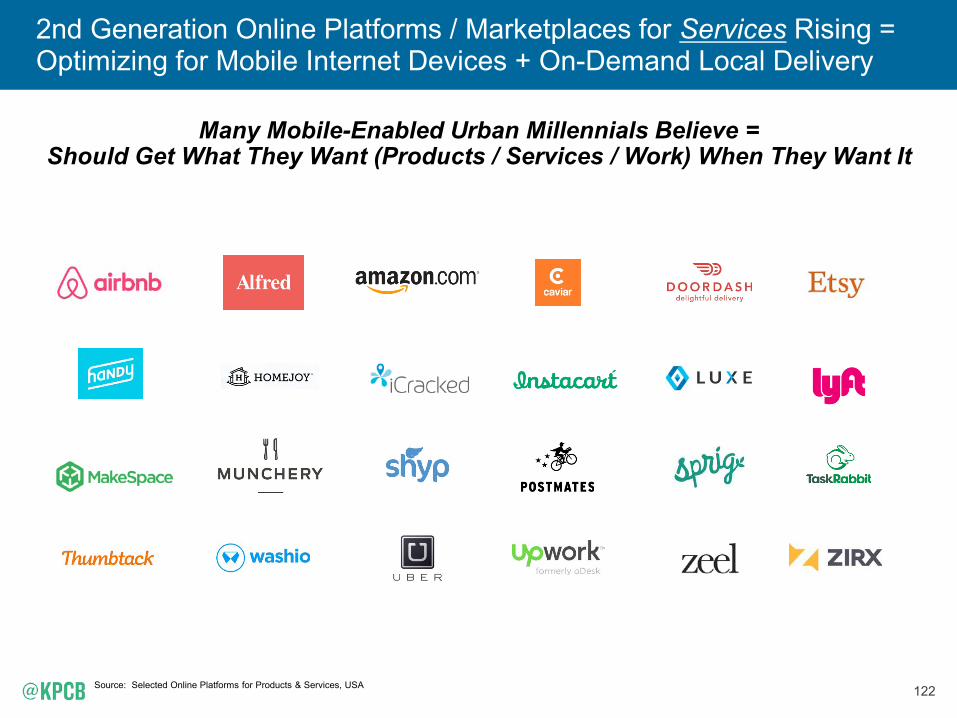
2nd Generation Online Platforms / Marketplaces for Services Rising = Optimizing for Mobile Internet Devices + On-Demand Local Delivery
Many Mobile-Enabled Urban Millennials Believe = Should Get What They Want (Products / Services / Work) When They Want It
Source: Selected Online Platforms for Products & Services, USA

126
Freelancers = Significant & Growing Portion of Workers @ 53MM People, 34% of USA Workforce
Freelancer Categories*
Source: “Freelancing in America,” Survey of 5,000 Working Americans commissioned by Freelancer’s Union and Upwork (formerly Elance-oDesk), 9/14, USA. *Freelancer defined as person / business engaged in supplemental, temporary, or project / contract-based work in the past 12 months. Moonlighters responded that they have one employer and are also doing freelance work on the side to earn additional money. Diversified workers responded that they have multiple sources of income from a mix of traditional employment and freelance work.
Independent Contractors
• 21MM People • 40% of Freelancers
• Don’t have employer...do freelance, temporary, or supplemental work on a project-by-project basis
Moonlighters • 14MM People • 27% of Freelancers
• Professionals with a primary, traditional job who also moonlight doing freelance work
Diversified Workers
• 9MM People • 18% of Freelancers
• Multiple sources of income; mix of traditional and freelance work
Temporary Workers
• 6MM People • 10% of Freelancers
• Single employer, client, job, or contract project where employment is temporary
Business Owners who Consider Themselves
Freelancers
• 3MM People • 5% of Freelancers • Business owners with 1-5 employees
128
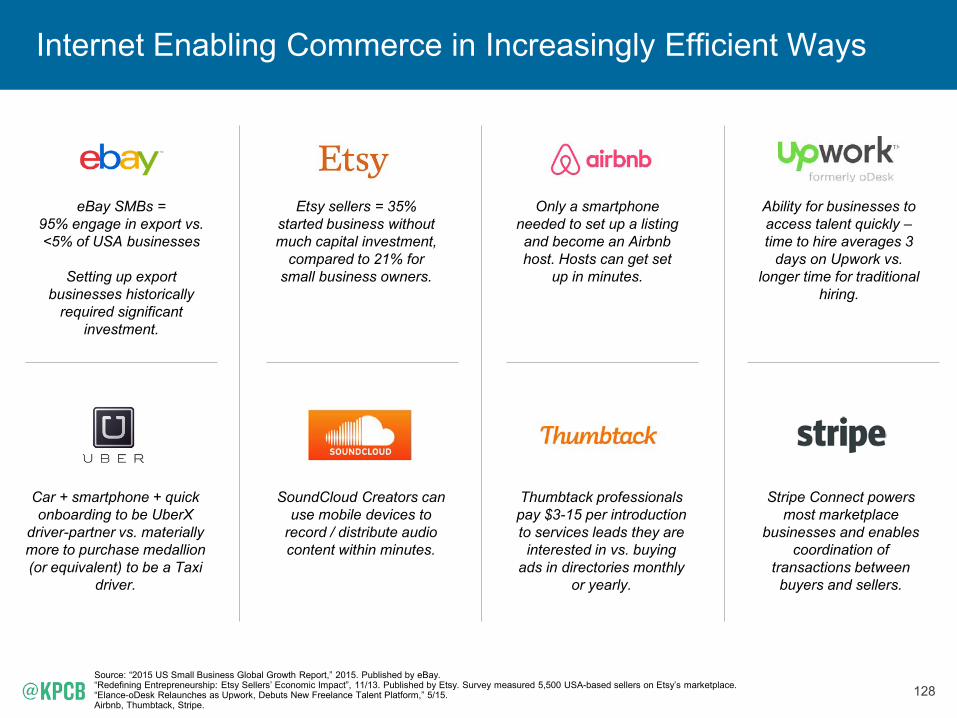
Internet Enabling Commerce in Increasingly Efficient Ways
Source: “2015 US Small Business Global Growth Report,” 2015. Published by eBay. “Redefining Entrepreneurship: Etsy Sellers’ Economic Impact”, 11/13. Published by Etsy. Survey measured 5,500 USA-based sellers on Etsy’s marketplace. “Elance-oDesk Relaunches as Upwork, Debuts New Freelance Talent Platform,” 5/15. Airbnb, Thumbtack, Stripe.
eBay SMBs = 95% engage in export vs. <5% of USA businesses
Setting up export
businesses historically required significant
investment.
Etsy sellers = 35% started business without much capital investment,
compared to 21% for small business owners.
Only a smartphone needed to set up a listing and become an Airbnb host. Hosts can get set
up in minutes.
Stripe Connect powers most marketplace
businesses and enables coordination of
transactions between buyers and sellers.
Car + smartphone + quick onboarding to be UberX
driver-partner vs. materially more to purchase medallion (or equivalent) to be a Taxi
driver.
SoundCloud Creators can use mobile devices to
record / distribute audio content within minutes.
Ability for businesses to access talent quickly – time to hire averages 3
days on Upwork vs. longer time for traditional
hiring.
Thumbtack professionals pay $3-15 per introduction to services leads they are interested in vs. buying
ads in directories monthly or yearly.
129
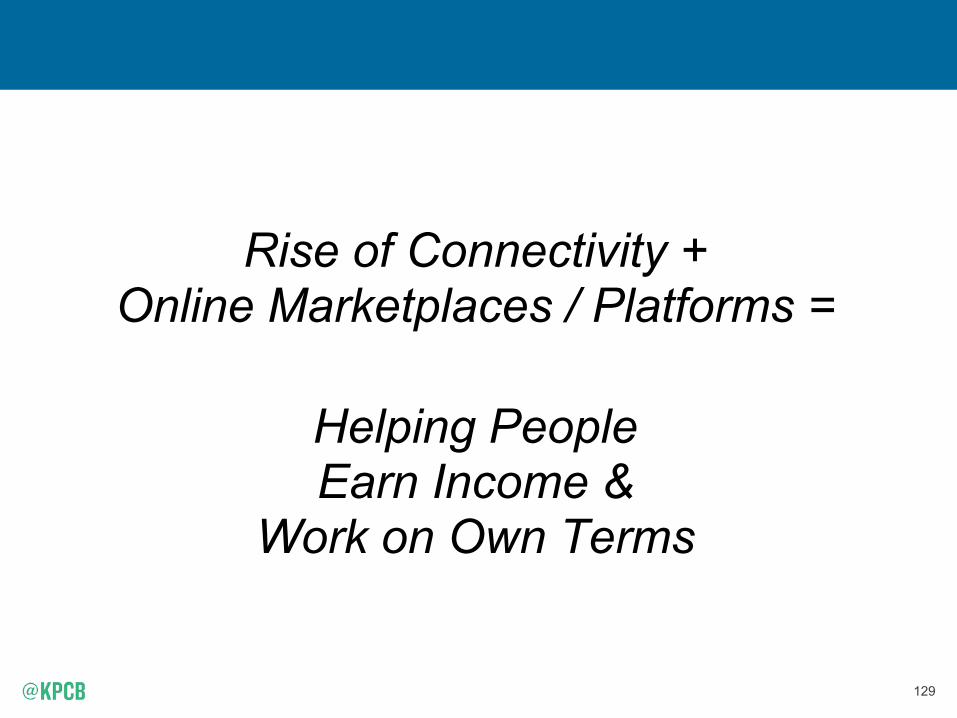
Rise of Connectivity +
Online Marketplaces / Platforms =
Helping People Earn Income &
Work on Own Terms
130
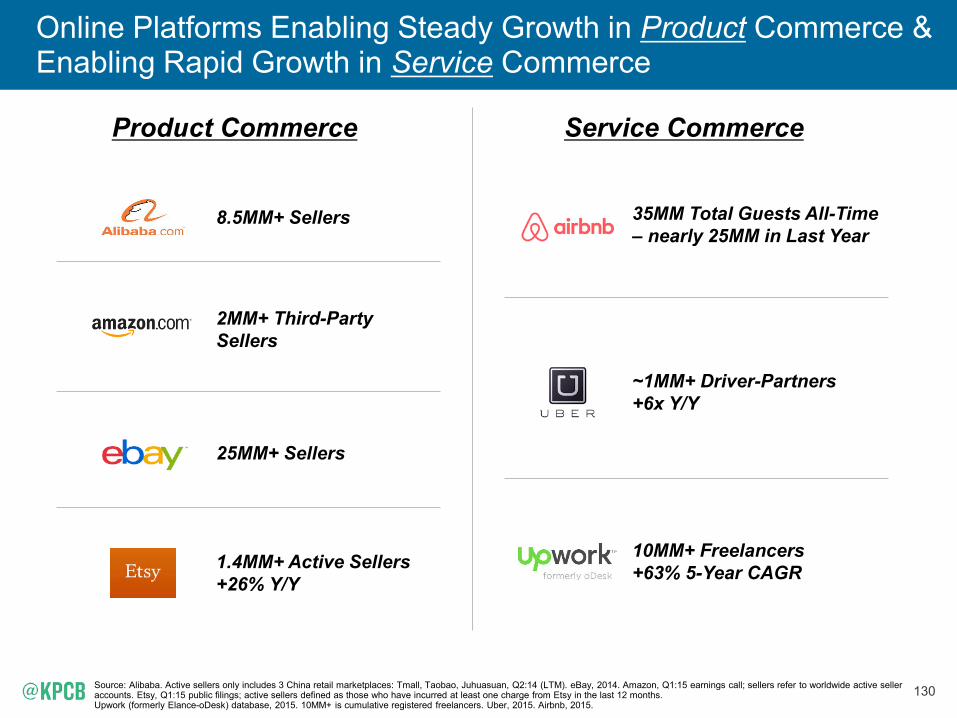
Online Platforms Enabling Steady Growth in Product Commerce & Enabling Rapid Growth in Service Commerce
8.5MM+ Sellers
2MM+ Third-Party Sellers
25MM+ Sellers
1.4MM+ Active Sellers +26% Y/Y
10MM+ Freelancers +63% 5-Year CAGR
~1MM+ Driver-Partners +6x Y/Y
35MM Total Guests All-Time – nearly 25MM in Last Year
Product Commerce Service Commerce
Source: Alibaba. Active sellers only includes 3 China retail marketplaces: Tmall, Taobao, Juhuasuan, Q2:14 (LTM). eBay, 2014. Amazon, Q1:15 earnings call; sellers refer to worldwide active seller accounts. Etsy, Q1:15 public filings; active sellers defined as those who have incurred at least one charge from Etsy in the last 12 months. Upwork (formerly Elance-oDesk) database, 2015. 10MM+ is cumulative registered freelancers. Uber, 2015. Airbnb, 2015.
131
People Typically Use Online Platforms to
Find Extra Income & Flexibility

132
Many People = Use Online Platforms / Marketplaces to Supplement Income
Select Online Platforms – Personal Impact
Source: “An Analysis of the Labor Market for Uber’s Driver-Partners in the United States,” Uber, 1/15. Note Uber data are USA only. “The Tremendous Impact of Airbnb in New York,” Airbnb, 5/15. Additional data are from Airbnb. “Redefining Entrepreneurship: Etsy Sellers’ Economic Impact”, 11/13. Published by Etsy. Survey measured 5,500 USA-based sellers on Etsy’s marketplace. Note Etsy data is USA only. Upwork (formerly Elance-oDesk) Annual Impact Report, 2014. “Freelancing in America,” Survey of 5,000 Working Americans commissioned by Freelancer’s Union and Upwork (formerly Elance-oDesk), 9/14. USA. Thumbtack, 2015. Note percentages may not add up to 100% owing to rounding.
• 72% = NYC hosts depend on Airbnb earnings to pay rent / mortgage...50%+ = NYC hosts are freelancers or other non-traditional workers supplementing income...
• 80-90% = Global Airbnb hosts occasionally rent out their own home to supplement income
• 82% = Sellers are part-time (ie: have jobs outside of Etsy) • 26% = Sellers have full-time jobs (outside of Etsy)...48% = independent / part-time /
temporary workers • 36% = Use Etsy earnings to cover household expenses...24% for discretionary spend
• 37% = Pros are part-time with income supplemented by other sources
• 74% = Drive to maintain steady income as other income sources unstable / unpredictable • 61% = Have another job...31% = full-time on another job; 30% = part-time job apart from
Uber; 38% = no other job
• 68% = People who said earning extra money is a motivation for freelancing • 80% = Non-freelancers willing to do work outside primary job to make more money • 60%+ = Freelancers provide at least 1/2 household income
133
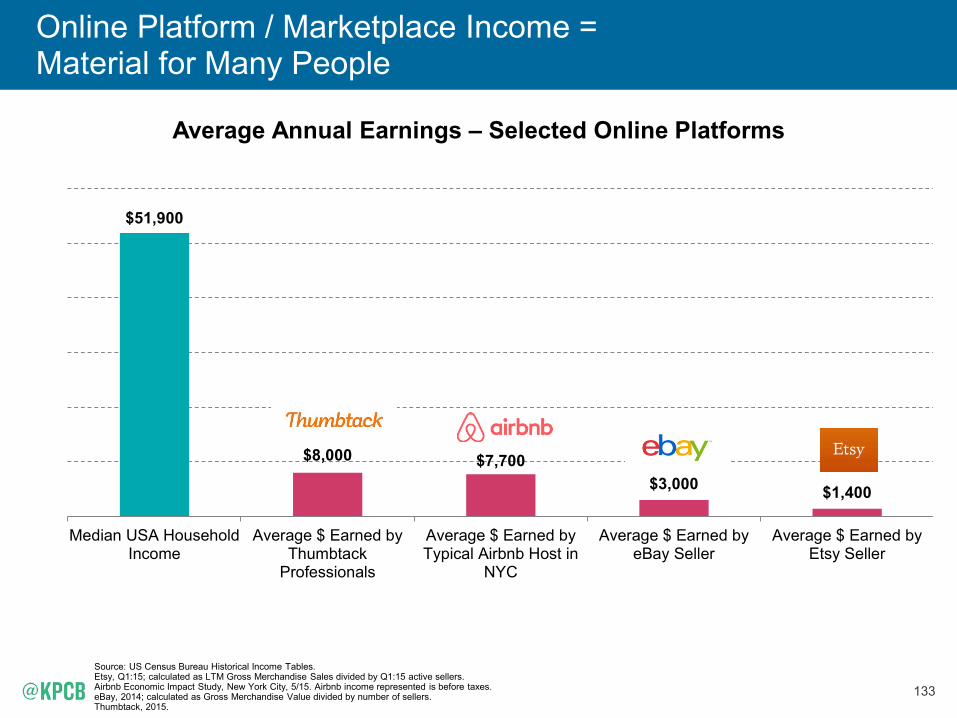
Online Platform / Marketplace Income = Material for Many People
Average Annual Earnings – Selected Online Platforms
$51,900
$8,000 $7,700 $3,000 $1,400
Median USA HouseholdIncome
Average $ Earned byThumbtack
Professionals
Average $ Earned byTypical Airbnb Host in
NYC
Average $ Earned byeBay Seller
Average $ Earned byEtsy Seller
Source: US Census Bureau Historical Income Tables. Etsy, Q1:15; calculated as LTM Gross Merchandise Sales divided by Q1:15 active sellers. Airbnb Economic Impact Study, New York City, 5/15. Airbnb income represented is before taxes. eBay, 2014; calculated as Gross Merchandise Value divided by number of sellers. Thumbtack, 2015.
134
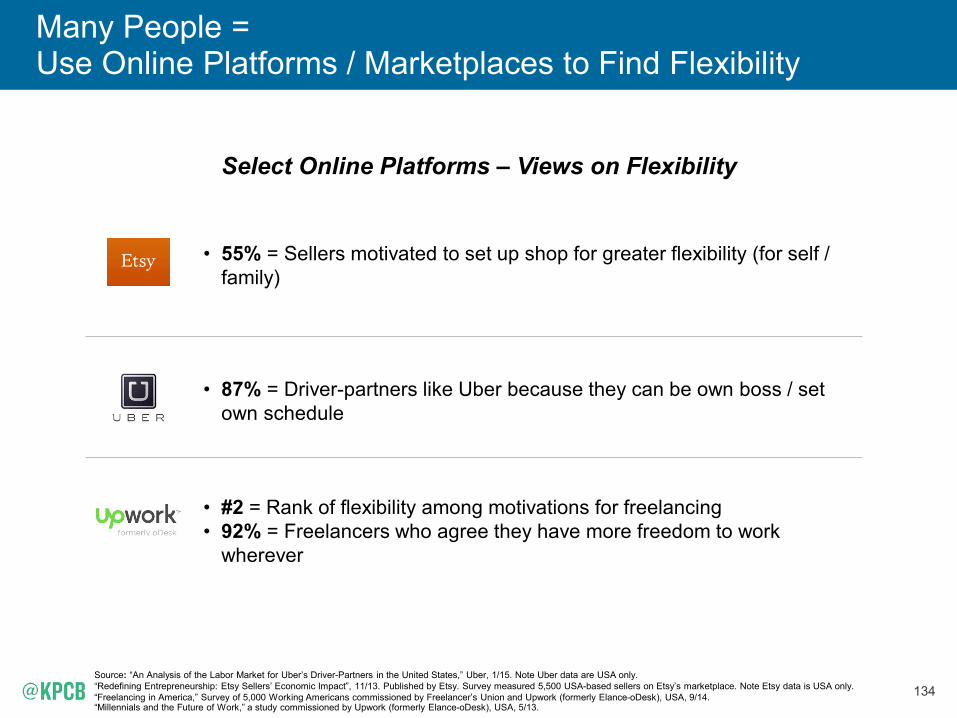
Many People = Use Online Platforms / Marketplaces to Find Flexibility
Select Online Platforms – Views on Flexibility
Source: “An Analysis of the Labor Market for Uber’s Driver-Partners in the United States,” Uber, 1/15. Note Uber data are USA only. “Redefining Entrepreneurship: Etsy Sellers’ Economic Impact”, 11/13. Published by Etsy. Survey measured 5,500 USA-based sellers on Etsy’s marketplace. Note Etsy data is USA only. “Freelancing in America,” Survey of 5,000 Working Americans commissioned by Freelancer’s Union and Upwork (formerly Elance-oDesk), USA, 9/14. “Millennials and the Future of Work,” a study commissioned by Upwork (formerly Elance-oDesk), USA, 5/13.
• 55% = Sellers motivated to set up shop for greater flexibility (for self / family)
• 87% = Driver-partners like Uber because they can be own boss / set own schedule
• #2 = Rank of flexibility among motivations for freelancing • 92% = Freelancers who agree they have more freedom to work
wherever
135
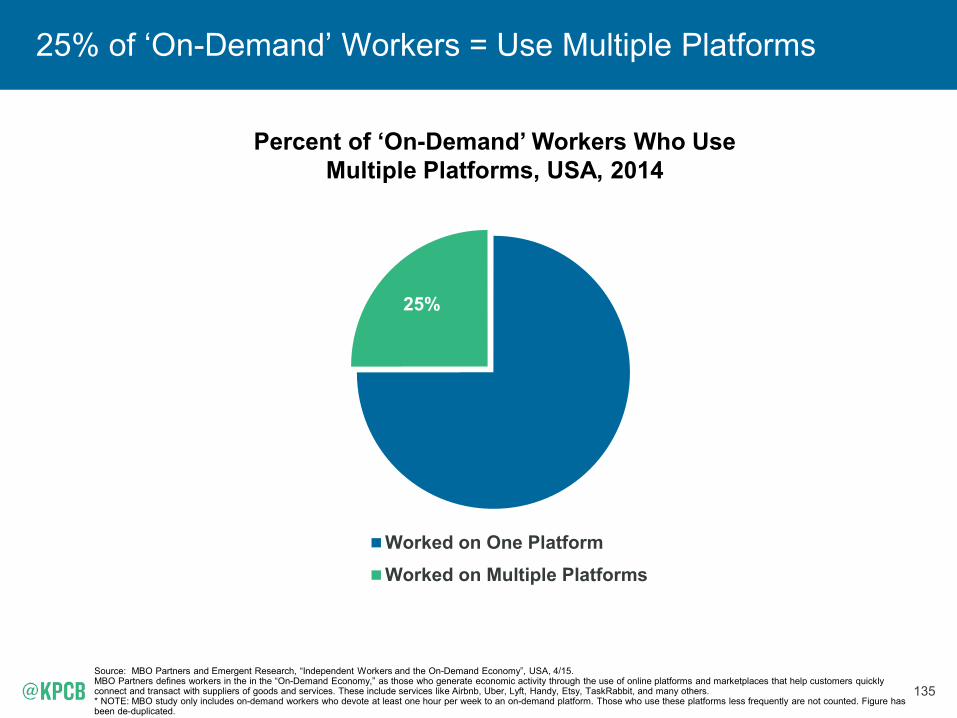
25% of ‘On-Demand’ Workers = Use Multiple Platforms
Source: MBO Partners and Emergent Research, “Independent Workers and the On-Demand Economy”, USA, 4/15. MBO Partners defines workers in the in the “On-Demand Economy,” as those who generate economic activity through the use of online platforms and marketplaces that help customers quickly connect and transact with suppliers of goods and services. These include services like Airbnb, Uber, Lyft, Handy, Etsy, TaskRabbit, and many others. * NOTE: MBO study only includes on-demand workers who devote at least one hour per week to an on-demand platform. Those who use these platforms less frequently are not counted. Figure has been de-duplicated.
75%
25%
Worked on One PlatformWorked on Multiple Platforms
Percent of ‘On-Demand’ Workers Who Use Multiple Platforms, USA, 2014
136
Growth in Online Platforms / Marketplaces =
Creates Benefits & Challenges
137
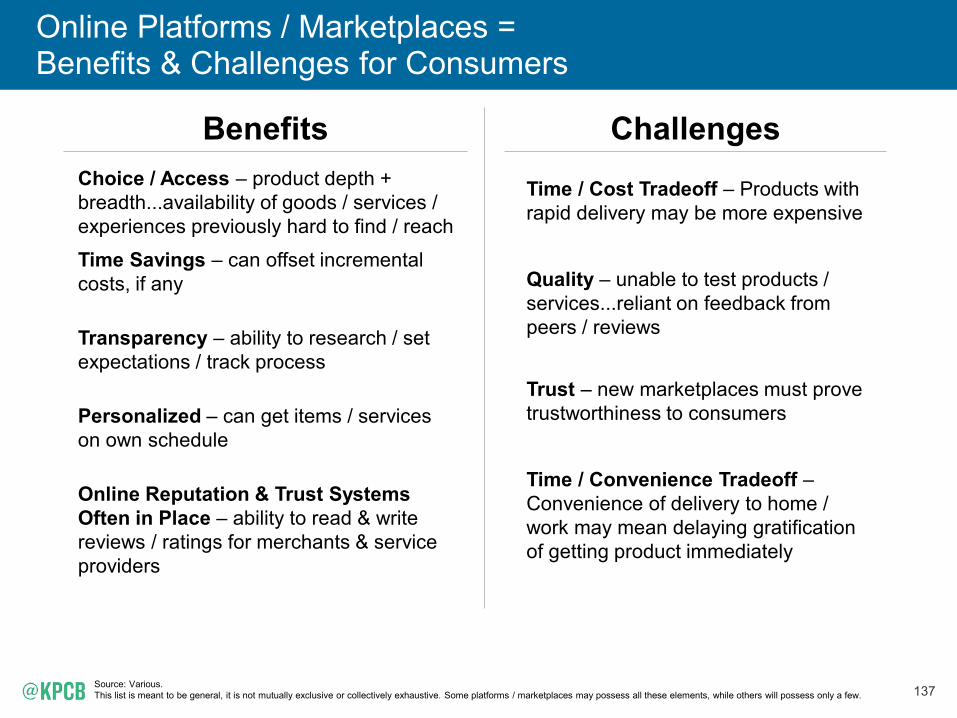
Online Platforms / Marketplaces = Benefits & Challenges for Consumers
Source: Various. This list is meant to be general, it is not mutually exclusive or collectively exhaustive. Some platforms / marketplaces may possess all these elements, while others will possess only a few.
Time / Cost Tradeoff – Products with rapid delivery may be more expensive
Quality – unable to test products / services...reliant on feedback from peers / reviews
Trust – new marketplaces must prove trustworthiness to consumers
Time / Convenience Tradeoff – Convenience of delivery to home / work may mean delaying gratification of getting product immediately
Choice / Access – product depth + breadth...availability of goods / services / experiences previously hard to find / reach
Time Savings – can offset incremental costs, if any
Transparency – ability to research / set expectations / track process
Personalized – can get items / services on own schedule
Online Reputation & Trust Systems Often in Place – ability to read & write reviews / ratings for merchants & service providers
Benefits Challenges
138
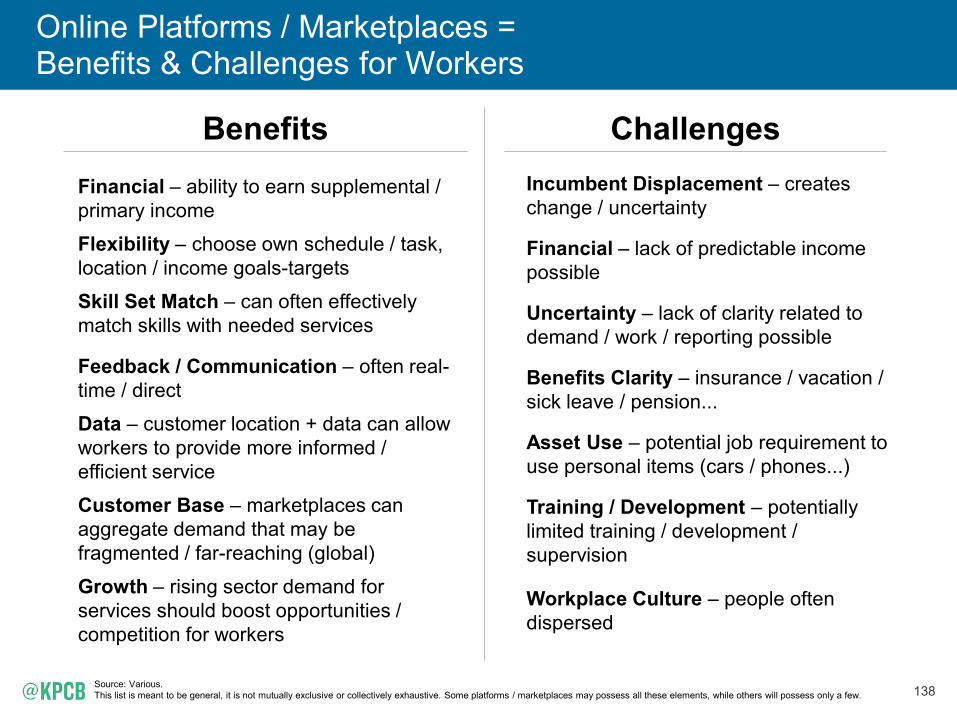
Online Platforms / Marketplaces = Benefits & Challenges for Workers
Financial – ability to earn supplemental / primary income
Flexibility – choose own schedule / task, location / income goals-targets
Skill Set Match – can often effectively match skills with needed services
Feedback / Communication – often real-time / direct
Data – customer location + data can allow workers to provide more informed / efficient service
Customer Base – marketplaces can aggregate demand that may be fragmented / far-reaching (global)
Growth – rising sector demand for services should boost opportunities / competition for workers
Incumbent Displacement – creates change / uncertainty
Financial – lack of predictable income possible
Uncertainty – lack of clarity related to demand / work / reporting possible
Benefits Clarity – insurance / vacation / sick leave / pension...
Asset Use – potential job requirement to use personal items (cars / phones...)
Training / Development – potentially limited training / development / supervision
Workplace Culture – people often dispersed
Benefits Challenges
Source: Various. This list is meant to be general, it is not mutually exclusive or collectively exhaustive. Some platforms / marketplaces may possess all these elements, while others will possess only a few.
ONLINE MARKETPLACE / PLATFORMS = REGULATORY FOCUS EVOLVING
140
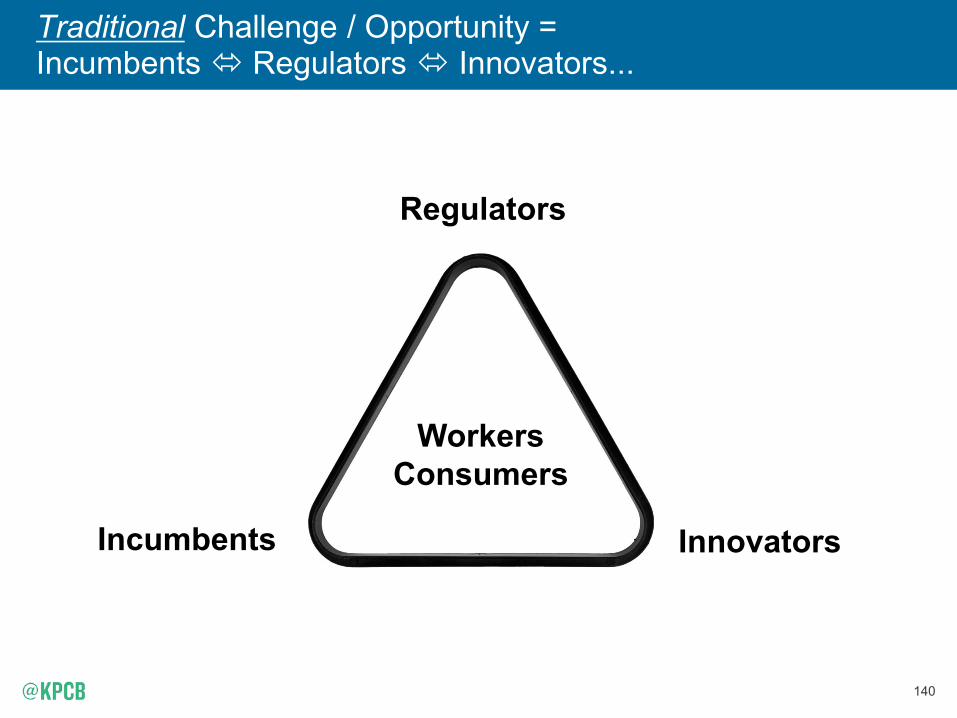
Traditional Challenge / Opportunity = Incumbents Ù Regulators Ù Innovators...
Regulators
Incumbents Innovators
Workers Consumers
141
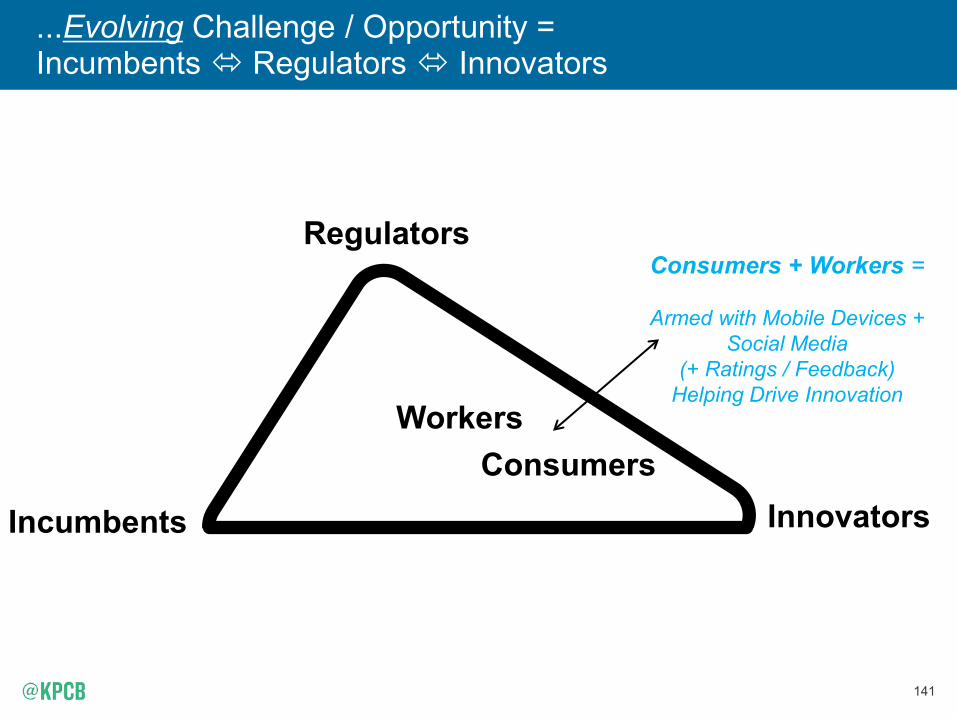
...Evolving Challenge / Opportunity = Incumbents Ù Regulators Ù Innovators
Regulators
Incumbents Innovators
Consumers + Workers =
Armed with Mobile Devices + Social Media
(+ Ratings / Feedback) Helping Drive Innovation
Consumers Workers
142
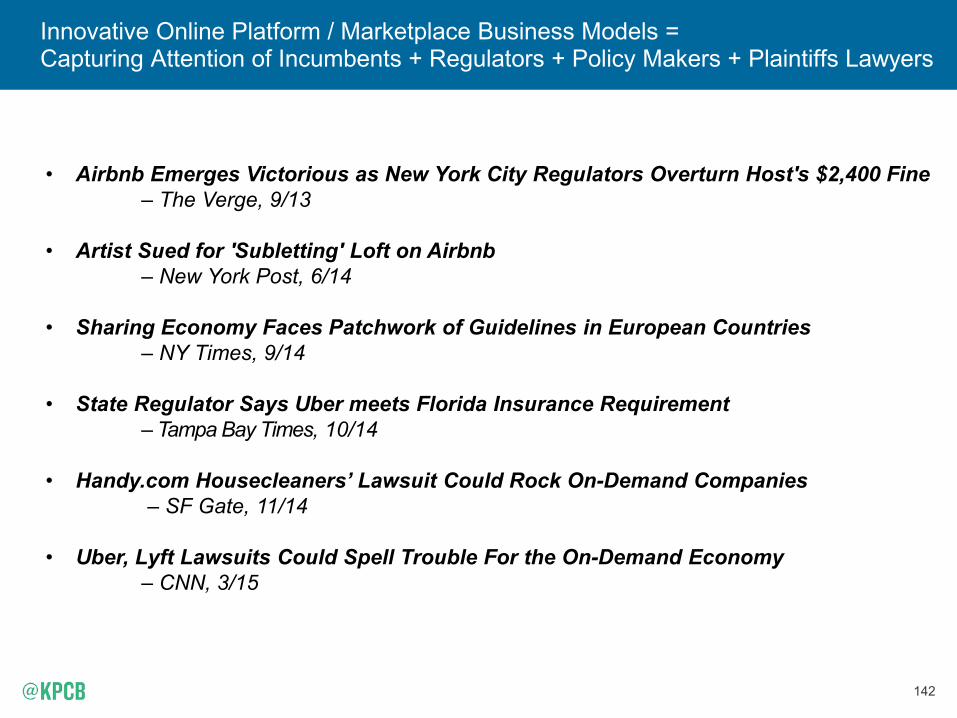
Innovative Online Platform / Marketplace Business Models = Capturing Attention of Incumbents + Regulators + Policy Makers + Plaintiffs Lawyers
• Airbnb Emerges Victorious as New York City Regulators Overturn Host's $2,400 Fine – The Verge, 9/13 • Artist Sued for 'Subletting' Loft on Airbnb – New York Post, 6/14 • Sharing Economy Faces Patchwork of Guidelines in European Countries – NY Times, 9/14 • State Regulator Says Uber meets Florida Insurance Requirement – Tampa Bay Times, 10/14 • Handy.com Housecleaners’ Lawsuit Could Rock On-Demand Companies – SF Gate, 11/14 • Uber, Lyft Lawsuits Could Spell Trouble For the On-Demand Economy – CNN, 3/15

143
Uber, Lyft... = Facing Confusion in Regulatory Environment Related to Worker Classification System
Source: Cotter vs. Lyft Inc., et al Order Denying Cross-Motions for Summary Judgment, 3/15. National Law Review, 3/15
California law defines whether workers are employees or independent contractors, and there’s a test, but the test and classification system are woefully outdated...
...It seems to me, as a matter of common sense, that Lyft drivers don’t fall into the traditional understanding of [the two classifications]. They seem to fall into a third category....
The jury in this case will be handed a square peg and asked to choose between two round holes. The test the California courts have developed over the 20th Century for classifying workers isn't very helpful in addressing this 21st Century problem...
- Judge Vince Chhabria, U.S. District Judge Presiding Over Cotter vs. Lyft Inc., et al
*Note that Lyft was eventually denied motion for summary judgement & case will need to be decided by a jury.
144
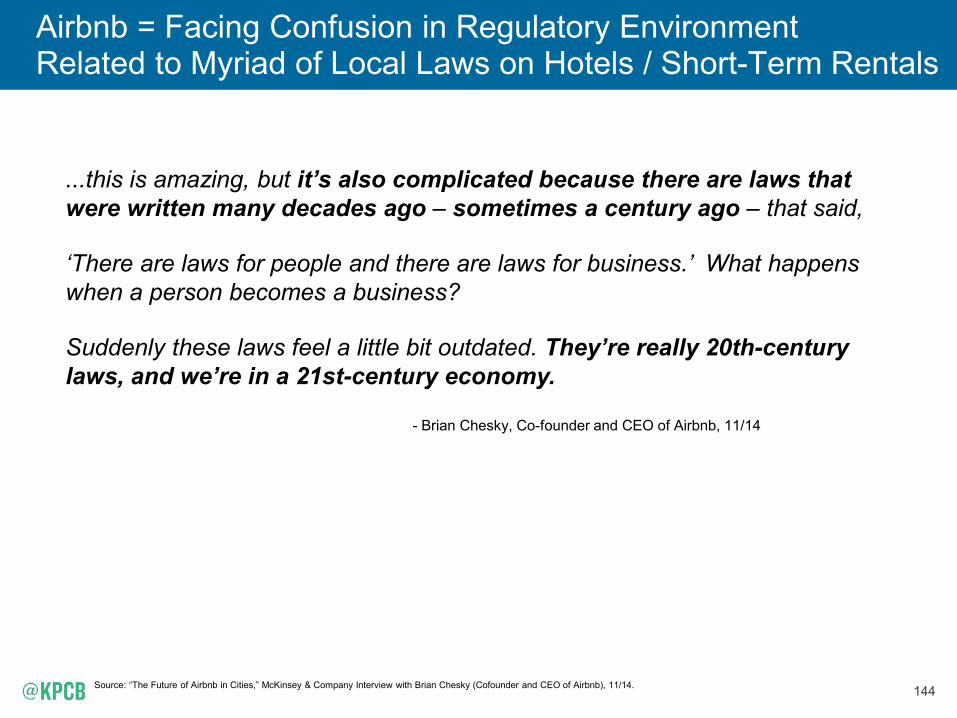
Airbnb = Facing Confusion in Regulatory Environment Related to Myriad of Local Laws on Hotels / Short-Term Rentals
Source: “The Future of Airbnb in Cities,” McKinsey & Company Interview with Brian Chesky (Cofounder and CEO of Airbnb), 11/14.
...this is amazing, but it’s also complicated because there are laws that were written many decades ago – sometimes a century ago – that said,
‘There are laws for people and there are laws for business.’ What happens when a person becomes a business?
Suddenly these laws feel a little bit outdated. They’re really 20th-century laws, and we’re in a 21st-century economy.
- Brian Chesky, Co-founder and CEO of Airbnb, 11/14
145
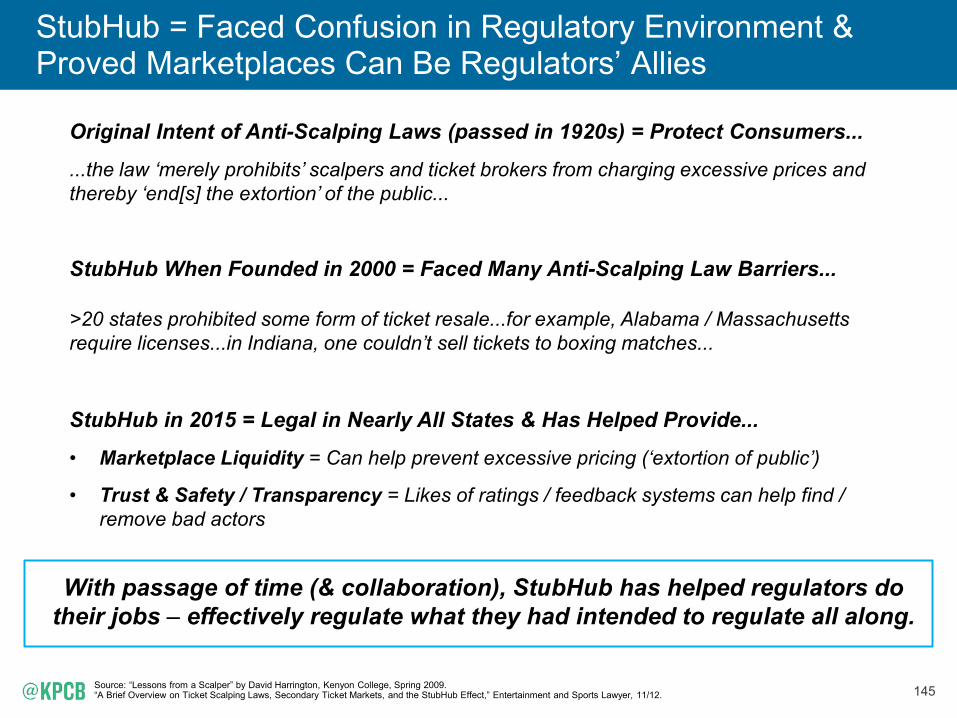
StubHub = Faced Confusion in Regulatory Environment & Proved Marketplaces Can Be Regulators’ Allies
Source: “Lessons from a Scalper” by David Harrington, Kenyon College, Spring 2009. “A Brief Overview on Ticket Scalping Laws, Secondary Ticket Markets, and the StubHub Effect,” Entertainment and Sports Lawyer, 11/12.
Original Intent of Anti-Scalping Laws (passed in 1920s) = Protect Consumers...
...the law ‘merely prohibits’ scalpers and ticket brokers from charging excessive prices and thereby ‘end[s] the extortion’ of the public...
StubHub When Founded in 2000 = Faced Many Anti-Scalping Law Barriers... >20 states prohibited some form of ticket resale...for example, Alabama / Massachusetts require licenses...in Indiana, one couldn’t sell tickets to boxing matches...
StubHub in 2015 = Legal in Nearly All States & Has Helped Provide...
• Marketplace Liquidity = Can help prevent excessive pricing (‘extortion of public’)
• Trust & Safety / Transparency = Likes of ratings / feedback systems can help find / remove bad actors
With passage of time (& collaboration), StubHub has helped regulators do
their jobs – effectively regulate what they had intended to regulate all along.
150
China =
Digital Innovation Alive & Well
Hillhouse Capital* Created / Provided China Section of Internet Trends, 2015
*Disclaimer – The information provided in the following slides is for informational and illustrative purposes only. No representation or warranty, express or implied, is given and no responsibility or liability is accepted by any person with respect to the accuracy, reliability, correctness or completeness of this Information or its contents or any oral or written communication in connection with it. A business relationship, arrangement, or contract by or among any of the businesses described herein may not exist at all and should not be implied or assumed from the information provided. The information provided herein by Hillhouse Capital does not constitute an offer to sell or a solicitation of an offer to buy, and may not be relied upon in connection with the purchase or sale of, any security or interest offered, sponsored, or managed by Hillhouse Capital or its affiliates.
151
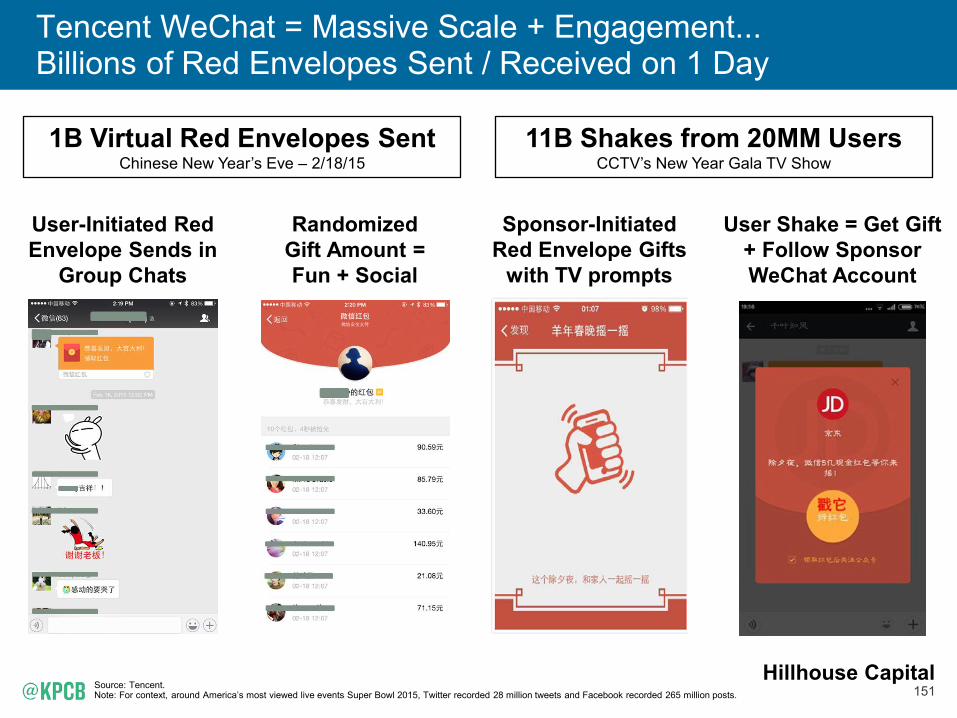
Tencent WeChat = Massive Scale + Engagement... Billions of Red Envelopes Sent / Received on 1 Day
Source: Tencent. Note: For context, around America’s most viewed live events Super Bowl 2015, Twitter recorded 28 million tweets and Facebook recorded 265 million posts.
User-Initiated Red Envelope Sends in
Group Chats
Randomized Gift Amount = Fun + Social
Sponsor-Initiated Red Envelope Gifts
with TV prompts
User Shake = Get Gift + Follow Sponsor WeChat Account
1B Virtual Red Envelopes Sent Chinese New Year’s Eve – 2/18/15
11B Shakes from 20MM Users CCTV’s New Year Gala TV Show
Hillhouse Capital

152
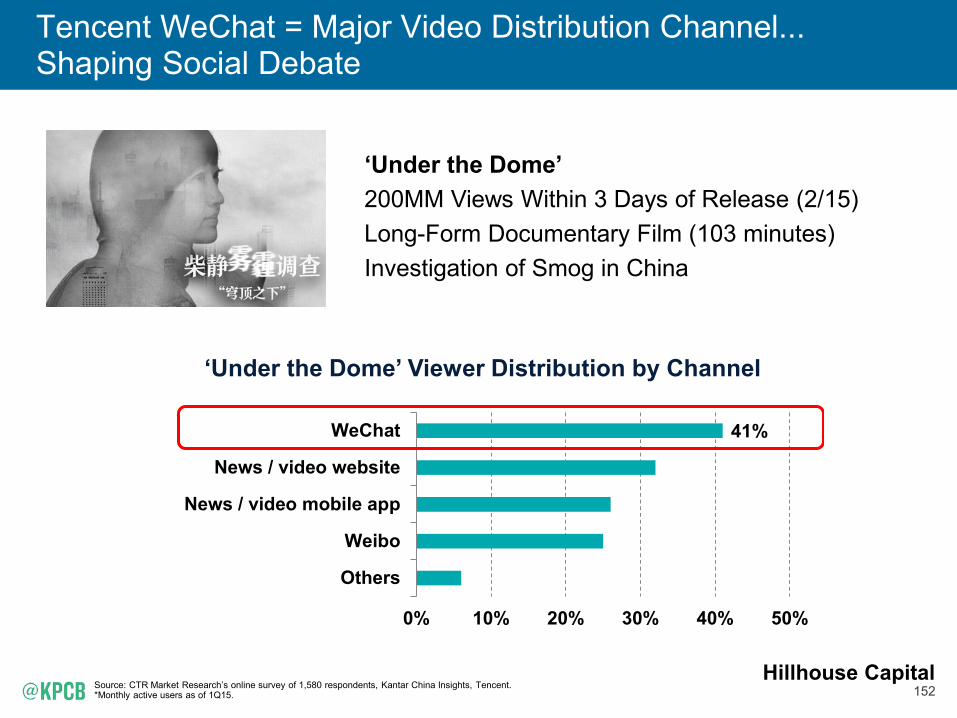
Tencent WeChat = Major Video Distribution Channel... Shaping Social Debate
Source: CTR Market Research’s online survey of 1,580 respondents, Kantar China Insights, Tencent. *Monthly active users as of 1Q15.
‘Under the Dome’ 200MM Views Within 3 Days of Release (2/15) Long-Form Documentary Film (103 minutes) Investigation of Smog in China
‘Under the Dome’ Viewer Distribution by Channel
41%
Others
News / video mobile app
News / video website
0% 10% 20% 30% 40% 50%
Hillhouse Capital
153
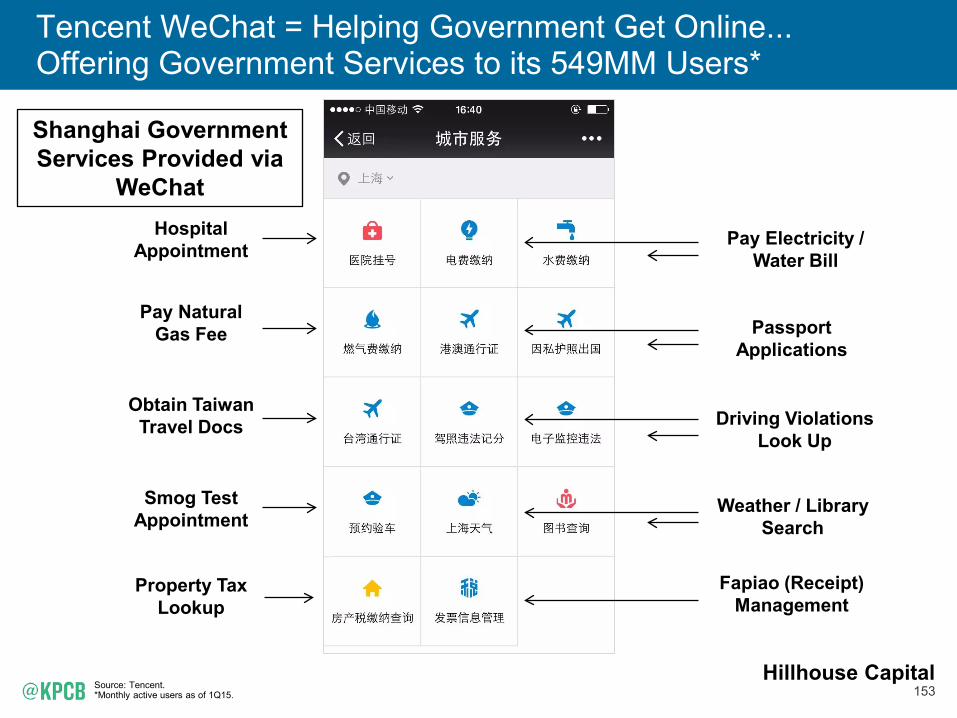
Tencent WeChat = Helping Government Get Online... Offering Government Services to its 549MM Users*
Source: Tencent. *Monthly active users as of 1Q15.
Shanghai Government Services Provided via
WeChat Hospital
Appointment
Pay Natural Gas Fee
Obtain Taiwan Travel Docs
Smog Test Appointment
Property Tax Lookup
Pay Electricity / Water Bill
Passport Applications
Driving Violations Look Up
Weather / Library Search
Fapiao (Receipt) Management
Hillhouse Capital
154
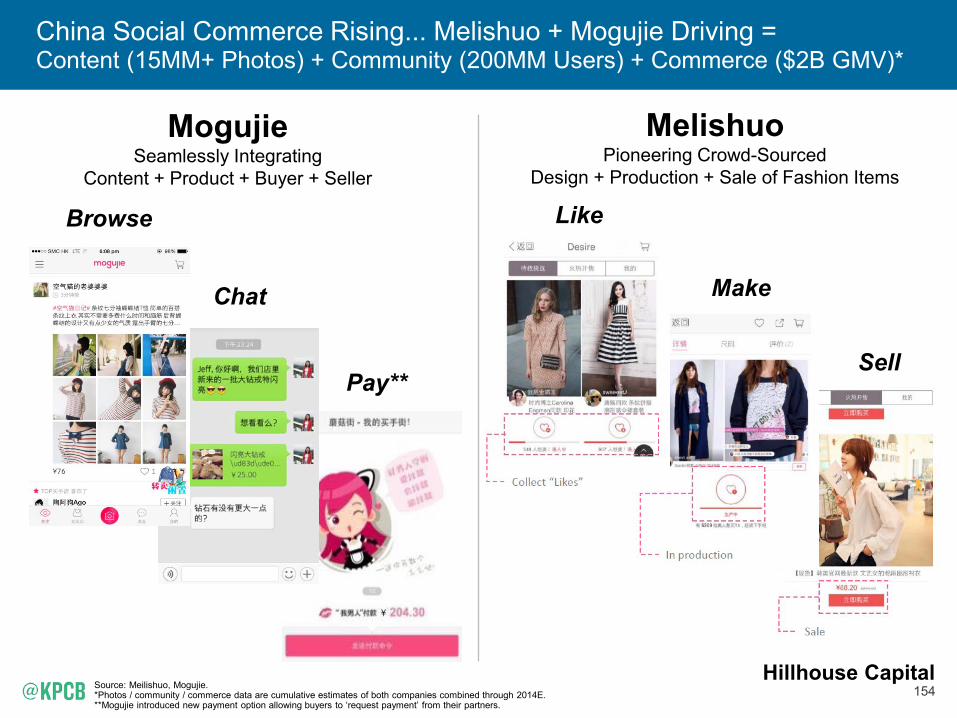
China Social Commerce Rising... Melishuo + Mogujie Driving = Content (15MM+ Photos) + Community (200MM Users) + Commerce ($2B GMV)*
Source: Meilishuo, Mogujie. *Photos / community / commerce data are cumulative estimates of both companies combined through 2014E. **Mogujie introduced new payment option allowing buyers to ‘request payment’ from their partners.
Melishuo Pioneering Crowd-Sourced
Design + Production + Sale of Fashion Items
Mogujie Seamlessly Integrating
Content + Product + Buyer + Seller
Browse
Chat
Pay**
Like
Make
Sell
Hillhouse Capital
155
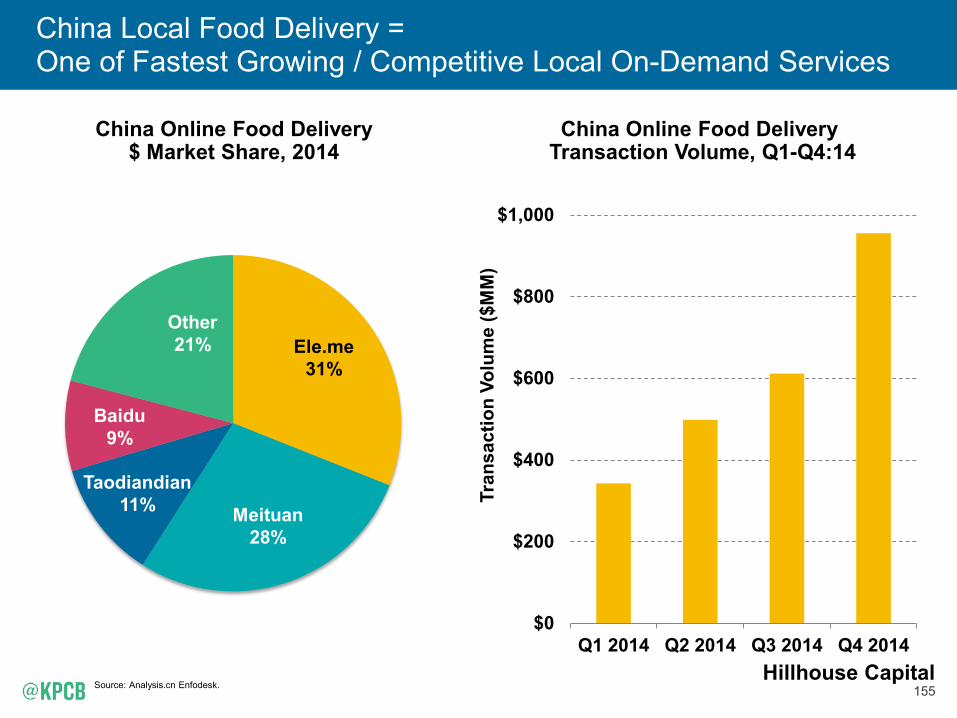
China Local Food Delivery = One of Fastest Growing / Competitive Local On-Demand Services
China Online Food Delivery Transaction Volume, Q1-Q4:14
Source: Analysis.cn Enfodesk.
$0
$200
$400
$600
$800
$1,000
Q1 2014 Q2 2014 Q3 2014 Q4 2014
Tran
sact
ion
Volu
me
($M
M)
Ele.me 31%
Meituan 28%
Taodiandian 11%
Baidu 9%
Other 21%
China Online Food Delivery $ Market Share, 2014
Hillhouse Capital
156
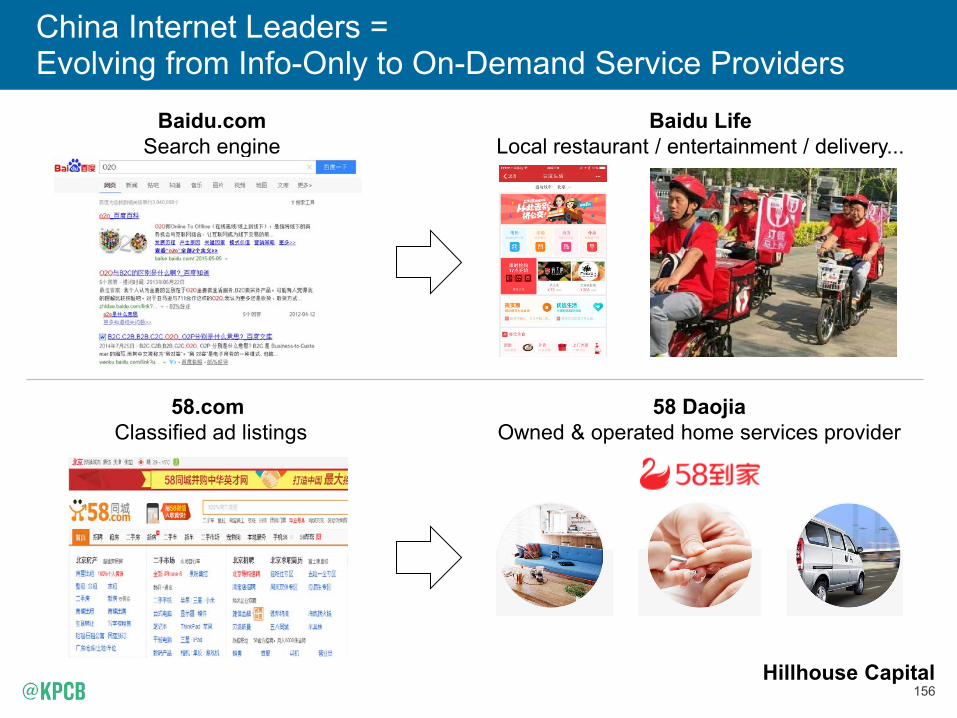
China Internet Leaders = Evolving from Info-Only to On-Demand Service Providers
Baidu.com Search engine
Baidu Life Local restaurant / entertainment / delivery...
58.com Classified ad listings
58 Daojia Owned & operated home services provider
Hillhouse Capital
157
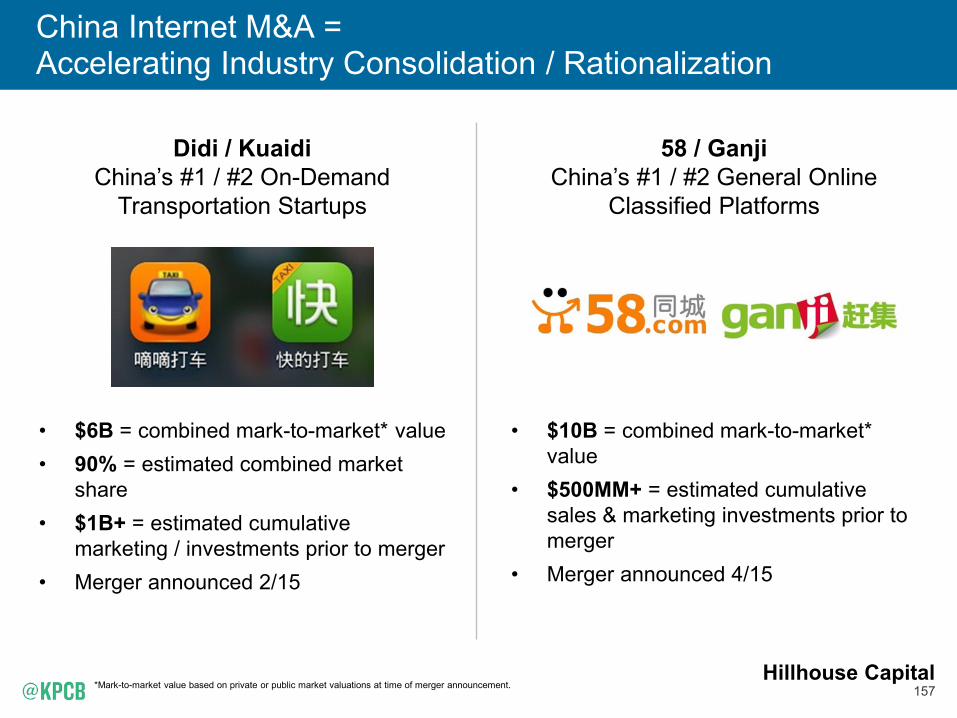
China Internet M&A = Accelerating Industry Consolidation / Rationalization
*Mark-to-market value based on private or public market valuations at time of merger announcement.
Didi / Kuaidi China’s #1 / #2 On-Demand
Transportation Startups
• $6B = combined mark-to-market* value • 90% = estimated combined market
share • $1B+ = estimated cumulative
marketing / investments prior to merger • Merger announced 2/15
58 / Ganji China’s #1 / #2 General Online
Classified Platforms
• $10B = combined mark-to-market* value
• $500MM+ = estimated cumulative sales & marketing investments prior to merger
• Merger announced 4/15
Hillhouse Capital
158
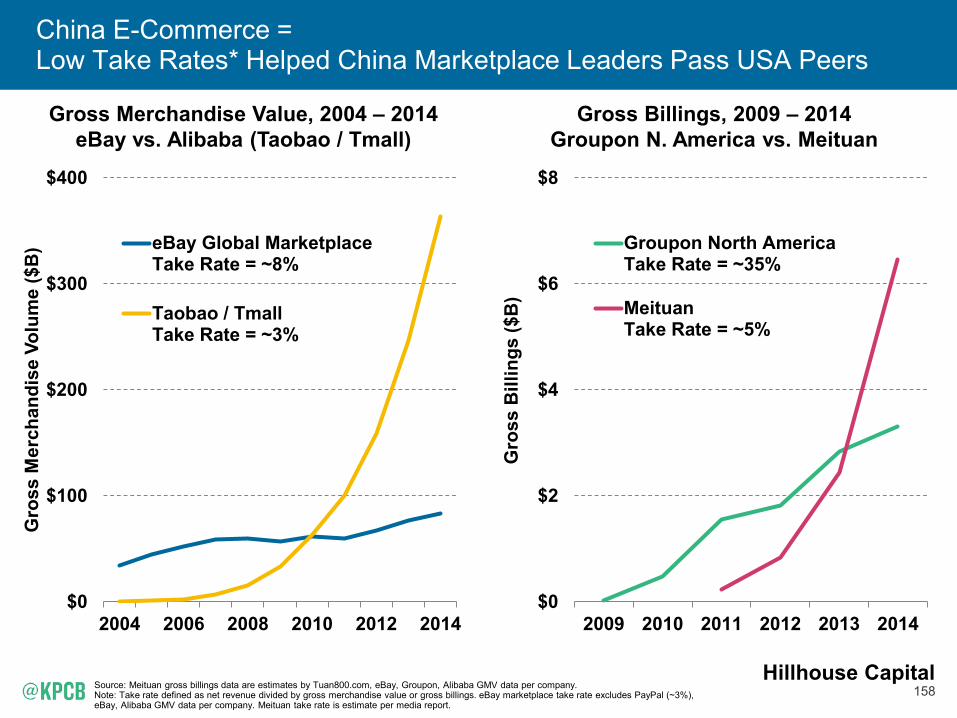
China E-Commerce = Low Take Rates* Helped China Marketplace Leaders Pass USA Peers
Source: Meituan gross billings data are estimates by Tuan800.com, eBay, Groupon, Alibaba GMV data per company. Note: Take rate defined as net revenue divided by gross merchandise value or gross billings. eBay marketplace take rate excludes PayPal (~3%), eBay, Alibaba GMV data per company. Meituan take rate is estimate per media report.
Gross Merchandise Value, 2004 – 2014 eBay vs. Alibaba (Taobao / Tmall)
Gross Billings, 2009 – 2014 Groupon N. America vs. Meituan
$0
$100
$200
$300
$400
2004 2006 2008 2010 2012 2014
Gro
ss M
erch
andi
se V
olum
e ($
B) eBay Global Marketplace
Take Rate = ~8%
Taobao / TmallTake Rate = ~3%
$0
$2
$4
$6
$8
2009 2010 2011 2012 2013 2014
Gro
ss B
illin
gs ($
B)
Groupon North AmericaTake Rate = ~35%
MeituanTake Rate = ~5%
Hillhouse Capital

151
Tencent WeChat = Massive Scale + Engagement... Billions of Red Envelopes Sent / Received on 1 Day
Source: Tencent. Note: For context, around America’s most viewed live events Super Bowl 2015, Twitter recorded 28 million tweets and Facebook recorded 265 million posts.
User-Initiated Red Envelope Sends in
Group Chats
Randomized Gift Amount = Fun + Social
Sponsor-Initiated Red Envelope Gifts
with TV prompts
User Shake = Get Gift + Follow Sponsor WeChat Account
1B Virtual Red Envelopes Sent Chinese New Year’s Eve – 2/18/15
11B Shakes from 20MM Users CCTV’s New Year Gala TV Show
Hillhouse Capital
152
Tencent WeChat = Major Video Distribution Channel... Shaping Social Debate
Source: CTR Market Research’s online survey of 1,580 respondents, Kantar China Insights, Tencent. *Monthly active users as of 1Q15.
‘Under the Dome’ 200MM Views Within 3 Days of Release (2/15) Long-Form Documentary Film (103 minutes) Investigation of Smog in China
‘Under the Dome’ Viewer Distribution by Channel
41%
Others
News / video mobile app
News / video website
0% 10% 20% 30% 40% 50%
Hillhouse Capital
176
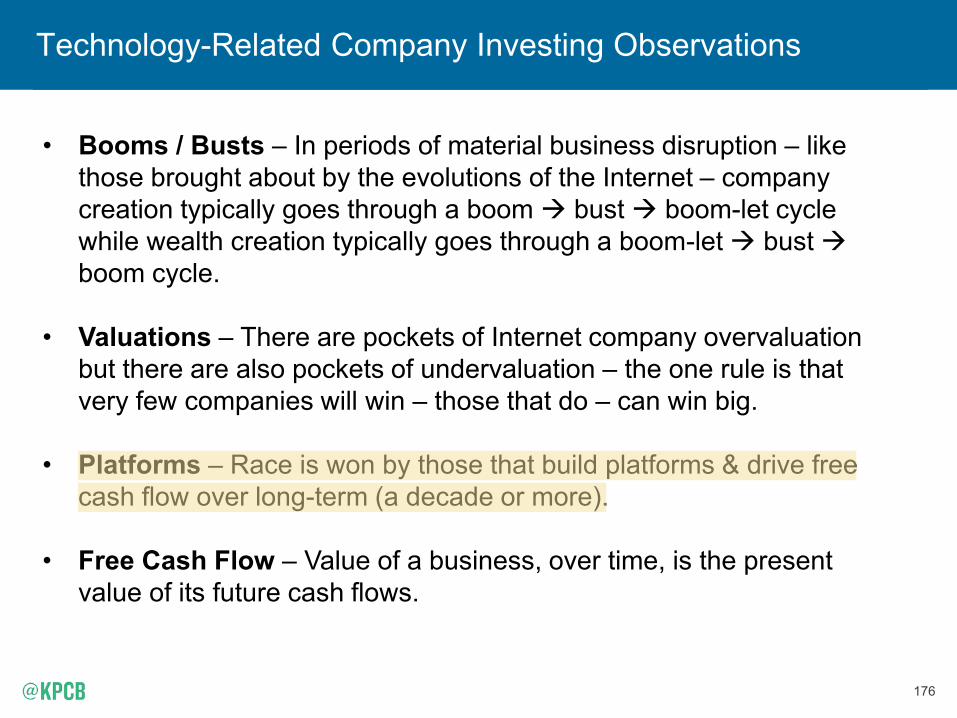
Technology-Related Company Investing Observations
• Booms / Busts – In periods of material business disruption – like those brought about by the evolutions of the Internet – company creation typically goes through a boom Æ bust Æ boom-let cycle while wealth creation typically goes through a boom-let Æ bust Æ boom cycle.
• Valuations – There are pockets of Internet company overvaluation but there are also pockets of undervaluation – the one rule is that very few companies will win – those that do – can win big.
• Platforms – Race is won by those that build platforms & drive free
cash flow over long-term (a decade or more).
• Free Cash Flow – Value of a business, over time, is the present value of its future cash flows.
nick johnson