The Plastics Industry Globally – Challenges and Opportunities
32
The Plastics Industry Globally – Challenges and Opportunities Presented By: Michael D. Taylor Vice President, International Affairs and Trade CHINA-PEC 2015 Taizhou International Convention & Exhibition Center Taizhou, China September 21, 2015
-
Upload
michael-taylor -
Category
Business
-
view
313 -
download
1
Transcript of The Plastics Industry Globally – Challenges and Opportunities
The Plastics Industry Globally – Challenges
and Opportunities
Presented By:
Michael D. Taylor
Vice President, International Affairs and Trade
CHINA-PEC 2015
Taizhou International Convention & Exhibition Center
Taizhou, China
September 21, 2015

Agenda
Background on SPI
Overview of U.S. Plastics Industry
U.S.-China Plastics Trade
Challenges
Opportunities
Q&A

Founded in 1937, SPI is the only U.S.
trade association representing ALL
segments of the plastics industry

The U.S. Plastics Industry
In 2014…
• 3rd largest industry in U.S.
• Record-breaking domestic demand
Up 6.0% to $298.3 billion
• Shipped more than $427.3 billion in goods
• Employed 940,000 people
• Operated 16,806 facilities in every U.S. state
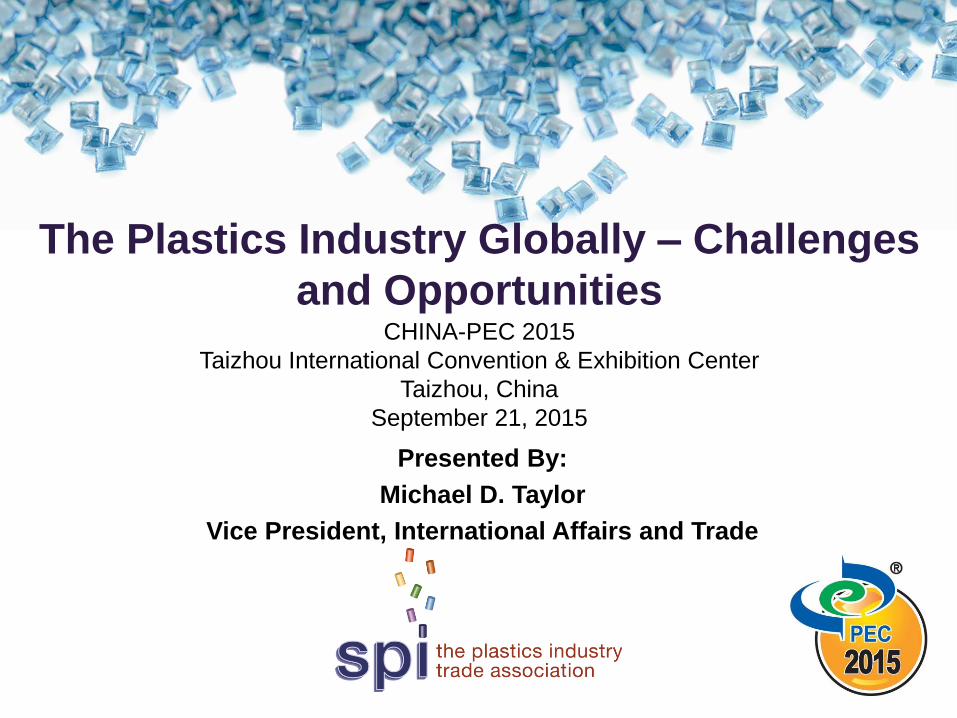
U.S. Demand for Plastics Sets
New High Level
$0
$50
$100
$150
$200
$250
$300
$350
1994 1995 1996 1997 1998 1999 2000 2001 2002 2003 2004 2005 2006 2007 2008 2009 2010 2011 2012 2013 2014
$ in b
illio
ns
Machinery Molds Plastic Products Resin
Apparent Consumption = Shipments + Imports – Exports
Source: SPI “Global Business Trends” (2015)

Plastics Have Historically Grown
Faster than all Manufacturing
Comparative Growth Rates 1980 - 2014
Plastics
Mfg All Mfg
Employment 0.3% -1.3%
Real Shipments 2.6% 0.8%
Real Value Added 2.3% 0.8%
Productivity Growth 2.3% 2.1%
• Plastics manufacturing
employment grew 0.3 percent
per year since 1980
• The value of manufactured
shipments grew by 2.6
percent per year since 1980
• Productivity grew by 2.3
percent per year since 1980
Source: SPI “Size and Impact of the U.S. Plastics Industry” (2015)
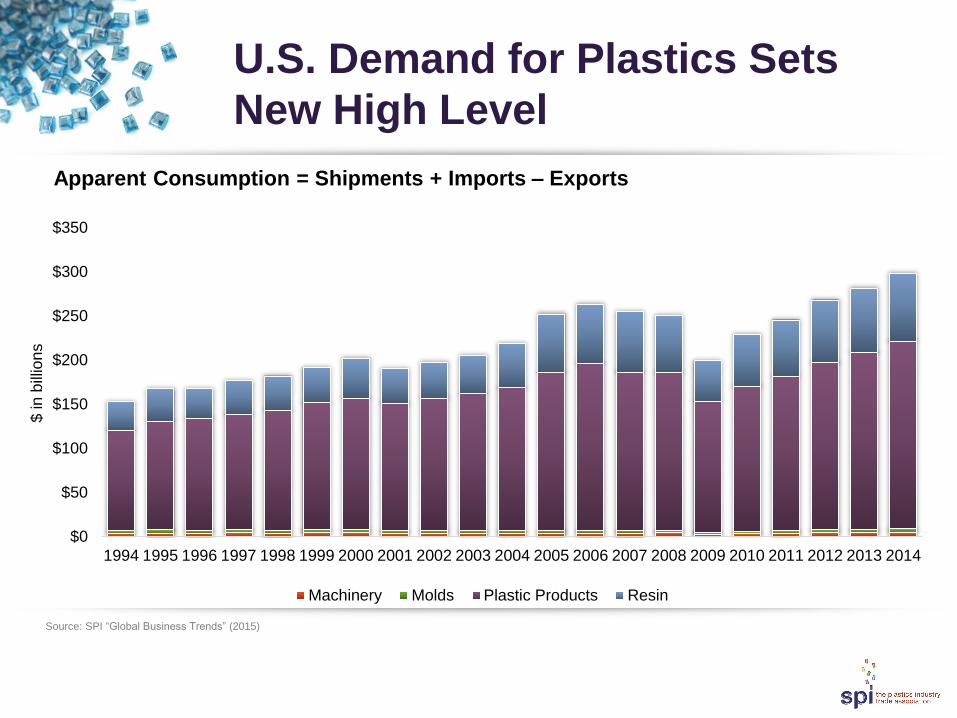
Positive
trade balance
of $12.6 billion
$49.5B PLASTICS 7.3%
2014 Trade Statistics
In 2014, the U.S. plastics industry exported goods valued at $62.1 billion, up 3.1
percent from 2013
$35.1B RESINS 1.8%
$25.0B PRODUCTS 5.1%
$528.3M MOLDS 10.1%
$1.7B MACHINERY 7.7%
Source: U.S. International Trade Commission

Top U.S. Plastics Industry
Export Markets
$0
$5
$10
$15
$20
$25
$30
200
2
200
3
200
4
200
5
200
6
200
7
200
8
200
9
201
0
201
1
201
2
201
3
201
4
U.S
. $
Bill
ion
s
Mexico Canada China Belgium Brazil All Others
Top Plastics Industry
Export Markets 2014
All Others $23.5 billion
Mexico $15.8 billion
Canada $13.2 billion
China $5.2 billion
Belgium $2.4 billion
Brazil $2.1 billion
Total $62.1 billion

U.S. Plastics Industry Exports to
China 2000-2014
0
1
2
3
4
5
62
000
2001
2002
2003
2004
2005
2006
2007
2008
2009
2010
2011
20
12
2013
2014
Industry Resin
U.S
. $
Bill
ions

U.S. Plastics Industry Exports to
China 2000-2014
0
200
400
600
800
1,000
1,200
1,4002
000
2001
2002
2003
2004
2005
2006
2007
2008
2009
2010
2011
20
12
2013
2014
Products Machinery Molds
U.S
. $
Mill
ions
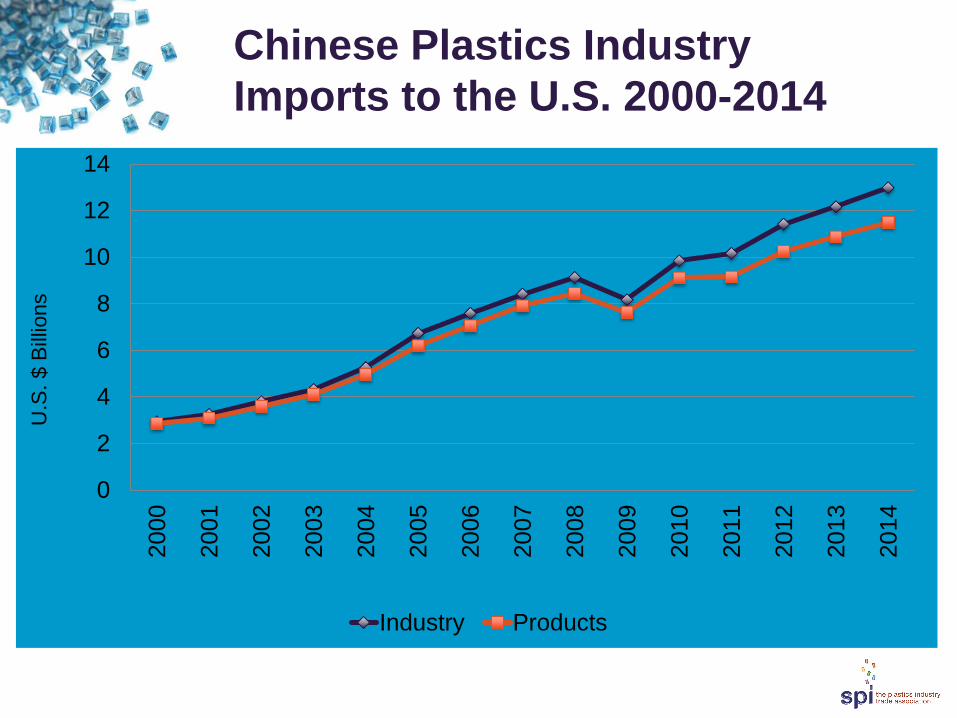
Chinese Plastics Industry
Imports to the U.S. 2000-2014
0
2
4
6
8
10
12
142
000
2001
2002
2003
2004
2005
2006
2007
2008
2009
2010
2011
20
12
2013
2014
Industry Products
U.S
. $
Bill
ions

Chinese Plastics Industry
Imports to the U.S. 2000-2014
0
100
200
300
400
500
600
700
800
900
1,0002
000
2001
2002
2003
2004
2005
2006
2007
2008
2009
2010
2011
20
12
2013
2014
Resin Machinery Molds
U.S
. $
Mill
ions

Challenges
Uncertainty and Risks
Image and Misinformation
Cost of Doing Business
13

The Impacts of Economic Policy
Uncertainty in the U.S.

The Impacts of Economic Policy
Uncertainty in China

Our Image Problem – A Source
of Many Challenges
• Extended producer
responsibility
• Foodservice packaging bans
• Marine debris initiatives
(Operation Clean Sweep)
• Product deselection based
on chemical content
• Bag bans or taxes
China – No Exception
• In practically all industrial countries, environmental management has become stricter over time largely as a response to vocal public demand for better protection from pollution.
• As incomes and access to information increase, public pressure on polluters directly and on governments charged with environmental management will continue to grow.
• Before 1994, China had no environmental non-governmental organizations (NGOs). As of 2005, the number exploded to approximately 2,000 NGOs that were officially registered.
• We are seeing a new form of environmental and health consciousness in China’s urban centers, especially in the eastern seaboard cities.
17

The Macroeconomic Impact of
Federal Regulations
• A new report by NAM finds that the
average U.S. company pays $9,991
per employee per year to comply with
federal regulations.
• The average manufacturer in the
United States pays nearly double that
amount—$19,564 per employee per
year.
• Small manufacturers, or those with
fewer than 50 employees, incur
regulatory costs of $34,671 per
employee per year. This is more than
three times the cost borne by the
average U.S. company.
Some Key Findings
Total cost of federal regulations in
2012 was $2.028 trillion (in 2014
dollars).
The annual cost burden for an
average U.S. firm is $233,182, or
21 percent of average payroll.
Eighty-eight percent of those
surveyed say that federal
regulations are a top challenge for
their firm.

Regulatory Compliance Costs per
Employee per Year for Manufacturers,
2012 (in 2014 Dollars)
$19,564
Average of All
Manufacturers*
$34,671
Small
Manufacturers
(< 50 Employees)
$18,243
Medium
Manufacturers
(50−99
Employees)
$13,750
Large
Manufacturers
(100+ Employees)
*The average compliance costs for manufacturers to comply with federal
regulations ($19,564 per employee per year) is nearly double the rate seen for
all U.S. businesses ($9,991 per employee per year).
For small manufacturers with fewer than 50 employees, compliance costs per
employee are more than three times the average of all firms.

Opportunities
Trade
Corporate Sustainability
Environmental Stewardship
20

Trans-Pacific Partnership Trans-Atlantic Trade &
Investment Partnership
Global Business Opportunities
• 2014: U.S. plastics
industry exports to the
11 TPP countries were
more than $34B
• Since 2000: plastics
exports to TPP
countries increased
more than 91%
• 2014: plastics industry
trade surplus with TPP
countries was $13.7B
• A high-standard TTIP
would advance trade
and investment
liberalization and
address regulatory and
other non-tariff barriers
• Based on 2011 trade
flows, the U.S. plastics
industry would be one
of the top benefiting
sectors with a total
potential tariff savings
of $465M

U.S. Plastics Trade Balance
by Segment 2000-2014
Source: U.S. International Trade Commission
-10
-5
0
5
10
15
20
25
Resin Products Machinery Molds

U.S. Plastics Trade Balance with
FTA Countries by Segment
2000-2014
Source: U.S. International Trade Commission
-2
0
2
4
6
8
10
12
Resin Products Machinery Molds

China and Free Trade
Agreements
• The Chinese Government sees FTAs as a new platform to further
opening up to the outside and speeding up domestic reforms and an
effective approach to integrate into global economy and strengthen
economic cooperation with other economies.
• Currently, China has 19 FTAs under construction, among which 14
Agreements have been signed and implemented already.
• Regional Comprehensive Economic Partnership (RCEP) is a
proposed FTA between the ten member states of the Association of
Southeast Asian Nations (ASEAN) and the six states with which
ASEAN has existing FTAs. RCEP negotiations were formally
launched in November 2012 at the ASEAN Summit in Cambodia.
24

Corporate Sustainability
Emerges in China
• The largely Western concept of “corporate social responsibility”
(CSR) is beginning to emerge in China.
• According to one study, 582 CSR reports of different forms were
released by Chinese companies in 2009, about three-and-a-half
times the number produced the year before.
• There is a strong movement by Chinese firms to implement CSR
and integrate aspects of CSR into their own operations, such as
making sure their supply chains are green.
25

A Proactive Approach to
Sustainability
• High number of activities pursued relative to sustainability
• Seek opportunities to invest in sustainability
• Integrate sustainability into business practices
• Shape regulation actively
• Communicate engagement in sustainability activities to external
audiences
• Seeks external views regarding its sustainability activities

Strong Performers Share Certain
Characteristics
• They set aggressive external targets or goals for their sustainability
initiatives.
• They have a unified sustainability strategy with clearly articulated
strategic priorities.
• They set aggressive internal targets or goals for their sustainability
initiatives.
• A broad leadership coalition is involved in shaping or co-creating the
sustainability strategy, goals, and milestones.
• The financial benefits of sustainability are clearly understood across
the company.

28

Program Components
• OCS Goal: Zero Plastic Pellet Loss! – Keep pellets where they belong
• OCS Principles: – Avoid spills and clean them up if they occur – Dispose of and handle pellets properly
• OCS program composed of: – Employee training tools – Housekeeping procedures for all aspects of the industry

Industry Efforts Can Show Results Trend: -33 ± 3 pellets km-2 year-1
r2 = 0.83, p<0.01

International Participation in OCS ABIPLAST (Brazil) ACIPLAST (Costa Rica) AIPMA (India) ANIPAC (Mexico) ASEPLAS (Ecuador) ASIPLA (Chile) British Plastics Federation Canadian Plastics Industry Association China Plastics Processing Industry Association COGUAPLAST (Guatemala) Danish Plastics Federation Dutch Federation of Rubber and Plastics Industry EPEMA (Egypt) Fédération de la Plasturgie (France) Malaysian Plastics Manufacturers Association Plastics and Chemicals Industries Association (Australia) + Tangaroa Blue Foundation PET Product & Closure Manufacturer Association (Nepal) Philippine Plastics Industry Association PlasticsEurope Plastics New Zealand Plastics SA (South Africa)

Thank You!
谢谢 Merci Vielen Dank
Grazie ありがとうございました 감사합니다
Obrigado Спасибо Gracias Teşekkürler
Questions & Answers
Michael Taylor
202-974-5232