
The Personalization Services Firm: What to Sell, Whom to Sell to
49
The Personalization Services Firm: What to Sell, Whom to Sell to and For How Much? * Joseph Pancras University of Connecticut School of Business Marketing Department 2100 Hillside Road, Unit 1041 Storrs, CT 06269-20 [email protected] Phone: 860 486-4133 Fax: 860-486-5246 K. Sudhir Yale School of Management 135 Prospect St, PO Box 208200 New Haven, CT 06520-8200 Email: [email protected] Phone: 203-432-3289 Fax: 203-432-3003 July, 2005 * This paper is based on an essay from the first author’s dissertation at New York University. The authors thank Joel Steckel, Yuxin Chen, Paris Cleanthous, Russell Winer, Vicki Morwitz and Jiwoong Shin for feedback and helpful discussions and the workshop participants at Carnegie Mellon University, Koc University, London Business School, New York University, SUNY Buffalo, University of Central Florida, University of Connecticut, University of Georgia, University of Southern California, University of Texas at Austin, Washington University at St. Louis and Yale University for their comments.
Transcript of The Personalization Services Firm: What to Sell, Whom to Sell to
The Personalization Services Firm: What to Sell, Whom to Sell to and For How Much?*
Joseph Pancras University of Connecticut School of Business
Marketing Department 2100 Hillside Road, Unit 1041
Storrs, CT 06269-20 [email protected]
Phone: 860 486-4133 Fax: 860-486-5246
K. Sudhir Yale School of Management
135 Prospect St, PO Box 208200 New Haven, CT 06520-8200
Email: [email protected] Phone: 203-432-3289 Fax: 203-432-3003
July, 2005
* This paper is based on an essay from the first author’s dissertation at New York University. The authors thank Joel Steckel, Yuxin Chen, Paris Cleanthous, Russell Winer, Vicki Morwitz and Jiwoong Shin for feedback and helpful discussions and the workshop participants at Carnegie Mellon University, Koc University, London Business School, New York University, SUNY Buffalo, University of Central Florida, University of Connecticut, University of Georgia, University of Southern California, University of Texas at Austin, Washington University at St. Louis and Yale University for their comments.

The Personalization Services Firm: What to Sell, Whom to Sell to and For How Much?
Abstract
Personalization services such as individual-specific advertising and couponing are a growth
market. Some personalization service firms offer their services on an exclusive basis to
manufacturers in a product category while others offer it on a non-exclusive basis. Some restrict
the length of purchase history data used for personalization, while others use very long purchase
histories. Despite these differences, there is little empirical guidance on what is the optimal
business strategy for a particular firm.
This paper fills this void by offering an empirical framework to help a personalization
services firm choose the right strategy. It also enables the firm to identify new types of future
competitors. We illustrate the approach in the context of a personalized coupon vendor in
grocery retailing. We find that personalization using the maximum available purchase history
data on a non-exclusive basis is the most profitable strategy for the vendor.
We also evaluate the possibility of a grocery retailer using consumer information from its
loyalty card programs to offer these personalized coupon services. We find that since
personalization improves the retailer's profits due to the sale of groceries, the retailer can use this
profit increase to subsidize the sale of personalized coupon services. Therefore retailers may be
the most potent competitive threat to personalized coupon vendors in grocery retailing.
Keywords: Personalization Service, One-to-One Marketing, Targeted Coupons, Competition, Marketing Channels, Information Supplier.

1
1. Introduction
1.1 The Personalization Services Industry
Personalized marketing targeted at individual consumers (a.k.a. one-to-one marketing)
has been on the rise over the last two decades (Peppers and Rogers 1997). A number of vendors
now specialize in offering personalized communication and promotion services to consumer
marketers to help these firms improve the efficiency of their advertising and promotion dollars.
Table 1 lists some of the major players in the personalization services business. For each of these
players, we provide a brief description of their business and report their revenues, market
capitalization and growth rates. As can be seen from Table 1, the industry is gaining in
importance as reflected in its market valuations as well as revenues and growth rates. Several
companies in this industry have revenues in the hundreds of millions of dollars and valuations
over a billion dollars.
**** Insert Table 1 here****
The use of scanners in offline retailing and the intrinsic digital nature of online retailing
have enabled the easy collection of purchase history data. The falling costs of digital storage and
computation have made the recording and analysis of vast amounts of purchase history data for
personalization purposes feasible. In the grocery and drugstore markets, Catalina Marketing
obtains purchase history data through cooperating retailers and provides targeted coupons on
behalf of both grocery manufacturers and retailers to households purchasing at that particular
retailer. Catalina Marketing has penetrated about 21,000 of the roughly 34,000 supermarkets in
the United States and records about 250 million transactions per week, which is then used to aid
manufacturers for targeting. Such targeted marketing considerably enhance response rates and
therefore enhances the efficiency of the marketing programs. For example Catalina’s response
rates are estimated to be around 6-9% compared to the 1-2% response rates for coupons in mass-
mailed free standing inserts (FSI). On the Internet, companies such as DoubleClick collect past
visit data from cooperating websites and use these to deliver targeted advertising for its
advertising clients.
In the catalog and specialty retailing industry, firms such as Abacus B2C Alliance and I-
Behavior pool transactional data from over a thousand catalog titles/retailers to offer improved

2
targeted direct marketing services to its members. While Abacus collects data only at the catalog
level, firms such as I-Behavior collect data at the SKU level. The Abacus B2C Alliance has 1550
catalogs/retailers who have pooled together data on over 4.4 billion transactions from over 90
million households (Miller 2003). I-Behavior has data on over 1000 mid-sized catalog
companies on over 103 million consumers from 89 million households.
Advances in data collection and storage technologies will continue to fuel the growth and
scale of personalization services firms. Further, advances in promotion delivery technologies to
individuals (in-store at the point of purchase; at home through direct mail; online through email;
and even by wireless through cell-phones when on the move) increases the effectiveness and
timeliness of personalized marketing strategies. Not surprisingly, personalized advertising and
promotions are pervasive in a wide range of industries including services such as banking,
telephony, insurance, durable goods such as autos, and the vast range of products sold in
supermarkets and drugs stores. But despite their growing economic importance, there is very
little empirical research addressing issues of concern to this industry.
1.2 The Research Problem
Much of the extant research on this industry to-date has been of the “engineering” type.
The “engineering” type research focuses on how firms should use data about households to better
personalize the advertising or price promotion. This research has occurred in marketing,
information systems and computer science. (Ansari and Mela 2003, Liu and Shih 2005,
Adomavicius et al. 2005). Researchers often position these as approaches by which a firm can
take advantage of its internal databases to improve its marketing effectiveness. Equivalently,
from the point of view of the personalization services industry, this research leads to
technologies that facilitate creation of the “products” they offer to their markets. In contrast to
such “engineering” research, our goal in this paper is to help personalization services firms
answer questions of a “marketing” nature, i.e., once the technology is available, what features the
product should have, who it should be sold to and at what price.
1.2.1 Diversity of Strategies in Practice: Are Current Strategies Optimal?
In practice, personalization services firms offer targeting services to their client on both
an exclusive basis as well as a non-exclusive basis. For example, Catalina divides a year into
four thirteen-week periods and divides the United States into several regions in defining the
product. Within any particular time period and region, it offers the targeting service on an

3
exclusive basis to manufacturers within a particular product category. Catalina divides the
market into hundreds of finely defined categories (currently over 500 categories). In contrast,
targeting service providers in the catalog and specialty retailing arena such as Abacus and i-
Behavior offer their targeting services on a non-exclusive basis. They sell to any catalog
marketer or specialty retailer who requests their services.
These providers also differ in their outlook toward increasing the accuracy of their
targeting services. Catalina’s offers two types of targeting services: (1) Checkout Coupon®,
based on last purchase data and (2) Checkout Direct® based on 65 weeks of purchase history
data. It voluntarily does not use data beyond 65 weeks. Catalina originally decided on the 65
week limit nearly two decades ago, when storage was considerably more expensive. In such an
environment, it makes sense to destroy older data, if more recent data are better predictors of
consumer behavior. However, in many infrequently purchased categories, one would expect that
using data beyond the last 65 weeks can help improve the accuracy of targeting considerably.
Further as data storage costs have fallen, it may make sense to revisit the limit on data used for
targeting. The 65 week limit is also theoretically puzzling because Catalina uses an exclusive
client strategy, where increasing accuracy should always improve profitability for the client and
therefore the price that Catalina can charge for the service. Absent the threat of downstream
competition, increasing accuracy should be profitable unless the cost of storage relative to the
gains is prohibitively expensive.
In contrast to Catalina, a company such as Abacus continues to expand the accuracy of its
database. Abacus pools data from over 1550 catalog marketers/specialty retailers on over 90
million households and continue to expand the depth of purchase information about households
in its database. Abacus uses data for up to 5 years on each household in their database. When
DoubleClick purchased Abacus in 1999, it sought to combine the offline data from Abacus with
online transaction behavior captured by DoubleClick. DoubleClick however did not combine
their offline and online data because privacy advocates vehemently opposed the idea and it
created a public relations problem for Catalina.
Despite the diversity in the practices of firms about “Whom to sell” (Should we sell
exclusively or non-exclusively?) and “What to sell” (“Should we limit the depth of the data used
for targeting?”), there is little research to guide personalization service firms on what the optimal
strategy should be. Are the existing strategies used by firms optimal? Or could they improve by

4
shifting to a different marketing strategy? As storage costs fall, the economics of using longer
histories can change. Can personalization services firms benefit from increasing the extent of
purchase history it uses for targeting? Should they reevaluate their policies of offering
exclusive/non-exclusive contracts to firms in a category and allow multiple firms?
The timeliness of this research is highlighted in a recent stock analysis report about
Catalina by Deutsche Bank (Ginocchio et al 2005) which states: “Categories are sold on four
thirteen-week cycles with exclusivity (only one manufacturer can promote that category during
that period). As Catalina believes that only approximately 20-25% of its customers want
exclusivity, they are looking at ways to potentially sell more than one manufacturer in a
category.” Using our analytical approach, Catalina will have an empirical basis to answer this
critical business issue that they currently face.
1.2.2 The “What to Sell”, “Whom to Sell to” and “For How Much” Questions
To fix ideas and to facilitate empirical work, we illustrate the research problem that we
address in the context of Catalina, a firm which sells personalized coupon services to grocery
manufacturers using purchase history data of households from cooperating retailers.
Consider the following “simple” question facing Catalina’s management: What price
should Catalina charge for its service from a grocery manufacturer such as Heinz for issuing
targeted coupons on its behalf in the ketchup category to households? Naturally, the price should
depend on the economic value (i.e., the incremental profits), that Heinz would obtain from using
the targeting service. What would that economic value be? For most standard products and
services, the economic value of a product to a customer is independent of who else uses it. But
for targeting services, the economic value of the service to Heinz would depend on whether
Heinz alone uses the service or whether its competitor Hunt’s also uses the service at the same
time, because the effectiveness of targeting is a function of whether one’s competitor also
targets.
If the economic value to Heinz (and therefore prices) depends on who else Catalina sells
the service to, the pricing question is linked to the “Whom to Sell to” question. This is
particularly interesting because the economic value of the service for Heinz may be higher or
lower if Hunt’s also uses the service; i.e., this service can have positive or negative externalities.
If the service has positive externalities, it makes obvious sense for the firm to sell its service to
both Heinz and Hunt’s. If it has negative externalities, then Catalina would have to evaluate

5
whether the negative externalities for Heinz and Hunt’s is sufficiently low to still sell to both
Heinz and Hunt’s; if not, it would have to sell the service on an exclusive basis to either Heinz or
Hunt’s depending on who would have the higher willingness to pay (higher economic value).
Thus the decision about whether to sell on an “exclusive” basis to one manufacturer or on a
“non-exclusive” basis to multiple manufacturers is an empirical question for Catalina. Further,
the “whom to sell to” question is intertwined with the “What price to charge” question.
Thus far in this scenario, we have treated the quality of the targeting service that Catalina
offers as fixed. We treat the quality of the targeting service as the accuracy with which it can
help a firm such as Heinz to identify the segment that Heinz seeks to target. Catalina can increase
the accuracy of its targeting service in a number of ways: (1) use demographic information; (2)
increase the length of purchase history of households within a category at a cooperating retailer;
(3) use information about purchasing behavior in other categories at the cooperating retailer; and
(4) combine information about purchasing behavior of households from other retailers.
Demographic information has been shown to be of limited use in predicting consumer
preferences for grocery products (e.g., Rossi, McCulloch and Allenby 1996). Increasing length
of purchase history should work in most categories where there are stable preferences. However
increasing purchase history length may become less useful if consumer preferences change over
time. As an obvious example, lengthening purchase histories to improve accuracy can be
counter-productive in categories like diapers where purchases in the category tend to be for a
limited duration. Recently there has been interest in cross-selling products and a number of
multi-category studies have shown that certain characteristics such as price and feature
sensitivity may be correlated across categories (Ainslie and Rossi 1998). Clearly, household
purchases across retailers can be useful in improving accuracy, but Catalina does not have this
option because it is contractually obliged not to pool information across retailers that cooperate
with it in providing purchase history data.1 Thus the most promising means by which Catalina
can improve its accuracy in most categories is by lengthening the purchase history which it uses
to target. For the purposes of analysis this paper, we will restrict ourselves to using purchase
history data within the targeted category of interest at the focal retailer.
1 Households are identified only by a retailer’s internal identification number (say from a loyalty program) and therefore it is impossible for Catalina to pool information across multiple retailers.

6
If we relax the assumption that targeting accuracy is fixed, Catalina needs to decide on
the quality of its service, i.e., how accurate its targeting service should be. This we call the
“What to sell” question. For most products/services, firms would like to maximize the quality of
their products/services if increasing quality were relatively costless. However, targeting services
are different in that increasing the quality of the service may reduce the economic value of the
service for the downstream clients. The idea is simple: if the targeting service is sold on an
exclusive basis to only Heinz, the economic value of the targeting service for Heinz will
definitely increase because Heinz can more effectively price discriminate its customers. But if
the targeting service is sold to both Heinz and Hunt’s, the price discrimination effect of targeting
can be overwhelmed by the more intense competition created by targeting (e.g., Shaffer and
Zhang 1995). Whether the price discrimination effect or competition effect dominates is
moderated by the level of targeting accuracy (Chen, Narasimhan and Zhang 2001). At low levels
of accuracy, price discrimination effects dominate competition effects. But at high levels of
accuracy the competition effect dominate price discrimination effects. Thus Catalina could
potentially destroy economic value to downstream clients by increasing accuracy if it sold the
product on a non-exclusive basis to both Heinz and Hunt’s. Catalina may find it worthwhile to
increase accuracy and sell on an exclusive basis to Heinz or Hunt’s to reduce the effects of
competition. Alternatively, it may reduce accuracy and sell to both Heinz and Hunt’s and extract
greater total revenues from both. It is also important to note that many theoretical papers have
restricted themselves to allowing for household heterogeneity only on horizontal attributes. In
reality, households are not only heterogeneous on horizontal attributes, but also on vertical
attributes. Hence it is possible that some of the theoretical insights may not carry over in real
markets. An empirical analysis that uses flexible models of consumer behavior that are
appropriate for a particular context is important to address the strategy questions of a particular
firm.
Theoretically, therefore the “What to sell” question is intertwined with the “Whom to
sell” question and the “For how much” question for targeting services. The goal of this paper is
to offer an empirical approach to help a personalization services firm such as Catalina arrive at
an optimal answer to these questions.
While the details of the empirical modeling in this paper will be tailored to the
environment in which Catalina operates, the general approach we develop to address the research

7
questions can be applied in other empirical contexts with appropriate modifications for the
specific characteristics of that context. For example, the framework can be used to help whether
DoubleClick should sell its targeted advertising services on an exclusive basis or a non-exclusive
basis. Here we will need to calibrate the impact of advertising (as opposed to couponing) on the
downstream firms’ profitability, but the rest of the analysis would be similar.
1.2.3 The Retailer as a Competitor to Catalina
Catalina uses purchase history data of retailers in offering targeted couponing services. A
natural question that arises is: What if the retailer decides to offer targeted couponing services to
manufacturers? Retailers have an advantage over Catalina in that targeting can also help improve
retail profitability. Hence unlike Catalina, a retailer can potentially trade off improved retail
profitability through targeted couponing against potential revenues from manufacturers such as
Heinz and Hunt’s through the sale of personalization services. This could imply that retailers
may subsidize personalization services in order to get higher profits from the sale of goods.
Large retailers with the appropriate infrastructure could easily implement such a targeting
solution. In fact, Tesco in the U.K. has been successfully collaborating with dunnhumby, a U.K.
based firm in the development of personalized marketing services that includes targeted
couponing over the last decade (Humby 2004, Humby et al 2003). In the U.S., dunnhumbyUSA
is a joint venture between Kroger and dunnhumby that seeks to replicate dunnhumby’s success in
the U.K. with Tesco.
We therefore also address the triple questions of “Whom to Sell to,” “What to Sell” and
“For how much?” from a retailer’s point of view. We measure the potential improvement in
profits from the sales of goods for the retailer, relative to the improvement in profits from
targeting for the manufacturers to assess the level of potential subsidy that retailers may be able
to provide manufacturers in offering targeting services.
1.3 Related Research
This paper is related to both theoretical and empirical research streams on
personalization. In terms of theoretical research, Shaffer and Zhang (1995) first questioned the
profitability of targeted promotions in a competitive environment. They demonstrated that
targeted pricing in a competitive environment leads to lower profits relative to uniform pricing.
They assumed symmetric firms. Relaxing the symmetry assumption, Shaffer and Zhang (2002)
show that in the presence of asymmetry, higher quality firms with larger market shares can

8
improve profits due to gains in market share even though they may lose profit margins due to
increased competition. Thus, all the above papers show that price margins suffer due to increased
competition from targeting, though Shaffer and Zhang (2002) show that with asymmetry the
larger firm may still make greater profits due to higher volumes. As we discussed earlier, Chen et
al. (2001) demonstrated that the level of targeting accuracy is a moderating variable in assessing
the profitability of personalized promotions. There is an inverted-U shaped relationship between
profitability and accuracy of targeting (personalization).
There is also a growing literature on behavior based pricing, which discusses whether a
firm should use a consumer’s past purchases behavior to offer promotions to one’s own
customers or those of its competitors (e.g., Villas-Boas 1999; Fudenberg and Tirole 2000;
Shaffer and Zhang 2000). Essentially these papers also find that behavior based targeted pricing
also leads to a prisoner’s dilemma.
In terms of empirical research on personalized pricing, Rossi et al. (1996) and Besanko et
al. (2003) evaluate the profitability of targeted coupons. In a seminal paper, Rossi et al. (1996)
investigate how manufacturers can improve their profits with different levels of consumer
purchase history and demographic information. Unlike this paper, they do not model the retailer
or competition between manufacturers. Besanko et al. (2003) only study the profitability of
targeting using only last visit data, but models both competition and the retailer. However, unlike
this paper, neither of the above papers investigates the personalization service provider’s
strategic decisions. Our analysis also finds that these two papers over-estimate the profitability
impact of personalization. This is because the models of consumer behavior used in computing
profits with and without targeting are different. We discuss this issue in detail in Section 4.2.1. In
terms of personalized advertising/communication, Ansari and Mela (2003) develop algorithms
for how a firm should use consumer history to customize email communications.
The rest of this paper is structured as follows: Section 2 develops the model and the
solution strategy. Section 3 describes the data and the estimation results. Section 4 answers the
questions about the personalization vendor’s strategy. Section 5 investigates the impact of
personalized promotions from the perspective of the retailer. Section 6 concludes.
2. The Model of the Personalization Services Market

9
Figure 1 represents a schematic of the grocery markets in which Catalina operates. There are
four sets of agents involved in this market: (1) The personalized coupon service provider
(Catalina) (2) the manufacturers (3) a retailer and (4) consumers.
*** Insert Figure 1***
The model of manufacturers selling through a retailer to the consumer has been studied in
previous research (e.g., Sudhir 2001, Berto Villas-Boas 2004). In these models the pricing
decisions of manufacturers and retailers are modeled as endogenous. The model in this paper
expands on this literature by endogenously modeling the decisions faced by a personalization
coupon provider who facilitates targeted couponing to consumers in the market. Since Catalina
is contractually obliged not to pool purchase history data across multiple retailers, the
assumption that Catalina uses only data from one retailer for its targeting service is consistent
with institutional reality. As in most previous research (e.g, Besanko et al. 1998, 2003; Sudhir
2001), we assume that the retailer is a local monopolist. Berto Villas-Boas (2004) indeed finds
very little evidence for cross-retailer competition at the single category level.
Figure 2 represents the schematic of the decision alternatives faced by a personalization
services provider (PSP) such as Catalina regarding the sales of its personalization services. We
model the timing of the game into two phases: Phase 1 which involves the sale of
personalization services and Phase 2 which involves the sale of consumer goods. Below we
describe the different stages of the Phase 1 decision related to the sale of targeting services.
*** Insert Figure 2***
Phase 1: Sale of Personalization Services
Stage 1: Catalina’s What to Sell Decision: At this stage, Catalina decides on the length of
purchase history it should optimally use for targeting. Here we consider three alternatives: (1)
Last Visit, along the lines of targeting used in Besanko et al. (2003), (2) Last Purchase, as used
by Catalina in its Catalina Coupon® program and (3) Full Purchase History, along the lines of
what Catalina uses in its Catalina Direct ® program.2
Stage 2: Catalina’s Initial “Whom to Offer to” and “At What Price” Decision: For ease of
exposition, we will consider a market with two national brand manufacturers. Catalina has three
alternatives to make initial offers at this stage: (1) Offer the targeting service to Firm 1 and set its
2 Catalina restricts the full purchase history to only 65 weeks, but we will evaluate different lengths of purchase history.

10
price ( 1fp ); (2) Offer the targeting service to Firm 2 and set the price ( 2
fp ); and (3) Offer the
targeting service to both firms and set the prices to both firms ( 1 2,b bp p ).
The subscripts “1” and “2” on prices refer to the price charged to firms 1 and 2. The
superscript ‘f’ refers to the fact that firm 1 or 2 is ‘first’ offered the service exclusively. The
superscript ‘b’ refers to the situation when both firms are initially offered the service on a non-
exclusive basis.
Stage 3: Initial Offer Acceptance/Rejection by Manufacturers: Manufacturers decide whether to
accept or reject the offer of targeting services at the offered prices. In the case where one firm is
exclusively offered and accepts the offer, the manufacturers and retailers then move to the
second “sales of goods” phase with one of the firms having the capability to target. If both firms
were offered initially, then there are four possible outcomes: where one of the firms accepts, both
accept and neither accept. Given these outcomes, the manufacturers and retailers then move to
the sales of goods phase with the firms that have accepted the targeting offers having the
capability to target.
Stage 4: Catalina offers Service to “Other” Manufacturer at Second Offer Price: If one firm is
exclusively offered the service first and rejects it, then Catalina will offer the service second to
the other firm on an exclusive basis. For example, if Firm 2 receives the offer after Firm 1 rejects
the initial offer of exclusive service, this price to firm 2 will be denoted as ( 2sp ), where the
superscript ‘s’ indicates the firm 2 was offered the service second after firm 1 refused.
Stage 5: Second Offer Acceptance/Rejection by Manufacturers: Manufacturers who received the
second offer can either accept or reject the offer for the targeting service.
Given this decision, the manufacturers and retailers then move to the second phases (sales of
goods) with the firms that have accepted the targeting offers having the capability to target. The
payoffs realized after the second phase are shown in three rows in Figure 2. We denote the
profits from the sale of goods to manufacturer ‘f’ by xyfΠ , where x and y refers to the
personalization service purchase decisions of firms 1 and 2 respectively. A value of 1 (0) refers
to whether the firm uses (does not use) the personalization services. The first row indicates the
payoff to the personalization provider (i.e., price charged for personalization services), the
second and third rows indicate the payoffs to Firms 1 and 2 respectively which shows the net
profits from the sale of goods and the fees paid (if any) to the personalization service provider.

11
It is important to note that in this game of complete information, Stage 4 and Stage 5 are in
the off-equilibrium path, because Catalina will offer the right price in the initial offer so that
whoever is offered initially will accept. We have marked the equilibrium paths in bold. Hence,
even though there are 10 payoff matrices shown, the only relevant payoffs in equilibrium are the
three payoff matrices where the firms that are initially offered the targeting service by Catalina
accept the product. Nevertheless, the payoffs from the off-equilibrium paths are critically
important for Catalina to figure out what price it should charge the firms in Stage 2. This is
because Catalina’s offer price to the firms should take into account the incremental profits a firm
will make relative to the outcome where the competitor obtains exclusive use of personalization
services. It should be noted that the price charged is not with respect to the situation where there
is no targeting at all. This is because the scenario where neither firm purchases personalized
coupons will not be on the sub-game perfect equilibrium path and therefore is not a credible
alternative threat to either firm 1 or firm 2. This limits the amount of value that can be extracted
from either firm by the personalization service provider. Hence 10 011 11
fP = Π −Π ; 01 102 22
fP = Π −Π and
11 011 1 1bP = Π −Π ; 01 10
2 2 2bP = Π −Π .
Phase 2: Sales of Goods
Stage 1: Manufacturer: Manufacturers set wholesale prices and the coupon face values for
individual households. If they have not purchased the personalization services, all households are
assumed to have a coupon face value of zero.3
Stage 2: Retailer takes the information about wholesale prices and coupons issued in setting
retail prices. Since the coupons are issued by the retailer, it is reasonable to assume that the
retailers take into account the coupons issued in setting retail prices.4
Stage 3: Given the retail prices and coupons issued, the household makes buying decisions in
order to maximize utility. We now develop a detailed model of these three stages of Phase II.
We describe the decisions faced by each of the players below. We begin with the
consumer model, then describe the retailer and manufacturer models respectively.
3 Technically manufacturers set the wholesale prices and Catalina decides whether to offer the coupon and what is face value will be, but this distinction is unimportant for the results after the manufacturer has made the decision to purchase the targeting service. 4 This model where the manufacturer moves first is the Manufacturer Stackelberg model. Consistent with the previous literature (Sudhir 2001; Besanko et al. 2003), we did not find support for the Vertical Nash Interaction where the manufacturer and retailer moves simultaneously. Therefore we omit details of the Vertical Nash model for brevity.

12
Consumer
A household i (i = 1,2,...,H) chooses one of J available brands (denoted by j = 1...J) in the
category or decides not to purchase in the category (j = 0, the no-purchase alternative or ‘outside
good’) on each household shopping occasion t = 1,2,...,ni. Let the vector ijtX denote all variables
for brand j experienced by household i at shopping occasion t. This vector includes brand-
specific indicators, marketing mix variables such as features, displays, and household-specific
variables which depend on the previous purchase/s such as state dependence and household stock
on occasion t.
Consumers choose the brand that offers the maximum utility. We specify the indirect
utility of household i for brand j (j = 1...J) on shopping occasion t as follows:
ijtjtjtijtijt rXu εξαβ ++−= (1)
where Xijt includes all variables that affect household i’s evaluation of brand j on occasion
t as well as time invariant brand intercepts, rjt is the price of brand j at t, jtξ is the brand j-
specific effect on utility at shopping occasion t that affects all households but which is
unobserved by the econometrician, and ijtε is the unobserved utility of brands that vary over
shopping occasions across households.
Since the indirect utility for any item in the choice set is identified only in terms of
differences with respect to a base choice in the logit model, we treat the outside good as the base
choice and normalize its utility as follows:
0 0i t i tu ε=
The elements of the vector ( )0 1, ,.it i t i t iJtε ε ε ε= L each are assumed to follow an independent
Gumbel distribution with mean zero and scale parameter 1.
We model heterogeneity using a latent class framework (Kamakura and Russell 1989)5.
Consumers are probabilistically allocated to one of K segments, where each segment k has its
5 The latent class model with discrete segments has considerable empirical validity and managerial relevance (Wedel and Kamakura 2000). A competing model is one which characterizes consumer heterogeneity using a continuous heterogeneity distribution (Gonul and Srinivasan, 1993). Andrews et al. (2002) find that both the discrete and continuous heterogeneity distributions fit the data fairly well, though some papers have argued that continuous heterogeneity coupled with discrete heterogeneity can fit the data better (Allenby et al. 1998). In this paper, we apply the latent class approach because of its computational tractability when solving for the equilibrium targeting prices with competitive and retailer reactions.

13
own parameter vector ( ),k kα β . The size of segment k is denoted as kf , which can be
interpreted as the likelihood of finding a consumer in segment k, or the relative size of the
segment in the population of consumers. The probability that household i that belongs to
segment k chooses a brand j is given by:
∑ +−
+−=
l ltk
iltk
ilt
jtk
ijtk
ijtkijt rX
rXS
)exp()exp(ξαβ
ξαβ (2)
Note that jtξ are the common demand shocks that affect all consumers. These are
observable by the price-setting firms and consumers in the market but unobservable by the
researchers. Villas-Boas and Winer (1999) show that profit-maximizing firms will take jtξ into
account when setting prices, therefore price is correlated with jtξ . This causes a price
endogeneity problem. Without correcting for endogeneity, the price coefficient will be biased
towards zero. We will discuss how we address this issue in the estimation section.
Because kf represents the likelihood of finding a consumer in segment k, the unconditional
probability of choice for brand j by consumer i in time period t can be computed as:
+−
+−==
∑∑∑== l lt
kilt
kilt
jtk
ijtk
ijtK
k
kkijt
K
k
kijt rX
rXfSfS
)exp()exp(
11 ξαβξαβ
(3)
Following earlier literature (e.g., Besanko et al. 1998), we assume the potential market
size for the category in any store-week to be the number of households that make shopping trips
(Nt) to that store in that week. On any given week on which a store visit is made, the consumer
can choose to make the purchase incidence decision, or the brand choice decision within the
category.
Retailer
The retailer’s goal is to maximize category profits in time period t, given the decisions to
buy personalization services by manufacturers. Let 1(0)x = denote whether manufacturer 1 has
purchased (not purchased) the personalization service. Similarly, let 1(0)y = denote whether
manufacturer 2 has purchased (not purchased) the personalization service. Therefore the retailer
chooses retail prices 1 ,xy xyt Jtr rK , conditional on which firms have purchased the personalization
service to solve the following problem:

14
1 , , 1 1max ( ) ( )
t
xy xyJtt
NJxy xy xy xy xyRt jt jt ijt jt ijt
r r j ir w S r D
… = =
Π = − −∑∑ (4)
where xyijtD is a matrix of individual specific coupon values as described earlier under the
alternative scenarios where the different manufacturers purchase the targeting service. The shares
in the above equation are the weighted average of the segment-specific shares across the k
segments. Taking the first order conditions of equation (4) with respect to retail prices, we obtain
the retailer’s pricing equation for each product in the category in terms of wholesale prices. The
details of the derivation are provided in Appendix A. The retailer price equation is shown in
equation A5 of the appendix.
Manufacturer
A manufacturer ‘m’ offering a subset mℵ of brands in the market sets the wholesale
price xyjtw (where mj∈ℵ ) and the coupon face values to individual households ( xy
ijtD ) so as to
maximize the manufacturer’s profits. A manufacturer who has not been sold the personalization
service will have coupon face values set to zero. The manufacturer takes into account the
knowledge that retailer prices ( xyjtr ) will be set taking into account the wholesale prices and the
coupon face values that have been issued to individual households. The profit of manufacturer m
at time t from the sales of goods is given by:
1( ) ( ( , ) )
t
m
Nxy xy xy xy xy xy xymt jt ijt jt ijt jt jt ijt ijt
j iw D c S r w D D
∈ℵ =
Π = − − −∑ ∑ (5)
where cjt is the marginal cost of the manufacturer for brand j in period t, and
( ( , ) )xy xy xy xy xyijt jt jt ijt ijtS r w D D− is the probability of household i, buying brand j in period t given the
decisions of manufacturers 1 (denoted by x) and 2 (denoted by y) to purchase the purchase
history data. Note that the retailer sets the retail price taking into account both the wholesale
price ( xyjtw ) and the vector of discounts offered to all households, i.e., 1{ }xy xy H
jt ijt iD D == .
We can write the manufacturer profit equations at the individual level as follows:
( ) ( ( , ) )m
xy i xy xy xy xy xy xymt jt ijt jt ijt jt jt ijt ijt
jw D c S r w D D
∈ℵ
Π = − − −∑

15
Taking the first order conditions of (5), with respect to xy xy xyijt jt ijtw w D= − , we are able to solve
for the effective margin from each household. Then the wholesale price will be maxxy xyjt ijti
w w=
and xy xy xyijt jt ijtD w w= − . The derivation is detailed in the Appendix A.
We specify manufacturer marginal cost as a function of factor prices, which assumes a fixed
proportions production technology.
*jt j t jtc λ θ υ= + Β + (6)
where tΒ are the factor prices, jλ are brand specific intercepts and jtυ is the cost shock.
Estimation and Solution Strategy
The solution strategy consists of the following five steps, where the first two steps
involve estimation to characterize the market and the remaining three steps involve policy
simulations to infer the optimal strategy for the personalization service firm.
Step 1: Estimate the demand and supply model discussed above. The demand model is a
latent class model of household preferences and responsiveness to marketing mix with
alternative levels of purchase history lengths used to proxy for personalization quality from
consumer information.6 To account for potential price endogeneity concerns, we use the control
function approach developed by Petrin and Train (2004). Essentially, we obtain residuals from a
regression of prices of the different brands against its cost factors and include these residuals in
the utility equation (1) in estimating the demand model. More details of the control function
approach are explained in appendix B.
Step 2: Apply Bayes’ rule on the aggregate latent class estimates using each household’s
purchase history (the length of history varies depending on the scenario being considered and the
number of visits of the household during the estimation period) to obtain household level
probabilities of membership in each of the latent classes. When purchase histories are short, the
individual level probabilities differ very little from the aggregate probabilities and as the
purchase histories lengthen, the individual probabilities tend to become more different from the
aggregate probabilities reflecting more closely the idiosyncratic preferences of the household.
6 Other aspects of consumer information, such as consumer demographics could potentially improve the quality of the personalization service, but the incremental impact of demographics over purchase history was miniscule in our analysis. So we focus on purchase history length as a measure of accuracy and omit demographics in further analysis. This is consistent with the findings in Rossi et al. (1996).

16
The manufacturers may use varying levels of information about consumer purchase history
in targeting them. To incorporate this information, consumers are classified to demand segments
by using the result that the posterior probability that a consumer ‘i’ belongs to a segment ‘k’
conditional on observed choice history iH is obtained by revising the prior probability of
membership kf in a Bayesian fashion (Kamakura and Russell 1989):
( )( ) '
'
|Pr( | )
| '
i ki
i k
k
L H k fi k H
L H k f∈ =
∑ (7)
Step 3: Having thus characterized the household level preferences using different lengths
of purchase history data, solve for the optimal prices and discounts under alternative targeting
scenarios (exclusive, non-exclusive). To obtain steady state profit estimates, solve for prices and
discounts over a large number of weeks tracking both consumer past purchases (to account for
state dependence effects) and inventories (to account for inventory effects on category
purchases) over this period. In solving for the equilibrium prices and discounts, take into account
not only the pricing behavior of the manufacturers, but also the equilibrium passthrough behavior
of retailers. The same marketing mix variables for features and displays as in the estimation data
are used in this simulation.
Step 4: Given the optimal prices and discounts computed based on Step 3, evaluate
manufacturer profits based on consumer choices, at the optimal prices and discounts. Note that
optimal prices and discounts will vary depending on the available purchase history and which
firms do targeting. However consumer behavior should be based on the same “true” preferences
irrespective of what data firms have. Hence in predicting consumer choice, given the chosen
prices and discounts, it is critical to always use the household level estimates obtained using the
full purchase history data, because these are our best estimates of the “true” household behavior.
One should not use the estimates obtained with shorter purchase histories at this stage as this will
grossly overstate the profitability of targeting. On first glance, this issue may appear a “mere
detail,” but we find that the improvements in profits in earlier papers (Rossi and Allenby, 1996;
Besanko et al., 2003) can be overstated if we do not assume a “true” stable consumer behavior
based on the full purchase history.
Step 5: Given the profits obtained under alternative targeting scenarios of history length
(full purchase history, only last purchase, only last visit, no targeting) and client choice

17
(exclusive, non-exclusive), solve for the optimal strategy for the personalization service provider,
that answers the three questions (what to sell, to whom to sell and for how much) we seek to
answer.
3. Empirical Illustration Data
We use the AC Nielsen scanner panel data on the ketchup category from the largest retailer
in the Springfield, MO market for the empirical illustration. We restrict attention to the four
largest brand-sizes which collectively account for 64% of the sales in this category: Heinz 32 oz,
Hunt’s 32 oz, Heinz 28 oz, and the Store Brand 32 oz and use 100 weeks of purchase history
data during 1986 to 1988. We use a sample of 143 households based on whether they made at
least five purchases of the chosen brand-sizes during the 100 weeks of analysis. The 143
households bought ketchup in 1073 visits out of the total 11660 store visits.
The summary of brand shares (conditional on purchase) and prices are given in Table 2.
*** Insert Table 2***
Estimation Results
Based on the Bayesian Information Criterion (BIC), we found that a three segment latent
class model is the best model. As discussed earlier, we correct for price endogeneity using the
approach in Petrin and Train (2003). The results are presented in Table 3 below. Segment 2 is the
least price sensitive, but also purchases least in the category based on the negative coefficients
associated with the intercept. It is 24% of the market. Segments 1 and 3 are more price sensitive
than segment 2 and together constitute 76% of the market. However Segment 1 is relatively more
loyal to Heinz 32 oz. Segment 3’s preferences are more diffused across all brands and is the most
price sensitive segment in the market, suggesting the least amount of loyalty. They were also
relatively insensitive to inventory levels. This suggests that this segment does not purchase
ketchup at regular intervals, but opportunistically buy any brand when it is on sale.
*** Insert Table 3***
The price elasticities for the three segment latent class demand model as described by
Kamakura and Russell (1989) and reported in Table 4. The own and cross price effects are as
expected. Hunt’s 32 and the Store Brand 32 have higher own elasticities than the two Heinz
brand-sizes. Heinz 28, the most expensive brand, has the lowest own elasticity. Hunt’s 32 and
Store 32 have higher cross-elasticities, which indicate that switching would be higher between

18
these brand-sizes. Increase in the price of the largest brand-size Heinz 32, will result in more
substantial substitution to Hunt’s 32 and Store 32 rather than Heinz 28.
*** Insert Table 4***
The cost estimates in Table 5 obtained through the estimation of Equation 6 suggest that
Heinz and the store brand have lower marginal costs than Hunt’s (though the differences are not
significant). The price of tomatoes7 (the main ingredient of ketchup) is used as the factor cost in
the cost equation. Not surprisingly, tomato prices have a significant effect on marginal cost of
ketchup.
*** Insert Table 5***
4. Analysis of Personalization Service Provider Decisions
Based on the estimates obtained in Section 3, we can now evaluate the profitability of the
alternative decision scenarios from the personalization service provider’s perspective using
simulations. We simulate the market for 100 weeks, which is a sufficiently long period to obtain
stable estimates of profits under alternative decision scenarios.8
We first demonstrate how length of purchase history affects the ability to personalize
promotions in Section 4.1. In Section 4.2, we evaluate the profits of manufacturers (Heinz and
Hunt’s) from the sale of goods as a function of whether they use personalized coupons either on
an exclusive or syndicated basis, i.e., we compute ( 10 01 10 01 11 111 1 2 2 1 1, , , , ,Π Π Π Π Π Π ) for different lengths
of purchase history. Based on these profits, we infer what price the personalization service
provider can charge under different scenarios and thus arrive at the optimal decisions of the
personalization services vendor in Section 4.3.
4.1 How Length of Consumer Purchase History affects Personalization
It is natural that personalization can be improved by increasing the length of consumer
purchase history information used in targeting. This is the rationale used by Catalina Marketing,
in offering two different targeting products to packaged goods manufacturers, one which uses
7 The price data for tomatoes were obtained from the Bureau of Labor Statistics. Part of the data was obtained from the website and the rest through email from BLS officials. 8 Average profits per week were very stable with consumer choices simulated over one hundred weeks. Increasing the period of simulation further had no effect on the results, but simply increased computation time.
19
only the last purchase by a customer, and a second which uses the last 65 weeks of consumer
purchase history.
We now investigate how the length of purchase history affects the extent to which
personalization can be improved. First, to compare against the results of Besanko et al. (2003),
we investigate the scenario where only last visit information is used for targeting. Second, to be
consistent with Catalina’s couponing strategy and to compare the scenarios in Rossi et al. (1996),
we investigate the scenarios where only last purchase information is used and where the fully
available purchase history is used. Figures 3a-3c shows how the posterior probabilities (of
belonging to segment 1) of consumers change as a function of the information used. Figure 3a
shows the distribution of posterior probabilities using only the last week’s information of
consumer purchases, Figure 3b shows the distribution of posterior probabilities using only the
last consumer purchases (which could be an earlier week if no purchase was made in the
category in the last week) and Figure 3c shows the distribution of posterior probabilities using
100 weeks of consumer purchase history. Figure 3a clearly shows that the marketer can achieve
very little discrimination across consumers by using only information about the last visit, as the
vast majority of consumers are classified in the same quintile as the aggregate probability ( kf in
Equation 7), i.e., 0.47 for Segment 1. The last purchase information enables more discrimination
to be achieved between consumers, as seen in Figure 3b. We can achieve much better
discrimination among consumers by using 100 weeks of consumer purchase information, as
shown in the polarized probabilities in Figure 3c. By using 100 weeks of information, almost
40% of consumers are assigned with a high degree of probability (posterior probability in the
highest quintile) to segment 1, while more than 40% of consumers are not assigned to segment 1
with a high degree of probability (posterior probability in the lowest quintile).
*** Insert Figures 3a, 3b and 3c***
4.2 The Effect of Personalized Coupons on Manufacturer Client Profits
We now assess how the profits of manufacturer clients (Heinz and Hunt’s) change as a
function of personalized coupons. We consider situations (1) when targeted couponing is done
exclusively by Heinz or Hunt’s and when both firms do targeting and (2) when targeting is based
merely on last visit data or on the last purchase data, or based on the full purchase history data.
In performing this analysis, we control for retailer behavior by assuming that the retailer does not

20
target for the store brands using the purchase history data available to it.9 The profitability results
are reported in Table 6. Several insights emerge.
*** Insert Table 6***
First, we see that personalized promotions by both firms increase profits under the last
visit scenario, the last purchase scenario and the full purchase history scenarios, relative to the
no-targeting scenario. Further, the profits are greater for the full purchase history scenario
compared to both the last purchase and last visit scenario. This shows that in this market, the
positive price discrimination effect of targeting dominates the negative competitive effect of
targeting. Even with the full purchase history being used, the price discrimination effect is
increasing (we checked intermediate lengths of purchase history data and find profits increase as
the number of weeks of data used for targeting increases). Essentially, this suggests that even
with the full purchase history of our dataset we have not reached the peak of the inverted U
relationship between targeting accuracy and profitability in a competitive targeting scenario that
was derived theoretically in Chen et al (2001).
Second, we compare the case where only one firm exclusively targets versus the case
where both firms target. Under targeting using full purchase history, Heinz makes more profits
when both firms target than when Heinz alone targets. This shows that there is a positive
externality from the use of targeting for Heinz in this market. For Hunt’s there is a small decrease
in profits when both firms target as compared to when Hunt’s only targets, showing that there is
a negative externality for Hunt’s.
Finally, we examine the magnitudes of the improvements in profits from the use of
targeting. The maximum profit gain that any firm obtains by using targeted pricing in the
ketchup category is about 2%. An improvement of gross margins by 2% can be a substantive
increase in net profits. For example, Heinz had a gross margin of 40% and a net margin of 10%
in 2003 (Hoover Online). A 2% increase in gross margin can then translate to an increase of
about 8% in net margins.
4.2.1 Improving the Accuracy of Estimated Targeting Profits
9 We also considered the cases of (a) intermediate lengths of purchase history data, and (b) where the retailer sends targeted coupons for the store brands. Since these alternative scenarios have no impact on the intuition and the qualitative results we do not discuss these in the paper. As discussed earlier, inclusion of demographic variables have very little impact on the personalization.

21
The increase in gross profit margin in our analysis is smaller than the profit increases
reported in Rossi et al. (1996) and Besanko et al. (2003). Using full purchase history data
(without demographics), the Rossi et al. study finds an increase of 5% for a product in the tuna
category. The Besanko et al. study find improvements of 4% for Heinz and 37% for Hunt’s in
the ketchup category, merely with the last visit data. We detail below three aspects which have to
be taken into account in computing profits from targeting accurately: (1) Inclusion of inventory
in the demand model (2) Appropriate modeling of retailer pricing behavior in the supply model
(3) A consistent standard of consumer behavior to characterize consumer response to different
targeting strategies by manufacturers when they have access to differing levels of consumer
information. These three aspects are explained in more detail below.
The first aspect to be taken care of is to realistically include inventory in the demand
model. We include inventory in the demand model while the Besanko et al. and Rossi et al
models do not. Even though they do not have inventory data, Besanko et al. find suggestive
evidence that inclusion of inventories can reduce the potential incremental gain in profits
significantly. Category purchase will be overestimated when the effect of inventory is not
included in the demand model. Said differently, the absence of inventory in their model implies
that consumers who purchase last period are still likely to purchase at the same level in the
current period. This overestimates the benefits of accurate price targeting. Rossi et al. use a
conditional choice model, so they do not model inventory issues.
The second aspect to be taken care of in computing targeting profits accurately is to
model retailer pricing behavior appropriately. How much will the retailer pass through when
there is targeting couponing activity by the manufacturer? Rossi et al (1996), do not consider
manufacturer or retailer reaction to personalized couponing by one firm and obtain higher profits
than our estimates. In a subsequent section on “The Retailer’s Perspective on Personalization
Services,” we investigate a scenario, where the retailer does not optimally adjust the markup, but
simply charges a constant markup of 25% over the wholesale price. We find that in this case
(Table 11), Heinz profits increase by about 11%, in a manner comparable to the Rossi et al.
paper. Hence our improvement in margins where we allow both competing manufacturers and
the retailer to react optimally is the lower bound of the potential increase in profits. In reality, the
retailer reactions are unlikely to be completely optimal and the potential increase in profit
margins can be greater as we see in our constant markup analysis.
22
The final aspect to be taken into account in computing targeting profits is to maintain a
consistent standard of consumer purchase behavior. In the Besanko et al. study, the profits under
aggregate data and the last visit data are computed with consumer behavior also assumed to be
consistent with the level of detail of data available for targeting. However, this approach is
incorrect, because we should treat consumer behavior as invariant to the level of data used to
estimate their preferences. We therefore use the estimates obtained using full history data as our
best approximation of the “true” consumer behavior. While we also find higher improvements in
profits using the approach in Besanko et al. (2003), the incremental gains are much smaller when
we make the assumption of stable consumer behavior. A similar issue is independently described
when computing value functions in dynamic programming models in Mannor et al. (2004).
In Table 7 we illustrate how the omission of a consistent standard of consumer behavior
can affect estimates of targeting profits. The first two rows illustrate that using just the
information about consumers in characterizing consumer response can result in an ‘increase’ in
profit estimates by 5.58% for Heinz and 2.52% for Hunt’s. These two rows are for situations
where neither firm targets. The difference is purely a bias introduced due to posterior allocations
based on consumer history leading to different shares being estimated for the brands. We also
note that the ‘profit increases from targeting’ in Table 7 are much higher than the figures we
reported in Table 6 and very similar to the profit increases reported by Rossi et al (1996) and
some of the figures of Besanko et al (2003). Future research on targeting needs to take
cognizance of this possible oversight when computing profits from targeting.
*** Insert Table 7***
4.2.2 Profile of Consumers Targeted
To gain an understanding of how personalized promotions improve profitability, it is
useful to identify the profiles of households targeted by Heinz and Hunt’s. In equilibrium, Heinz
conducts its targeting entirely through the popular Heinz 32 oz, hence we focus on the
households receiving coupons for the 32 oz Heinz. Figure 4a shows the posterior segment

23
probabilities of households targeted by Heinz 32 oz10. Households targeted by Heinz 32 have a
68% probability of being in Segment 3 and 31% probability of being in Segment 1. This makes
sense since these two segments are relatively more price sensitive and are therefore likely to
respond to coupons. Segment 3, which is the heavy user segment, but price sensitive and has no
strong loyalty receives the most coupons from Heinz. In contrast, Segment 1 households that are
loyal to Heinz 32, receive fewer coupons from Heinz 32 oz. Thus Heinz is able to increase the
profit margins from households that are likely to be in Segment 1 (47% of market size), but
competes aggressively with lower prices for households in Segment 3 (29% of market size).
Overall, Heinz offers targeted coupons to about 32% of households in the market.
*** Insert Figures 4a and 4b***
Figure 4b shows the allocation of consumers targeted by Hunt’s 32. Consumers targeted
by Hunt’s 32 are predominantly allocated to segment 3, the most price sensitive segment. While
this segment also does not have strong brand loyalty, it marginally favors the cheaper Hunt’s
brand. However, given the lack of strong loyalty, Hunt’s uses coupons to defend market shares in
this segment. Hunt’s 32 oz offers coupons relatively infrequently to households belonging to
other two segments. Overall, Hunt’s offers targeted coupons to only about 7% of households in
the market.
4.2.3 Identifying Sources of Targeting Profits
We now present additional diagnostics on the sources of the increase in profits from
personalized coupons. The increase in profits can arise from three sources: higher margins,
higher brand shares and consumption expansion. Since overall ketchup consumption is not
expected to expand a great deal merely due to couponing, we expect the contribution of
consumption expansion to be low. Indeed the category purchase expansion due to targeting is
merely 0.4%. We report the effect of targeting on each brand’s shares and profit margins (in the
full purchase history case) in Table 8 below. The average margins across all households are
calculated by appropriately weighting the margins using household level brand shares.
10 For the sake of exposition in Figures 4a and 4b we label the segments based on some striking characteristics of each segment. Segment 1 is labeled ‘Heinz 32 loyals, price sensitives’, segment 2 is labeled ‘Heinz 28 loyals, light users’ and segment 3 is labeled ‘heavy users, inertial, price sensitives’.

24
*** Insert Table 8***
As can be seen, the gain in profits for Heinz 32 oz is essentially from price
discrimination. Its average margins increase by about 3.0%. The increase in margins comes at
the expense of its brand share which fell by about 0.3%. In contrast, for both Heinz 28 oz and
Hunt’s 32 oz, we see there is both an increase in share and margins, though the increases in both
are moderate. Thus Heinz 32 oz is willing to take a share cut, in order to increase its profits
through higher profit margins from price discrimination. We also note that the increase in the
profits of Heinz accrues mostly from the increase in margins for Heinz 32, and to a far lesser
extent from Heinz 28. In fact, price optimization across the product line for Heinz results in an
interesting pattern. All of the individual level targeting by Heinz is done through Heinz 32, no
coupons are issued for Heinz 28.
Further the targeting by Heinz 32 is more extensive, with a third of consumers being
targeted compared to only about a tenth of consumers targeted by Hunt’s 32. The depth of
discounts issued by Heinz is also greater than that of Hunt’s 32 oz.
As one would expect, the aggregate prices of Heinz 32 increases due to this selective
discounting. Apart from the loss in brand share for Heinz 32, the store brand 32 also loses share
(-0.5%).
The most interesting part of the results is the asymmetry in the strategies of Heinz and
Hunt’s 32 oz. While Heinz would lose 0.3% in brand share in order to gain profits by increasing
its margins by about 3%, Hunt’s gains share by as much as 3.6%, even after increasing margins
by about 1.2%. As the smaller brand, Hunt’s is able to take advantage of the increase in prices by
Heinz to increase its share (on its smaller base), even with a price increase. Thus Heinz prices
less aggressively than Hunt’s in the presence of personalized pricing, because as the larger brand
it is able to gain more from personalized pricing. As shown in the lower two panels of Table 8,
these patterns are consistent with the results even when only one of the firms (either Heinz or
Hunt’s) targets consumers.
In summary, the larger firm gains much more from the increased average margins
obtained from personalized promotions compared to the smaller firm. This is due to the larger
firm’s ability to obtain higher margins over a larger base. Further, despite the threat of increased

25
competition due to personalized promotions, both firms are able to increase their profits by
offering personalized promotions.
4.3 Evaluating Strategic Options for the Personalization Service Provider
We next evaluate the optimal strategies for the Personalization Service Provider (e.g.
Catalina). Since Catalina always gains by selling to either Heinz or Hunt’s the price it can charge
from a given client is the difference in profits of the client in the particular scenario being
evaluated, relative to the scenario when only one of the other clients will receive the targeting
service. For example, the price that the vendor can charge from selling to Heinz (denoted as firm
1) exclusively when selling the full purchase history is 10 011 1 1
fP = Π −Π 82522 80926 1,596= − = .
Table 9 shows the price that the vendor will charge in each of the targeting scenarios and the
total profits (assuming zero costs) that the vendor makes.
*** Insert Table 9***
It is clear from the table that the greatest profits for the vendor can be obtained when both
Heinz and Hunt’s target using the full purchase history ($1655). Therefore the firm will sell the
targeting service to both firms (“whom to sell to?”), using the full purchase history of 100 weeks
available (“what to sell?”) at a price of $1611 to Heinz and $44 to Hunts (“for how much to
sell?”).
The results suggest that the total profits for the personalization services vendor that can
be obtained from using merely last visit/last purchase based targeting is small compared to the
profits obtained from using the full history. For example with both firms targeting, the vendor
makes only $14 in profits from last visit based targeting, where as it makes $1655 from full visit
history based targeting. Another interesting aspect of the results is that while clearly most of the
profits for the personalization service vendor comes from Heinz, offering the service to Hunt’s
(even for free) can increase the price that can be obtained from Heinz. This is because while
offering the service only to Heinz the vendor makes $1596, but if Hunt’s also uses the service,
Heinz will be willing to pay the vendor $1655.
Thus in this category, Catalina would be better off it sold its service on a non-exclusive
service to both vendors. Its current strategy of offering the service to only one firm is not optimal
and should be re-evaluated. Further, we find that as we increase the length of purchase data even
up to 100 weeks, the profitability of downstream clients continue to increase. This suggests that

26
restricting the data used for targeting to merely 65 weeks is sub-optimal. In infrequently
purchased categories such as ketchup, the information obtained from purchases over 65 weeks of
data is not that large. Catalina can improve its profitability by increasing the length of purchase
history used in targeting. Given data storage continues to become cheaper, this should be
technologically feasible.
5. The Retailer’s Perspective on Personalization Services
The retailer is an essential player in the kind of (manufacturer-initiated) targeted coupon
activity described in this paper, since the retail store is the point of purchase, the place where the
consumer purchase data are collected, where customized coupons are printed and delivered and
where the coupons are redeemed. The retail loyalty card is most often the means of identifying
the consumer and the coupons are usually redeemable only in the same retail chain where
purchases are made. Given the symbiotic nature of the relationship between the retailer and the
personalization services provider and given that the retailer often has extensive consumer
purchase information through loyalty programs, it is interesting to ascertain how the retailer will
be affected by the use of personalized promotions by manufacturers. Specifically, we examine
(1) the impact on retailer profits by the use of personalized promotions activities by
manufacturers and (2) the impact on profitability for the retailer by becoming a vendor of
personalized promotions at its retail stores.
*** Insert Table 10***
Table 10 shows that the retailer profits increase the most when both manufacturers target
households through personalized promotions. The retailer profits increase by $1291 when both
manufacturers target. It is also interesting that the retailer is able to grab a larger share of the
increase in channel profits when the smaller player (Hunt’s) alone targets, where its profits
increase by $1111, than when the larger player (Heinz) alone targets, where its profits increase
by $110. This is because the smaller firm is more aggressive in trying to gain market share than
the larger firm, and in turn suppressing wholesale prices. This allows the retailer to charge a
higher margin and increase its profits. The second column in the table represents an upper bound
on the profits for the retailer if it were to enter the personalization services business.
Since the retailer profits go up when manufacturers target, this analysis raises the
intriguing possibility that the retailer could actually forgo some proportion of its profits from the

27
targeting services business in order to benefit from increase in ketchup profits due to targeting.
This analysis provides a compelling economic rationale for the retailer to cooperate in the
network of the targeting services provider, which is a feature of the targeted coupon services
industry today. The analysis could also imply that if retailers can overcome any potential entry
barriers by entering the personalized promotion service business, they could be formidable
competitors to a company like Catalina Marketing, not only because such retailers may withdraw
themselves from the targeting services network (such as the ‘Catalina Marketing Network’) but
also because they would have considerable economic incentive to price their targeting services
more aggressively than ‘pure’ targeting services providers can afford.11
The above analyses assume that the retailer reacts optimally and adjusts its retailer prices
in response to the targeting activities of the manufacturer, and thus competes aggressively for a
share of the increase in channel profits due to targeting. It is possible that the retailer may not
react optimally to manufacturer targeting due to limitations in the retailer’s knowledge of
manufacturer actions, constraints on retailer marketing effort due to limited resources of skilled
manpower, technology or investment. An alternative scenario of retailer behavior could be that
the retailer uses a simple markup pricing scheme.
The profits from targeting by both manufacturers using full history where the retailer
adopts a simple markup pricing scheme of 25% over wholesale price is given in Table 11.
Comparing the profits with the no-targeting scenario, the total channel profit is lower (by about
5%) when the retailer charges constant markup of 25%, rather than the optimal markups. Further,
as expected the retailer makes less profits with a constant markup rule. When the retailer charges
the non-optimal constant markup, the larger firm Heinz benefits more and obtains a larger
proportion of total channel profits.
*** Insert Table 11***
Table 11 shows that incremental manufacturer profits from targeting are higher when the
retailer simply charges a constant markup. Heinz, the largest manufacturer, takes the lion’s share
of the increase in channel profits, while there is a small increase in the profits of Hunt’s. The
incremental profits from targeting for Heinz are almost 11% when the retailer charges a constant
markup, while it is about 2% when the retailer adjusts its markup optimally. Since all retailers
11 In personal conversations with an official at leading retailer who wishes to remain anonymous, we were informed that they provide targeting services informally (for free) to manufacturers.

28
may not adjust their markup optimally (or at least in the short-run), the potential increase in
profits from personalized promotions by manufacturers will be greater than the 2%. Thus we
may treat 2% as a lower bound of the potential increase in profitability. We also note that the
increase in gross margins can be greater in categories with potential for category expansion.
6. Conclusion
The potential for personalized marketing has been growing due to advances in data
collection and analysis technologies as well as advertising and promotion delivery technologies.
In contrast to extant research on the personalization services which have an “engineering”
orientation, this paper develops the first empirically grounded approach to answer strategic
questions of interest to personalization service providers.
Our analysis enabled us to obtain interesting substantive insights of interest to a
personalization service provider. First, as discussed in the introduction, Catalina is currently re-
evaluating its policy of offering targeting services on an exclusive basis to manufacturers. Given
the strong reservations that have been expressed in the theoretical literature about the potential
negative externalities that are likely to be induced by competitive targeting, Catalina indeed
needs to be careful in shifting from its extant policy of selling its targeted couponing services
only on an exclusive basis. However, our analysis shows that in the category we analyze,
Catalina can increase its profits by selling to multiple manufacturers. By performing such an
analysis on a category-by-category basis, Catalina can identify categories in which it can
improve profits by shifting from its policy of exclusivity.
Second, we are able to offer the insight that the retailer is likely to be a potent competitor
to Catalina. Ginocchio et al (2005) suggest that a major threat to Catalina’s growth is the
growing market share of Wal-Mart in groceries. Since Wal-Mart does not offer targeted coupons
and is not part of Catalina’s network, this can hamper Catalina’s growth. According to the report,
a second major threat is from Valassis Communications (currently in the business of offering
coupons in free standing inserts) which is considering entry into Catalina’s targeted couponing
business. The report however suggests that Valassis will find it difficult to replicate Catalina’s
success given its strong relationship with retailers.
Our analysis suggests that that the major threat to Catalina may not be from Wal-Mart or
Valassis, but certain large retailers themselves, because they can effectively subsidize the price

29
of the personalization service because it makes considerable increases in its retail profits due to
personalization. This threat should be salient given that many retailers (e.g., Tesco in U.K.
Kroger in U.S.) are developing their own technologies for offering personalized coupons to
customers.12 Indeed the retailer might be the most powerful potential competitor to Catalina in
the future.
Finally, we find that Catalina may wish to increase the length of purchase history it uses
in its targeting services, from the current self-imposed limit of 65 weeks. Even if storage costs
are currently a consideration for the current limit of length of purchase history used, the
declining costs of storage and computing speeds should make it possible for Catalina to increase
the length of history used for personalization in the future profitably.
Our analysis also highlighted a key methodological issue that one needs to consider when
evaluating the profitability of targeted promotions using alternative purchase history lengths.
While the optimal prices and coupons should of course be computed as in previous research
using the available length of purchase history, the evaluation of the profitability of the alternative
scenarios should be using a stable (one’s best possible) estimate of consumer preferences. In our
analysis, we consistently used the consumer preference estimates based on full purchase history
data, when doing the profitability analysis. We showed that the inflated estimates of benefits
from targeting using simply last visit or last purchase history data in past research is due to the
fact that profitability analysis assumed (incorrectly) different estimates of consumer preferences
for the no targeting (no purchase history) and targeting (last visit/last purchase) scenarios. We
caution against this in future research.
In summary, we believe that the approach outlined in this paper offers a framework to
investigate strategic options faced by personalization service vendors. There are a number of
ways in which this research can be extended. First, it would be interesting to investigate the
robustness of our results across multiple categories. In this paper, we find that the increase in
profits from targeting in the ketchup category is relatively low. While we chose this category
because we sought to compare our results to those of Besanko et al. (2003) who perform
targeting using only aggregate data, one issue is that there is very little category expansion in this
category. In conversations with a Vice President at Catalina, we were told that they expect
12 Senior managers at certain leading supermarket chains have in discussions stated that they offer targeted coupon services for free to all their manufacturers, while other retailers charge for the service.

30
substantially higher gains in categories such as snack foods where there is potential for category
expansion. One expects that a similar analysis in such expandable product categories will yield
greater increases in profits due to targeting.
Second, we can expand upon the nature of personalization data used for targeting. Here
we have treated “purchase history length” as the essential strategic variable with respect to the
quality of the data. However, quality may be increased by greater “breadth” of the data. Greater
breadth of data can be due to inclusion of demographic variables as well as through integrating
purchase behavior from other categories (Ainslie and Rossi 1998). We did not focus on
demographics, because we did not find much value in it for targeting (consistent with earlier
studies such as Rossi et al. 1996). However, there can be considerable gains in targeting accuracy
by looking at consumer behavior across categories. While computation and estimation is a much
harder task with analysis across categories, we believe this would be an important area for future
work. In general, this approach can identify the potential profitability of cross-selling services.
Finally, we hope that that the approach used in this paper will inspire additional research
to facilitate decision making in other personalization contexts such as in durable goods markets,
financial services, catalog marketing and targeted advertising. In the contexts of durable goods or
financial services, there will be shorter purchase histories, but greater information across
categories that can be used for personalization. In the context of targeted advertising services, the
empirical model needs to calibrate the impact of advertising (rather than couponing) on
consumer purchasing decisions. In short, while appropriate changes are needed for the model to
deal with institutional details appropriate for each context, the general framework of
understanding the tradeoffs involved in improving quality and selling to exclusive/multiple
clients will continue to be relevant. More broadly, we hope that this approach will spawn similar
complementary research to game theoretic analysis on other marketing institutions to help
decision makers and managers obtain empirically driven answers to their business strategy
questions.

31
References
Adomavicius,G., R. Sankaranarayanan, S. Sen and A. Tuzhilin (2005), “Incorporating
Contextual Information in Recommender Systems Using a Multidimensional Approach,”
ACM Transactions on Information Systems, 23(1), 103- 144.
Allenby, A. and P.E. Rossi (1998), “Similarities in Choice Behavior Across Product Categories”,
Marketing Science, 17(2), 91-105.
Allenby, G.M., N. Arora and J.L. Ginter (1998), “On the Heterogeneity of Demand”, Journal of
Marketing Research (August 1998), 35(3), 384-389.
Andrews, R.L., A. Ainslie and I.S. Currim (2002), “An Empirical Comparison of Logit Choice
Models with Discrete Versus Continuous Representations of Heterogeneity”, Journal of
Marketing Research (November 2002), 39(4), 479-487.
Berto Villas-Boas, S. (2004), “Vertical Contracts Between Manufacturers and Retailers:
Inferences with Limited Data”, Working Paper (May 2004), University of California at
Berkeley.
Besanko,D., S. Gupta and D. Jain (1998), “Logit Demand Estimation Under Competitive Pricing
Behavior: An Equilibrium Framework,” Management Science (November 1998), 1533-
47.
Besanko, D., J.P. Dube and S. Gupta (2003), “Competitive Price Discrimination Strategies in a
Vertical Channel using Aggregate Retail Data,” Management Science (September 2003),
49 (9), 1121-1137.
Blattberg, R.C. and S.A. Neslin (1990), “Sales Promotion: Concepts, Methods and Strategies”,
Prentice Hall, Englewood Cliffs, New Jersey.
Chen, Y., C. Narasimhan and Z.J. Zhang (2001), “Individual Marketing with Imperfect
Targetability”, Marketing Science, 20, 23-43.
Ginocchio, P., Chesler,M., and Clark, D.T. (2005), “Catalina Marketing: No Coupons at Wal-
Mart”, Deutsche Bank Global Equity Research Report, March 2005.
Feinberg, F.M., A. Krishna and Z. J. Zhang (2002), “Do We Care What Others Get? A
Behaviorist Approach to Targeted Promotions”, Journal of Marketing Research, (August
2002), 39(3), 277-281.
Fudenberg, D. and J. Tirole (2000), “Customer Poaching and Brand Switching,” Rand Journal of
Economics, 31(4), 634-657.

32
Gonul, F. and K. Srinivasan (1993), “Modeling Multiple Sources of Heterogeneity in
Multinomial Logit Models: Methodological and Managerial Issues”, Marketing Science,
(Summer, 1993), 12(3), 213-229.
Humby, C. (2004), “The Future of Communications: Is Consumer Marketing Irrevocably
Broken?” Admap, Issue 454, 2-4.
Humby, C., T. Hunt, and T. Phillips (2003), “Scoring Points: How Tesco is Winning Customer
Loyalty,” Kogan Page, London.
Iyer, G. and D. Soberman (2000), “Markets for Product Modification Information,” Marketing
Science (Summer 2000), 19(3), 203-225.
Kamakura, W.A. and G.J. Russell (1989), “A Probabilistic Choice Model for Market
Segmentation and Elasticity Structure”, Journal of Marketing Research, 26, 379-390.
Liu, Duen-Ren and Ya-Yueh Shih (2005), “Hybrid Approaches to Product Recommendation
Based on Customer Lifetime Value and Purchase Preferences”, The Journal of Systems
and Software, Aug 2005, 77(2), 181-191.
Mannor, S., D. Simester, P. Sun and J.N. Tsitsiklis (2004), “Bias and Variance in Value Function
Estimates”, Working Paper (June 2004).
McFadden, D. (1981), “Econometric Models of Probabilistic Choice,” in Structural Analysis of
Discrete Data with Econometric Applications, ed. By C. Manski and D. McFadden, MIT
Press, Cambridge, MA.
Miller, Paul, “Lists and Prospecting: Who's Who Among the Consumer Co-op Databases”,
Multichannel Merchant, Dec 1, 2003.
(http://multichannelmerchant.com/catalogage/database/marketing_cheat_sheet_whos/).
Murthi, B.P.S. and S. Sarkar (2003), “The Role of the Management Sciences in Research on
Personalization”, Management Science, 49(10), pp. 1344-1362.
Petrin, A. and K.E. Train (2003), “Omitted Product Attributes in Discrete Choice Models,”
NBER Working Paper No.W9452, National Bureau of Economic Research, Cambridge,
MA.
Peppers, D., and M. Rogers (1997), “Enterprise One to One: Tools for Competing in the
Interactive Age,” Double Day, New York.
Rossi, P.E., R.E. McCulloch and G.M. Allenby (1996), “The Value of Purchase History Data in
Target Marketing,” Marketing Science, 15, 321-340.

33
Shaffer, G. and Z.J. Zhang (1995), “Competitive Coupon Targeting”, Marketing Science, 14(4),
395-417.
Shaffer, G. and Z.J. Zhang (2002), “Competitive One-to-one Promotions”, Management
Science, 48(9), 1143-1160.
Sudhir, K. (2001), “Structural Analysis of Manufacturer Pricing in the Presence of a Strategic
Retailer”, Marketing Science (Summer 2001), 20(3), 244-264.
Villas-Boas, M. and R. Winer (1999), “Endogeneity in Brand Choice Models,” Management
Science, 45(10), 1324-1338.
Villas-Boas, M. (1999), “Dynamic Competition with Customer Recognition,” Rand Journal of
Economics, 30(4), 604-631.
Wedel, M. and W.A. Kamakura (2000), Market Segmentation: Conceptual and Methodological
Foundations, 2d ed. Boston: Kluwer Academic Publishers.
Figure 1: Schematic of the Market
Personalization Supplier (e.g., Catalina)
Manufacturer 1 (Brand 1)
Manufacturer 2 (Brand 2)
Retailer (Store Brand)
Retailer
Consumers
Coupons for Customers:
What to Offer? Whom to Offer? At What Prices?
Set Retail Prices
Set Wholesale Prices

34
Figure 2: Decision Tree and Payoffs
Both Mfrs Accept
Offer Mfr 1 at 1
fP Offer Mfr 2 at 2
fP Offer Both Mfrs at 1
bP , 2
bP
Full HistoryLast PurchaseLast Visit
PSP: “What” to Sell?
PSP: “Whom” to Offer? At What Price?
Mfr 1 Rejects
Mfr 2 Rejects
Mfr 2 Accepts Mfr 2 Rejects
PSP: Offer Other Mfr; At What Price?
Neither Mfr Accepts
Mfr 1 Rejects Mfr 1 Accepts
Phase II Payoffs
1
fP 10
1 1
fPΠ − 10
2Π
Phase II Payoffs
2
sP 01
1Π 01
2 2
sPΠ −
Phase II Payoffs
0
00
1Π 00
2Π
Phase II Payoffs
2
fP 01
1Π 01
2 2
fPΠ −
Phase II Payoffs
1
sP 10
1 1
sPΠ − 10
2Π
Phase II Payoffs
0 00
1Π 00
2Π
Phase II Payoffs
1 2
b bP P+ 11
1 1
bPΠ − 11
2 2
bPΠ −
Phase II Payoffs
1
bP 10
1 1
bPΠ − 10
2Π
Phase II Payoffs
0 00
1Π 00
2Π
Only Mfr 2 Accepts
Only Mfr 1 Accepts Phase II
Payoffs
2
bP 01
1Π 01
2 2
bPΠ −
… …
Mfr 2 Accepts
Mfr 1: Accept/Reject Mfr 2: Accept/Reject Mfr 1 and 2: Accept/Reject
Mfr 1 Accepts
Mfr 2: Accept/Reject
Offer Mfr 2 at 2
sP Offer Mfr 1 at 1
sP
Mfr 1: Accept/Reject
PSP: Offer Other Mfr; At What Price?

35
Figure 3a
Last visit used in Segment 1 allocation
0%
20%
40%
60%
80%
100%
0 to 0.2 0.2 to 0.4 0.4 to 0.6 0.6 to 0.8 0.8 to 1
Membership probability quintile
Prop
ortio
n of
con
sum
er
Figure 3b
Last purchase used in Segment 1 allocation
0%5%
10%15%20%25%30%35%
0 to 0.2 0.2 to 0.4 0.4 to 0.6 0.6 to 0.8 0.8 to 1
Membership probability quintile
Prop
ortio
n of
con
sum
er
Figure 3c
Full history used in segment 1 allocation
0
20
40
60
80
0 0.2 0.4 0.6 0.8 1 MoreMembership probability quintile
Prop
ortio
n of
cons
umer
s

36
Figure 4a
Posterior Segment Probabilities of Heinz Targeted/Non Targeted Households
(With Full History)
0.31
0.01
0.68
0.37
0.09
0.54
00.10.20.30.40.50.60.70.8
Heinz 32 loyals,price
sensitive(0.47)
Light users,Heinz 28 loyals
(0.24)
Heavy users,inertial, price
sensitive (0.29)
Segments
Ave
rage
Pos
terio
r Pr
obab
ility
Heinz 32 targets (32%)Heinz 32 does not target(68%)
Figure 4b
Posterior Segment Probabilities of Hunt's Targeted/Non Targeted Households
(With Full History)
0.110.01
0.88
0.490.27 0.24
00.20.40.60.8
1
Heinz 32 loyals,price
sensitive(0.47)
Light users,Heinz 28 loyals
(0.24)
Heavy users,inertial, price
sensitive (0.29)
Segments
Ave
rage
Pos
terio
r Pr
obab
ility
Hunt’s 32 targets (7%)
Hunt’s 32 does not target (93%)

37
Table 1: Illustrative Set of Companies in the Personalization Services Industry Company/ Division
2004 Revenue ($ mil.)
% of total company revenue
2004 Market Cap ($ mil.)
Client profile, Client examples
Revenue Growth rate
Description
Catalina Marketing, Inc
470 100% 1400 Manufacturers of packaged goods, grocery retailers e.g. Nestle, Safeway
8% p.a. over 2000-2004
Proprietary technology at point of purchase in grocery and pharma retailers to track customer transactions and deliver customized coupons. Tracks over 250 million transactions per week across more than 21,000 supermarkets worldwide, tracks purchase history of over 100 million households in U.S. Delivers more than 4.5 billion customized promotional messages.
Doubleclick, Inc (Abacus B2C division)
105 35% 984 Catalog merchants, e.g., LL Bean, Sharper Image
10%(2004), 15.1% (2003)
Consolidates the input from 1,550 catalog, online, and retail merchants into a single database. Data on over 4.4 billion transactions from catalog call-centers, websites, and retail stores, made by over 90 million households, with household purchase data stretching back 5 years.
Experian’s z-24 Division
501 23% NA Catalog companies, e.g., Boston Proper, JJill, Retailers, non-profits
6% p.a. over 2001-2004
The Z-24 database is similar to Abacus. Data from over 755 catalogs with 38 million households that have purchased over the last two months. Experian is also a player in B2B targeting with BizInsight’s database of more than 15 million U.S. based businesses.
VT &NH’s Direct Marketing Group’s I-Behavior
NA NA NA Catalog companies, e.g., Gardener’s Supply, Vermont Country Store
NA
Competitor to Abacus and Z-24, but uses transactional data at the SKU level (in contrast to Abacus and Z-24 which uses catalog level data). 1000+ contributors, mostly medium sized catalog companies, data on 103 million consumers, 89 million households.
Harte Hanks’ Direct Marketing Division
641 62% 2448 Retailers, finance sector, pharmaceuticals, telecom & high-tech
9% (2004), 2% (2003)
Specializes in providing targeting solutions in automotive, consumer products, financial services, insurance, high tech, pharma, retail and telecom. Provides suite of services from constructing the database (Trillium Software System), accessing the data (Allink® suite, inTouch), in-house data analytics, application and execution of campaigns.
Cool Savings, Inc
38 100% NA Retailers, packaged goods manufacturers,e.g. Unilever, Land O’ Lakes, Best Buy
20% p.a. over 2001-2004
Online marketer maintains a network of Web sites featuring a variety of special offers and savings on a range of goods and services from its advertisers. Also offers lead generation, e-mail marketing, and loyalty programs for more than 1,000 companies in retail, packaged goods, and media industries. Uses demographic information from its 20 million visitors to help its advertisers design targeted marketing campaigns and promotions.

38
Table 2: Descriptive Statistics for Ketchup Data
Conditional Brand share
Price ($/ 10 oz)
Feature Display
Heinz 32 oz 37% 0.41 0.07 0.11 Hunt’s 32 oz 13% 0.42 0.02 0.01 Heinz 28 oz 22% 0.50 0.04 0.09 Store Brand 32 oz 28% 0.28 0.12 0.12
Table 3: Demand Model Estimates
Segment 1
(47%)
Segment 2
(24%)
Segment 3
(29%)
Parameter Estimate
(Std Err)
Estimate
(Std Err)
Estimate
(Std Err)
Heinz 32 oz 1.90*** (0.56)
-2.26*** (0.49)
1.91*** (0.54)
Hunt’s 32 oz 0.61 (0.68)
-3.35*** (0.54)
3.21*** (0.56)
Heinz 28 oz 0.83 (0.73)
-1.85*** (0.61)
2.97*** (0.64)
SB 32 oz -0.50 (0.50)
-5.56*** (0.42)
1.75*** (0.39)
Price -13.23*** (1.53)
-2.89*** (1.19)
-17.01*** (1.38)
Feature 0.91*** (0.14)
0.75*** (0.21)
-0.11 (0.14)
Display 0.49*** (0.14)
0.32 (0.21)
0.07 (0.14)
Inventory -3.22*** (0.50)
-1.10*** (0.29)
-0.16 (0.28)
State Dependence 0.61*** (0.21)
1.42*** (0.18)
1.24*** (0.19)
Control functions Price Residual (Heinz 32 ) 0.53***
(0.20) -0.01 (0.27)
-0.43 (0.32)
Price Residual (Hunt’s 32 ) 0.32 (0.56)
0.03 (0.56)
1.97*** (0.43)
Price Residual (Heinz 28 ) -0.19 (0.29)
0.09 (0.17)
0.10 (0.27)
Price Residual (SB 32 ) 0.35 (0.42)
1.81*** (0.47)
1.13*** (0.29)
*** p <0.01

39
Table 4: Mean Price Elasticities for the 3 Segment Model
Change in Share
Change in Price Heinz 32 Hunt’s 32 Heinz 28 SB 32
Heinz 32 -3.61 0.11 0.07 0.13
Hunt’s 32 0.04 -5.39 0.05 0.13
Heinz 28 0.06 0.09 -2.75 0.06
Store Brand 32 0.07 0.16 0.03 -4.06
Table 5: Cost Equation Estimates Parameter Estimate
(Std Err)
Heinz 32 oz 0.052(0.072)
Hunt’s 32 oz 0.11(0.072)
Heinz 28 oz 0.062(0.073)
SB 32 oz 0.046(0.072)
Tomatoes 0.140***(0.063)
*** p <0.01
Table 6: Incremental Profits from Personalized Coupons
Last Visit Based $ Profits
(% increase over ‘no firm targets’ scenario)
Last Purchase Based $ Profits
(% increase over ‘no firm targets’ scenario)
Full History Based $ Profits
(% increase over ‘no firm targets’ scenario)
Heinz profits
Hunt’s profits
Heinz profits
Hunt’s profits
Heinz profits
Hunt’s profits
No firm targets
80,947 4,915 80,947 4,915 80,947 4,915
Hunt’s only targets
80,947 (0%)
4,915 (0%)
80,968 (0.03%)
4,956 (0.83%)
80,926 (-0.03%)
4,979 (1.31%)
Heinz only targets
80,961 (0.02%)
4,915 (0%)
81,071 (0.15%)
4,930 (0.31%)
82,522 (1.95%)
4,932 (0.34%)
Both firms target
80,961 (0.02%)
4,915 (0%)
81,047 (0.12%)
4,950 (0.7%)
82,537 (1.96%)
4,976 (1.24%)

40
Table 7: Accuracy in Computing Targeting Profits Heinz profits ($) Hunt’s profits ($)
No firm targets (aggregate behavior)
76665 4,794
No firm targets (true individual behavior) 80,947
(5.58%)
4,915
(2.52%) Both firms target (last visit) 80,961
(5.60%)
4,915
(2.52%) Both firms target (last purchase) 81,047
(5.72%)
4,950
(3.25%) Both firms target (full history) 82,537
(7.66%)
4,976
(3.79%)
Table 8: Effect of Personalized Coupons on Shares, Margins and Category Purchase Both target using full history
Heinz Hunt’s Average increase in share Hz 32: -0.3%
Hz 28: +0.5% Ht 32: +3.6%
Increase in (share weighted) margins
Hz 32: +3.0% Hz 28: +0.6%
Ht 32: +1.2%
Average increase in category purchase
+0.4%
Only Heinz targets using full history
Heinz Hunt’s
Average increase in share Hz 32: -0.3% Hz 28: +0.4%
Ht 32: +0.3%
Increase in (share weighted) margins
Hz 32: +3.0% Hz 28: +0.5%
Ht 32: +0.4%
Average increase in category purchase
+0.1%
Only Hunt’s targets using full history
Heinz Hunt’s Average increase in share Hz 32: -0.0%
Hz 28: +0.1% Ht 32: +3.7%
Increase in (share weighted) margins
Hz 32: -0.1% Hz 28: +0.0%
Ht 32: +1.2%
Average increase in category purchase
+0.4%
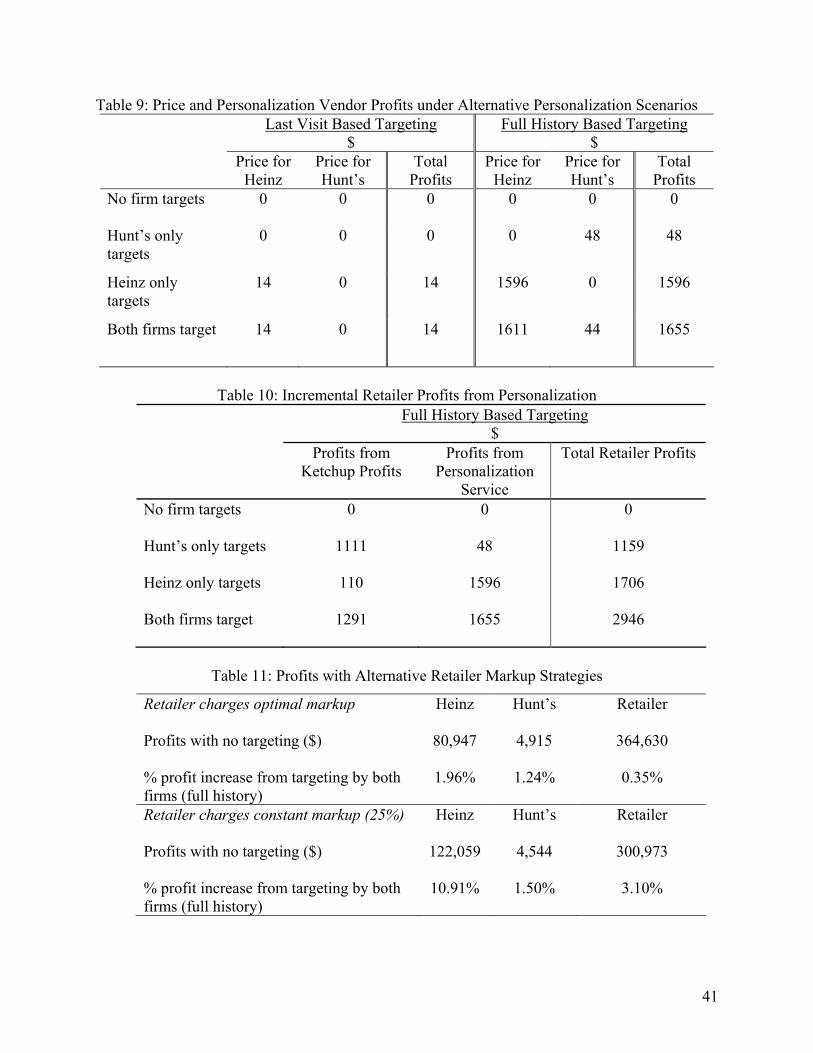
41
Table 9: Price and Personalization Vendor Profits under Alternative Personalization Scenarios Last Visit Based Targeting
$ Full History Based Targeting
$ Price for
Heinz Price for Hunt’s
Total Profits
Price for Heinz
Price for Hunt’s
Total Profits
No firm targets
0 0 0 0 0 0
Hunt’s only targets
0 0 0 0 48 48
Heinz only targets
14 0 14 1596 0 1596
Both firms target 14 0 14 1611 44 1655
Table 10: Incremental Retailer Profits from Personalization Full History Based Targeting
$ Profits from
Ketchup Profits Profits from
Personalization Service
Total Retailer Profits
No firm targets
0 0 0
Hunt’s only targets
1111 48 1159
Heinz only targets
110 1596 1706
Both firms target
1291 1655 2946
Table 11: Profits with Alternative Retailer Markup Strategies
Retailer charges optimal markup Heinz Hunt’s Retailer
Profits with no targeting ($) 80,947 4,915 364,630
% profit increase from targeting by both firms (full history)
1.96% 1.24% 0.35%
Retailer charges constant markup (25%)
Heinz Hunt’s Retailer
Profits with no targeting ($)
122,059 4,544 300,973
% profit increase from targeting by both firms (full history)
10.91% 1.50% 3.10%

1
Appendix
A. The Pricing Equations
Retailer
From (4), the retailer’s optimization problem is as follows.
1 , , 1 1 1max ( ) ( )
t
xy xyJtt
NJ Kxy xy xy k k xy xyRt jt jt ijt jt ijt
r r j i kr w f S r D
… = = =
Π = − −∑∑ ∑ (A1)
For the purposes of the derivation, we drop the superscripts x and y indicating whether a
manufacturer bought targeting services and the subscript t that indexes time-period for clarity.
These can be included appropriately into the final wholesale and retail margins. Hence the
retailer objective is:
1 , , 1 1 1max ( ) ( )
J
J N Kk k
R j j ij j ijr r j i k
r w f S r D… = = =
Π = − −∑∑ ∑
Taking the derivative of the objective function with respect to the retail prices, the following
first order condition for each product j is:
1 1 1
( )( ) ( ) 0
N J Kij m ij k
j j ij m iji m kj
S r Dr w f S r D
r= = =
∂ −− + − = ∂
∑ ∑ ∑ (A2)
where wj is the wholesale price charged by manufacturer to the retailer for brand j.
Define iRΘ as the the first derivatives of all the (individual consumers’) shares with respect
to all retail prices (retail prices are common across consumers), with element (j,m) = ( )im m
j
S rr
∂∂
.
The retailer first order conditions can then be written in matrix form as:
( )1
0N
i iR
iR W S
=
Θ − + = ∑
where R is the vector of retail prices and W is the vector of wholesale prices (which are common
across all consumers) and iS is the vector of shares for each consumer ‘i’ over all the brands:
1 1 1
1 1 1
, ,
i
i
iJ J JJx Jx Jx
r w SR W S
r w S
≡ ≡ ≡
M M M
The vector of retail margins ( R W− ) is obtained by inverting the above matrix equation:

2
1
1 1
*
Retail Margin
N N
iR ii i
R W S−
= =
− = − Θ
∑ ∑
144424443
(A3)
where the shares are:
11
1
1 1
i
Kk k
ikK
k ki
k Kk k
iJk Jx
f S
S f S
f S
=
=
=
≡ ≡
∑∑
∑
M
and the individual specific share derivative matrix with respect to retailer prices is:
( )
( )
1 2
1 1 1
1 2
1 1 1 2 11 1 1
1 21 1
1
1
i i iJ
iR
i i iJ
J J J JxJ
K K Kk k k k k k k k k
i i i i i iJk k k
K Kk k k k k k k k k
iJ i iJ i iJ iJk k
S S Sp p p
S S Sp p p
f S S f S S f S S
f S S f S S f S S
α α α
α α α
= = =
= =
∂ ∂ ∂ ∂ ∂ ∂ Θ = ∂ ∂ ∂ ∂ ∂ ∂
− − −
=
− − −
∑ ∑ ∑
∑ ∑
L
M M O M
L
L
M M O M
L1
K
k JxJ=
∑
(A4)
Therefore the retail price is given by 1
1 1*
N N
iR ii i
R W S−
= =
= − Θ
∑ ∑ (A5)
Manufacturer
A manufacturer ‘m’ offering a subset mℵ of brands in the market sets the wholesale
price xyjtw (where mj∈ℵ ) and the coupon face values to individual households ( xy
ijtD ) so as to
maximize the manufacturer’s profits. A manufacturer who has not been sold the personalization
service will have coupon face values set to zero. The manufacturer takes into account the
knowledge that retailer prices ( xyjtr ) will be set taking into account the wholesale prices and the
coupon face values that have been issued to individual households.

3
1( ) ( ( , ) )
t
m
Nxy xy xy xy xy xy xymt jt ijt jt ijt jt jt ijt ijt
j iw D c S r w D D
∈ℵ =
Π = − − −∑ ∑ (A6)
where cjt is the marginal cost of the manufacturer for brand j in period t, and
( ( , ) )xy xy xy xy xyijt jt jt ijt ijtS r w D D− is the probability of household i, buying brand j in period t given the
decisions of manufacturers 1 (denoted by x) and 2 (denoted by y) to purchase the purchase
history data. We present the first order conditions for the manufacturer dropping the x, y
superscripts and the ‘t’ subscript and writing retail price as jr (not as ),( ijjj Dwr ) for clarity.
We write ijjij Dww −= since the manufacturer sets both the wholesale price and the
individual coupon face values to maximize profit. As discussed earlier, even though the
manufacturer sets the wholesale price and Catalina sets the coupon face value, analytically it
does not matter whether we make this distinction. The first order condition with respect to ijw is:
( ) 0)()(
*1
=
−+−
−∑ ∑= ℵ∈
N
i jijjij
ij
ijjijjij
m
DrSdw
DrdScw (A7)
Define iWΘ for each individual consumer such that it contains the first derivatives of all
the (individual consumers’) shares with respect to all wholesale prices (wholesale prices are
common across consumers), with element (j,m) = ij
immim
wDrS
∂−∂ )(
. To account for the set of
brands owned by the same manufacturer, define the manufacturer’s ownership matrix WO such
that element (j,m) is equal to one if the manufacturer who sells brand j also sells brand m, and
zero otherwise. The manufacturer’s first order condition can then be written in matrix form as:
( )( )[ ] 01
=+−Θ•∑=
N
i
ii
iWW SCWO (A8)
where ( )• iW WO Θ is the element by element multiplication of the two matrices, iW is the vector
of wholesale prices less the individual coupon values, C is the vector of marginal costs of the
manufacturer (C is common across all consumers), and iS is the vector of shares for each
consumer i :

4
1
1
1
1
1
11
,,
JXiJ
i
i
JXJJXiJJ
i
i
S
SS
c
cC
Dw
DwW
=
=
−
−= MMM
From the manufacturer first order conditions, we can write the manufacturer margin from
a particular household i ( )iW C− as follows:
( ) ( ) ( )1*i i
i W WW C O S−
− = •Θ − (A9)
The share derivatives with respect to wholesale matrix iWΘ need to be calculated. As
mentioned earlier, the manufacturer response matrix has the elements (j,m) = ( )im m im
ij
S r Dw
∂ −
∂.
Define the matrix of derivatives of all retail prices to all wholesale prices (for consumer ‘i’)
as irw∆ , with the element x
j
dr (W)j,x)
dw( = . Then i
WΘ can be re-written as:
i i iW rw RΘ = ∆ Θ (A10)
In the Manufacturer Stackelberg game, manufacturers anticipate how the retailer will
respond to changes in wholesale prices and use these reactions when setting wholesale prices.
We can solve for the retail reactions x
j
dr (W)dw
by taking the total derivative of the retailer’s first
order condition with respect to the retail price jr and the wholesale price jw :
JxJJ
iJ
J
i
J
i
iJ
ii
JxJJ
JJJ
JiW
rS
rS
rS
rS
rS
rS
dwdr
dwdr
dwdr
dwdr
dwdr
dwdr
*Ψ
∂∂
∂∂
∂∂
∂∂
∂∂
∂∂
=
L
MOMM
L
L
MOMM
L
21
11
2
1
1
21
1
2
1
1
1
where
( ) ( )
( ) ( )JxJ
J
m J
im
mmJ
iJ
J
m J
im
mm
iJ
J
i
J
m J
im
mmJ
iiJ
J
m
im
mm
i
iW
rS
-wrrS
rrS
-wrrS
rS
rrS
-wrrS
rS
rS
-wrrS
Ψ
∂∂
+∂∂
∂∂∂
+∂∂
+∂∂
∂∂∂
+∂∂
+∂∂
∂∂
+∂∂
=
∑∑
∑∑
==
==
12
2
1 1
2
1
1
1 1
21
112
1
2
1
1
2
2
L
MOM
L
(A11)

5
The second derivatives are obtained for these relationships of a,b,c (where there is an
equality sign, the index a will be preferred to c or b if a is in the equality, and b will be preferred
to c if b is in the equality). :
( ) ( )
( )( )( ) bca1S*2*S*S*α
cba1S*2*S*S*αbca1S*2*S*S*αbcaS*S*S*α*2
bcaS*21*S1*S*α
rrS
ib
ib
ia
2
ia
ic
ia
2
ia
ib
ia
2
ic
ib
ia
2
ia
ia
ia
2
bc
ia
2
=≠−≠=−≠=−≠≠==−−
=∂∂
∂ (A12)
Writing the total derivative of the retailer’s first order condition in matrix form:
( )*Ti i i
W rW RΨ ∆ = Θ
where ( )TirW∆ is the transpose of the matrix i
rW∆ . Therefore irW∆ is obtained as:
( ) 1*
Ti i irW W R
− ∆ = Ψ Θ (A13)
The wholesale price to the retailer is given by maxj iji
w w= and the individual specific
discount is given by ij jt ijD w w= − .
B. Endogeneity Correction
We correct for price endogeneity using the control function approach developed in Petrin
and Train (2004). The ‘control function’ approach (Hausman 1978) uses extra variables to
control for the part of the unobserved component of demand that is correlated with price. In
principle, the control functions are constructed using as arguments the differences between
observed prices and the predicted prices which are arrived at using all the relevant demand and
supply variables observed by the econometrician.
Consider the utility equation:
ijtjtjtijtijt rXu εξαβ ++−= (B1)
and rewrite it incorporating the control function as:
( ) ( )( ) ijtjtjtjtjtijtijt ffrXu εωµξωµαβ +−++−= ;; (B2)

6
where ( )ωµ ;jtf is the function that controls for the correlation of the unobserved
component jtξ with the price jtr , jtµ are control variables used in such a correction, and ω are
the coefficients for jtµ . Let the redefined unobserved component be ( )( )ωµξη ;jtjtjt f−= . If the
function ( )ωµ ;jtf could be constructed and added to the utility function, it is clear from
equation (B2) that the resulting random component ijtjt εη + would no longer be correlated
with price (by construction), and the estimates obtained would be corrected for price
endogeneity. Petrin and Train (2004) show that (under a wide range of conditions) the control
function ( )ωµ ;jtf is linear in the price residuals of a regression of price on its primitives. In our
context, we estimate a regression of prices against factor costs as follows:
jttj Br µςκ ++= *
where tΒ are the factor prices, jκ are brand specific intercepts and jtµ are the residuals from this
regression. Thus ( ) jtjtf ωµωµ =; , and we write equation (B2) as :
ijtjtjtjtijtijt rXu εηωµαβ +++−= (B3)
This utility equation (B3) is used in estimating the latent class model rather than equation (1) of
the text to perform the endogeneity correction. Different specifications can be used for ω (Petrin
and Train 2004 pages 25-26), and we present the results where ω is segment-specific, i.e.,
[ ]Kkk 1=ω .